Article

Predicting Current and Future Potential Distributions of Parthenium hysterophorus in Bangladesh Using Maximum Entropy Ecological Niche Modelling

by
Sheikh Muhammad Masum
1,
Abdul Halim
2,
Mohammad Shamim Hasan Mandal
3,*,
Md Asaduzzaman
4 and
Steve Adkins
5
1
Department of Agronomy, Sher-e-Bangla Agricultural University, Dhaka 1207, Bangladesh
2
Department of Agroforestry and Environmental Science, Sher-e-Bangla Agricultural University, Dhaka 1207, Bangladesh
3
Graduate School of Advanced Science and Engineering, Hiroshima University, 1-5-1 Kagamiyama, Hiroshima 739-8529, Japan
4
NSW Department of Primary Industries, Wagga Wagga, NSW 2650, Australia
5
School of Agriculture and Food Sciences, The University of Queensland, Gatton, QLD 4343, Australia
*
Author to whom correspondence should be addressed.
Agronomy 2022, 12(7), 1592; https://doi.org/10.3390/agronomy12071592
Submission received: 3 April 2022 / Revised: 24 June 2022 / Accepted: 27 June 2022 / Published: 30 June 2022
(This article belongs to the Special Issue Pests, Pesticides and Food Safety in a Changing Climate)

Abstract

:
Parthenium weed (Parthenium hysterophorus L.) is among the most noxious invasive alien plant species, which can pose a threat to agro- and native-ecosystems. Despite potential parthenium infestation risks at the south-western regions of the Ganges–Brahmaputra floodplains of Bangladesh, no studies exist that document parthenium infestation. Using field surveys and a maximum entropy (Maxent) modelling approach, the present study tries to address the problem in the concerned region comprised of five Districts: Jashore, Jhenaidah, Chuadanga, Meherpur, and Khustia. The results revealed high infestation in the Jashore, Jhenaidah, and Chuadanga Districts, mainly along roadsides, in grasslands, and in fallow and cropped fields. The greatest abundance of the weed (ca. 30 plants m−2) occurred at the Indian border area, suggesting cross-border spreading, possibly through the linking road systems. Furthermore, we found that under both low and high emissions scenarios (Representative Concentration Pathways 2.6 and 8.5), parthenium weed suitability areas were likely to expand, suggesting an increased threat to the agro-ecosystems of Bangladesh. The present study is the first attempt to survey and model potential parthenium weed distribution affecting one of the major hubs of agricultural production in Bangladesh. The findings of this study can help land managers to make judicious decisions towards the future management of these agro-ecosystems.

1. Introduction

Parthenium weed (Parthenium hysterophorus L. Asteraceae) is a prolific invasive alien plant species (IAPS), native to the tropical and subtropical Americas but now accidentally spread to over 50 countries globally [1,2,3]. After introduction, parthenium weed expands its local range rapidly and creates mono-specific thickets that threaten the productivity of cropping and rangelands and the biodiversity of natural-ecosystems. For example, a major introduction of the weed into India occurred in the 1950s, and within a just a few years it had spread to almost all states of the country [4]. By 1975, it was estimated that the weed had infested over a million ha of land and by 2010 this figure had risen to over 35 million ha [5]. Parthenium weed can adapt to a variety of habitats [6], thus, it is recognized as one of the leading threats to biodiversity. The weed causes significant losses in crop and pasture production [1], causes livestock poisoning [7], and affects other human activities, as well as human health [3,8,9]. Moreover, weed management strategies involving the physical, cultural, chemical, or biological control of this weed may not be effective without a dedicated site-specific management strategy. Further, chemical control can be effective but costly. It can also be a source of environmental hazards and cause herbicide resistance if not applied judiciously [1].
In agro-ecosystems, parthenium weed is highly competitive with crop and pasture plants for soil moisture and nutrients [10]. It has been reported that the weed has a very heavy nitrogen-exploitation capacity and can limit nitrogen availability for rice (Oryza sativa L.) growth [10]. The presence of parthenium weed in cropped land can almost double the cultivation costs and restrict the sale and movement of contaminated produce [11]. Parthenium weed can infest many major crops, including wheat (Triticum aestivum L.); maize (Zea mays L.); sorghum (Sorghum bicolor (L.) Moench); sunflower (Helianthus annuus L.); rice and sugarcane (Saccharum officinarum L.) in different countries [12]. For example, in India, yield reductions in rice (by 40%); tomato (Solanum lycopersicum L., by 63%); sorghum (by 40 to 90%); and fodder (up to 90%) have been reported [5,13]. Besides, the allelochemicals that are produced by parthenium weed, mainly parthenin, are known to inhibit the germination, growth, and grain fill of adjacent crops and other plant species [14]. Moreover, the weed can quickly colonize disturbed land, including overgrazed or cleared areas where competition is less, and thus quickly establish dominance over pastures and crop fields.
The weed is physiologically adaptable and therefore tolerant to a wide range of environmental conditions. Such tolerances include temperature and soil moisture extremes and increasing atmospheric CO2 concentrations [15]. Therefore, parthenium weed has become a more vigorous and prolific plant under a changing climate [3] with an altered canopy architecture that may be associated with higher competitiveness [15]. Moreover, changes in temperature, rainfall, and atmospheric CO2 are critical climatic factors that impact plant invasiveness, which is likely to change the distribution of plants [16]. Thus, to understand the overall dominance and spread of a species, systematic field surveys are necessary to obtain vital parameters, e.g., the density, frequency, and abundance of a particular species. Species occurrence frequency, abundance, and severity are important measurements to understand an invasive species dominance in a community [17]. On the other hand, information on habitat suitability under a changing climate can be vital for formulating weed management policies. This can be achieved through ecological niche models or species distribution models (SDMs), which are well suited for these purposes. The distribution of a species is often influenced by its surrounding environment, and SDMs help to understand how this occurs, as well as which environmental factors are critical for a particular species. Maximum entropy modelling (Maxent) is a popular SDM algorithm that requires presence-only data, and its predictions of distribution are reliable, even to a small scale [18,19]. The algorithm has been applied in a wide range of studies [20,21,22,23,24] and it provides sufficient protocols for its adoption in ecological forecasting studies [18,25,26].
Bangladesh is among a small group of high-risk countries when considering the possible impacts of future climate change scenarios, with significant changes expected in temperature and rainfall patterns [27]. Presently, parthenium weed is a weed of national significance, as it has infested Bangladesh [2]. Presumably the first infestations originated from nearby India, possibly from vehicles or from the transportation of goods and seed materials [28,29,30]. Parthenium weed has already been reported to be ‘invasive’ in several countrywide studies [2,31], and in Bangladesh, the south-western region is the worst infested area. Although a vast literature has reported parthenium weed to be an important weed in more than 40 countries, very little information has been reported on its impacts in Bangladesh. Particularly, no studies have been undertaken to reveal the present abundance and severity of this weed and its potential distribution under future climate scenarios.
Thus, the present study addresses the following questions: will future climate change further increase the suitable areas for parthenium weed growth? If this is the case, then the management and eradication policies should be formulated with consideration of these scenarios. Therefore, using field survey and maximum entropy modelling, the objectives were to (i) elucidate the extent of parthenium weed infestation in south-western Bangladesh by measuring its abundance and the severity of infestation; (ii) identify important environment factors that strongly correlate with the distribution pattern of parthenium weed; (iii) forecast the potential parthenium weed distribution under two projected climate change scenarios for the year 2070.

2. Materials and Methods

2.1. Location of Weed Survey

Field surveys were conducted in 27 upazilas (administrative regions) of the Jashore, Jhenaidah, Chuadanga, Meherpur, and Khustia Districts of Bangladesh from July 2019 to June 2020 (Figure 1). These areas, located in the Khulna Division of south-western Bangladesh, are commonly known as the Jashore hub. The Jashore hub includes the western part of the Ganges River floodplain that is predominantly high, and medium highland. Calcareous dark-grey floodplain soils and calcareous brown floodplain soils are the principal soil types and are somewhat alkaline in nature. The organic matter content in the dark-grey soils is high, but lower in the brown ridge soils. The whole area is relatively more arid than other areas of the country. This region is suitable for cereal and vegetable production, produces a variety of crops year-round, and plays a vital role in agricultural production in Bangladesh.

2.2. Procedure of Weed Survey

The survey was undertaken along the roadside verges at intervals of 500 m throughout the 27 upazilas of the south-western region of Bangladesh between August 2019 and March 2021. The crop fields, fallow lands, grazing areas, and riverbanks around the surveyed areas were also considered in the survey using the list quadrat method [32,33]. A photographic record was made while undertaking the field surveys at sites where parthenium weed infestations were significant (Figure 2). When parthenium weed was found at a density of at least one plant per 10 m2, the topographical integrates were listed using a hand-held GPS [17].

2.3. Determination of Relative Density and Abundance of Parthenium Weed

The weed density was determined by placing a quadrat (1 m2) at random onto the survey site and applying the list quadrat technique [33]. At each survey site, 10 quadrats were taken. Parthenium weed, along with other weed species, was counted inside each quadrat. The density, frequency, and abundance of parthenium weed plants were determined by the following formula and as described in many earlier studies [17,34,35].
Di = (∑Yi)/Sa
Fi = (∑Zi)/n
where Di = density of the species i; ∑Yi = number of individual plants of species i contained in a quadrat; Sa = surface area of the sampling unit; Fi = frequency of species i; ∑Zi= number of sampling unit with species i; n = number of quadrats sampled [35].
Ri = (∑Ni)/NW
Ai = Ni/Qw
where Ri = relative density of weed species I; ∑Ni = total number of weed species i; Nw = total number of all weed species; Ai = abundance of species i; Ni = total number of weed species i in all quadrats; Qw = total number of quadrats in which the weed occurred.

2.4. Environmental and Bioclimatic Data

For current climate data, we obtained 19 bioclimatic variables from the WorldClim 2.1 (www.worldclim.org; accessed on 10 November 2021) database (Table 1) [36]. To determine future climate change scenarios, we used two models from the Coupled Model Intercomparison Project phase 5 (CIMP5). They were: (i) the Met Office climate model (HAdGem2-ES) (HE, hereafter); (ii) the Model for Interdisciplinary Research on Climate Change (MIROC5) (MI, hereafter) for the year 2070. For each of these two models, we chose two Intergovernmental Panel on Climate Change (IPCC) scenarios: (i) the Representative Concentration Pathways (RCP): RCP2.6; (ii) RCP8.5. This selection corresponded to a strict mitigation scenario (RCP2.6) with low greenhouse gas (GHG) emissions and a very high GHG emissions scenario (RCP8.5) [37]. The spatial resolution of the dataset was 30 arc seconds (~0.8 km2 at the equator). Of the 19 bioclimatic variables that were available, due to data quality issues, we chose not to use four of these viz. mean temperature of wettest quarter (Bio8); mean temperature of driest quarter (Bio9); precipitation of warmest quarter (Bio18); and precipitation of coldest quarter (Bio19) [38,39]. We also obtained digital-elevation model data from the WorldClim website to calculate slope and aspect factors to use in our model. The description of the variables is given in Table 1.

2.5. Current and Future Projections of Parthenium

Maximum entropy ecological niche modelling [19] of parthenium weed distribution, under the current (1970–2000) and a future (2061–2080) climate was performed using the field-collected data. Since model performance can be affected by collinearity, out of 18 predictors variables, we only chose those that were poorly correlated based on a variance inflation factor (VIF) of greater than nine using the R package usdm [40]. Thus, for modelling, a total of 11 variables were used (viz. annual mean temperature (Bio1); temperature seasonality (Bio4); minimum temperature of coldest month (Bio6); temperature annual range (Bio7); mean temperature of warmest quarter (Bio10); precipitation of driest month (Bio14); precipitation of wettest quarter (Bio16); precipitation of driest quarter (Bio17); elevation (ALT); slope (SLP); and aspect (ASP).
Maxent models were performed using R version 4.0.5 [41] package ENMeval version 2.0.1 [42], which uses the maxnet.jar version 3.4.4 for automating model building [19]. The occurrence points that shared the same grid cell were removed before analysis. For collecting the background points, we selected only those areas within a 50 km zone around the occurrence points (Figure A1). To account for spatial autocorrelation, we used ‘checkerboard2′ blocking (k = 4) with an aggregation factor of (4 by 4) for model training and validation [42]. Spatial blocking was performed for both occurrence records (n = 42) and random background points (n = 4500, about 10% of total cells) (Figure A2). We ran a series of candidate Maxent models with eight regulation multipliers (viz. 0.5, 1.0, 1.5, 2.0, 2.5, 3.0, 3.5, 4.0) and with five feature class combinations: L, LQ, LQH, LQHP, LQHPT (L = linear; Q = quadratic; H = hinge; P = product; T = threshold) [38,43]. We selected the final model with the lowest average test-omission rate and the highest average validation AUC to break ties [44]. Using the estimated RM values and feature classes, we bootstrapped 10 replicated model runs with 25% points for testing and 5000 iterations for the optimization algorithm [26]. We chose the logistic output for the model predictions. Using the same settings, we ran separate models for current and future climatic datasets. To depict the suitable areas of parthenium weed invasion, we used Maxent logistic outputs. Finally, we calculated the potential distribution areas into three categories: (i) unsuitable (0–0.1); (ii) low (0.11–0.30); (iii) medium (0.31 to 0.70); and (iv) high (>0.70) probability areas [20].

3. Results

3.1. Location and Distribution of Parthenium Weed Infestation

Five districts within the south-western part of Bangladesh were surveyed. The distribution of parthenium weed in 27 upazilas of the five Districts indicated severe infestation of the weed (Figure 3; Table A1). High to very high infestations were found in 12 upazilas among the total of 27 upazilas, whereas medium infestation was found in eight upazilas. Only one species from the genus Parthenium (Parthenium hysterophorus) was found to affect major crops in the studied areas.

3.2. Density, Frequency, and Abundance of Parthenium Weed

The relative density (RD), frequency, and abundance of parthenium weed infestation in the south-western region of Bangladesh are shown in Table 2. The data show variation in the weed dynamics throughout the 27 upazilas. In the absolute weed-density resultant data, the utmost distribution of parthenium weed (33.5 m2) was confirmed at the Sarsha upazila, Jashore (Figure 4).

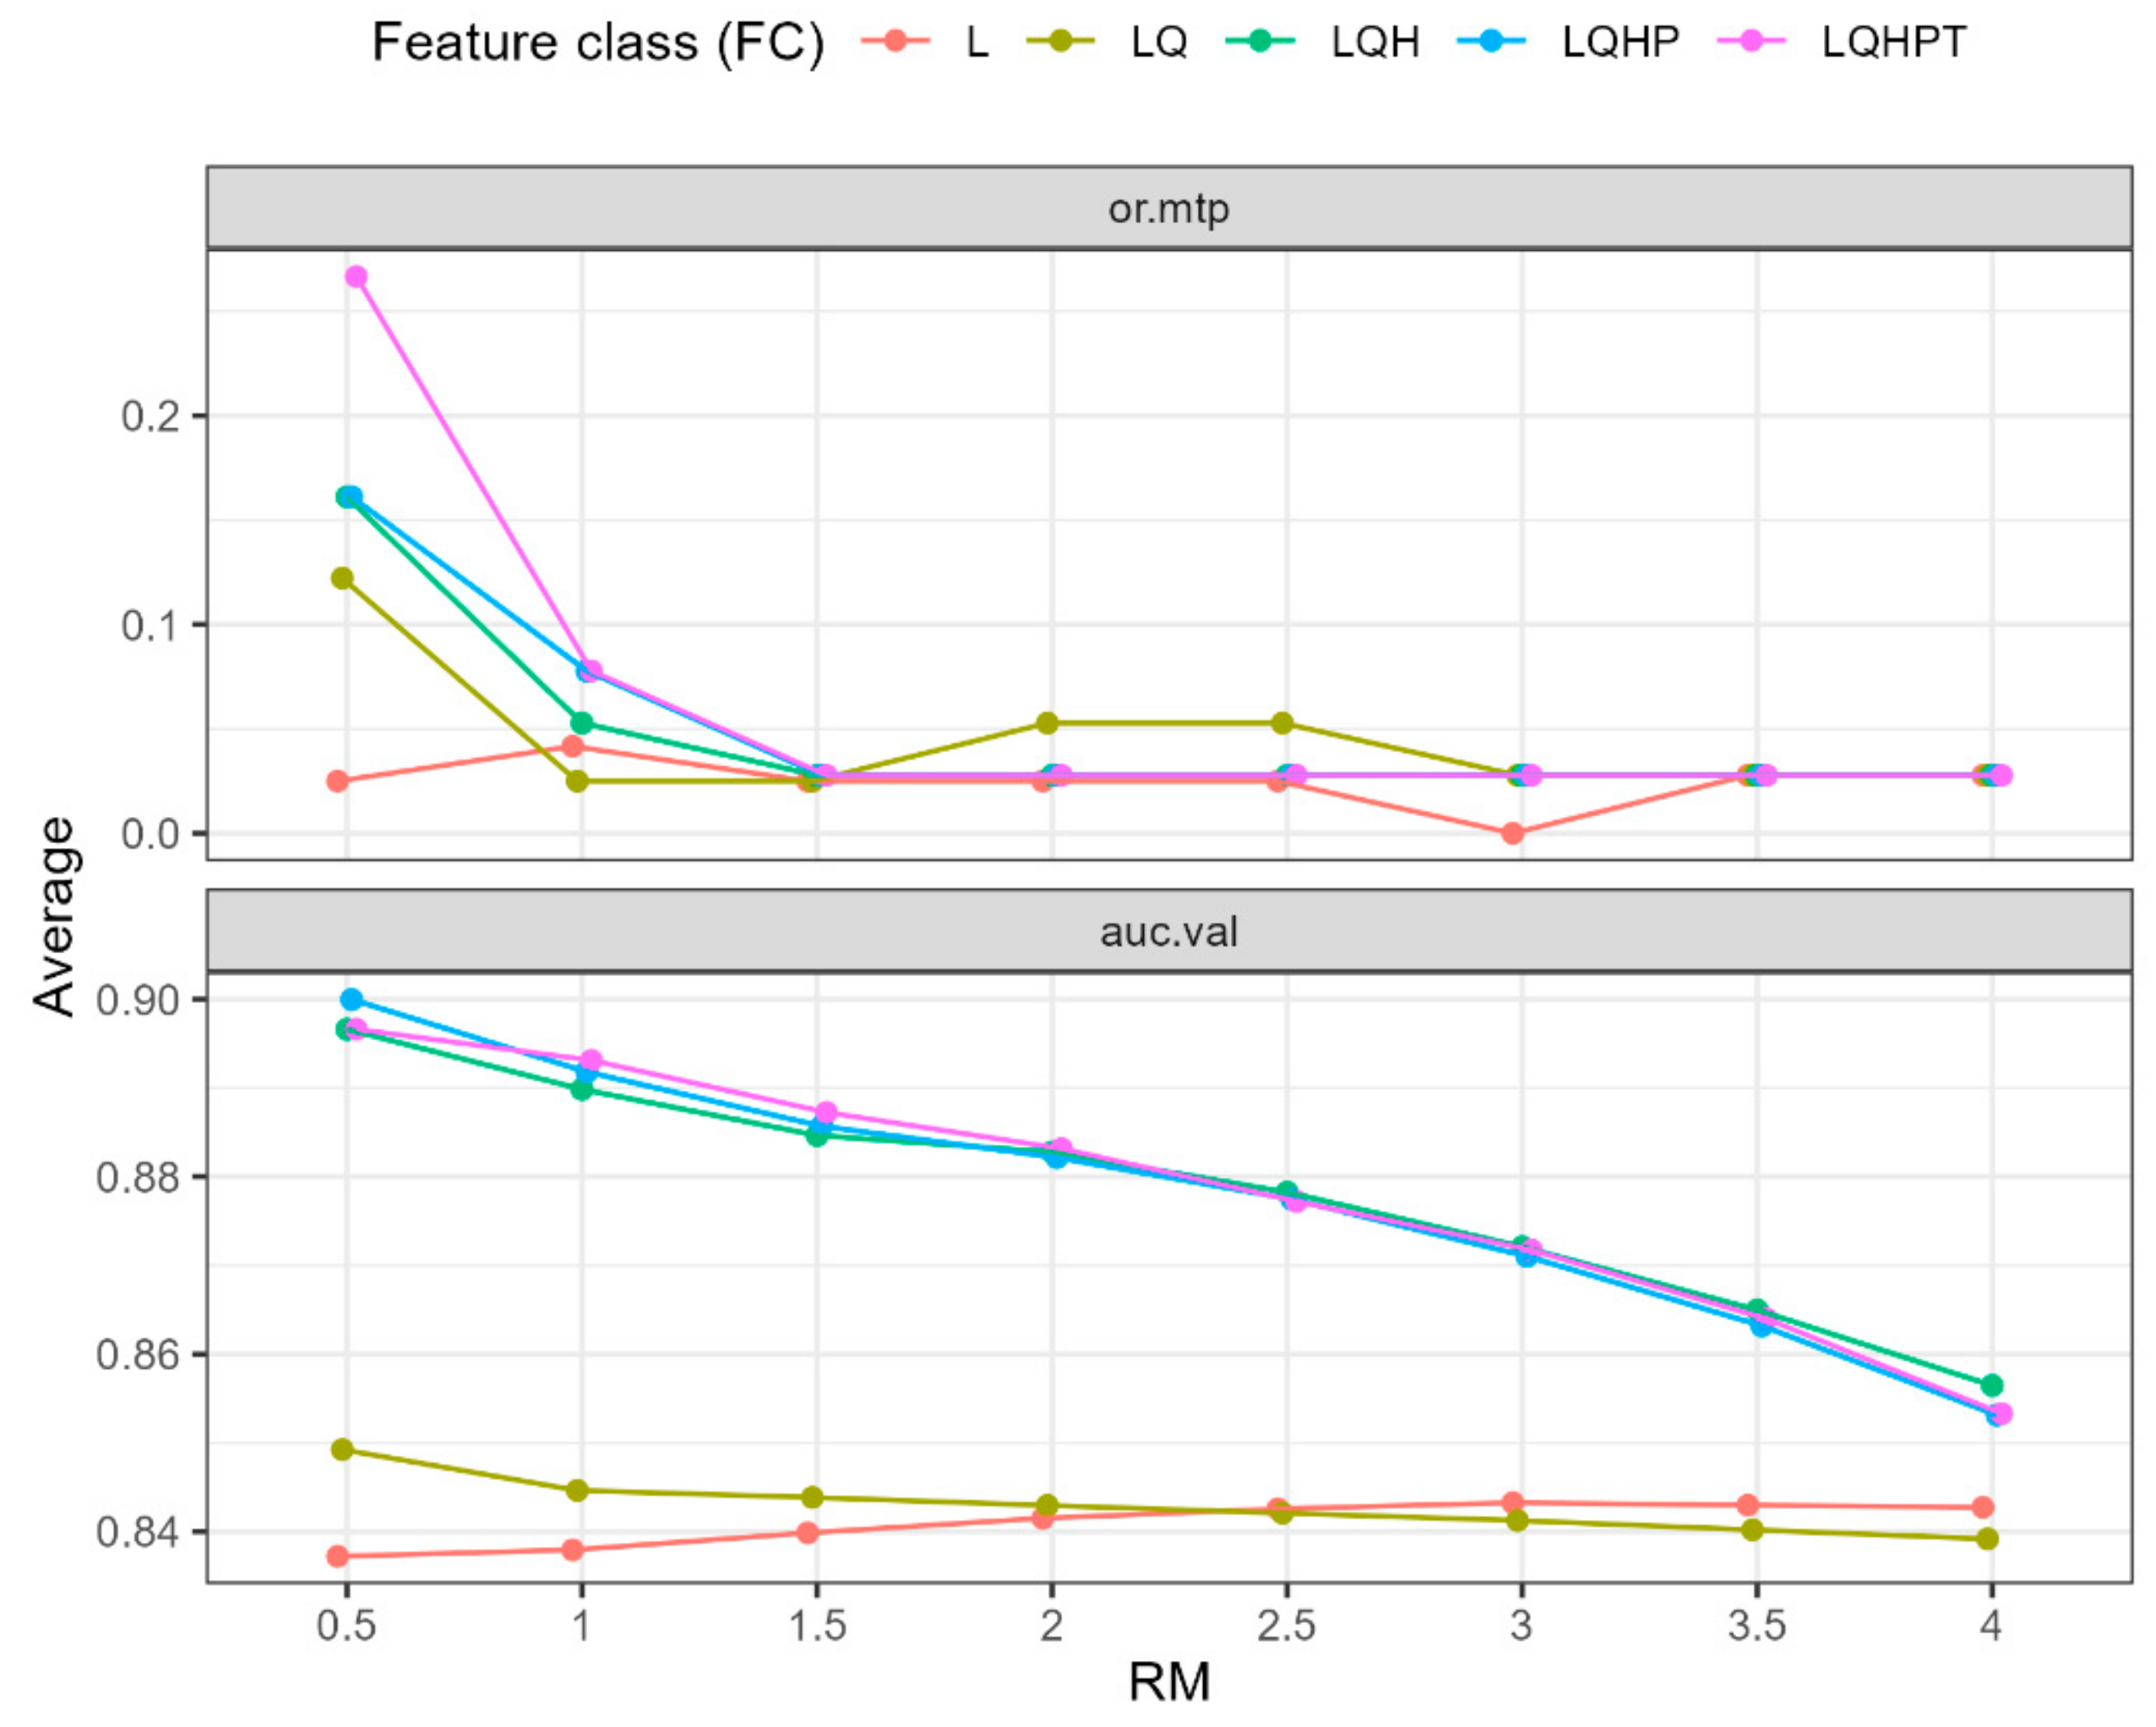
3.3. Maxent Model Validation

We run a total 40 models with different RM values and feature class combinations. Figure 5 shows the mean omission rates (OR) and the area under the curve (AUC) values for different RM values of the different models run. Only one model met our selection criteria of the lowest omission rates and the highest test AUC values (Radosavljevic & Anderson, 2014). That model, with a feature class combination of LQHP, had a regularization multiplier (RM) value of three (Table 3). The AUC from ROC was 0.90 which depicted a good model fit. Our bootstrapped model’s mean AUC value was 0.91; Figure A3 shows the ROC curves for the replicated models.

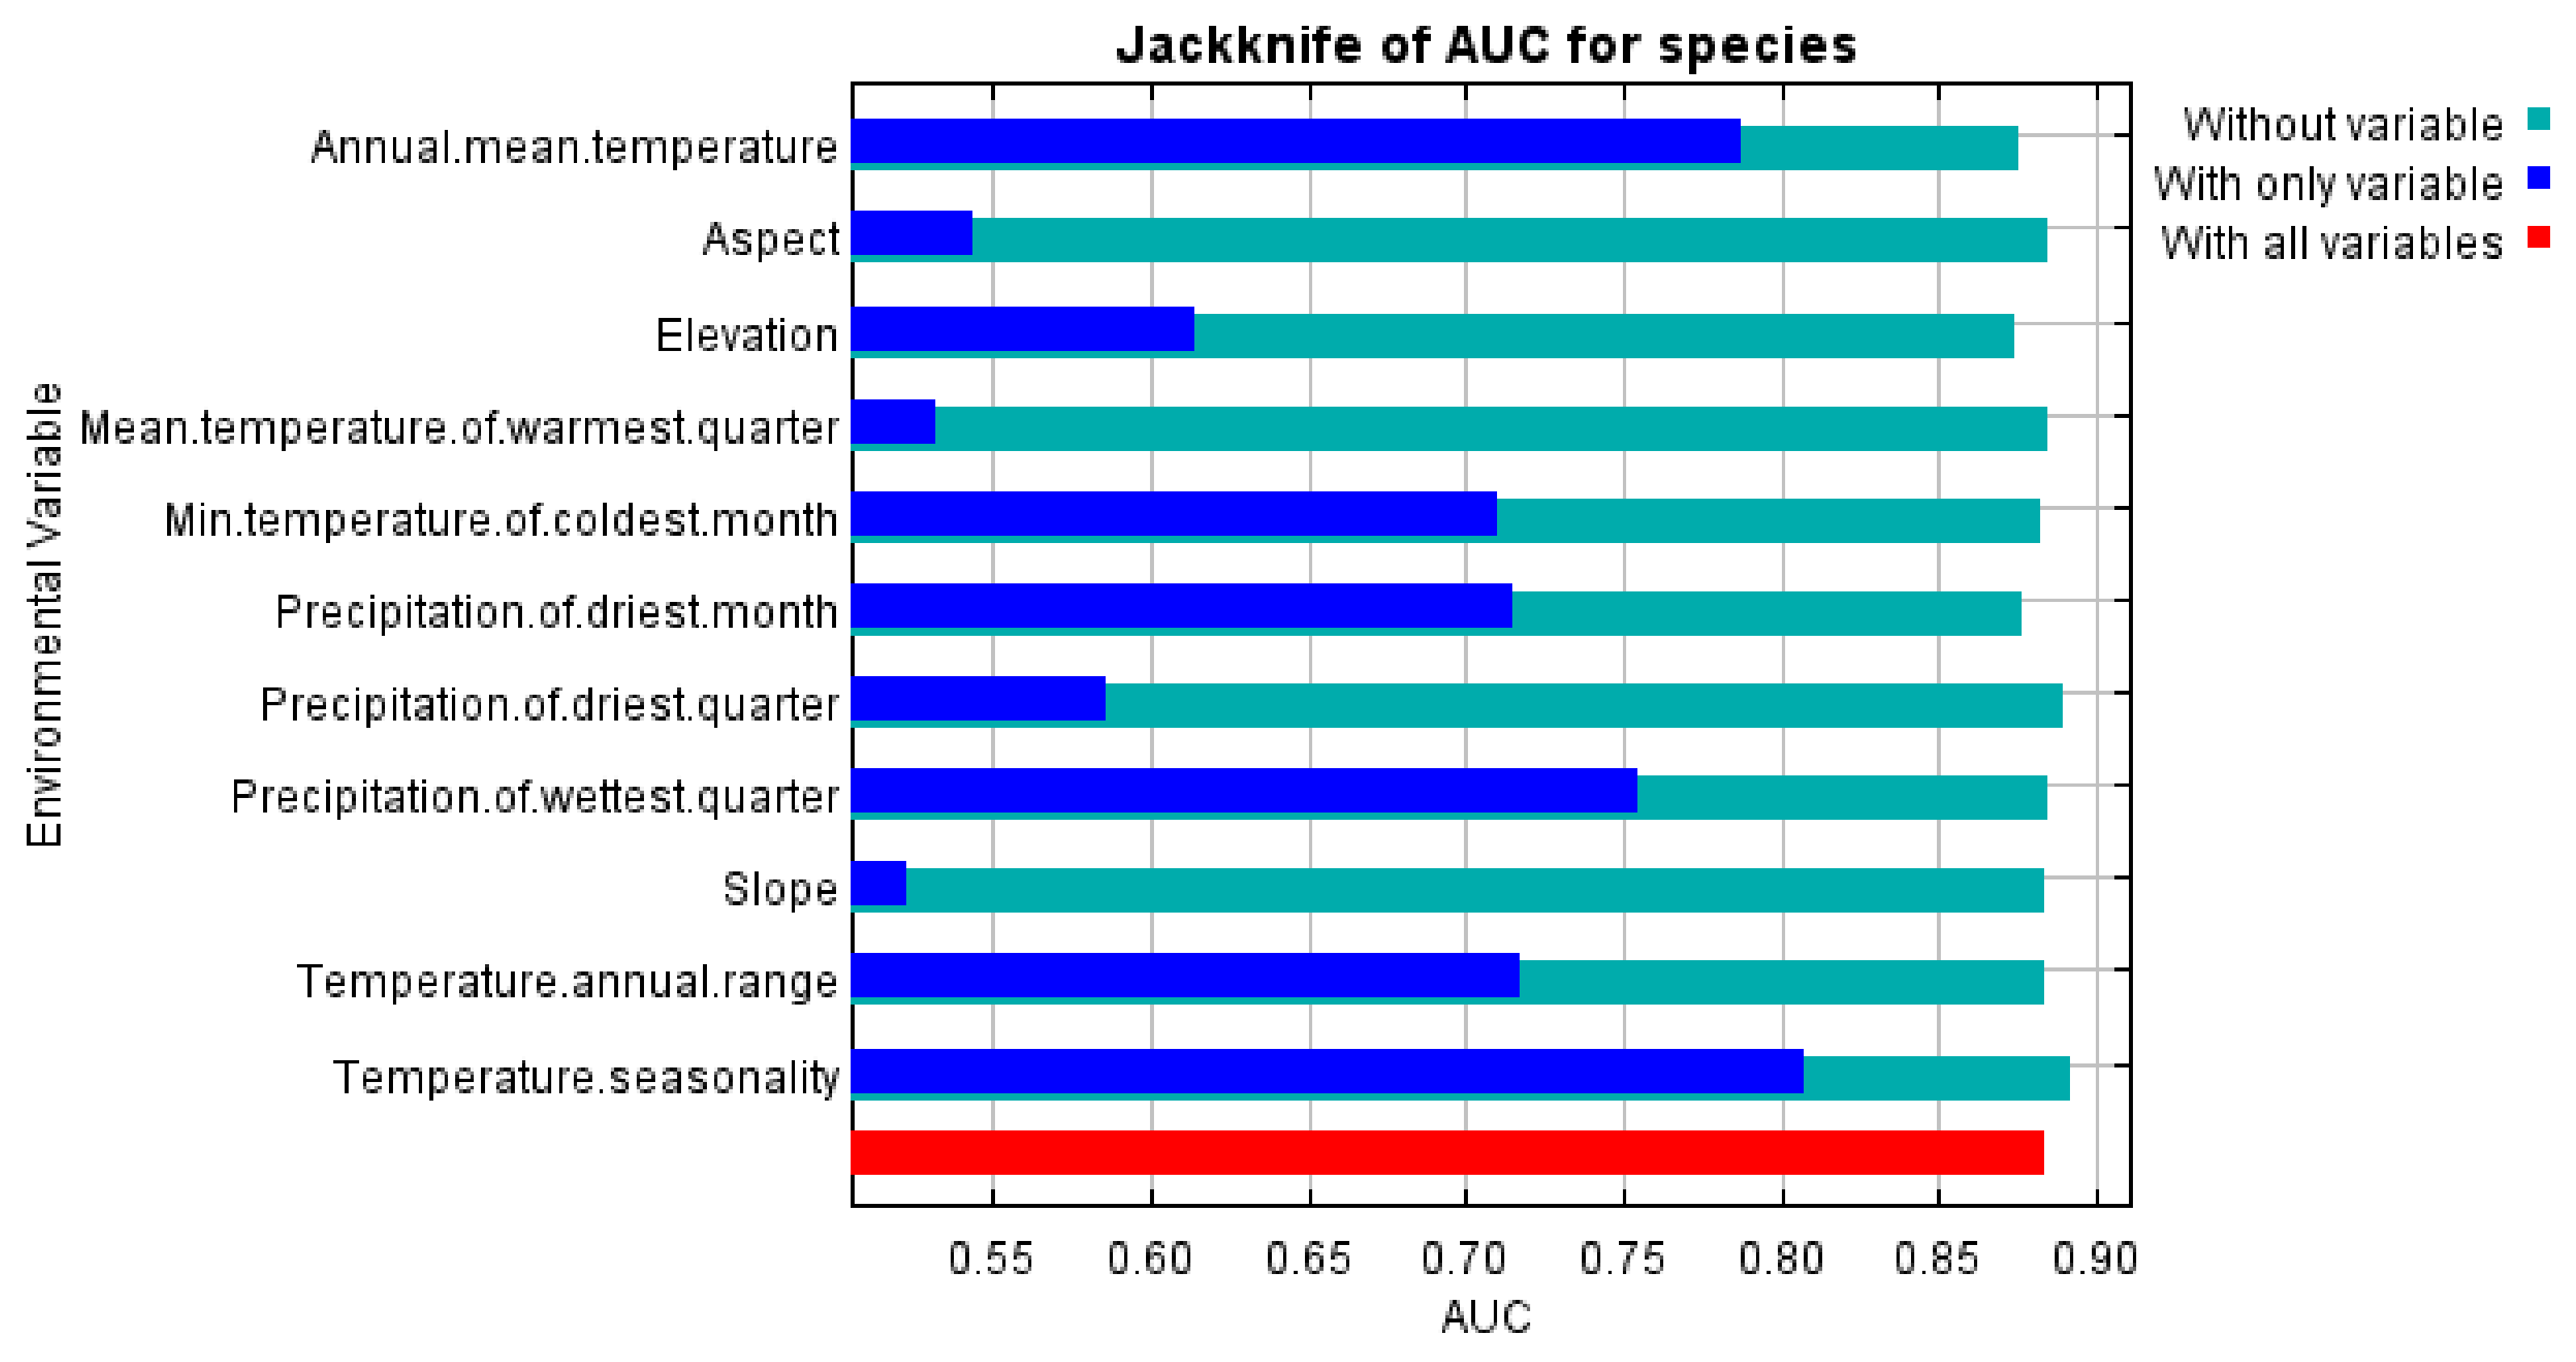
3.4. Variable Importance

Among the predictor variables, temperature seasonality (Bio15); annual mean temperature (Bio1); precipitation of driest month (Bio14); and precipitation of wettest quarter (Bio16) accounted for more than a 90% contribution to the model (Table 4). Percent contribution (PC) and permutation importance (PI) of temperature seasonality (Bio15) was 54.4% and 41.4%, thus, temperature seasonality (Bio15) was the most important variable for parthenium weed habitat suitability. A jackknife test of variable importance using AUC on test data also showed similar results (Figure A4).
Figure 6 shows the response curves of the four most significant environment variables. Considering the probabilities, the temperature seasonality (Bio15) annual range in temperature for parthenium weed was 10.7 to 12.6 °C, while higher temperature values reduced the weed’s suitability. The annual mean temperature (Bio1) ranged from 25.4 to 26.5 °C. From the annual mean temperature, it is evident that parthenium weed suitability increases up to 26.2 °C, after which the probabilities decrease. On the other hand, the range of precipitation of the driest month (Bio14) was 1.0 to 8.9 mm. Increasing precipitation in the driest months increases the suitability of the species. The range of precipitation of the wettest quarter (Bio16, three wettest months) was from 702.4 to 1003.3 mm. A negative relationship between parthenium weed probability and the precipitation of wettest quarter (Bio16) was observed—specifically, increasing the amount of precipitation from 850 mm reduces the suitability of parthenium weed.

3.5. Potential Habitat Suitability of Parthenium Weed under Current Climatic Conditions

Under the current climatic condition, based on the occurrence records, the potential habitat suitability maps are shown in Figure 7. Based on our model, out of a total 7952 km2 area in our study region, only about 455 km2 area was unsuitable (Table 5). About 1409 km2 was of low suitability, while about 5278 km2 was of medium suitability. The highest ecologically suitable areas (high, 0.71 to 1.0) were about 809 km2, which falls between the Jashore, Jhenaidah, and Chuadanga Districts. Khustia District had the lowest suitability areas among the five Districts. While the north upazilas of Jashore showed the highest suitability for parthenium weed, the south upazilas showed the lowest suitability for the weed.

3.6. Distribution of Suitable Habitats of Parthenium Weed under Future Climate Change Scenarios

The parthenium weed distribution model, run for future climate change scenarios, indicated that parthenium weed distributions will likely increase (Table 5; Figure 8). The projected climate map using the HAdGem2-ES model showed that, at both minimum and maximum emission scenarios (RCP 2.6 and RCP 8.5), unsuitable areas for parthenium weed will increase; however high suitability areas will also increase. On the other hand, model predictions using MIROC5 under the low emissions (RCP 2.6) scenario parthenium weed habitat suitability will increase in both medium and high suitability classes, while under the high emission (RCP 8.5) scenario, the high suitability areas mostly turned into medium suitability areas. All the predictions indicate that by 2070, parthenium weed distributions will likely increase, as our models show a gain in surface areas of medium to high suitability classes. However, interestingly, our forecasted models did not indicate that there would be much of a change in the patterns of parthenium weed distribution, and that parthenium weed infestation may remain clustered around these three Districts near the border areas.

4. Discussion

Invasive alien plant species are becoming major threats around the world and parthenium weed is one of the most significant ones. According to our field survey, the results indicate that parthenium weed has already become a major pest of the agro-ecosystems of south-western Bangladesh. Both water and wind are suspected to be the major vectors of parthenium weed-spread in arable agro-ecosystems, while vehicular and mechanized farming are responsible for long-distance dispersal [15]. Thus, the weed can potentially spread all over the country. In Bangladesh, this weed has taken a relatively short time to become invasive, with the first introduction only 20 years ago. This we assume because it is not listed in wildflowers of Bangladesh [45]. The phytosociological survey of this region showed a high frequency of parthenium weed in general; however, the relative density (RD) (%) of the weed in different sectors of this region ranged from 0.48 to 39.85%. Similar results were observed by McFadyen [46], surveying central Queensland, Australia, who reported that > 10% of the area was infested by the weed. A similar pattern of invasion was also noticed by Oudhia [13] in a phytosociological survey of weeds of the rainy season with special reference to parthenium weed in Raipur, India. He found that parthenium weed, sickle senna (Senna tora (L.) Roxb.), and chaff-flower (Achyranthes aspera L.) dominated the vegetation. It was noticed during the survey that the weed prefers to invade areas that have been recently disturbed and where the topsoil is removed. This, in turn, minimizes the competition from native species and enhances the chances of survival of the invading plants [6]. In our survey, we also noticed that the weed had aggressively colonized the crop fields, open lands, pastures, and wastelands of our study areas, indicating a severe infestation. Among our survey sites at Sarsha upazila, Jikargacha upazila of Jashore, and Damurhuda upazila of Chuadanga District, it was found that parthenium weed had a high degree of sociability, and these formed large stands under different habitats.
Further, to understand the suitability of parthenium infestation in our study area, we used the SDM approach. As we had occurrence points from the field surveys, we choose to employ a Maxent modelling approach [18,19]. We limited our model prediction to the surveyed areas to better understand the dynamics of the parthenium weed infestations. To choose the best model settings, we eliminated correlated predictors and minimized spatial autocorrelation through spatial blocking. Further, by using an iterative approach, we determined the model settings to avoid over-fitting [42,44,47,48]. It is often recommended to run model combinations with variable feature classes and RM values as the default settings of Maxent can sometimes provide overfitted results [18,48]. Further, species habitat suitability may not only depend on climatic and topographic variables, but also other important factors where the species is to be found. However, since our sole objective was to understand habitat suitability under the current and two potential future climatic conditions, we chose to use only these variables. In such forecasting studies, it is common to use bioclimatic variables with topographic variables [20,21,49]. Our results indicate that temperature seasonality is the most important climatic variable influencing parthenium weed distribution over our studied area, suggesting that the extreme annual temperature differences are likely to favor parthenium infestation in our study area. Other notable bioclimatic variables that were critical for parthenium weed suitability were annual mean temperature, precipitation during the driest month, and precipitation during the wettest quarter.
Our Maxent model prediction shows that the high suitability areas of parthenium weed are mostly concentrated in the Districts of Jashore, Jhenaidah, and Chuadanga. This may be because of a possible invasion through the neighboring Indian regions [2], as the Districts of Jashore and Chuadanga host two of the biggest land ports coming from India. Our model predictions largely fit with our field observations. Both of our future forecasted models showed a considerable increase in high suitability areas, while also increasing in unsuitable areas. Thus, extreme changes are known to be a characteristic response of invasive species [4,23]. In Bhutan, it has been reported that parthenium weed distribution is likely to increase when determined in various future climate change scenarios [21,50].
As the species is highly adaptable to variable climatic conditions [1,11], this can be a problematic weed for biodiversity in Bangladesh, particularly concerning agro-ecosystems. Parthenium weed has already been declared as a weed of national importance in many countries, including Australia, India, Sri Lanka, and South Africa. In Bangladesh, it is important to recognize the growing threat from this invasive weed, both among policy makers and farmers. The results that were obtained in this study can be used, for example, to identify potential suitable areas for the weed’s establishment, and then to raise awareness, and provide education and necessary training to the local farming communities to develop management strategies. Rice, wheat, and maize are the major crops of Bangladesh, and its economic success is very much dependent on the sustainable production of these crops. To attain the sustainable developmental goals of the country, we must ensure and formulate policies for crop production and protection. Further, any such efforts should address the likeliness of the increasing infestation of IAPS, such as parthenium weed.

5. Conclusions

We found that parthenium weed had severe infestations across our study area, which is one of the major hubs of agriculture in Bangladesh. Based on field surveys, we quantified its density and abundance and mapped its potential distribution in the south-western region of Bangladesh. High parthenium weed infestations were found in the Jashore, Jhenaidah, and Chuadanga Districts. We mapped its habitat suitability under the current and two future climate change scenarios for the year 2070. Our modelled result under the current climatic conditions also indicated the high suitability areas for the weed. Among the climatic variables, temperature seasonality was the most influential factor for parthenium distribution. Furthermore, our forecasted results showed that under both low and high emissions scenarios (RCP 2.6 and RCP 8.5), parthenium weed suitability areas were likely to increase in the south-western region of Bangladesh. From a food security perspective, this is alarming, as the area is one of the major hubs of agriculture. Thus, careful planning and long-term management policy should be formulated to reduce or mitigate this invasive species. The present study is the first attempt to survey and model potential parthenium weed distribution affecting one of the major hubs of agricultural production in Bangladesh. Thus, our study serves as the basis for such efforts to create further strategic program in combating this invasive weed. There is a need to create awareness of this on-going invasion among resource managers, policy makers and the public to ensure widespread vigilance to avert a regional catastrophe. There is a needs to spread awareness around the country of the weed’s harmful effect.

Author Contributions

Conceptualization, S.M.M., A.H., M.A., M.S.H.M. and S.A.; methodology, S.M.M. and M.S.H.M.; validation, S.M.M., M.A. and M.S.H.M.; formal analysis, S.M.M. and M.S.H.M.; investigation, S.M.M. and M.S.H.M.; data curation, S.M.M., M.A. and M.S.H.M.; writing—original draft preparation, S.M.M. and M.S.H.M.; writing—review and editing, S.M.M., A.H., M.A., M.S.H.M. and S.A.; visualization, S.M.M. and M.S.H.M.; supervision, S.M.M.; project administration, S.M.M.; funding acquisition, S.M.M. and M.A. All authors have read and agreed to the published version of the manuscript.

Funding

This research was funded by the Ministry of Science and Technology, Government of the People’s Republic of Bangladesh, grant number B.S.-36 (2019–2020).

Acknowledgments

The authors gratefully acknowledge the financial support of the Ministry of Science and Technology, Bangladesh to conduct this research.

Conflicts of Interest

The authors declare no conflict of interest.

Appendix A

Figure A1. Map showing buffered area (ca. 50 km; grey shaded area) around the occurrence points and merged to generate a buffer area generated using R package sf.
Agronomy 12 01592 g0a1
Figure A2. Spatial checkboard created using ENMeval package in R to separate occurrence points (left) and background points (right) into four blocks.
Agronomy 12 01592 g0a2
Table A1. Distribution of parthenium weed in 27 upazilas within five Districts of south-western Bangladesh.
DistrictsUpazilaDistribution of Parthenium Weed
Sporadic Low Medium High Very High
JashoreSarsha
Jikargacha
Chougacha
Sadar
Keshabpur
Manirampur
Abhaynagar
Bagherpara
JhenaidahSadar
Maheshpur
Kaliganj
Kotchandpur
Shailkupa
Harinakunda
ChuadangaAlamdanga
Sadar
Damurhuda
Jibannagar
MeherpurGangni
Sadar
Mujibnagar
KhustiaBheramara
Daulatpur
Khoksa
Kumarkhali
Sadar
Mirpur
Note: sporadic = 1 or more clusters within 100 m2; low = 1 to 2 plants in each m2; medium = 3 to 4 plants in each m2; high = 5 to 7 plants in each m2; and very high = more than 8 plants in each m2.
Figure A3. Receiver operating characteristic (ROC) curve for averages over the 10 bootstrapped model runs using final model settings.
Agronomy 12 01592 g0a3
Figure A4. Jackknife test of variable importance using AUC on test data.
Agronomy 12 01592 g0a4

References

  1. Adkins, S.; Shabbir, A. Biology, Ecology and Management of the Invasive Parthenium Weed (Parthenium hysterophorus L.). Pest Manag. Sci. 2014, 70, 1023–1029. [Google Scholar] [CrossRef] [PubMed]
  2. Masum, S.M.; Hasanuzzaman, M.; Ali, M.H. Threats of Parthenium hysterophorus on Agro-Ecosystems and Its Management: A Review. Int. J. Agric. Crop Sci. 2013, 6, 684. [Google Scholar]
  3. Mao, R.; Shabbir, A.; Adkins, S. Parthenium hysterophorus: A Tale of Global Invasion over Two Centuries, Spread and Prevention Measures. J. Environ. Manag. 2021, 279, 111751. [Google Scholar] [CrossRef]
  4. Kohli, R.K.; Batish, D.R.; Singh, H.P.; Dogra, K.S. Status, Invasiveness and Environmental Threats of Three Tropical American Invasive Weeds (Parthenium hysterophorus L., Ageratum conyzoides L., Lantana camara L.) in India. Biol. Invasions 2006, 8, 1501–1510. [Google Scholar] [CrossRef]
  5. Kumar, S. Current Spread, Impact and Management of Parthenium Weed in India. Int. Parthenium News 2012, 5. [Google Scholar]
  6. Annapurna, C.; Singh, J.S. Variation of Parthenium hysterophorus in Response to Soil Quality: Implications for Invasiveness. Weed Res. 2003, 43, 190–198. [Google Scholar] [CrossRef]
  7. Tefera, T. Allelopathic Effects of Parthenium hysterophorus Extracts on Seed Germination and Seedling Growth of Eragrostis Tef. J. Agron. Crop Sci. 2002, 188, 306–310. [Google Scholar] [CrossRef]
  8. Wiesner, M.; Tessema, T.; Hoffmann, A.; Wilfried, P.; Büttner, C.; Mewis, I.; Ulrichs, C. Impact of the Pan-Tropical Weed Parthenium hysterophorus L. on Human Health in Ethiopia; Institute of Horticultural Science, Urban Horticulture: Berlin, Germany, 2007. [Google Scholar]
  9. Lakshmi, C.; Srinivas, C.R. Seminar-Parthenium: A Wide Angle View. Indian J. Dermatol. Venereol. Leprol. 2007, 73, 296–306. [Google Scholar] [PubMed]
  10. Islam, A. Nitrogen Exploitation Capacity of Parthenium Weed and Its Inhibitory Effects on Growth and Development of Rice. M.S. Thesis, Department of Agronomy, Bangladesh Agricultural University, Mymensingh, Bangladesh, 2010. [Google Scholar]
  11. Adkins, S.W.; Sowerby, M.S. Allelopathic Potential of the Weed, Parthenium hysterophorus L., in Australia. Plant Prot. Q. 1996, 11, 20–23. [Google Scholar]
  12. Bajwa, A.A.; Chauhan, B.S.; Farooq, M.; Shabbir, A.; Adkins, S.W. What Do We Really Know about Alien Plant Invasion? A Review of the Invasion Mechanism of One of the World’s Worst Weeds. Planta 2016, 244, 39–57. [Google Scholar] [CrossRef]
  13. Oudhia, P. Medicinal Herbs and Insects of Chhattisgarh India. Insect Environ. 2000, 6, 138. [Google Scholar]
  14. Gnanavel, I. Parthenium hysterophorus L.: A Major Threat to Natural and Agro Eco-Systems in India. Sci. Int. 2013, 1, 124–131. [Google Scholar] [CrossRef] [Green Version]
  15. Navie, S.C.; McFadyen, R.E.; Panetta, F.D.; Adkins, S.W. The Effect of CO2 Enrichment on the Growth of a C3 Weed (Parthenium hysterophorus L.) and Its Competitive Interaction with a C4 Grass (Cenchrus ciliaris L.). Plant Prot. Q. 2005, 20, 61–66. [Google Scholar]
  16. Bradley, B.A.; Blumenthal, D.M.; Wilcove, D.S.; Ziska, L.H. Predicting Plant Invasions in an Era of Global Change. Trends Ecol. Evol. 2010, 25, 310–318. [Google Scholar] [CrossRef]
  17. Maszura, C.M.; Karim, S.M.R.; Norhafizah, M.Z.; Kayat, F.; Arifullah, M. Distribution, Density, and Abundance of Parthenium Weed (Parthenium hysterophorus L.) at Kuala Muda, Malaysia. Int. J. Agron. 2018, 2018, 1046214. [Google Scholar] [CrossRef] [Green Version]
  18. Elith, J.; Phillips, S.J.; Hastie, T.; Dudík, M.; Chee, Y.E.; Yates, C.J. A Statistical Explanation of MaxEnt for Ecologists. Divers. Distrib. 2011, 17, 43–57. [Google Scholar] [CrossRef]
  19. Phillips, S.J.; Dudik, M. Modeling of Species Distributions with Maxent: New Extensions and a Comprehensive Evaluation. Ecography 2008, 31, 161–175. [Google Scholar] [CrossRef]
  20. Abdelaal, M.; Fois, M.; Fenu, G.; Bacchetta, G. Using MaxEnt Modeling to Predict the Potential Distribution of the Endemic Plant Rosa Arabica Crép. in Egypt. Ecol. Inform. 2019, 50, 68–75. [Google Scholar] [CrossRef]
  21. Chhogyel, N.; Kumar, L.; Bajgai, Y. Invasion Status and Impacts of Parthenium Weed (Parthenium hysterophorus) in West-Central Region of Bhutan. Biol. Invasions 2021, 23, 2763–2779. [Google Scholar] [CrossRef]
  22. Fareen, A.G.E.; Mahmood, T.; Bodlah, I.; Rashid, A.; Khalid, A.; Mahmood, S. Modeling Potential Distribution of Newly Recorded Ant, Brachyponera Nigrita Using Maxent under Climate Change in Pothwar Region, Pakistan. PLoS ONE 2022, 17, e0262451. [Google Scholar]
  23. McConnachie, A.J.; Strathie, L.W.; Mersie, W.; Gebrehiwot, L.; Zewdie, K.; Abdurehim, A.; Abrha, B.; Araya, T.; Asaregew, F.; Assefa, F.; et al. Current and Potential Geographical Distribution of the Invasive Plant Parthenium hysterophorus (Asteraceae) in Eastern and Southern Africa. Weed Res. 2011, 51, 71–84. [Google Scholar] [CrossRef]
  24. Zhou, Y.; Zhang, Z.; Zhu, B.; Cheng, X.; Yang, L.; Gao, M.; Kong, R. Maxent Modeling Based on CMIP6 Models to Project Potential Suitable Zones for Cunninghamia Lanceolata in China. Forests 2021, 12, 752. [Google Scholar] [CrossRef]
  25. Merow, C.; Silander, J.A., Jr. A Comparison of Maxlike and Maxent for Modelling Species Distributions. Methods Ecol. Evol. 2014, 5, 215–225. [Google Scholar] [CrossRef]
  26. Phillips, S.J.; Anderson, R.P.; Dudik, M.; Schapire, R.E.; Blair, M.E. Opening the Black Box: An Open-Source Release of Maxent. Ecography 2017, 40, 887–893. [Google Scholar] [CrossRef]
  27. Rahman, M.; Lateh, H. Climate Change in Bangladesh: A Spatio-Temporal Analysis and Simulation of Recent Temperature and Rainfall Data Using GIS and Time Series Analysis Model. Theor. Appl. Climatol. 2017, 128, 27–41. [Google Scholar] [CrossRef]
  28. Akter, A.; Zuberi, M.I. Invasive Alien Species in Northern Bangladesh: Identification, Inventory and Impacts. Int. J. Biodivers. Conserv. 2009, 1, 129–134. [Google Scholar]
  29. Karim, S.M.R. Parthenium Agacha: Bangladesher Janno Maraktok Humki (Parthenium Weed: A Dangerous Threat for Bangladesh). Krishi Projukti Barta 2009, 3, 21–23. [Google Scholar]
  30. Adkins, S.; Parthenium Weed Poses Danger to Crops. Dhaka Mirror 2009. Available online: https://www.dhakamirror.com/environment/parthenium-weed-poses-danger-to-crops/#more-10210 (accessed on 1 December 2021).
  31. Karim, S.M.R.; Forzwa, R. Allelopathic effects of parthenium weed on the seed germination and seedling growth of field crops. In Proceedings of the Abstracts, Annual Botanical Conference 2009, Chattogram, Bangladesh, 9–10 January 2010; pp. 38–39. [Google Scholar]
  32. Khan, H.; Marwat, K.B.; Hassan, G.; Khan, M.A.; Hashim, S. Distribution of Parthenium Weed in Peshawar Valley, Khyber Pakhtunkhwa-Pakistan. Pak. J. Bot. 2014, 46, 81–90. [Google Scholar]
  33. Mahajan, M.; Fatima, S. Frequency, Abundance, and Density of Plant Species by List Count Quadrat Method. Int. J. Multidiscip. Res. 2017, 3, 1–8. [Google Scholar]
  34. Knox, J.; Jaggi, D.; Paul, M.S. Population Dynamics of Parthenium hysterophorus (Asteraceae) and Its Biological Suppression through Cassia Occidentalis (Caesalpiniaceae). Turk. J. Bot. 2011, 35, 111–119. [Google Scholar] [CrossRef]
  35. Nkoa, R.; Owen, M.D.K.; Swanton, C.J. Weed Abundance, Distribution, Diversity, and Community Analyses. Weed Sci. 2015, 63, 64–90. [Google Scholar] [CrossRef] [Green Version]
  36. Fick, S.E.; Hijmans, R.J. WorldClim 2: New 1-Km Spatial Resolution Climate Surfaces for Global Land Areas. Int. J. Climatol. 2017, 37, 4302–4315. [Google Scholar] [CrossRef]
  37. IPCC. IPCC Climate Change 2014: Synthesis Report. Contribution of Working Groups I, II and III to the Fifth Assessment Report of the Intergovernmental Panel on Climate Change; Core Writing Team, Pachauri, R.K., Meyer, L.A., Eds.; IPCC: Geneva, Switzerland, 2014; p. 151. [Google Scholar]
  38. Rodríguez-Medina, K.; Yañez-Arenas, C.; Peterson, A.T.; Ávila, J.E.; Herrera-Silveira, J. Evaluating the Capacity of Species Distribution Modeling to Predict the Geographic Distribution of the Mangrove Community in Mexico. PLoS ONE 2020, 15, e0237701. [Google Scholar] [CrossRef] [PubMed]
  39. Uzma, A.; Peterson, A.T.; Chaudhry, M.N.; Irfan, A.; Zafeer, S.; Ahmad, S.R.; Hassan, A. Ecological Niche Model Comparison under Different Climate Scenarios: A Case Study of Olea spp. in Asia. Ecosphere 2017, 8, e01825. [Google Scholar]
  40. Naimi, B.; Hamm, N.A.S.; Groen, T.A.; Skidmore, A.K.; Toxopeus, A.G. Where Is Positional Uncertainty a Problem for Species Distribution Modelling? Ecography 2014, 37, 191–203. [Google Scholar] [CrossRef]
  41. R Foundation for Statistical Computing. R Core Team R: A Language and Environment for Statistical Computing; R Foundation for Statistical Computing: Vienna, Austria, 2022. [Google Scholar]
  42. Kass, J.M.; Muscarella, R.; Galante, P.J.; Bohl, C.L.; Pinilla-Buitrago, G.E.; Boria, R.A.; Soley-Guardia, M.; Anderson, R.P. ENMeval 2.0: Redesigned for Customizable and Reproducible Modeling of Species’ Niches and Distributions. Methods Ecol. Evol. 2021, 12, 1602–1608. [Google Scholar] [CrossRef]
  43. Kass, J.M.; Anderson, R.P.; Espinosa-Lucas, A.; Juárez-Jaimes, V.; Martínez-Salas, E.; Botello, F.; Tavera, G.; Flores-Martínez, J.J.; Sánchez-Cordero, V. Biotic Predictors with Phenological Information Improve Range Estimates for Migrating Monarch Butterflies in Mexico. Ecography 2020, 43, 341–352. [Google Scholar] [CrossRef] [Green Version]
  44. Radosavljevic, A.; Anderson, R.P. Making Better Maxent Models of Species Distributions: Complexity, Overfitting and Evaluation. J. Biogeogr. 2014, 41, 629–643. [Google Scholar] [CrossRef]
  45. Ahmed, N. Wild Flowers of Bangladesh; The University Press Limited (UPL): Dhaka, Bangladesh, 1997. [Google Scholar]
  46. McFadyen, C.R. Biological Control against Parthenium Weed in Australia. Crop Prot. 1992, 11, 400–407. [Google Scholar] [CrossRef]
  47. Phillips, S.J.; Anderson, R.P.; Schapire, R.E. Maximum Entropy Modeling of Species Geographic Distributions. Ecol. Model. 2006, 190, 231–259. [Google Scholar] [CrossRef] [Green Version]
  48. Merow, C.; Smith, M.J.; Silander, J.A., Jr. A Practical Guide to MaxEnt for Modeling Species’ Distributions: What It Does, and Why Inputs and Settings Matter. Ecography 2013, 36, 1058–1069. [Google Scholar] [CrossRef]
  49. Purohit, S.; Rawat, N. MaxEnt Modeling to Predict the Current and Future Distribution of Clerodendrum Infortunatum L. under Climate Change Scenarios in Dehradun District, India. Modeling Earth Syst. Environ. 2021, 8, 2051–2063. [Google Scholar] [CrossRef]
  50. Thiney, U.; Banterng, P.; Gonkhamdee, S.; Katawatin, R. Distributions of Alien Invasive Weeds under Climate Change Scenarios in Mountainous Bhutan. Agronomy 2019, 9, 442. [Google Scholar] [CrossRef] [Green Version]
Figure 1. Map showing the Bangladeshi Districts where field surveys were conducted. The red dots denote the occurrence points of parthenium weed.
Agronomy 12 01592 g001
Figure 2. Parthenium weed (P. hysterophorus) infestation in natural and agroecosystems of five Districts (viz. Jashore, Jhenaidah, Chuadanga, Meherpur, and Khustia) of the south-western region of Bangladesh; surveyed from July 2019 to June 2020.
Agronomy 12 01592 g002
Figure 3. Distribution class of the parthenium weed spread across Districts. Red line indicates the Bangladesh–India border, whereas the thick blue line indicates District boundaries. Distribution classes were: (i) sporadic = 1 or more clusters within 100 m2; (ii) low = 1 to 2 plants in each m2; (iii) medium = 3 to 4 plants in each m2; (iv) high = 5 to 7 plants in each m2; (v) very high = more than 8 plants in each m2. Country boundary layers source: GADM (https://gadm.org, accessed on 10 November 2021).
Agronomy 12 01592 g003
Figure 4. Relative density (left) and abundance (right) of parthenium plotted across all 27 upazilas of the five Districts of the south-western part of Bangladesh. Red line indicates the Bangladesh–India border, whereas thick blue line indicates District boundaries. Country boundary layers source: GADM (https://gadm.org, accessed on 10 November 2021).
Agronomy 12 01592 g004
Figure 5. Model performance in terms of minimum training presence omission rate values (or.mtp: top graph) and area under the curve (AUC: bottom graph). The x-axis represents regularization (RM) multiplier values.
Agronomy 12 01592 g005
Figure 6. Response curves of the four most important environment variables. The curves show how the predicted probability of presence changes as each environmental variable is altered, keeping all other environmental variables at their average sample value.
Agronomy 12 01592 g006
Figure 7. Map showing the potential current habitat suitability of parthenium weed under the current climatic condition. Thick black lines indicate District boundaries, while thin grey lines indicate upazila boundaries. The classes are: (i) unsuitable (0.0 to 0.1); (ii) low (0.11 to 0.30); (iii) medium (0.31 to 0.70); (iv) high (0.71 to 1.00). Country boundary layers source: GADM (https://gadm.org, accessed on 10 November 2021).
Agronomy 12 01592 g007
Figure 8. Map showing potential habitat suitability of parthenium weed in the year 2070 under two model HAdGem2-ES; (a) RCP 2.6 and (b) RCP 8.5; MIROC5, (c) RCP 2.6 and (d) RCP 8.5 scenarios. The classes are: (i) unsuitable (0.0 to 0.1); (ii) low (0.11 to 0.30); (iii) medium (0.31 to 0.70); (iv) high (0.71 to 1.00). Country boundary layers source: GADM (https://gadm.org, accessed on 10 November 2021).
Agronomy 12 01592 g008
Table 1. Bioclimatic and topographic variable names and description of the variables initially chosen for modelling.
SLCodeNameUnitSource
1Bio1Annual mean temperature°CWorldClim
2Bio2Mean diurnal range
(Mean of monthly (max temp–in temp))
°C
3Bio3Isothermality (Bio2/Bio7) (×100)
4Bio4Temperature seasonality
(Standard deviation × 100)
°C
5Bio5Max temperature of warmest month°C
6Bio6Min temperature of coldest month°C
7Bio7Temperature annual range (Bio5–Bio6)°C
8Bio8Mean temperature of wettest quarter°C
9Bio9Mean temperature of driest quarter°C
10Bio10Mean temperature of warmest quarter°C
11Bio11Mean temperature of coldest quarter°C
12Bio12Annual precipitationmm
13Bio13Precipitation of wettest monthmm
14Bio14Precipitation of driest monthmm
15Bio15Precipitation seasonality
(Coefficient of variation)
1
16Bio16Precipitation of wettest quartermm
17Bio17Precipitation of driest quartermm
18Bio18Precipitation of warmest quartermm
19Bio19Precipitation of coldest quartermm
20ALTElevationm
21SLOSlope%Derived from ALT
22ASPAspect°
Table 2. Total number of other species found per quadrats (OS); number of all species found per quadrat (AS); number of quadrats with parthenium weed (QP); frequency of parthenium weed distribution (F); parthenium weed abundance (A); relative density (R; %); and symbol for severity class (SC).
NoUpazilaDistrictOSASQPFARSC
1SarshaJashore75.994.780.829.733.51H
2Jhikargacha 60.262.580.825.428.68H
3Chougacha 61.467.480.820.023.74H
4Sadar 54.367.770.719.127.79H
5Keshabpur 59.664.960.68.818.17M
6Manirampur 41.542.730.34.02.81L
7Abhaynagar 65.567.030.35.02.24L
8Bagherpara 53.060.970.711.312.97M
9SadarJhenaidah50.365.480.818.927.09H
10Maheshpur 56.677.880.826.527.25H
11Kaliganj 44.947.540.46.55.47M
12Kotchandpur 6367.240.410.56.25M
13Shailkupa 41.542.730.34.02.81L
14Harinakunda 51.856.250.58.87.83M
15AlamdangaChuadanga65.567.030.35.02.24L
16Sadar 55.661.670.78.69.74M
17Damurhuda 53.867.470.719.429.82H
18Jibannagar 39.849.850.520.028.08H
19GangniMeherpur83.183.530.31.30.48T
20Sadar 41.553.270.716.726.99H
21Mujibnagar 46.46080.817.027.67H
22BheramaraKhustia49.26470.721.125.13H
23Daulatpur 65.567.030.35.02.24L
24Khoksa 49.26470.721.125.13H
25Kumarkhali 49.755.450.511.410.29M
26Sadar 3941.240.45.55.34M
27Mirpur 65.567.030.35.00.24T
For the field survey, 10 quadrats were used for each upazila. Symbol used for severity class percent coverage: T = trace/rare less than 1%; L = low/occasional plants between 1 and 5%; M = moderate/scattered plants between 5 and 25%; H = high/fairly dense between 25 and 100%; Adopted from the U.S. Department of the Interior (2001) and Cooksey and Sheley (2002).
Table 3. Final model settings that were chosen based on lowest omission rates and the highest test AUC values.
RMFeature
Combinations
AUC TrainCBI TrainOR.10pAICc∆AICcNumber of
Coefficients
3LQHP0.900.950.11821.3814.8811
Table 4. Table showing variance inflation factor (VIF), percent contribution (PC), and permutation importance (PI) of the variables used for the final model.
VariableVIFPCPI
Temperature seasonality (Bio15)3.6054.441.4
Annual mean temperature (Bio1)8.8413.919.4
Precipitation of driest month (Bio14)7.2211.318.1
Precipitation of wettest quarter (Bio16)4.1710.50.1
Temperature annual range (Bio7)3.802.82.9
Min temperature of coldest month (Bio6)7.482.24
Elevation (ALT)3.6129.9
Aspect (ASP)1.001.41.5
Slope (SLP)1.030.81.3
Precipitation of driest quarter (Bio17)5.340.61
Mean temperature of warmest quarter (Bio10)2.080.20.3
Table 5. Suitable areas (km2) of potential parthenium weed distribution under the current climatic conditions and projected climate change scenarios.
ClassProbability ClassCurrentHE2.6HE8.5MI2.6MI8.5
Unsuitable0.0–0.10455.82665.30786.90366.38473.87
(+209.47)(+331.08)(−89.44)(+18.04)
Low0.11–0.301409.051424.74863.00808.091412.19
(+15.69)(−546.05)(−600.97)(+3.14)
Medium0.31–0.705278.454982.685462.045893.545345.92
(−295.78)(+183.58)(+615.09)(+67.47)
High0.71–1.0809.66877.13837.90881.83717.86
(+67.47)(+28.24)(+72.18)(−91.79)
+ (plus) sign indicates increase; − (minus) indicates reduction from the current climate scenarios.
Publisher’s Note: MDPI stays neutral with regard to jurisdictional claims in published maps and institutional affiliations.

