Article

Better Drought Index between SPEI and SMDI and the Key Parameters in Denoting Drought Impacts on Spring Wheat Yields in Qinghai, China

1
Key Laboratory of Agricultural Soil and Water Engineering in Arid and Semiarid Areas, Ministry of Education, College of Water Resources and Architectural Engineering, Northwest Agriculture and Forestry University, Xianyang 712100, China
2
Academy of Plateau Science and Sustainability, Qinghai Normal University, Xining 810016, China
3
School of Environmental Sciences, University of Guelph, Guelph, ON N1G 2W1, Canada
4
Tashkent Institute of Irrigation and Agricultural Mechanization Engineers, National Research University, Qoriy Niyoziy 39, Tashkent 100000, Uzbekistan
5
Department of Civil Engineering, Capital University of Science and Technology (CUST), Islamabad 44000, Pakistan
*
Authors to whom correspondence should be addressed.
These authors contributed equally to this work.
Agronomy 2022, 12(7), 1552; https://doi.org/10.3390/agronomy12071552
Submission received: 3 May 2022 / Revised: 10 June 2022 / Accepted: 23 June 2022 / Published: 28 June 2022

Abstract

:
Drought has great negative impacts on crop growth and production. In order to select appropriate drought indices to quantify drought influences on crops to minimize the risk of drought-related crops as much as possible, climate and spring wheat yield-related data from eight sites in the Qinghai Province of China were collected for selecting better drought index between standardized precipitation evapotranspiration index (SPEI, denoting meteorological drought) and soil moisture deficit index (SMDI, denoting agricultural drought) as well as the key parameters (timescale and month) in denoting drought impacts on spring wheat yields. The spring wheat yields during 1961–2018 were simulated by the DSSAT–CERES–Wheat model. Pearson correlations were used to investigate the relationship between SPEI and SMDI and between spring wheat yields and drought indices at different timescales. The results showed that: (1) SMDI reflected more consistent dry/wet conditions than SPEI when the timescales changed and (2) There were one- and two-month lags in SMDI compared to SPEI (with the higher correlation coefficients values of 0.35–0.68) during May to August and (3) May (the jointing period of spring wheat) and the two-month timescale of SMDI0–10 (with the higher correlation coefficients values of 0.21–0.37) were key parameters denoting drought influences on spring wheat yield and (4) The correlations between the linear slopes of spring wheat yield reduction rate and linear slopes of SMDI0–10 in May at the studied eight sites were considerable between 1961–2018 (r = 0.85). This study provides helpful references for mitigating the drought risk of spring wheat.

1. Introduction

Ongoing climate change has exacerbated the occurrence of different forms of drought dramatically [1,2], which is the largest climate-related threat to global agricultural production, especially in areas where crops depend solely on precipitation [3]. When a drought occurs without adequate irrigation, the shortage of water supply for crops occurs, which may cause crop growth hindrance, and then results in reduced crop yields, threatening food security [4,5]. Among different crops, wheat feeds about one-fifth of the population in the world [6], but its growth and maintaining stable production are facing more risks from drought or other disasters [7]. Between 1980 and 2015, wheat yields reduced by 20.6% due to drought on a global scale [8]. It is of great significance for minimizing drought-related yield losses by studying the impact of drought on agriculture [9].
Drought represents an extended imbalance between water supply and demand [10]. Drought is commonly caused by insufficient precipitation and when soil moisture is insufficient to meet the needs of plant growth, which leads to agricultural drought following meteorological drought [11,12]. Many scholars have tried to characterize agricultural drought through disparate drought indices, including either meteorological or agricultural indices. There are some commonly used meteorological drought indices, such as Percentage of precipitation anomaly [13], Palmer drought severity index [14], Standardized precipitation index [15], Compound index, Relative humidity index, Reconnaissance drought index [16], Standardized precipitation evapotranspiration index (SPEI) [17], etc. Among them, SPEI not only has multi-timescale characteristics of a standardized precipitation index but also reflects the effects of global temperature change on drought, which is not only a good index for monitoring meteorological drought [18] but has also been widely used to monitor agricultural drought and analyze the impacts of crops due to drought [10,19,20]. For example, Pena-Gallardo et al. [21] found that there were significant correlations between wheat yields and the SPEI at timescales ranging from 1 to 18, particularly over the second half of the year in the counties of Eastern United States. Hamal et al. [1] discovered that the most correlated crop growth period for summer maize and winter wheat with SPEI was the sowing (February to May) and the growing period (November to February of the next year) across Nepal, respectively, which was the sensitive period of water deficit.
In agricultural drought monitoring, soil water plays a vital role [22]. Changes in soil water directly affect water availability, plant productivity, and crop yield [23,24]. The drought indices constructed based on soil moisture content have proved suitable for characterizing agricultural drought [25], which are Crop Moisture Index [26], Soil Moisture Percentage [27], Normalized Soil Moisture [28], and Soil Moisture Anomaly [29], etc. They have been widely used to identify and monitor agricultural droughts [30,31]. Higher-precision soil data products have enabled more agricultural drought monitoring indices to emerge [18,32,33]. Narasimhan and Srinivasan [34] developed a soil moisture deficit index (SMDI) based on the soil moisture simulated by SWAT (Soil and Water Assessment Tool) and found that wheat yield in the key growing period was highly correlated with SMDI. This index could reflect the short-term drought conditions in the root zone of the crop without seasonality, which has been used to monitor agricultural droughts in different regions after being proposed [35,36,37]. For example, Nepal et al. [38] found that the SMDI could reflect a better variation in drought conditions in the transboundary Koshi River basin (KRB) in the central Himalayan region and would be useful for the agricultural sector because it could provide a better understanding of soil moisture variation and agricultural droughts. Chen et al. [31] found that SMDI at a 0–10 cm depth had a greater impact on winter wheat yields from jointing to lactation. Wu and Li [39] pointed out that SMDI was more sensitive in recognizing early agricultural drought and performed better correlations between SMDI and winter and spring wheat yields variations across Russia during 1998–2013. These studies demonstrated that SMDI performed well in monitoring agricultural drought and could be used to indicate the effects of drought on crop yields.
Crop growth models can predict crop growth and yields by observing the physiological processes during crop growth with comprehensive genetic characteristics including crop varieties, climate, soil and management measures [40,41,42]. Some popularly used wheat growth models include the Agricultural and Food Research Council wheat model (AFRCWHEAT2) [43,44], General Large Area Model (GLAM–Wheat) [43], DSSAT–CERES–Wheat [45], Universal Crop Growth Simulator for water-limited conditions (SUCROS2) [44,46], etc. Among them, the DSSAT–CERES–Wheat model has been widely used to analyze the impact of the moisture deficit and climate variability on crop growth and yield [47,48,49], which has proved appropriate in simulating or predicting high-precision growth and yield of wheat in different regions or areas in the world [50,51]. The DSSAT–CERES–Wheat model describes in detail the growth process of wheat, from seedling emergence to flowering, leaf emergence, grain filling, physiological maturity and harvest, based on the growth period of wheat by day step. This model can respond to many factors such as water stress, environment, crop genetic characteristics, pests and diseases, etc., and has been mainly used for agricultural yield forecast, production risk assessment and impact assessment of climate on agriculture [52].
China has suffered from drought hazards for a long history [18,53]. The average agricultural drought-affected areas in China exceeded 24.43 million hm2, and the annual food loss caused by drought reached 30 billion kg, accounting for more than 60% of the total loss from natural disasters (www.mwr.gov.cn/, accessed on 8 December 2021). Wheat is planted mostly in north China (colder than the south) and accounts for more than 20% of China’s grain crops. However, most of the wheat-planting regions in China including Qinghai have been threatened by drought disasters [54]. Spring wheat is an important food crop with a planting area of 11.16 × 10⁴ hm2 (tjj.qinghai.gov.cn/, accessed on 20 June 2020). The farmland in Qinghai is mostly rain-fed, so the natural precipitation directly affects agricultural production to a great extent. There is a high risk of drought during spring wheat growth. If drought occurs in spring or summer, it would be unfavorable to wheat emergence and growth and affect the later stage of wheat grain production [55]. Therefore, it is significant to investigate drought impacts on spring wheat growth and yields in Qinghai, China in order to reduce yield losses.
Previous studies combined different drought indices with crop growth or yield-related indices to study the impact of drought on crop yields, but only a single meteorological or agricultural drought index was applied. Few studies have compared different drought indices and their appropriateness for monitoring drought conditions and drought impacts on agriculture and crops. The objectives of this study were (1) to compare the differences and connections between the meteorological drought index (SPEI) and the agricultural drought index (SMDI) at 0–10 cm and 10–40 cm depths in monitoring the drought at each growth stage of spring wheat in Qinghai province, China; (2) to identify the more appropriate drought index, the key month on spring wheat growth, and the key timescale of the selected better drought index that denote a closer relationship between spring wheat growth yields and drought severity based on correlations between the spring wheat growth and drought indices; and (3) to analyze the relationship between yield reduction rate calculations based on selected drought index and wet and dry conditions at the key month under the key timescale.

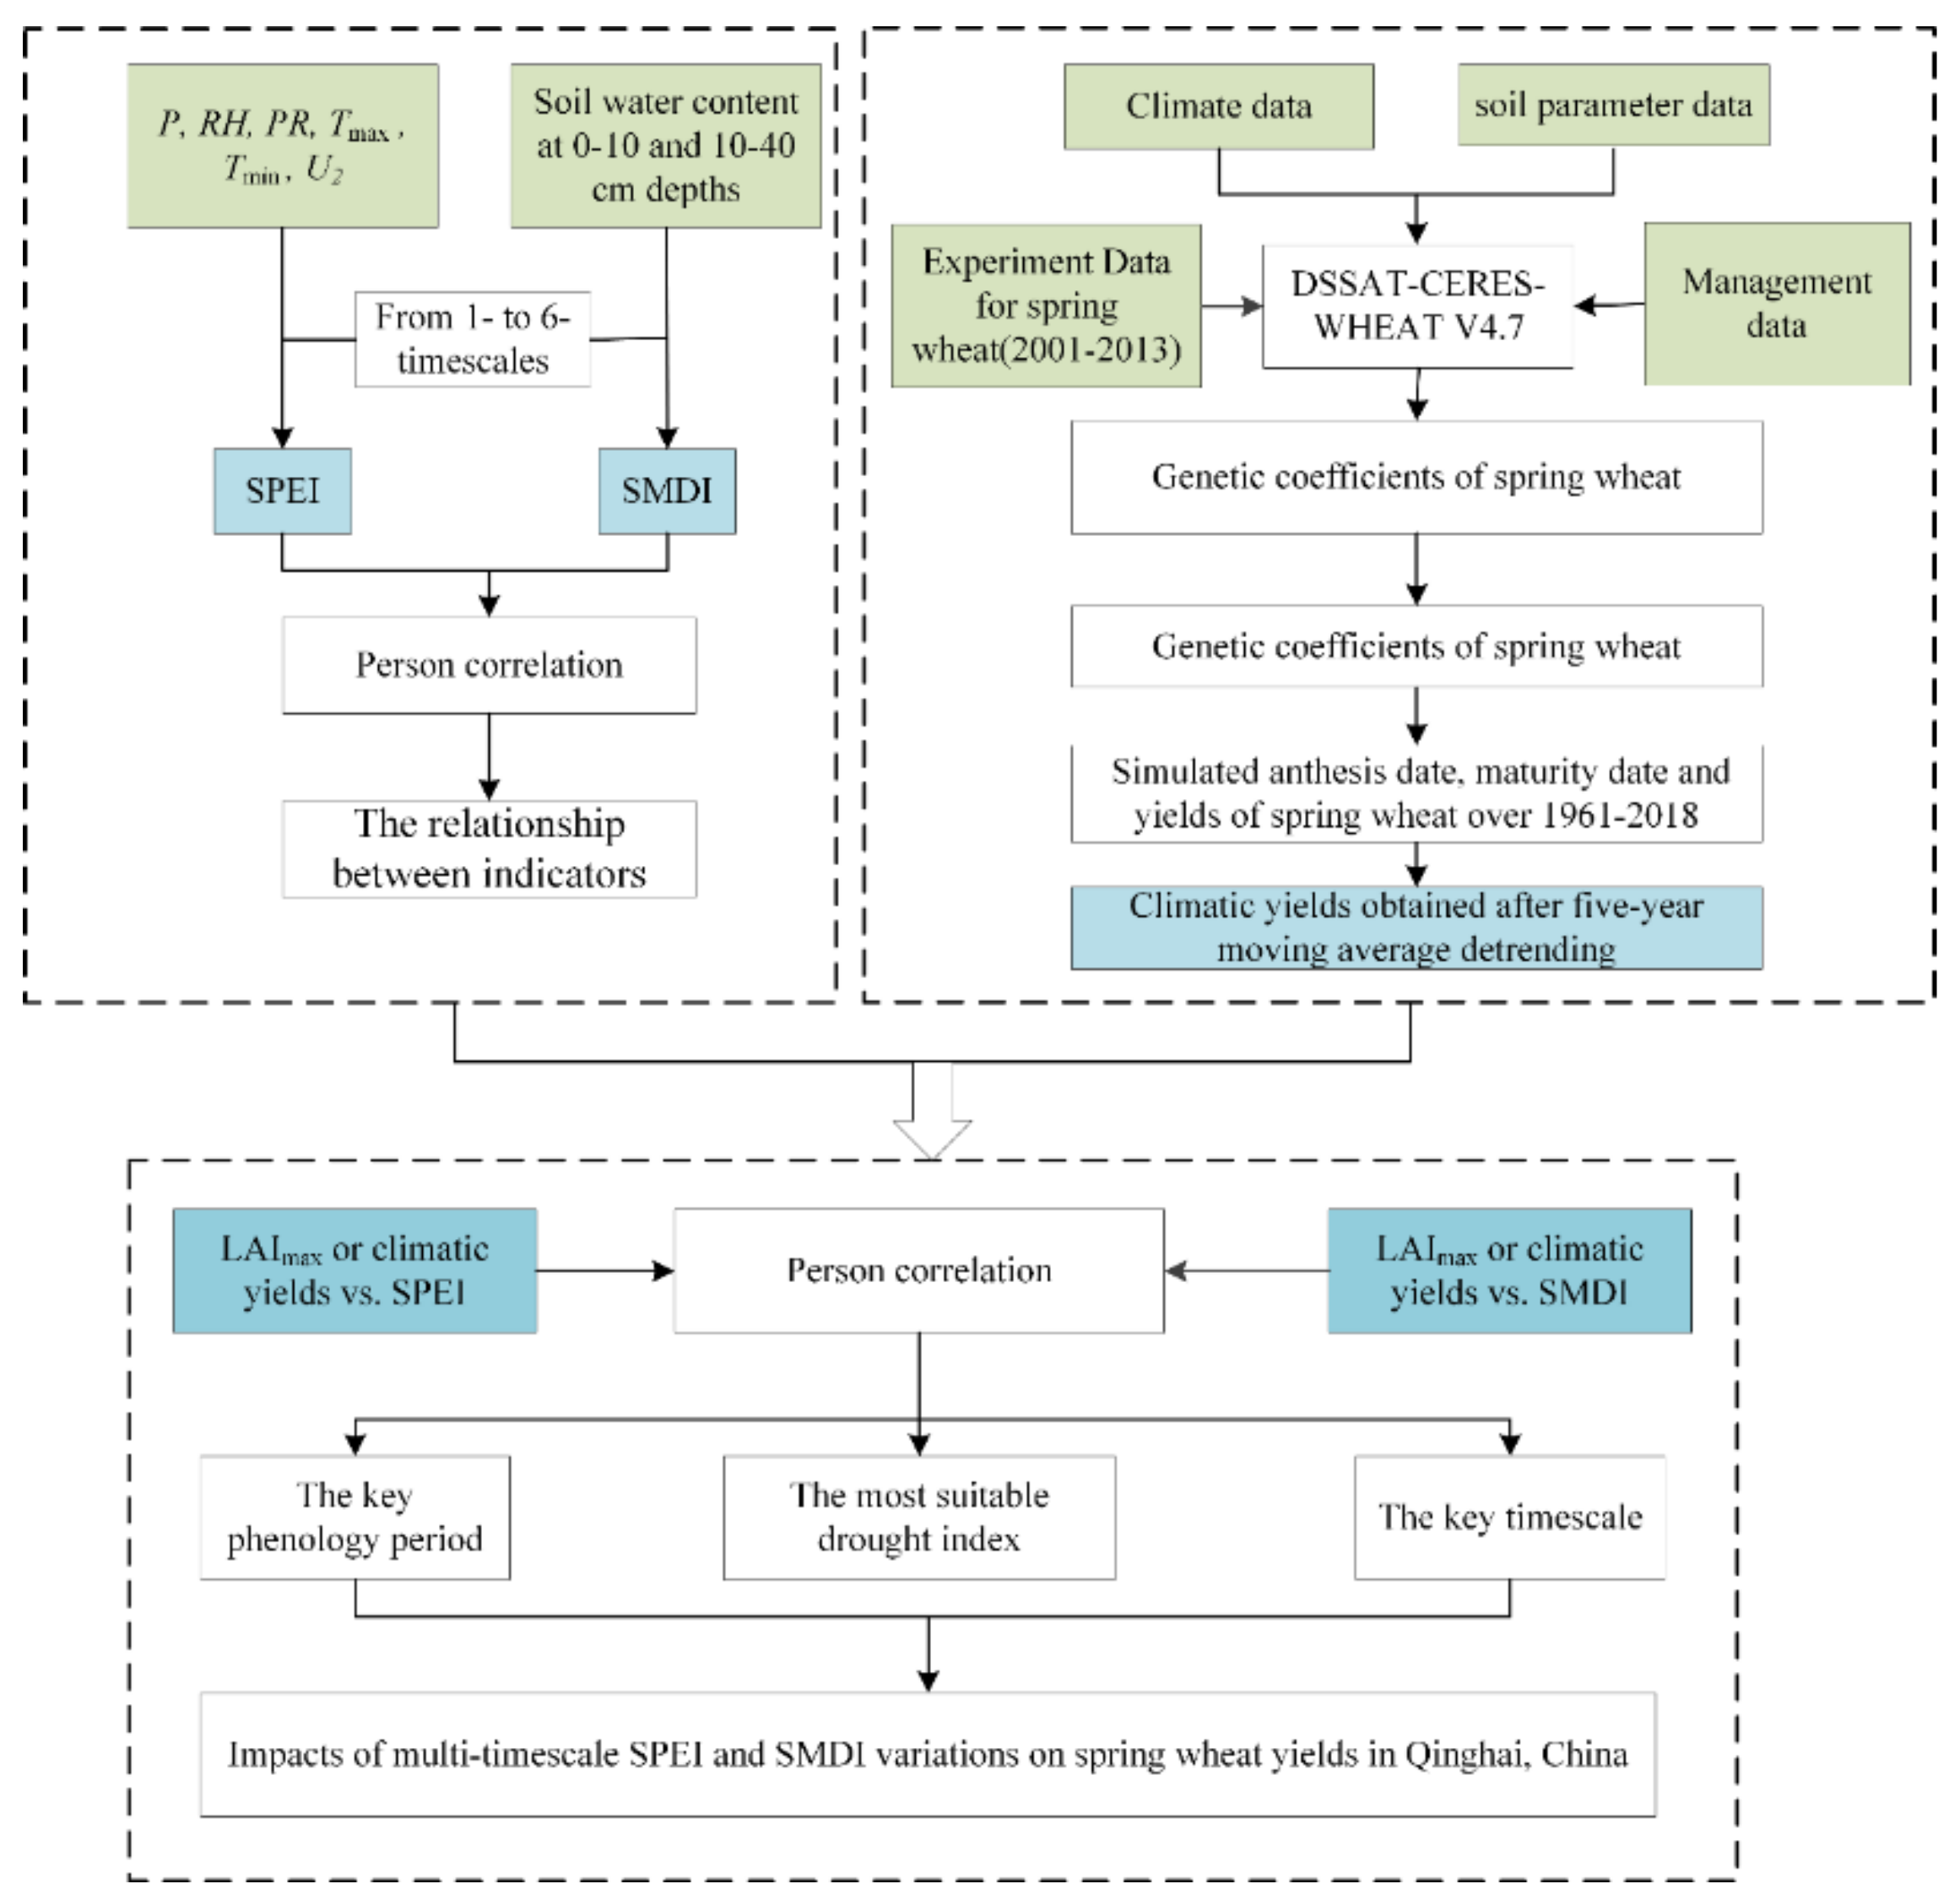
2. Data and Methodology

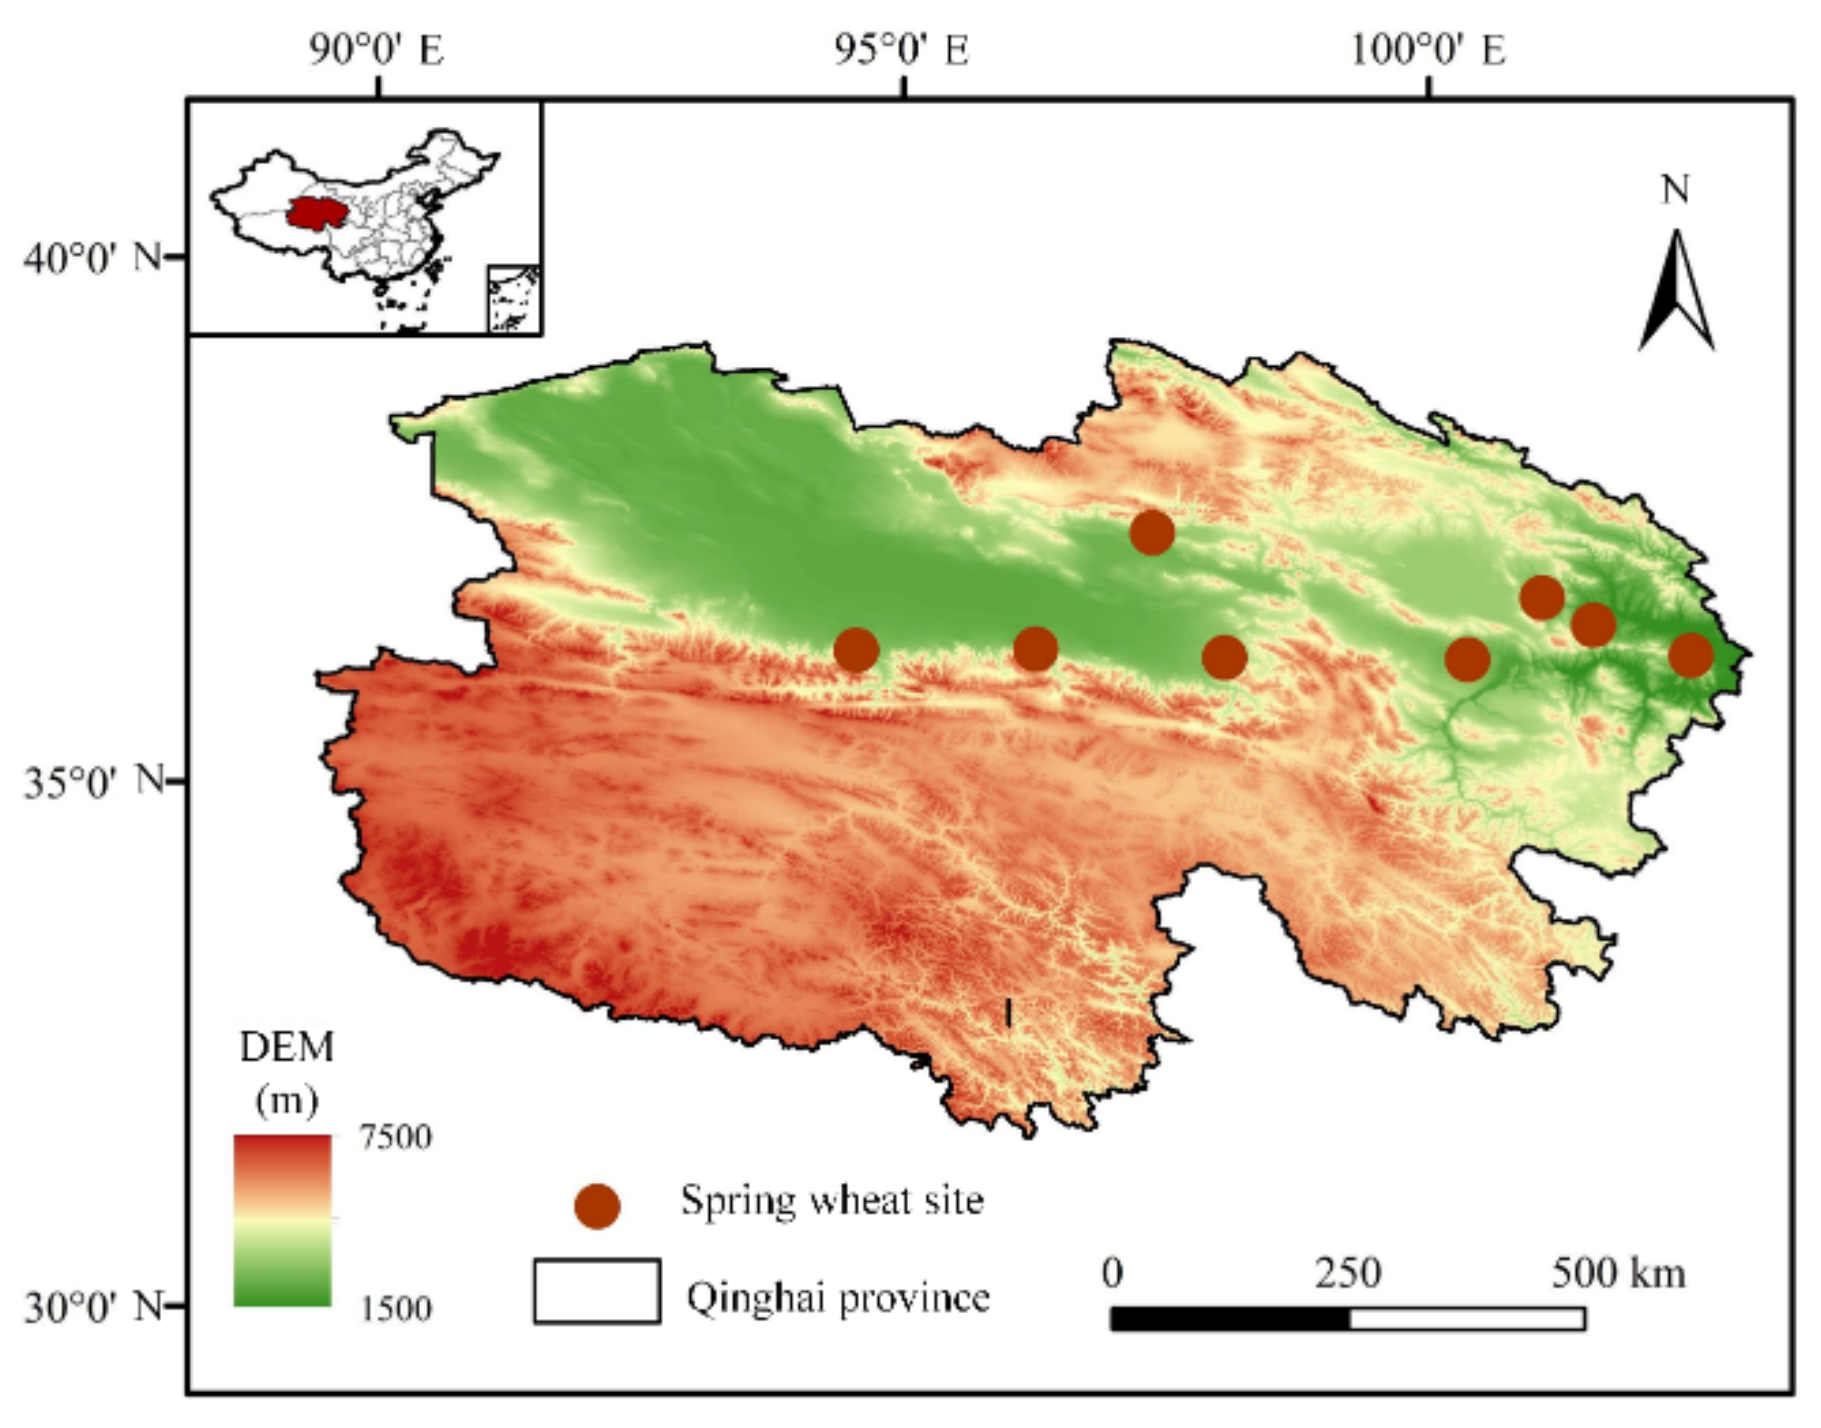
2.1. Study Area and Selected Sites

Qinghai province is located in the northwestern region of China, with an area of approximately 720,000 km2, accounting for 7.5% of the total Chinese area. Qinghai is an arid and semi-arid area with an annual average temperature of 2–9 °C, a frost-free period of 100–200 days, and annual average precipitation of 25–500 mm [56]. There is large variability in precipitation, with higher precipitation in the southeast and lower precipitation in the northwest. Spring wheat is one of the main food crops in Qinghai Province.
The 8 selected sites with spring wheat planting are located in the Qaidam Basin and the eastern agricultural region of Qinghai province, China. These sites have suffered from drought and flood hazards in the past which affected local agricultural production. The distribution of the selected sites and elevation is mapped in Figure 1.

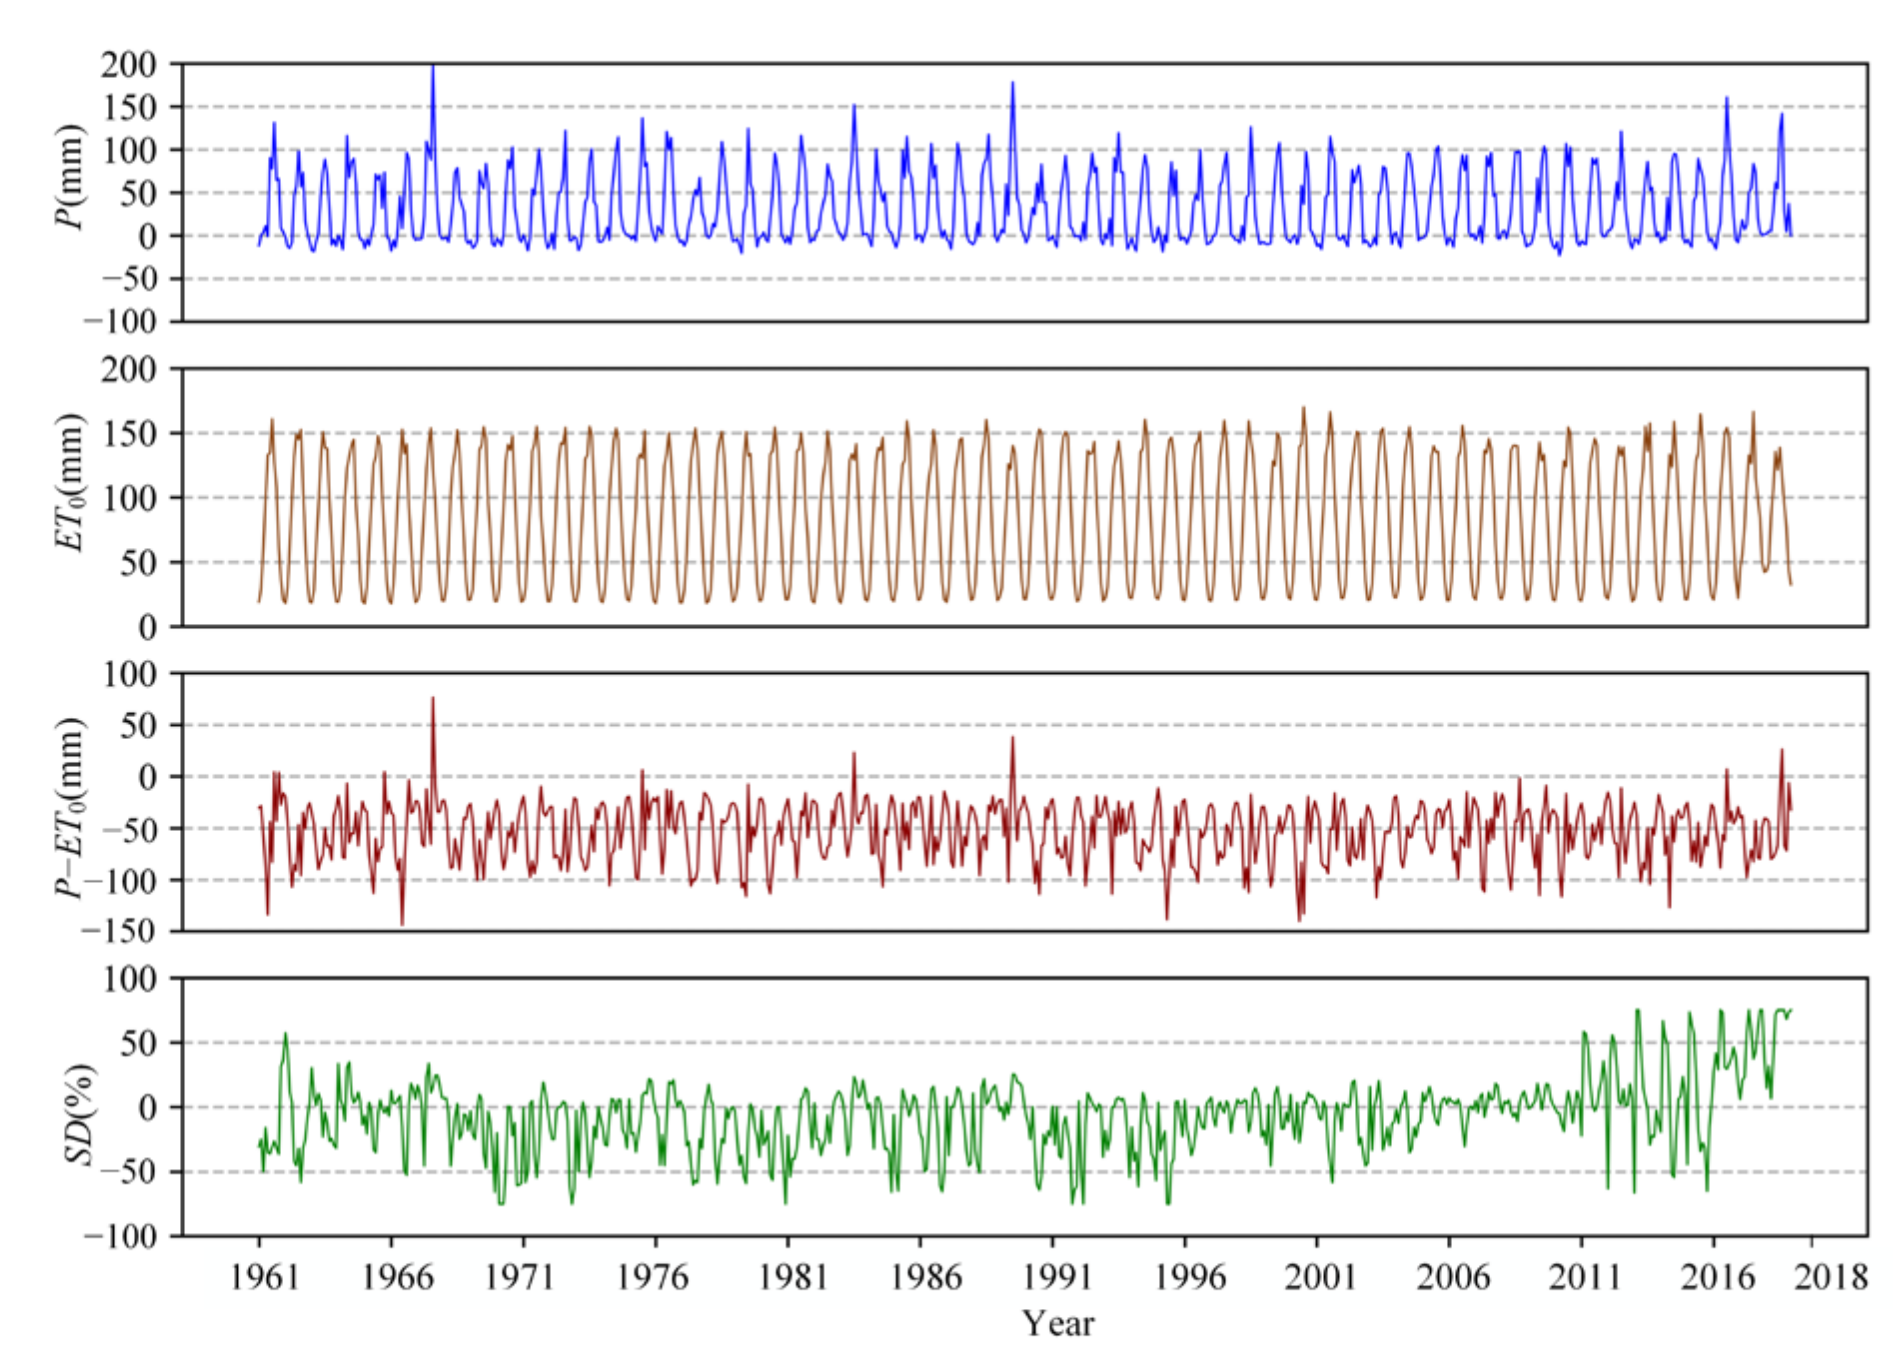
2.2. Collection of Climate, Soil, and Crop Data

The observed climate data were obtained from China meteorological administration data network (data.cma.cn, accessed on 30 December 2019), including daily precipitation (P), relative humidity (RH), daily maximum temperature (Tmax), daily minimum temperature (Tmin), wind speed at 2 m height (U) and sunshine hours from 1961–2018 at the 8 studied sites.
The soil property data including saturated moisture content (SAT), soil water content at the permanent wilting point (WP), soil water content at the field capacity (FC) and saturated hydraulic conductivity (SHC) were obtained from the Chinese soil moisture dataset with a spatial resolution of 30 × 30 arc seconds [57]. The field capacity data have 7 depth ranges of 0–4.5, 4.5–9.1, 9.1–16.6, 16.6–28.9, 28.9–49.3, 49.3–82.9 and 82.9–138.3 cm, respectively. The average layer soil moisture (at 4 layers of 0–10 cm, 10–40 cm, 40–100 cm and 100–200 cm) from 1961–2018 were collected from Global land data assimilation system–Noah–simulated (GLDAS–Noah) with a spatial resolution of 0.25° × 0.25°, which has good applicability in Qinghai through comparative analysis with observed data. The GLDAS soil moisture was converted to volumetric values (m3 m−3).
The spring wheat growth period and yield data (2001–2013) for the 8 sites were collected from Qinghai institute of meteorological science (qh.cma.gov.cn, accessed on 30 December 2020) and agricultural meteorological data on China meteorological administration data network (data.cma.cn, accessed on 30 December 2019). The agricultural disaster data were collected from National Qinghai–Tibet Plateau Data Center (data.tpdc.ac.cn, accessed on 5 January 2021). According to the observed data, the whole growth period of spring wheat is divided into 5 physiological stages, namely sowing–emergence stage, emergence–jointing stage, jointing–earing stage, heading–milk maturity, and milk maturity–maturity stage. The start and end dates of spring wheat growth period at the 8 sites are presented in Table 1. The multi-year average of the growth period days is used to represent the local general growth period. The full growth period of spring wheat is from March to August.

2.3. Computation of Drought Indices

2.3.1. Standardized Precipitation Evapotranspiration Index (SPEI)

The SPEI is calculated by the difference in precipitation (P) and reference crop evapotranspiration (ET0) for each site. The Penman–Monteith formula is recommended by the Food and Agriculture Organization of the United Nations (FAO) and has proved to have good performance in different parts of the world [58]. The procedure for SPEI computation follows [17]:
To calculate the ET0 at the monthly timescale:
E T 0 = 0.408 Δ   R n G   + Δ 900 T + 273 U 2 ( e n e a ) Δ + γ ( 1 + 0.34 U 2 )
where Rn is the net radiation (MJ m−2 d−1); T is the daily average temperature (°C); U2 is the wind speed at 2 m (m s−1); es and ea are the saturated and actual water vapor pressure (kPa); Δ is the slope of the saturated water vapor pressure-temperature curve (kPa/°C); γ is the wet and dry meter constant (kPa/°C).
To calculate the difference between P and ET0, namely D:
D = PET0
To normalize the data series D. Vicente-Serrano, et al. [17] compared the fitting effects of Log-logistic, Pearson III, Lognormal, and generalized extreme values on the sequence. The results showed that Log-logistic distribution showed better performance:
F ( x ) = 1 + α x γ β 1
where F(x) is the cumulative probability distribution function for a given time scale; α is the scale parameter; β is the shape parameter; γ is the origin parameter, which can be obtained by fitting the linear moment. The parameters are calculated as follows:
α = ω 0 - 2 ω 1 β Γ 1 + 1 / β Γ 1 1 / β
β = 2 ω 1 ω 0 6 ω 1 ω 0 6 ω 2
γ = ω 0 α Γ 1 + 1 / β Γ 1 1 / β
where Γ is the factorial function; ω0, ω1, ω2 is the probability-weighted distance of the original data sequence D, the calculation method is:
ω i = 1 N i = 0 N 1 F i s D i
F i = i 0.35 N
where N is the number of months involved in the calculation.
To standardize the cumulative probability density:
P D = 1 F x
When P(D) ≤ 0.5:
W = 2 ln P D
SPEI = W c 0 + c 1 W + c 2 W 2 1 + d 1 W + d 2 W 2 + d 3 W 3
When P(D) > 0.5, P(D) is replaced by 1 − P(D). Here c0 = 2.515517, c1 = 0.802853, c2 = 0.010328, d1 = 1.432788, d2 = 0.189269 and d3 = 0.001308.

2.3.2. Soil Moisture Deficit Index (SMDI)

SMDI is calculated at two soil depths of 0–10 cm and 10–40 cm by using soil moisture content data at 1- to 6-timescales from 1961 to 2018 [34]. The calculation procedure is as follows: (1) Using the long-term median, maximum and minimum soil moisture at a certain timescale to calculate the percentage soil moisture deficit, as follows:
S D i , j = S W i , j M S W j M S W j min S W j × 100 , S W i , j M S W j S W i , j M S W j max S W j M S W j × 100 , S W i , j > M S W j
where SDi, j is the soil moisture deficit in the jth month of the ith year (%); SWi, j is the mean soil moisture content at a certain timescale in the soil profile (mm); MSWj is the long-term median soil moisture content in the soil profile (mm); maxSWj is the long-term maximum soil moisture content in the soil profile (mm); minSWj is the long-term minimum soil moisture content in the soil profile (mm) (i =1, 2, …, 58, and j = 1, 2, …, 12).
(2) By using formula (13), the seasonality inherent in soil moisture is removed. Hence, SD is compared across seasons. To determine drought severity, the main challenge is to choose the time step over which the dryness values are accumulated [22]. Thus, the drought index is calculated on an incremental basis as suggested by Palmer [14]:
SMDI i , j = S D i , j 50 , j = 1 0.5 SMDI i , j 1 + S D i , j 50 , j > 1
In order to compare SMDI and SPEI, the step is modified to 2 during calculation, and the range of SMDI is re-adjusted from (−4 to 4) to (−2 to 2) to be consistent with the SPEI value. The value of SPEI or SMDI in a certain month (or a certain timescale) is the average value of the previous months till the current month. For example, the SPEI or SMDI in May at the 2-month timescale is an average value of SPEI or SMDI from April to May. The dry or wet conditions classification using SPEI and SMDI are shown in Table 2.

2.4. Crop Growth and Yield Simulation Using the DSSAT–CERES–Wheat Model

Since the observed crop yield data at the 8 studied sites are only for 2 to 13 years (2001–2013), in order to study the long-term effects of drought on spring wheat yield, The DSSAT–CERES–Wheat model is used to extend the growth and yield sequence to 1961–2018, which is a sub-module in DSSAT–CERES–wheat used for simulating the growth process of spring wheat. The input data include four modules: meteorology, soil parameters, yield management, and crop genetic coefficient. The input meteorological data mainly include solar radiation, Tmax, Tmin, P, U and sunshine hours. The input soil parameters include SAT, WP, FC, SHC, and field management data include sowing period, fertilization amount, irrigation method and irrigation amount, etc.
In DSSAT–CERES–wheat, the generalized likelihood uncertainty estimation (GLUE) is used to debug the genetic coefficients of spring wheat, which include P1V, P1D, P5, G1, G2, G3 and PHINT. The debugging process of crop genetic parameters is divided into two rounds, each 6000 times. In the first round, the crop phenological parameters are adjusted and in the second round, the growth parameters of crops are estimated.
The debugging results of spring wheat genetic parameters at the 8 selected sites are shown in Table 3. Then, the anthesis date, maturity date and yield data of the first 6 years (2001–2006) are used to correct the genetic coefficients, and the genetic coefficients are validated with the data of the next 7 years (2006–2013). After assessing the calibration and validation performance of DSSAT–CERES–wheat, the corrected genetic coefficients are used to simulate the crop’s leaf area index (LAI) and meteorological yields of spring wheat from 1961 to 2018.
The coefficient of determination (R2) and relative root mean square error (RRMSE) are used to evaluate the performance of DSSAT–CERES–wheat during calibration, validation and simulation processes. The equations of R2 and RRMSE are as follows:
R 2 = m = 1 n o m o ¯ s m s ¯ m = 1 n o m o ¯ 2 m = 1 n s m s ¯ 2
R R M S E = 1 n m = 1 n s m o m 2 o ¯
where om is the observed value in the mth year (m = 1, 2, …, 13), o ¯ is the mean value of om, sm is the simulated value in the mth year, s ¯ is the mean value of sm, and n is the number of samples. Generally, the higher the R2 values, or the lower the RRMSE values, the better performance of DSSAT–CERES–wheat.

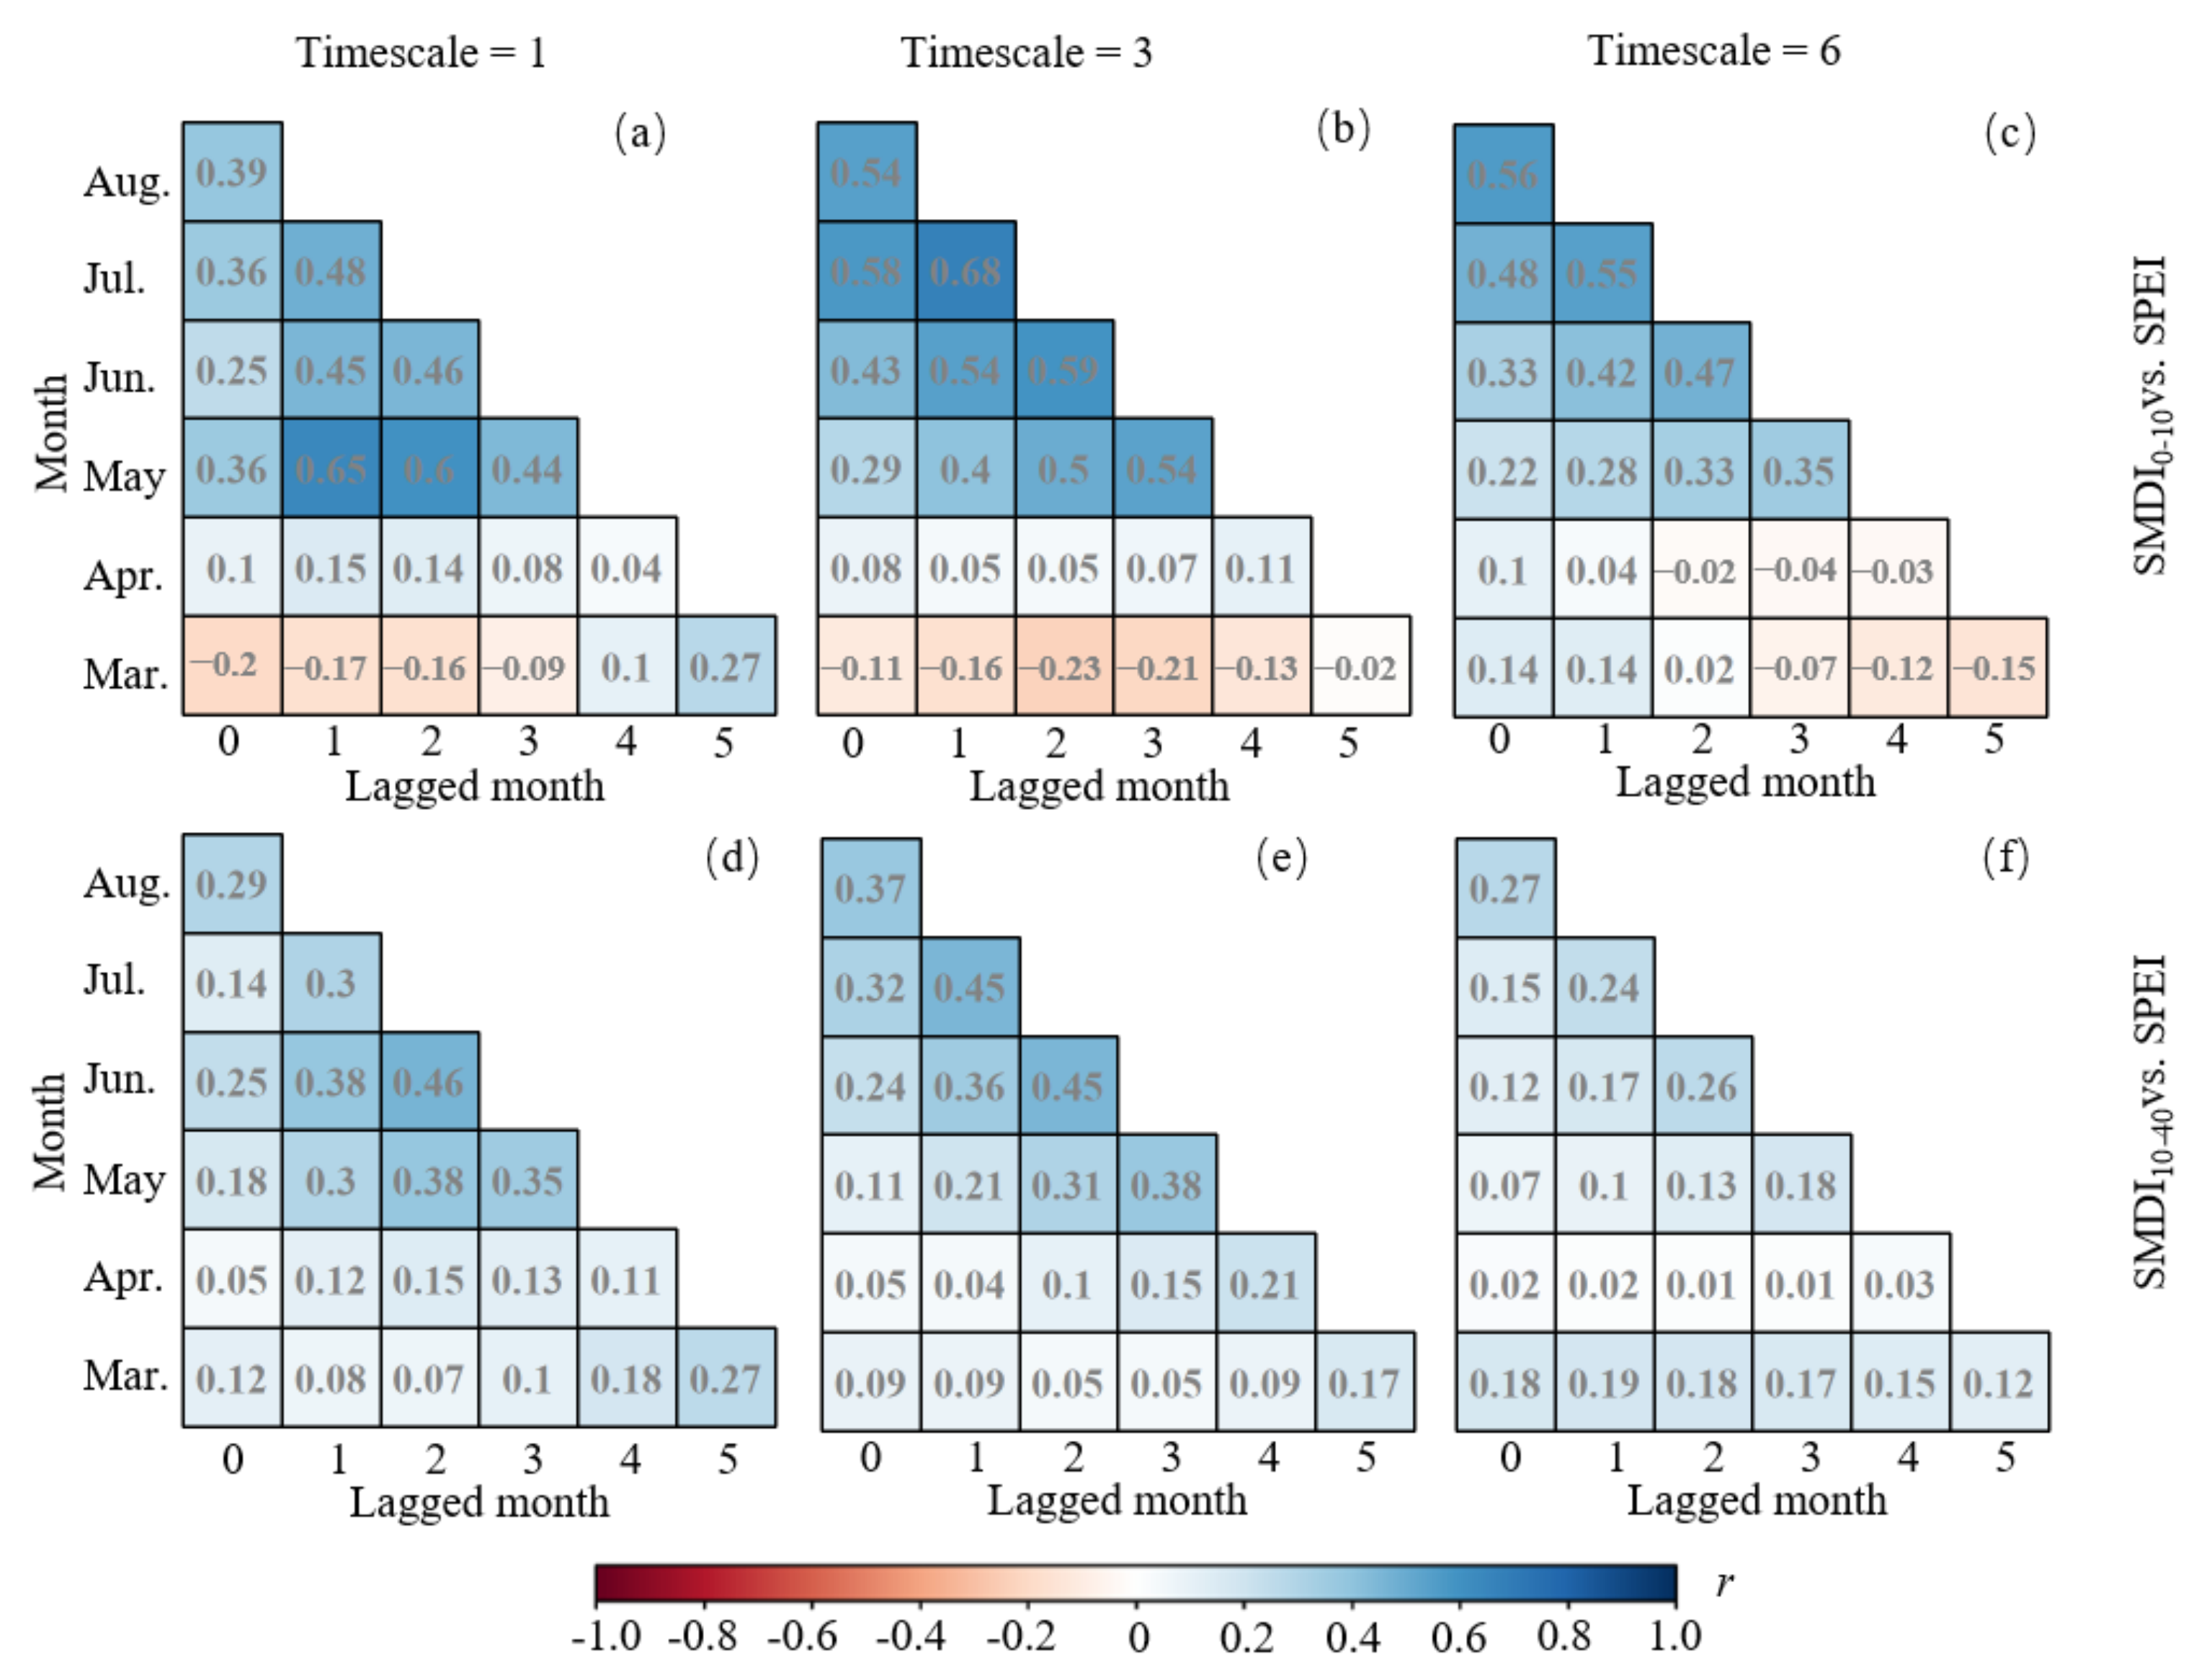
2.5. Correlations between Yields and Drought Indices

The Pearson correlation coefficient (r) is used to evaluate the relationships between (i) SPEI and SMDI in current month or lagged for 1 to 2 months; and (ii) SPEI (or SMDI) and yields (or LAImax) at the 1- to 6- month timescales during the entire growth period of spring wheat. The range of r is between −1 and 1. The larger the absolute value of r, the closer the relationship between two variables.

2.6. Yield Reduction Rate of Spring Wheat

When SPEI (or SMDI) is between −0.5 and 0.5, it is regarded as a normal year without drought or waterlogging, and the average yield of the normal year is considered the reference yield. The reference yield is calculated as follows:
Y i e l d k , n o r m a l = Y i e l d k , 1 + Y i e l d k , 2 + Y i e l d k , n n
where Yieldk,normal represents the reference yield of spring wheat at the kth site (k = 1, 2, …, 8), and n is the number of normal years at the site.
The annual reduction rate is calculated as follows:
Y R R k , i = Y i e l d k , i Y i e l d k , n o r m a l Y i e l d k , n o r m a l × 100 %
where YRRk,i represents the yield reduction rate of spring wheat at the kth site, and i is the number of years (i = 1, 2, …, 58). Yieldk,i represents the actual yield in the ith year. When YRRk, i is negative, it means that production has been reduced in the ith year.
Python (version 3.3.9) is applied to analyze data and draw figures.
The flow chart which illustrates the main methodology and idea of this research is shown in Figure 2.

3. Results

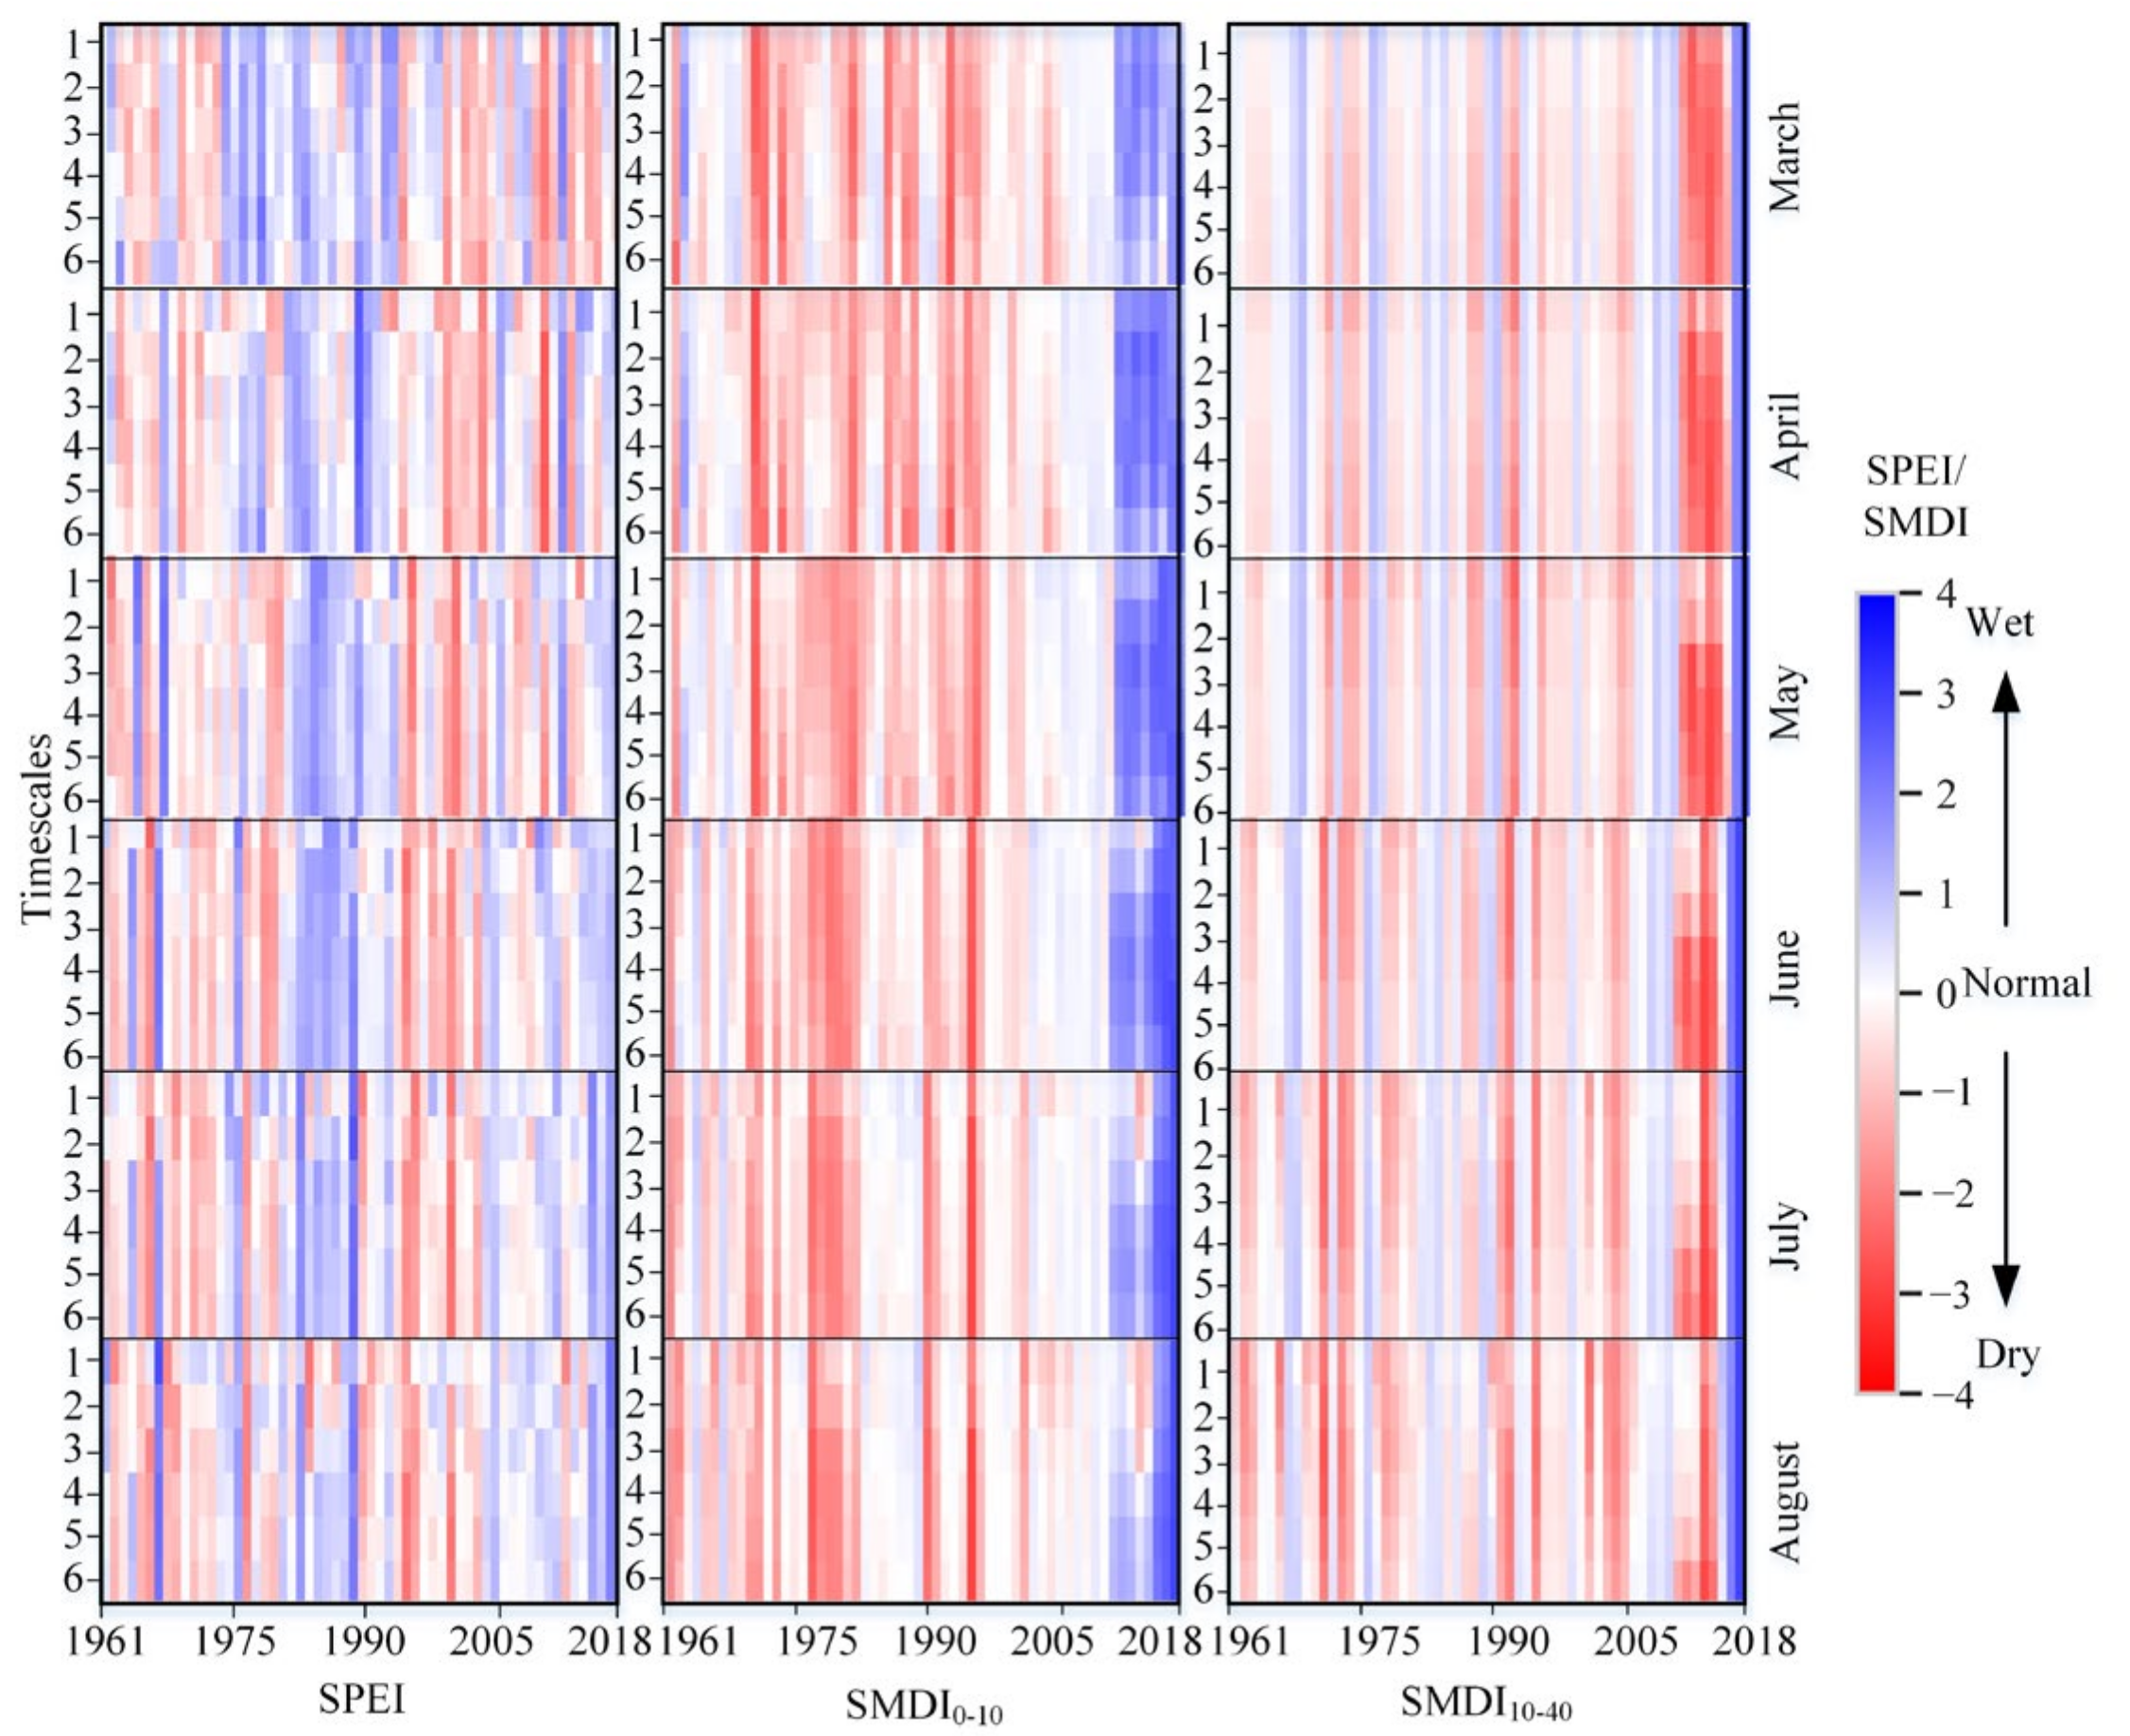
3.1. The Drought Variations Indicated by SPEI and SMDI

A total of eight sites were selected for this research. However, there was a great amount of data and the characteristics of the studied variables were similar; therefore, here the Gonghe site is taken as the example for it is representative of the selected 8 sites. The temporal variations of monthly P, ET0, PET0 and soil moisture deficit in 1961–2018 are compared in Figure 3. The results showed that P and ET0 have relatively similar patterns of variation within years, P (or ET0) increased from April or May and reached peaks in July or August. Monthly PET0 ranged between −75 mm to 50 mm and were largely negative, indicating Gonghe suffers long-term drought. Soil moisture deficit varied more randomly than P and ET0, but the values were generally higher from May to August than the other months. The other 7 sites showed similar annual patterns, but there were some regional differences in precipitation (Figure S1), with sites located in the west of Qinghai province (Deling, Geer, Nuomu, Geer) having less rainfall than the eastern sites (Huangyuan, Gonghe, Huzhu, Minhe).
The temporal variations of SPEI, SMDI0–10, and SMDI10–40 at the 1- to 6-month timescales during the spring wheat growing season of 1961 to 2018 at Gonghe site are illustrated in Figure 4 (The other 7 sites are shown in Figure S2).
The results in Figure 4 showed that (1) SPEI varied more randomly than SMDI over 1961–2018, with a wetter period over 1980–1989. From SMDI0–10, there was a long drier period from 1970–1996 but a short wetter period from 2010–2018. Variations of SMDI10–40 were generally similar to SMDI0–10 but looked wetter over the entire studied period, with a typically different short drier period of 2011–2016, and (2) at the 1- to 6-month timescales, SMDI (0–10 and 10–40 cm) during the growth stage of spring wheat varied similarly, reflecting generally consistent dry or wet conditions. Variations in SPEI at different timescales were less similar than those in SMDI and (3) in different years and months, the drought levels identified by SPEI and SMDI (0–10 cm and 10–40 cm) were not consistent. For example, the year 2001 was identified as a severe drought by SPEI, but a normal year according to SMDI (both at 0–10 cm and 10–40 cm depth), while 1991 was identified as a normal year by SPEI but a moderate drought year by SMDI (0–10 cm and 10–40 cm).
In fact, different types of drought originate from meteorological drought but, due to the different processes of drought formation, there is a phase difference in time. In order to investigate the relationship between meteorological drought and agricultural drought, the r values between SPEI and SMDI0–10 with a lagged time of 0–5 months during the spring wheat growth period were calculated on the 1- to 6- month timescales (Similar to SMDI0–10 vs. SMDI10–40 with a lagged time of 0–5 months and SPEI vs. SMDI0–10 with a lagged time of 0–5 months). The result showed that SPEI was more closely related to SMDI0–10 than SMDI10–40 on each timescale, indicating that the surface soil moisture was easily affected by precipitation, temperature and other factors (Figure 5). From March to April (the sowing–emergence period of spring wheat), there is no obvious correlation (−0.23–0.27) between SPEI and SMDI0-10 SMDI10–40 in the current month or time lag of 1–5 months from March to April, suggesting that the source of soil moisture is not dependent on atmospheric precipitation at this time and that alpine snowmelt may also have a partial influence. While during May to June (the jointing—heading period of spring wheat), SPEI generally had a higher r value with 1 and 2 months lagged SMDI0–10 (0.3–0.59) and SMDI10–40 (0.31–0.45). In July (the milking maturity period of spring wheat), SPEI showed a higher correlation with a 1-month lag between SMDI0–10 and SMDI10–40. The results indicated that there is a certain hysteresis agricultural drought (indicated by SMDI) compared with meteorological drought (indicated by SPEI) when precipitation increases, and the correlation between surface soil moisture and SPEI was higher than deep.
The coincidence between drought events indicated by SPEI and SMDI compared with the actual drought events is identified by Huangyuan, Huzhu and Minhe, where historical data are relatively complete (Figure 6). The results showed that SMDI0–10 among the three indices had the highest agreement with actual drought conditions (43–82%), followed by SMDI10–40 (39–60%) and SPEI (29–43%), respectively. This may be due to the fact that most of the actual drought records were related to rainfall deficits, damage to farmland, and reduced grain production.

3.2. Spring Wheat LAI and Yield Simulated by DSSAT-CERES-Wheat Model

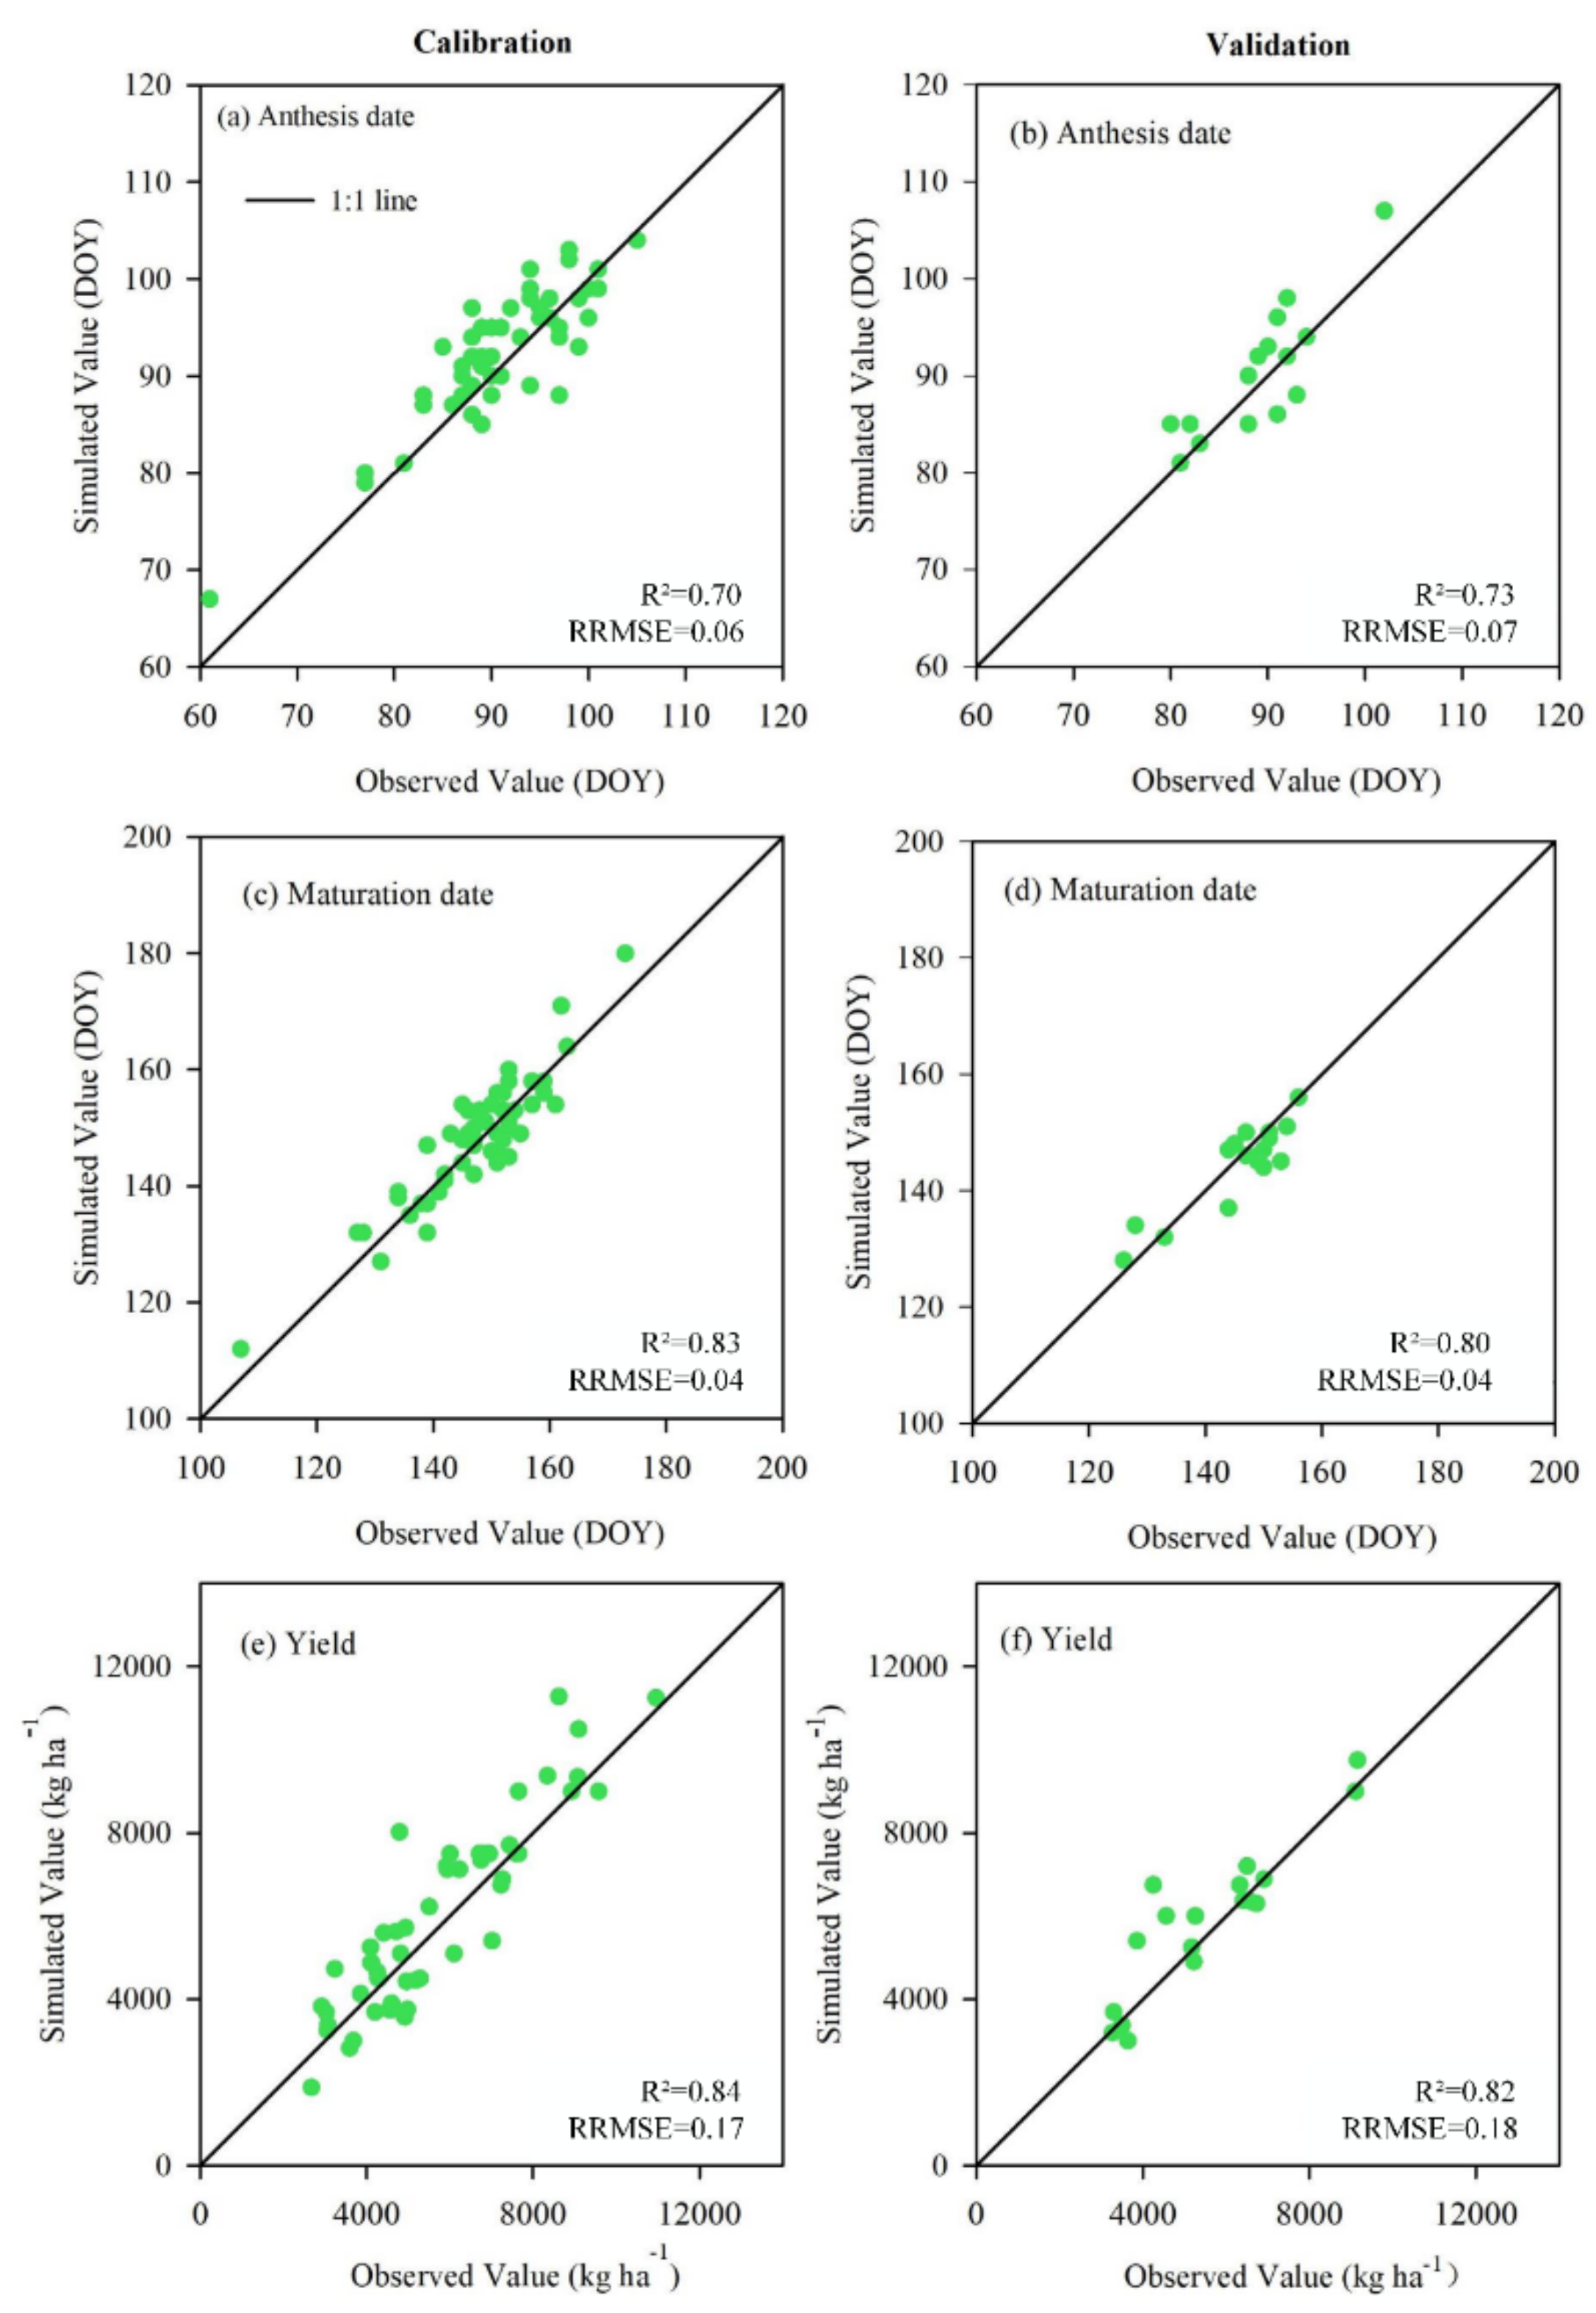
3.2.1. Performance of DSSAT–CERES–Wheat Model

The performance of the DSSAT–CERES–wheat model has been evaluated by plotting the simulated and observed anthesis date, maturity date, and yield values of spring wheat for both calibration and validation processes (Figure 7), and the R2 and RRMSE were used to verify whether the simulated value is consistent with the observed value. The results showed that the higher R2 (0.70 < R2 < 0.85) and lower RRMSE (0.04 < RRMSE < 0.18) between simulated and observed values during the calibration and verification process indicated a better accuracy of the model simulation. Therefore, the calibrated genetic parameters of spring wheat could be further used for the simulation of crop growth and yield over the period 1961–2018 at the eight studied sites.

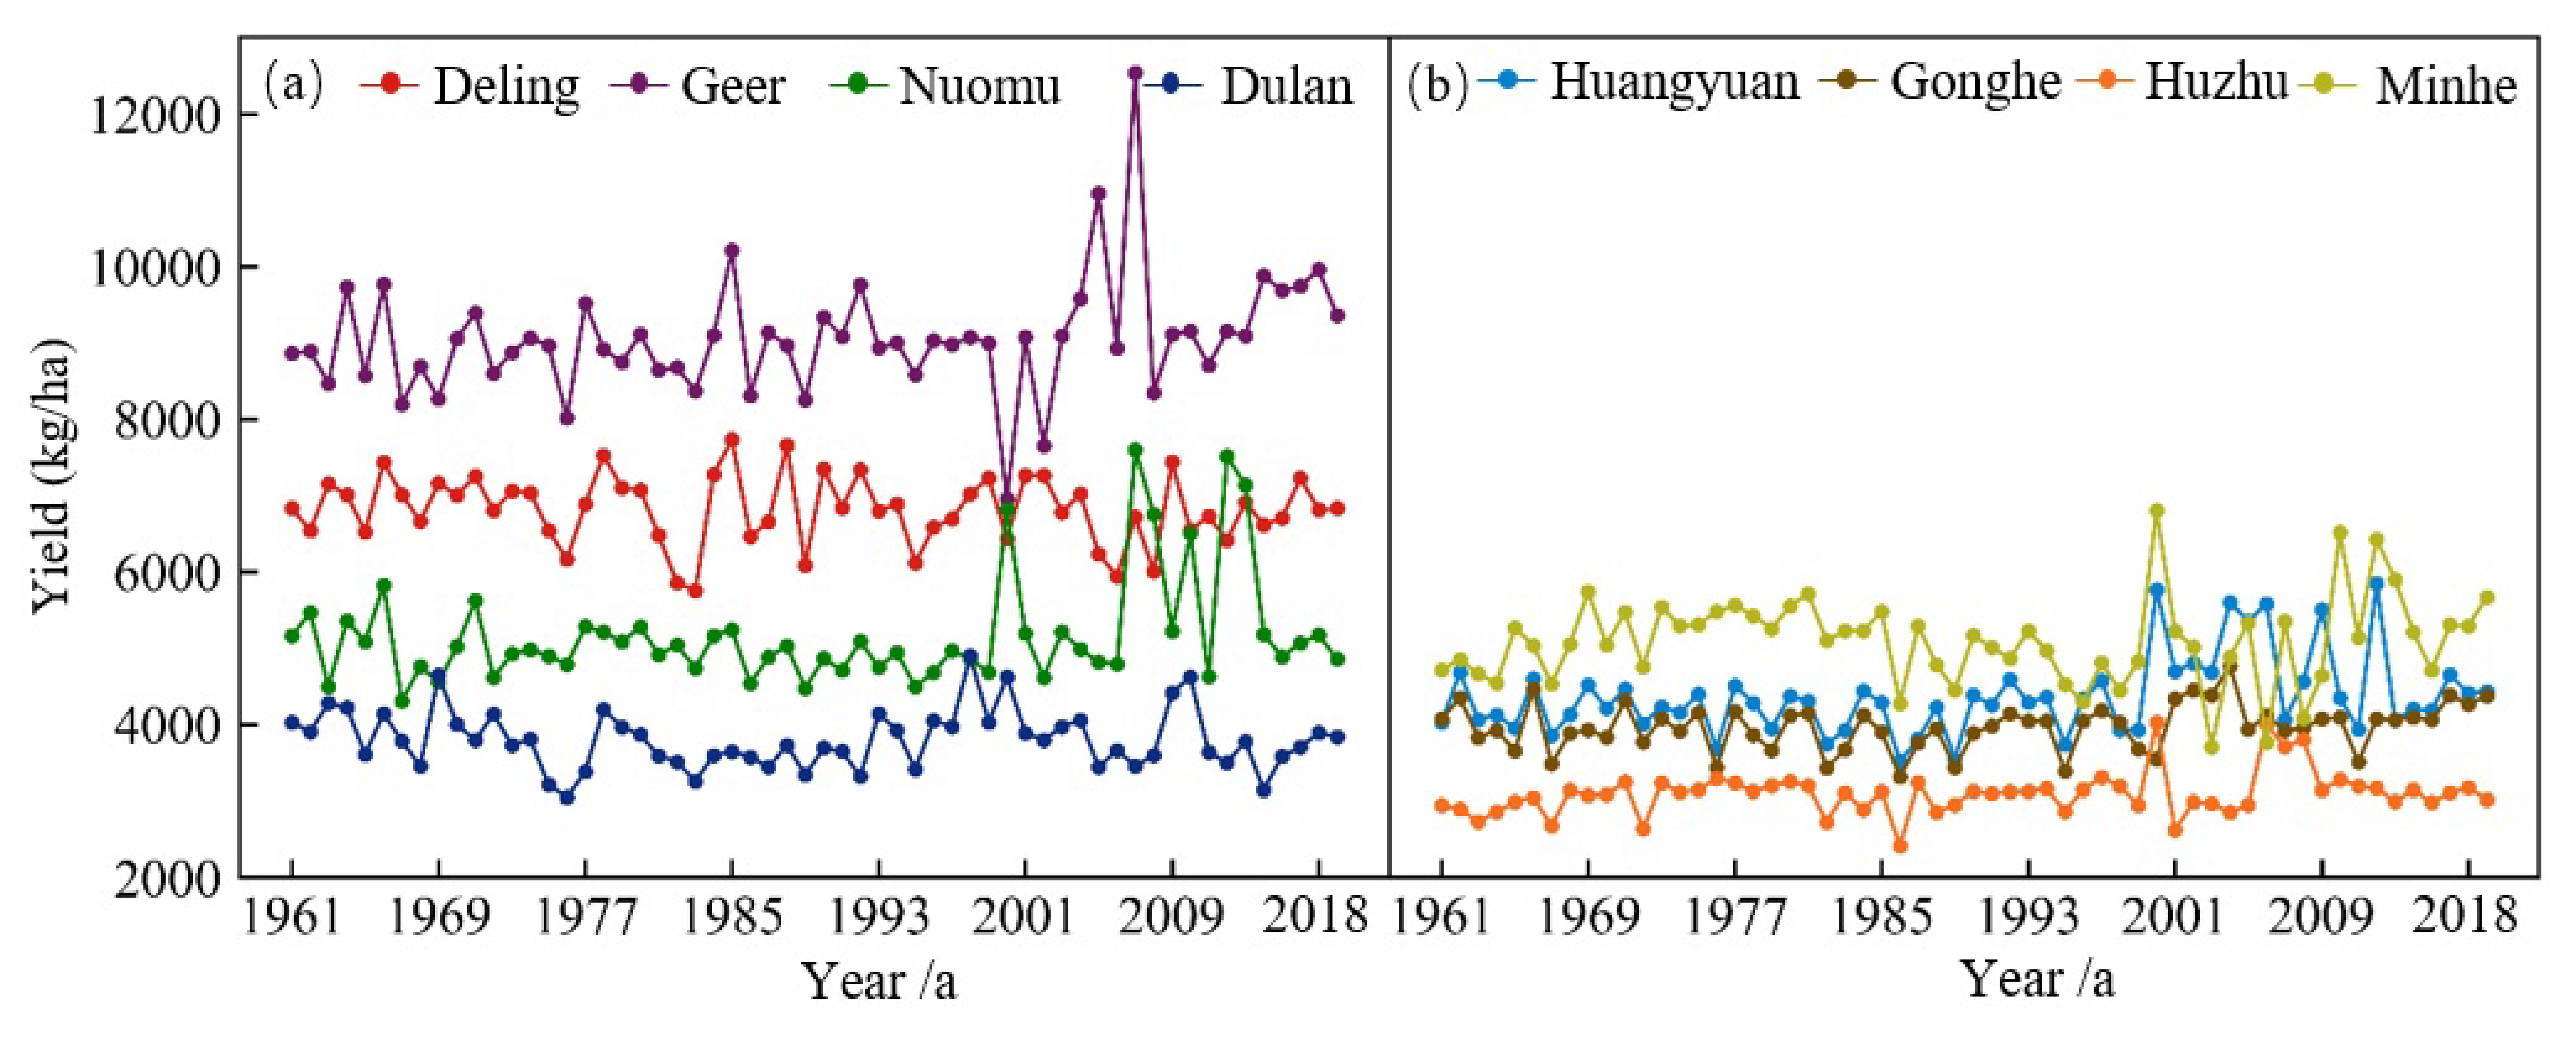
3.2.2. Annual Variations of Spring Yields

The annual variations of simulated (climatic) yields in 1961–2018 for the eight sites are shown in Figure 8. There were generally random fluctuations of actual yields at the eight sites over 1961 to 2018, and there was a relatively large fluctuation between 2001 and 2011. The yields of spring wheat ranged from 2050 to 12540 kg ha−1, and higher yields from 2005 to 2010 were shown. There was a site rank of mean trend yield: Geer > Deling > Minhe > Nuomu > Huangyuan > Gonghe > Dulan > Huzhu.

3.3. The Effects of Drought on Spring Wheat Growth and Yields

Values of r for drought indices (SPEI or SMDI0–10) vs. spring wheat growth indices (LAImax or climatic yield) are illustrated for the site Gonghe in Table 4 (The r values between drought indices and spring wheat growth indices of the other 7 sites are shown in Table S1 and Table S2 respectively). The correlation between SPEI and spring wheat climatic yield was generally low (−0.11 < r < 0.17), while there was mostly a negative correlation with LAImax (−0.26 < r < 0.11). However, SMDI0–10 was positively correlated with LAImax and climatic yields (−0.01 < r < 0.37), indicating different and complicated effects of meteorological and agricultural droughts on spring wheat growth and yields.
In order to better describe the correlations between drought indices and spring wheat growth-yield characteristics, a threshold value of r = 0.21 was selected, which represents a p-value ≤ 0.05, below which it was assumed that there were no close connections between drought indices and crop growth. Since correlations between (LAImax or climatic yield) of spring wheat and SMDI10–40 were mostly negative; therefore, the further analysis is meaningless.
The number of sites with r > 0.21 for SPEI and SMDI0–10 at the 1- to 6-month timescales vs. spring wheat (LAImax) climatic yield are presented in Table 5. It showed that (1) From SPEI, there were more sites with r > 0.21 from June to August (heading to maturity periods of spring wheat) (8/48) and the total number of sites with r > 0.21 between SPEI and spring wheat (LAImax) climatic yield at the 1- to 6-month timescale during spring wheat growth period was minor (0 to 6 out of 48); (2) From SMDI, there were more sites with r > 0.21 from April to June (seedling emergence to heading period of spring wheat) (LAImax, 6–11, climatic yield, 24–29). At the 2-month timescale, there was the largest correlation for LAImax (23/48) or climatic yield (13/48) vs. SMDI0–10; (3) By comparison, the total site number of r > 0.21 correlations between (LAImax) climatic yield and SMDI0–10 were much larger than for SPEI, indicating better connections between spring wheat growth yield and SMDI0–10. Therefore, SMDI0–10 was a better index for denoting drought effects on spring wheat yields than SPEI and SMDI10–40; and (4) Based on the site number between correlations of climatic yield and SMDI0–10 with r > 0.21, there was the largest number of sites in May (11/48) and at the 2-month timescale (10/48); therefore, May was the key month and 2 months was the key timescale of SMDI for denoting the key parameters of preventing drought during spring wheat growth periods.

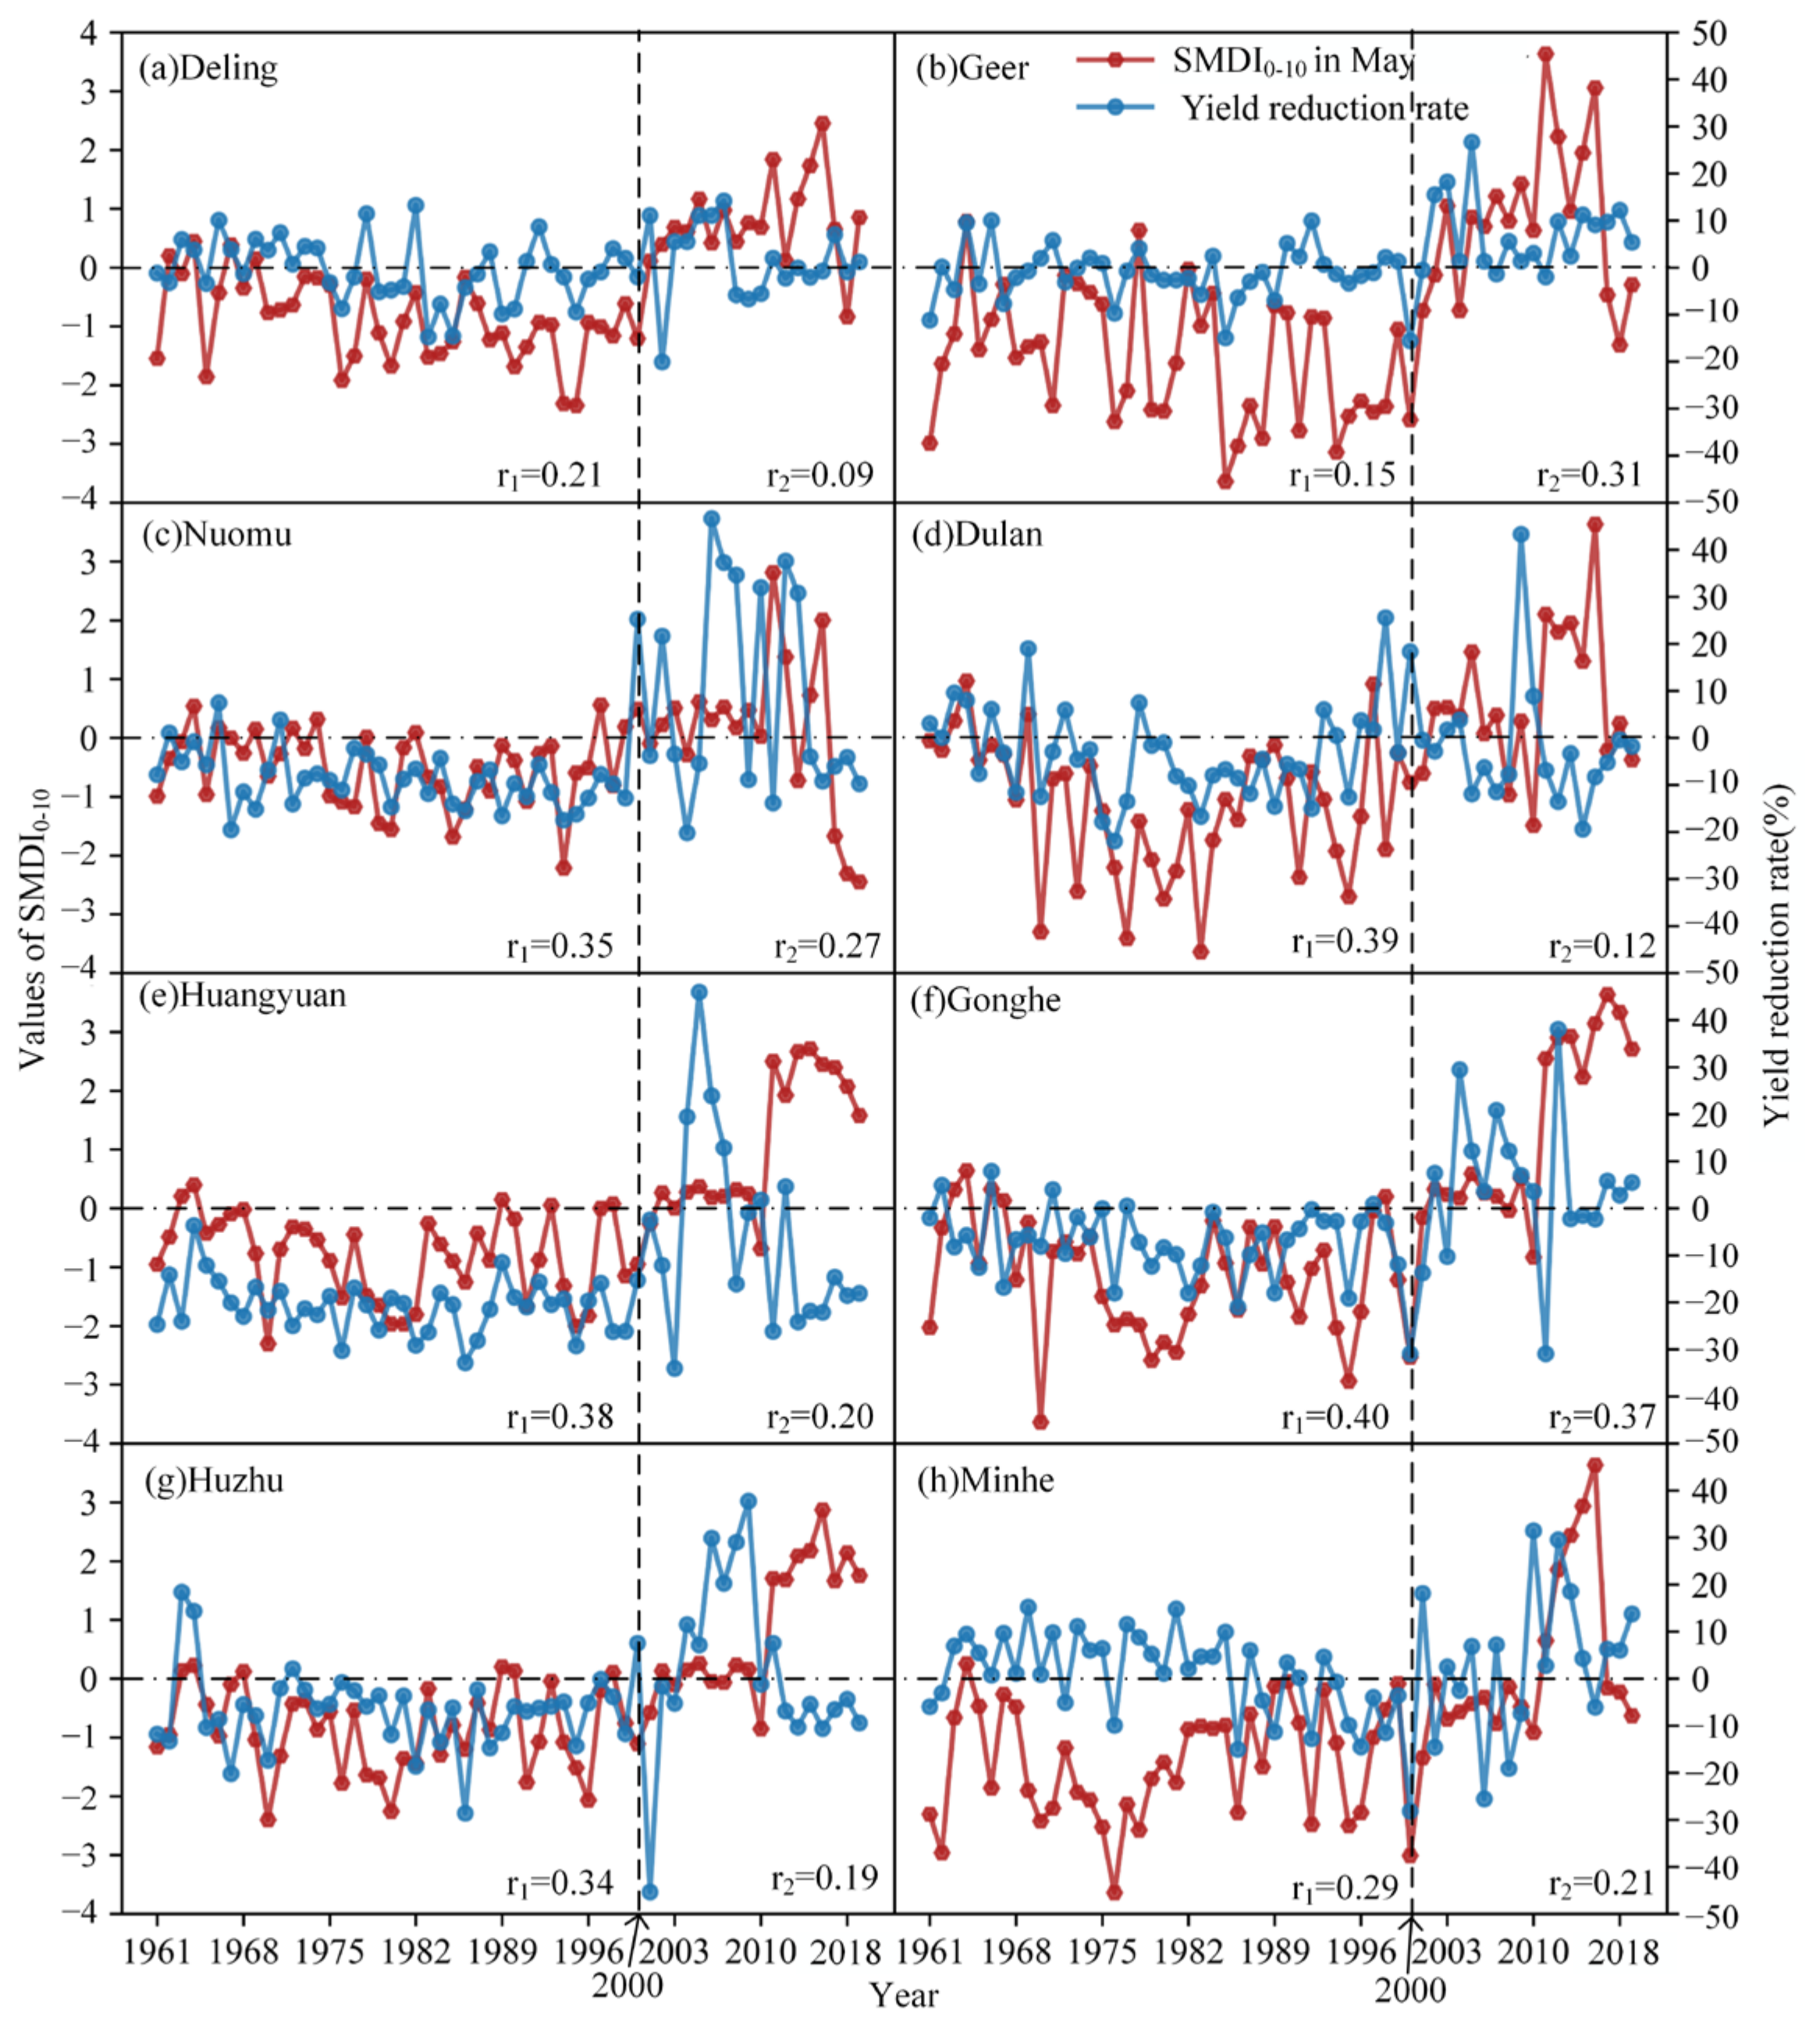
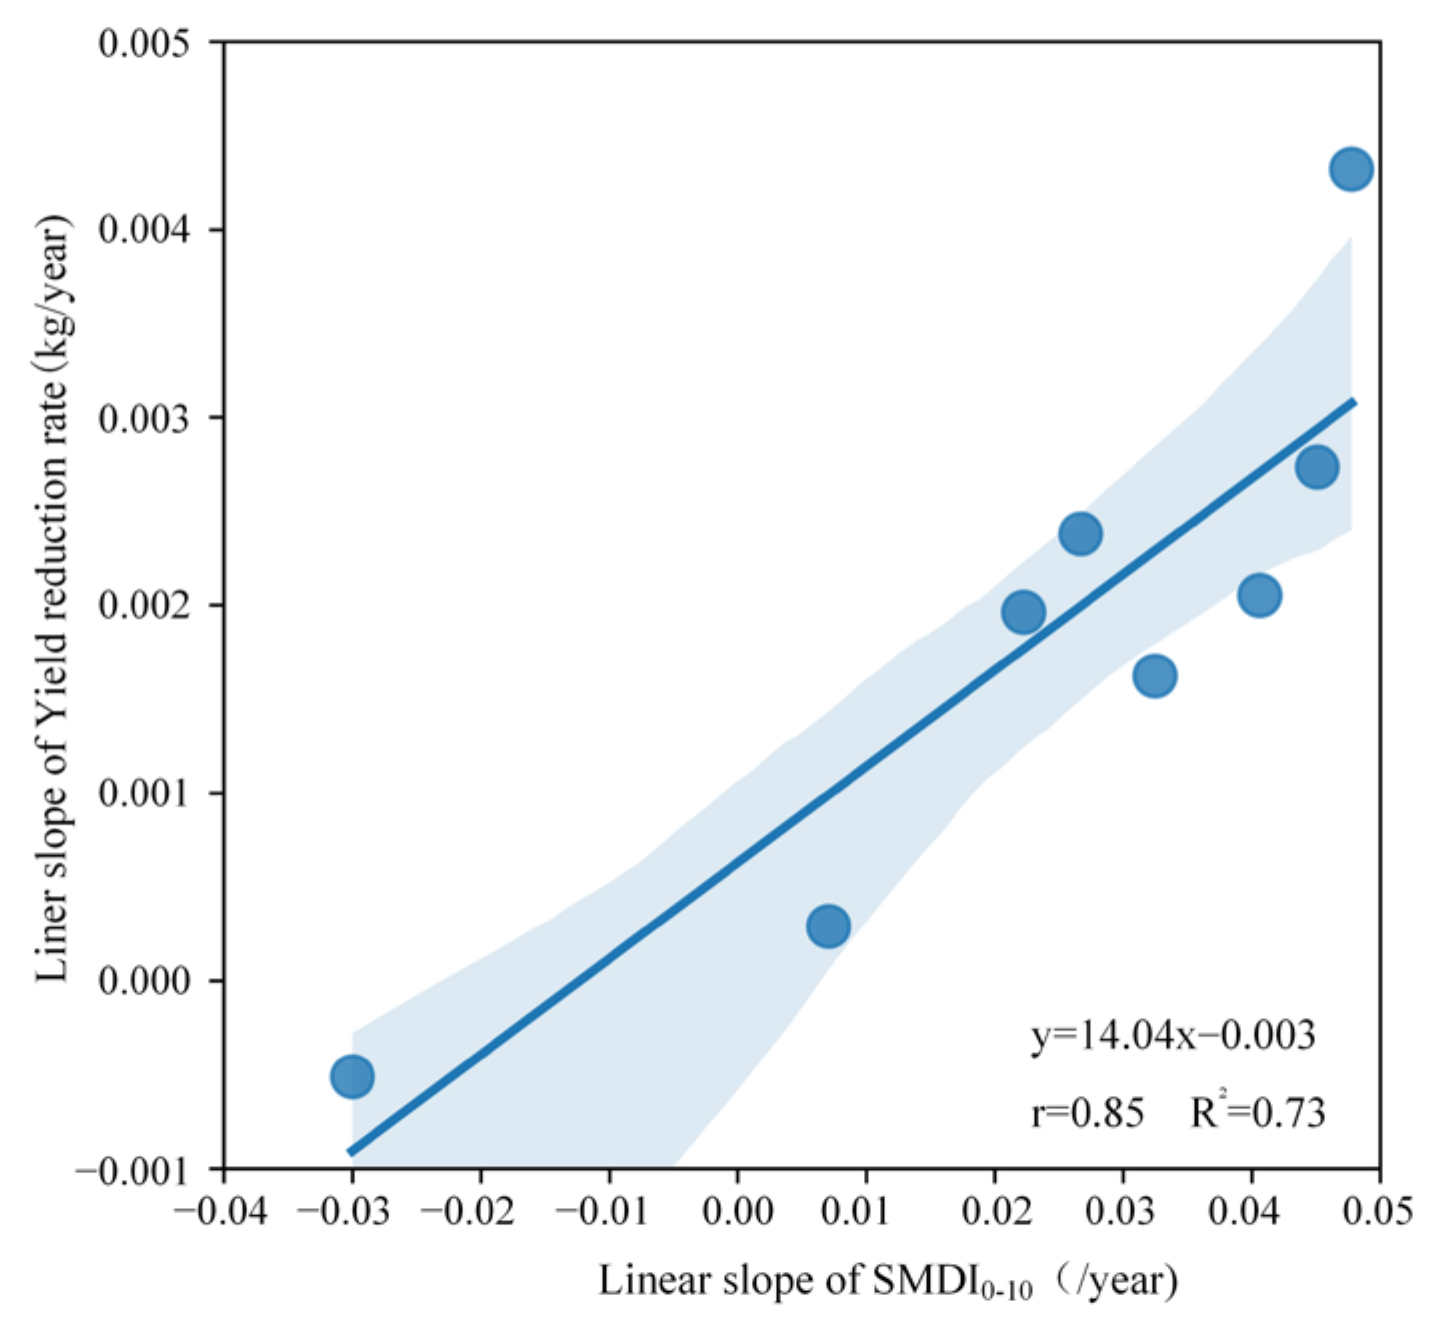
3.4. Variations of Yield Reduction Rate

From the above results, the 2-month SMDI0–10 timescale in May is a key parameter to investigate the impacts of droughts on spring wheat yields; therefore, the data for specific parameters (SMDI0–10, lagged by 2 months in May) are used for identifying normal and drought years, the average yield of normal years is used as the reference yield to further calculate the yield reduction rate in drought years.
The annual variations of the yield reduction rate and SMDI0–10 in May for the eight sites are shown in Figure 9. In the severe drought years recorded in 1961, 1976, 1980, 1995, and 1999, all eight sites showed severe yield reduction rates (−4% to −31%). The variations of SMDI0–10 were generally more consistent with the spring wheat yield reduction rate before 2001 for the r-values between production reduction rate and SMDI0–10 in May over 1961–2000 were higher than that in 1961–2018 (0.21–0.40, except the Geer site). However, the consistent extent of yield reduction rate with SMDI0–10 decreased after 2000 because Qinghai province has suffered extreme drought since its meteorological record, and although after 2000, the drought was relieved and tended to be wetter, the yield did not increase accordingly.
The relationships between linear slopes of 2-month SMDI0–10 in May and the yield reduction rate at the eight selected sites are illustrated in Figure 10. The linear slopes of 2-month SMDI0–10 in May and yield reduction rate ranged from −0.04/a to 0.05/a and from −0.001 kg/a to 0.005 kg/a, respectively. Additionally, the linear slopes of 2-month SMDI0–10 in May in seven out of eight sites were positive, indicating that the climate conditions have a tendency to become wet from 1961 to 2018. Moreover, there was a considerable linear relationship between them with r = 0.85, suggesting that the trend of SMDI0–10 in May was greatly consistent with the trend of spring wheat yield reduction rate from 1961–2018.

4. Discussions

4.1. The Relationship between SPEI and SMDI

Meteorological drought is usually the first stage of a drought event, acting as starting point or driver of agricultural drought, and the different types of drought are interrelated, but with some spatial variability and temporal phase differences. Wang and Duan [59] pointed out that the degree of meteorological drought was more severe than agricultural in terms of degree, and agricultural drought lagged behind meteorological drought. Sims et al. [60] proved that there was a correlation between meteorological drought indices (PDSI and SPI) and soil moisture. SMDI takes into account more variables (such as evapotranspiration, soil properties, and root depth) than SPEI. Yared et al. [61] found that SPEI-3 showed a higher correlation with the agricultural drought index SMDI, and SMDI showed a delay compared to SPEI when comparing the drought start dates indicated by historical droughts. Fan et al. [62] pointed out that less precipitation in arid areas was almost the only source of surface soil moisture, and higher evapotranspiration would quickly evaporate it. The correlations between meteorological drought indices and soil moisture were only reflected in the shallow soil that can receive precipitation. This study similarly indicated that SPEI generally had higher correlations with SMDI0–10, which lagged 1 or 2 months from May to August, but the correlations in March–April were not significant because the rainfall at the eight sites was concentrated in May–August but less in March–April, which may be not enough to supplement groundwater. The relationship between different drought indices has spatial–temporal variability and should be investigated for specific soil, climate and region conditions.

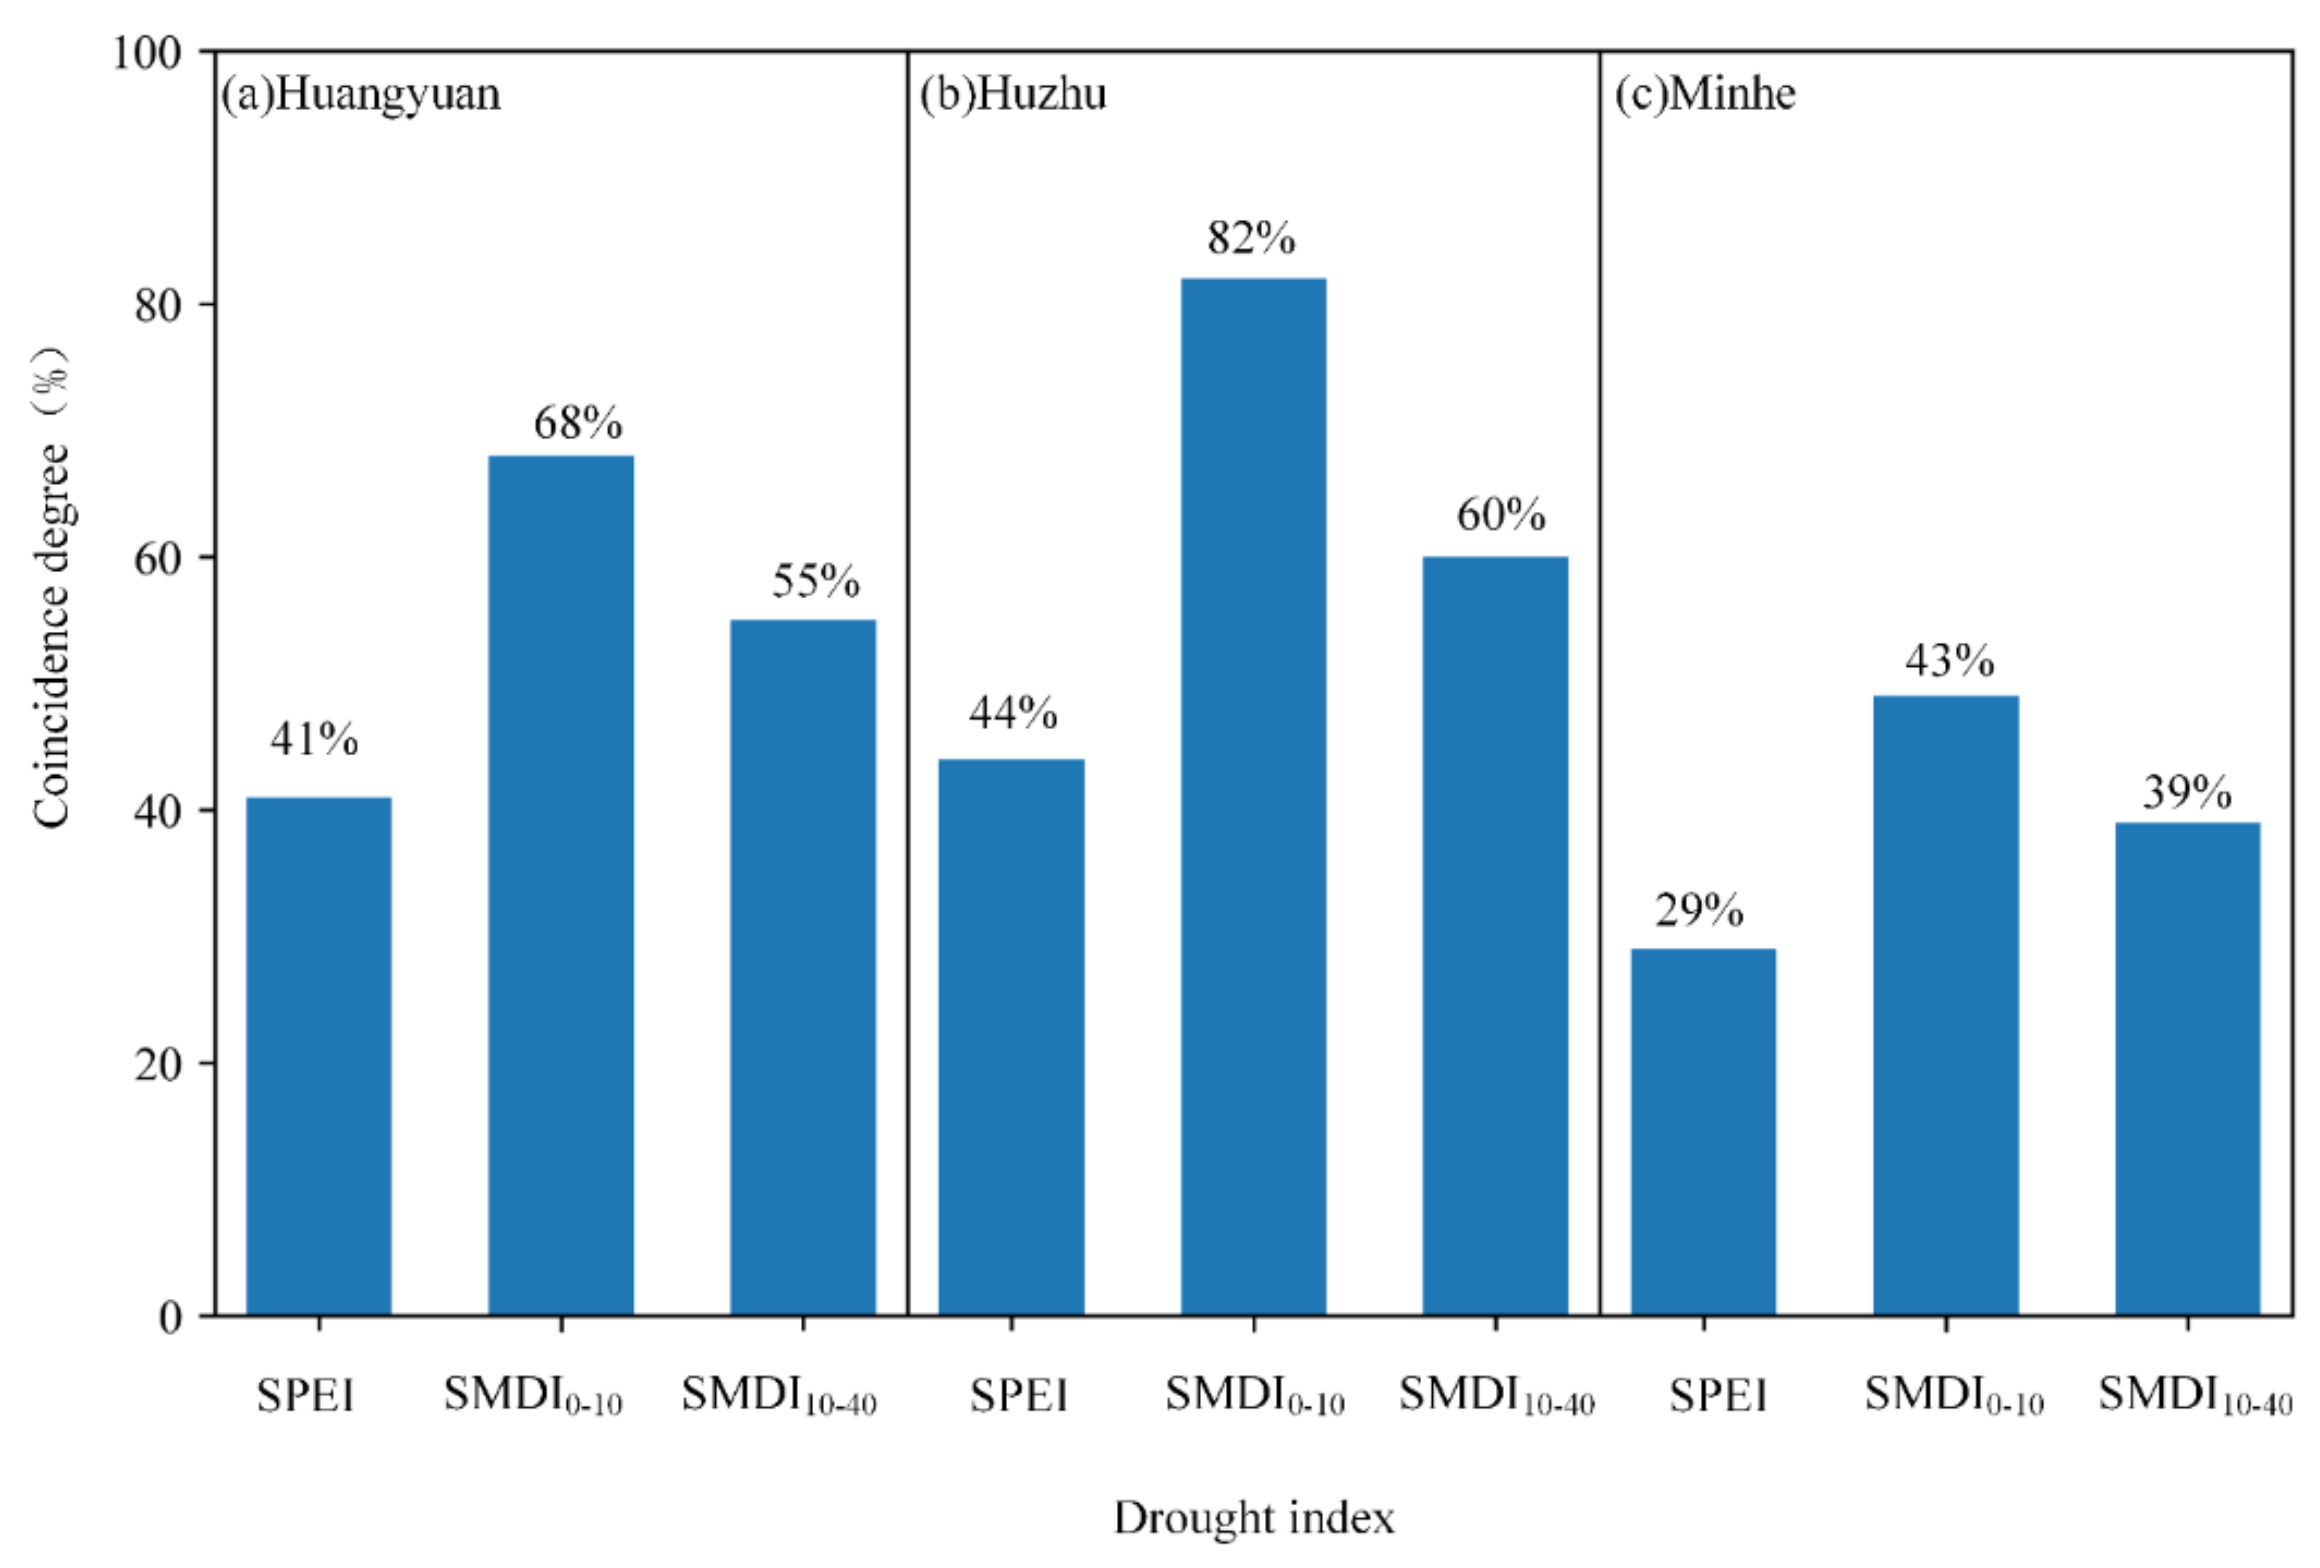
4.2. Better Drought Index for Monitoring Drought during Spring Wheat Growth

A number of drought indices could be applied to investigate drought conditions during the spring wheat growth period. Among them, soil moisture-related indices may be the more reliable index than the others. Previous research has shown that soil moisture (SM) variations (deficits or excesses) were the key factor affecting crop yield in rain-fed agriculture [63,64]. Roots are vital organs for plants, and the effective use of resources from the soil was important for yield stability [65]. Our research showed that the correlations between spring wheat LAImax/yields and SMDI0–10 were better than with SPEI, indicating high spring wheat growth sensitivity to soil moisture deficiency to provide the necessary water and nutrients for crop growth, which will affect the morphogenesis, physiological processes and yield formation of the aboveground parts [66].
However, the performance of SMDI in revealing crops’ drought responses varied with different depths. Zhang et al. [67] found that the root system of spring wheat in the dry land farming areas of central Gansu, China was the most at 0–10 cm in the seedling stage and the most at 10–30 cm in the flowering and maturity stages. Liao et al. [68] indicated that soil moisture could affect the growth of the root system and the planting area with lower soil moisture had smaller amounts of roots in the 0–20 cm soil layer. Sun et al. [69] found that the root system of spring wheat in the Southern Xinjiang was mainly distributed in the 0–40 cm soil layer and the root mass density and root length density decreased with depth. Jing et al. [70] suggested that 20 cm of irrigation could best overcome drought stress and that 40 cm of total water (precipitation and irrigation) was sufficient to maximize spring wheat production in the Canadian prairies. This research showed that SMDI0–10 was closely related to the growth of spring wheat and should be paid more attention to, but the correlations between LAImax/yield of spring wheat and SMDI10–40 were not as good as SMDI0–10. Although this research and others have found better performance of SMDI at 0–10 cm than SMDI at deeper depths and SPEI, how it performs for the other crops is unknown. Further studies are needed in furtherance to validate drought index performance in more conditions.

4.3. The Key Month and Timescales Reflecting Crop Responses to Drought

The impact of drought on spring wheat yields varied greatly due to the different drought levels in each growth period [71,72]. Kamali et al. [73] found a larger correlation between monthly SMDI and spring wheat yields from May to August. This period coincided with the reproductive stage of spring wheat development and was more susceptible to water stress. Wang et al. [74] pointed out that May to June were the heading and milking stages of spring wheat in the arid region and water availability had a very important influence on the growth of crops and the formation of grain yield. Yang et al. [75] indicated that wheat plant height growth was more sensitive in the jointing stage because the drought that occurred in the early stage of growth would force limited water and nutrients to the root system, promote root growth, and slow the growth of the shoots. Din et al. [76] pointed out that drought at the jointing stage significantly reduced the number of grains and decreased ear weight, which may be the main reason for the decline in yield. In this study, we found that the SMDI0–10 in May (the jointing period of spring wheat) had the best correlation with the spring wheat yields, indicating that the soil moisture deficit at the jointing stage had a more adverse effect on spring wheat yield.
In addition, previous studies of drought on crops focused primarily on single-year events [77] but not on whether the multi-year drought affects crop growth in subsequent years. Peck and Adams [78] demonstrated the importance of analyzing individual years of drought in the context of previous years of drought. Continued soil drought would reduce wheat plant yield and marked changes in quality. Our research results showed that in normal years after successive droughts, yields would also be reduced, indicating that the drought was a slow accumulation process; therefore, a perennial drought would have certain impacts on crop yields in the subsequent years.
Yields may also be affected by other factors such as climate ones (frost, floods, etc.) and management ones (sowing, fertilization, and irrigation) but were not taken into account in this research. Studies on the multi-factor impacts on crop yield reduction are still needed in the future.

5. Conclusions

The temporal variations of SMDI and SPEI at different timescales (which reflect dry or wet conditions) during the growth period of spring wheat between 1961 and 2018 were investigated for the eight selected sites in Qinghai, China. SPEI varied more randomly than SMDI. The variations of SPEI were not so consistent as SMDI0–10 and SMDI10–40. SPEI had higher correlations with SMDI0–10 at the lagged times of 1 and 2 months between May and August, with an increase in rainfall (0.35–0.68). SMDI0–10 reflected actual drought events better (coincidence degree 43–82%) than SPEI (29–44%) and SMDI10-40 (39–60%).
The DSSAT–CERES–Wheat model performed accurately in simulating the anthesis dates, maturation dates and meteorological yields of spring wheat. Through the correlation analysis of spring wheat yield vs. drought indices, SMDI0–10 better reflected drought events during the spring wheat growth period (0.21 < r < 0.37), and 2-month (among six timescales) was the key timescale that best identified the relationship between spring wheat yields and SMDI0–10. In addition, the drought in May had a severe impact on spring wheat growth and yields.
There were considerable correlations between the linear slopes of spring wheat yield reduction rate and linear slopes of SMDI0–10 in May at the studied eight sites (r = 0.85). However, the correlation between production reduction rate and SMDI0–10 was not as good as 1961–2000 (0.20 < r< 0.40) in 1961–2018 (0.09 < r < 0.37) due to the extreme drought in 2000. This study provides useful references for drought–resistance management.

Supplementary Materials

The following supporting information can be downloaded at: https://www.mdpi.com/article/10.3390/agronomy12071552/s1, Figure S1: Annual variations of monthly P, ET0, PET0 and SD over 1961–2018 at 8 studied sites of Deling; Figure S2: Temporal variations of the monthly SPEI or SMDI at the 1- to 6-month timescales during the spring wheat growing seasonsat 8 studied sites of Deling; Table S1: Spring wheat growth period in different sites of Qinghai, China; Table S2: Genetic coefficients of spring wheat at the selected 8 sites; Table S3: Pearson correlation coefficients (r) between LAImax and drought indices (SPEI, SMDI0–10 or SMDI10–40) at selected 8 sites. (** represents p-value ≤ 0.05, and * represents p-value ≤ 0.1); Table S4: Pearson correlation coefficients (r) between the climatic yield and drought indices (SPEI, SMDI0–10 or SMDI10–40) at selected 8 sites. (** represents p-value ≤ 0.05, and * represents p-value ≤ 0.1).

Author Contributions

Methodology, M.H.; validation, N.Y.; formal analysis, N.Y.; investigation, A.B.; resources, Y.L.; data curation, M.H.; writing—original draft preparation, M.H.; writing—review and editing, Y.L., F.L. and I.H.; supervision, A.P. All authors have read and agreed to the published version of the manuscript.

Funding

This research was funded by [Key Research and Development Program of China] grant number [No. 2019YFA0606902]. And the APC was funded by [National Natural Science Foundation of China] grant number [No. 52079114].

Institutional Review Board Statement

No applicable.

Informed Consent Statement

No applicable.

Conflicts of Interest

The authors declare no conflict of interest.

Abbreviations

SPEI: Standardized precipitation evapotranspiration index; SMDI, Soil moisture deficit index; DSSAT, Decision support system for agrotechnology transfer; GLDAS, Global land data assimilation system; SAT, Saturated moisture content; WP, Soil water content at the permanent wilting point; FC, Soil water content at the field capacity; SHC, Saturated hydraulic conductivity; P, Precipitation; ET0, Reference crop evapotranspiration; GLUE, Generalized likelihood uncertainty estimation; R2, Coefficient of determination; RRMSE, Relative root mean square error; r, Pearson correlation coefficient; Tmax, maximum temperature; Tmin, minimum temperature; U2, wind speed measured at 2 m height; RH, Average relative humidity; n, sunshine hours.

References

  1. Hamal, K.; Sharma, S.; Khadka, N.; Haile, G.G.; Joshi, B.B.; Xu, T.L.; Dawadi, B. Assessment of drought impacts on crop yields across Nepal during 1987–2017. Meteorol. Appl. 2020, 27, e1950. [Google Scholar] [CrossRef]
  2. Pais, I.P.; Reboredo, F.H.; Ramalho, J.C.; Pessoa, M.F.; Lidon, F.C.; Silva, M.M. Potential impacts of climate change on agriculture—A review. Emir. J. Food Agric. 2020, 32, 397–407. [Google Scholar] [CrossRef]
  3. Zarei, A.R.; Moghimi, M.M. Modified version for SPEI to evaluate and modeling the agricultural drought severity. Int. J. Biometeorol. 2019, 63, 911–925. [Google Scholar] [CrossRef] [PubMed]
  4. Bowling, L.C.; Cherkauer, K.A.; Lee, C.I.; Beckerman, J.L.; Brouder, S.; Buzan, J.R.; Doering, O.C.; Dukes, J.S.; Ebner, P.D.; Frankenberger, J.R.; et al. Agricultural impacts of climate change in Indiana and potential adaptations. Clim. Change 2020, 163, 2005–2027. [Google Scholar] [CrossRef]
  5. Montiel-González, C.; Montiel, C.; Ortega, A.; Pacheco, A.; Bautista, F. Development and validation of climatic hazard indicators for roselle (Hibiscus sabdariffa L.) crop in dryland agriculture. Ecol. Indic. 2021, 121, 107140. [Google Scholar] [CrossRef]
  6. Aghili, F.; Gamper, H.A.; Eikenberg, J.; Khoshgoftarmanesh, A.H.; Afyuni, M.; Schulin, R.; Jansa, J.; Frossard, E. Green manure addition to soil increases grain zinc concentration in bread wheat. PLoS ONE 2014, 9, e101487. [Google Scholar] [CrossRef]
  7. Camaille, M.; Fabre, N.; Clement, C.; Ait Barka, E. Advances in Wheat Physiology in Response to Drought and the Role of Plant Growth Promoting Rhizobacteria to Trigger Drought Tolerance. Microorganisms 2021, 9, 687. [Google Scholar] [CrossRef]
  8. Daryanto, S.; Wang, L.; Jacinthe, P.A. Global Synthesis of Drought Effects on Maize and Wheat Production. PLoS ONE 2016, 11, e0156362. [Google Scholar] [CrossRef]
  9. Madadgar, S.; AghaKouchak, A.; Farahmand, A.; Davis, S.J. Probabilistic estimates of drought impacts on agricultural production. Geophys. Res. Lett. 2017, 44, 7799–7807. [Google Scholar] [CrossRef]
  10. Araneda-Cabrera, R.J.; Bermudez, M.; Puertas, J. Assessment of the performance of drought indices for explaining crop yield variability at the national scale: Methodological framework and application to Mozambique. Agric. Water Manag. 2021, 246, 106692. [Google Scholar] [CrossRef]
  11. Li, Y.; Dong, Y.; Yin, D.Q.; Liu, D.Y.; Wang, P.X.; Huang, J.X.; Liu, Z.; Wang, H.S. Evaluation of Drought Monitoring Effect of Winter Wheat in Henan Province of China Based on Multi-Source Data. Sustainability 2020, 12, 2801. [Google Scholar] [CrossRef] [Green Version]
  12. Wu, R.J.; Liu, Y.B.; Xing, X.Y. Evaluation of evapotranspiration deficit index for agricultural drought monitoring in North China. J. Hydrol. 2021, 596, 126057. [Google Scholar] [CrossRef]
  13. Yang, G.-X.; Zhao, G.-C.; Xu, K.; Chang, X.-H.; Yang, Y.-S.; Ma, S.-K. Effects of Irrigation and Chemical Control on Grain Filling and Chlorophyll Content in Wheat with Different Grain Colors. Agric. N. China 2010, 25, 152–157, (In Chinese with English abstract). [Google Scholar] [CrossRef]
  14. Palmer, W.C. Meteorological Drought; US Department of Commerce Weather Bureau Research Paper: Washington, DC, USA, 1965; 59p.
  15. McKee, T.B.; Doesken, N.J.; Kleist, J. The Relationship of Drought Frequency and Duration to Time Scales. In Proceedings of the 8th Conference on Applied Climatology, Anaheim, CA, USA, 17–22 January 1993. [Google Scholar]
  16. Tsakiris, G.; Vangelis, H. Establishing a Drought Index Incorporating Evapotranspiration. Eur. Water 2005, 9, 3–11. [Google Scholar]
  17. Vicente-Serrano, S.M.; Begueria, S.; Lopez-Moreno, J.I. A Multiscalar Drought Index Sensitive to Global Warming: The Standardized Precipitation Evapotranspiration Index. J. Clim. 2010, 23, 1696–1718. [Google Scholar] [CrossRef] [Green Version]
  18. Ayantobo, O.O.; Li, Y.; Song, S.B.; Javed, T.; Yao, N. Probabilistic modelling of drought events in China via 2-dimensional joint copula. J. Hydrol. 2018, 559, 373–391. [Google Scholar] [CrossRef]
  19. Salehnia, N.; Salehnia, N.; Torshizi, A.S.; Kolsoumi, S. Rainfed wheat (Triticum aestivum L.) yield prediction using economical, meteorological, and drought indicators through pooled panel data and statistical downscaling. Ecol. Indic. 2020, 111, 105991. [Google Scholar] [CrossRef]
  20. Njouenwet, I.; Vondou, D.A.; Dassou, E.F.; Ayugi, B.O.; Nouayou, R. Assessment of agricultural drought during crop-growing season in the Sudano-Sahelian region of Cameroon. Nat. Hazards 2021, 106, 561–577. [Google Scholar] [CrossRef]
  21. Pena-Gallardo, M.; Vicente-Serrano, S.M.; Quiring, S.; Svoboda, M.; Hannaford, J.; Tomas-Burguera, M.; Martin-Hernandez, N.; Dominguez-Castro, F.; El Kenawy, A. Response of crop yield to different time-scales of drought in the United States: Spatio-temporal patterns and climatic and environmental drivers. Agric. For. Meteorol. 2019, 264, 40–55. [Google Scholar] [CrossRef] [Green Version]
  22. Keshavarz, M.R.; Vazifedoust, M.; Alizadeh, A. Drought monitoring using a Soil Wetness Deficit Index (SWDI) derived from MODIS satellite data. Agric. Water Manag. 2014, 132, 37–45. [Google Scholar] [CrossRef]
  23. Anderson, M.C.; Hain, C.; Wardlow, B.; Pimstein, A.; Mecikalski, J.R.; Kustas, W.P. Evaluation of Drought Indices Based on Thermal Remote Sensing of Evapotranspiration over the Continental United States. J. Clim. 2011, 24, 2025–2044. [Google Scholar] [CrossRef]
  24. Wang, A.H.; Lettenmaier, D.P.; Sheffield, J. Soil Moisture Drought in China, 1950–2006. J. Clim. 2011, 24, 3257–3271. [Google Scholar] [CrossRef]
  25. Dai, A.G. Drought under global warming: A review. Wiley Interdiscip. Rev.-Clim. Chang. 2011, 2, 45–65. [Google Scholar] [CrossRef] [Green Version]
  26. Palmer, W.C. Keeping Track of Crop Moisture Conditions, Nationwide: The New Crop Moisture Index. Weatherwise 1968, 21, 156–161. [Google Scholar] [CrossRef]
  27. Pauwels, V.R.N.; Wood, E.F. The importance of classification differences and spatial resolution of land cover data in the uncertainty in model results over boreal ecosystems. J. Hydrometeorol. 2000, 1, 255–266. [Google Scholar] [CrossRef]
  28. Dutra, E.; Viterbo, P.; Miranda, P.M.A. ERA-40 reanalysis hydrological applications in the characterization of regional drought. Geophys. Res. Lett. 2008, 35, 116–122. [Google Scholar] [CrossRef]
  29. Sheffield, J.; Andreadis, K.M.; Wood, E.F.; Lettenmaier, D.P. Global and Continental Drought in the Second Half of the Twentieth Century: Severity-Area-Duration Analysis and Temporal Variability of Large-Scale Events. J. Clim. 2009, 22, 1962–1981. [Google Scholar] [CrossRef]
  30. Köksal, E.S. Irrigation water management with water deficit index calculated based on oblique viewed surface temperature. Irrig. Sci. 2008, 27, 41–56. [Google Scholar] [CrossRef]
  31. Chen, X.G.; Li, Y.; Yao, N.; Liu, D.L.; Javed, T.; Liu, C.C.; Liu, F.G. Impacts of multi-timescale SPEI and SMDI variations on winter wheat yields. Agric. Syst. 2020, 185, 102955. [Google Scholar] [CrossRef]
  32. Abowarda, A.S.; Bai, L.; Zhang, C.; Long, D.; Li, X.; Huang, Q.; Sun, Z. Generating surface soil moisture at 30 m spatial resolution using both data fusion and machine learning toward better water resources management at the field scale. Remote Sens. Environ. 2021, 255, 112301. [Google Scholar] [CrossRef]
  33. Hong, M.; Lee, S.H.; Lee, S.J.; Choi, J.Y. Application of high-resolution meteorological data from NCAM-WRF to characterize agricultural drought in small-scale farmlands based on soil moisture deficit. Agric. Water Manag. 2021, 243, 106494. [Google Scholar] [CrossRef]
  34. Narasimhan, B.; Srinivasan, R. Development and evaluation of Soil Moisture Deficit Index (SMDI) and Evapotranspiration Deficit Index (ETDI) for agricultural drought monitoring. Agric. For. Meteorol. 2005, 133, 69–88. [Google Scholar] [CrossRef]
  35. Shin, Y.C.; Jung, Y.H. Development of Irrigation Water Management Model for Reducing Drought Severity Using Remotely Sensed Soil Moisture Footprints. J. Irrig. Drain. Eng. 2014, 140, 04014021. [Google Scholar] [CrossRef]
  36. Pablos, M.; Martinez-Fernandez, J.; Sanchez, N.; Gonzalez-Zamora, A. Temporal and Spatial Comparison of Agricultural Drought Indices from Moderate Resolution Satellite Soil Moisture Data over Northwest Spain. Remote Sens. 2017, 9, 1168. [Google Scholar] [CrossRef] [Green Version]
  37. Marshall, M.; Tu, K.; Andreo, V. On Parameterizing Soil Evaporation in a Direct Remote Sensing Model of ET: PT-JPL. Water Resour. Res. 2020, 56, e2019WR026290. [Google Scholar] [CrossRef]
  38. Nepal, S.; Pradhananga, S.; Shrestha, N.K.; Kralisch, S.; Shrestha, J.P.; Fink, M. Space-time variability in soil moisture droughts in the Himalayan region. Hydrol. Earth Syst. Sci. 2021, 25, 1761–1783. [Google Scholar] [CrossRef]
  39. Wu, R.J.; Li, Q. Assessing the soil moisture drought index for agricultural drought monitoring based on green vegetation fraction retrieval methods. Nat. Hazards 2021, 108, 499–518. [Google Scholar] [CrossRef]
  40. Qian, B.D.; Wang, H.; He, Y.; Liu, J.G.; De Jong, R. Projecting spring wheat yield changes on the Canadian Prairies: Effects of resolutions of a regional climate model and statistical processing. Int. J. Climatol. 2016, 36, 3492–3506. [Google Scholar] [CrossRef] [Green Version]
  41. Wang, Q.; Wu, J.; Li, X.; Zhou, H.; Yang, J.; Geng, G.; An, X.; Liu, L.; Tang, Z. A comprehensively quantitative method of evaluating the impact of drought on crop yield using daily multi-scale SPEI and crop growth process model. Int. J. Biometeorol. 2017, 61, 685–699. [Google Scholar] [CrossRef]
  42. Strer, M.; Svoboda, N.; Herrmann, A. Abundance of adverse environmental conditions during critical stages of crop production in Northern Germany. Environ. Sci. Eur. 2018, 30, 10. [Google Scholar] [CrossRef] [Green Version]
  43. Porter, J.R. AFRCWHEAT2: A model of the growth and development of wheat incorporating responses to water and nitrogen. Eur. J. Agron. 1993, 2, 69–82. [Google Scholar] [CrossRef]
  44. Jamieson, P.D.; Porter, J.R.; Goudriaan, J.; Ritchie, J.T.; van Keulen, H.; Stol, W. A comparison of the models AFRCWHEAT2, CERES-wheat, Sirius, SUCROS2 and SWHEAT with measurements from wheat grown under drought. Field Crops Res. 1998, 55, 23–44. [Google Scholar] [CrossRef]
  45. Jones, J.W.; Hoogenboom, G.; Porter, C.H.; Boote, K.J.; Batchelor, W.D.; Hunt, L.A.; Wilkens, P.W.; Singh, U.; Gijsman, A.J.; Ritchie, J.T. The DSSAT cropping system model. Eur. J. Agron. 2003, 18, 235–265. [Google Scholar] [CrossRef]
  46. Van Laar, H.; Goudriaan, J.; van Keulen, H. Simulation of Crop Growth for Potential and Water—Limited Production Situations: As Applied to Spring Wheat; Wageningen Cabo Dlo P: Wageningen, The Netherlands, 1992. [Google Scholar]
  47. Li, Z.H.; He, J.Q.; Xu, X.G.; Jin, X.L.; Huang, W.J.; Clark, B.; Yang, G.J.; Li, Z.H. Estimating genetic parameters of DSSAT-CERES model with the GLUE method for winter wheat (Triticum aestivum L.) production. Comput. Electron. Agric. 2018, 154, 213–221. [Google Scholar] [CrossRef] [Green Version]
  48. Qu, C.H.; Li, X.X.; Ju, H.; Liu, Q. The impacts of climate change on wheat yield in the Huang-Huai-Hai Plain of China using DSSAT-CERES-Wheat model under different climate scenarios. J. Integr. Agric. 2019, 18, 1379–1391. [Google Scholar] [CrossRef]
  49. Singh, M. Calibration and Validation of CERES-Wheat model in North Eastern Plain Zone (NEPZ) of India. Int. J. Agric. Environ. Biotechnol. 2020, 13, 192–196. [Google Scholar] [CrossRef]
  50. Kothari, K.; Ale, S.; Attia, A.; Rajan, N.; Xue, Q.W.; Munster, C.L. Potential climate change adaptation strategies for winter wheat production in the Texas High Plains. Agric. Water Manag. 2019, 225, 105764. [Google Scholar] [CrossRef]
  51. Jiang, T.C.; Dou, Z.H.; Liu, J.; Gao, Y.J.; Malone, R.W.; Chen, S.; Feng, H.; Yu, Q.; Xue, G.N.; He, J.Q. Simulating the Influences of Soil Water Stress on Leaf Expansion and Senescence of Winter Wheat. Agric. For. Meteorol. 2020, 291, 108061. [Google Scholar] [CrossRef]
  52. Saddique, Q.; Zou, Y.; Ajaz, A.; Ji, J.; Xu, J.; Azmat, M.; Rahman, M.H.U.; He, J.; Cai, H. Analyzing the Performance and Application of Ceres-Wheat and Apsim in the Guanzhong Plain, China. Trans. Asabe 2020, 63, 1879–1893. [Google Scholar] [CrossRef]
  53. Yao, T.; Zhao, Q.; Li, X.Y.; Shen, Z.T.; Ran, P.Y.; Wu, W. Spatiotemporal variations of multi-scale drought in Shandong Province from 1961 to 2017. Water Supply 2021, 21, 525–541. [Google Scholar] [CrossRef]
  54. Yue, Y.J.; Wang, L.; Li, J.; Zhu, A.X. An EPIC model-based wheat drought risk assessment using new climate scenarios in China. Clim. Change 2018, 147, 539–553. [Google Scholar] [CrossRef]
  55. Liu, Z.; Zhou, P.; Zhang, F.; Liu, X.; Chen, G. Spatiotemporal characteristics of dryness/wetness conditions across Qinghai Province, Northwest China. Agric. For. Meteorol. 2013, 182–183, 101–108. [Google Scholar] [CrossRef]
  56. Yang, H.; Xiao, H.; Guo, C.; Sun, Y. Spatial-temporal analysis of precipitation variability in Qinghai Province, China. Atmos. Res. 2019, 228, 242–260. [Google Scholar] [CrossRef]
  57. Dai, Y.J.; Shangguan, W.; Duan, Q.Y.; Liu, B.Y.; Fu, S.H.; Niu, G. Development of a China Dataset of Soil Hydraulic Parameters Using Pedotransfer Functions for Land Surface Modeling. J. Hydrometeorol. 2013, 14, 869–887. [Google Scholar] [CrossRef] [Green Version]
  58. Testa, G.; Gresta, F.; Cosentino, S.L. Dry matter and qualitative characteristics of alfalfa as affected by harvest times and soil water content. Eur. J. Agron. 2011, 34, 144–152. [Google Scholar] [CrossRef]
  59. Wang, W.; Duan, Y. Study on the Soil Moisture Change During Continuous Drought in Winter of 2010 and Spring of 2011 in the Middle and Lower Reaches of Yangtze River. J. Arid Meteorol. 2012, 30, 305–314, (In Chinese with English abstract). [Google Scholar]
  60. Sims, A.P.; Niyogi, D.D.S.; Raman, S. Adopting drought indices for estimating soil moisture: A North Carolina case study. Geophys. Res. Lett. 2002, 29, 24-1–24-4. [Google Scholar] [CrossRef] [Green Version]
  61. Yared, B.; Shreedhar, M.; Tsegaye, T.; Schalk, V.A.; Semu, M.; Ann, V.G.; Dimitri, S. Comparison of the Performance of Six Drought Indices in Characterizing Historical Drought for the Upper Blue Nile Basin, Ethiopia. Geosciences 2018, 8, 81. [Google Scholar]
  62. Fan, J.; Tan, S.; Wang, D.; Luo, Y.; Zhang, J.; Geng, H. Effects on Coupling Relationship Between Meteorological Drought and Agricultural Drought. Chin. Agric. Sci. Bull. 2020, 36, 83–92, (In Chinese with English abstract). [Google Scholar]
  63. White, J.; Berg, A.A.; Champagne, C.; Warland, J.; Zhang, Y.S. Canola yield sensitivity to climate indicators and passive microwave-derived soil moisture estimates in Saskatchewan, Canada. Agric. For. Meteorol. 2019, 268, 354–362. [Google Scholar] [CrossRef]
  64. Piniewski, M.; Marcinkowski, P.; O’Keeffe, J.; Szczesniak, M.; Nierobca, A.; Kozyra, J.; Kundzewicz, Z.W.; Okruszko, T. Model-based reconstruction and projections of soil moisture anomalies and crop losses in Poland. Theor. Appl. Climatol. 2020, 140, 691–708. [Google Scholar] [CrossRef] [Green Version]
  65. Svane, S.F.; Jensen, C.S.; Thorup-Kristensen, K. Construction of a large-scale semi-field facility to study genotypic differences in deep root growth and resources acquisition. Plant. Methods 2019, 15, 26. [Google Scholar] [CrossRef] [Green Version]
  66. Li, X.; Liu, L.; Duan, Z.; Wang, N. Spatio-temporal variability in remotely sensed surface soil moisture and its relationship with precipitation and evapotranspiration during the growing season in the Loess Plateau, China. Environ. Earth Sci. 2013, 71, 1809–1820. [Google Scholar] [CrossRef]
  67. Zhang, M.J.; Xie, J.H.; Li, L.L.; Peng, Z.K.; Ren, J.H. Effects of tillage practices on root spatial distribution and yield of spring wheat and pea in the dry land farming areas of central Gansu, China. Chin. J. Appl. Ecol. 2017, 28, 3917–3925, (In Chinese with English abstract). [Google Scholar]
  68. Liao, R.; Liu, J.; Bai, Y.; Shunqing, A.; Liang, H.; Lu, J.; Zhangyan, L.; Cao, Y. Spatial distribution of winter wheat root in soil under field condition in North China plain. J. Meteorol. Environ. 2014, 30, 83–89, (In Chinese with English abstract). [Google Scholar]
  69. Sun, T.; Zhang, D.; Zhang, J.; Zhang, J.; Shi, Y.; Aili, B.; Zhu, J. Effects of drip irrigation and nitrogen application on root growth and yield of spring wheat in Southern Xinjiang. Agric. Res. Arid. Areas 2020, 38, 11–20, (In Chinese with English abstract). [Google Scholar]
  70. Jing, Q.; McConkey, B.; Qian, B.D.; Smith, W.; Grant, B.; Shang, J.L.; Liu, J.G.; Bindraban, P.; St Luce, M. Assessing water management effects on spring wheat yield in the Canadian Prairies using DSSAT wheat models. Agric. Water Manag. 2021, 244, 106591. [Google Scholar] [CrossRef]
  71. Shao, H.B.; Chu, L.Y.; Jaleel, C.A.; Manivannan, P.; Panneerselvam, R.; Shao, M.A. Understanding water deficit stress-induced changes in the basic metabolism of higher plants-biotechnologically and sustainably improving agriculture and the ecoenvironment in arid regions of the globe. Crit. Rev. Biotechnol. 2009, 29, 131–151. [Google Scholar] [CrossRef]
  72. Yang, S.E.; Wu, B.F. Calculation of monthly precipitation anomaly percentage using web-serviced remote sensing data. In Proceedings of the International Conference on Advanced Computer Control, Shenyang, China, 27–29 March 2010. [Google Scholar] [CrossRef]
  73. Kamali, B.; Abbaspour, K.C.; Lehmann, A.; Wehrli, B.; Yang, H. Indentifacation of spatiotumporal patterns of biophysical droughts in semi-arid:a case study of the Karkheh river basin in Iran. EGU Gen. Assem. Conf. Abstr. 2015, 12, 5187–5217. [Google Scholar] [CrossRef] [Green Version]
  74. Wang, J.S.; Feng, J.Y.; Yang, L.F.; Guo, J.Y.; Pu, Z.X. Runoff-denoted drought index and its relationship to the yields of spring wheat in the arid area of Hexi corridor, Northwest China. Agric. Water Manag. 2009, 96, 666–676. [Google Scholar] [CrossRef]
  75. Yang, Y.; Shen, S.; Wang, R.; Zhao, H. Effect of Drought Stress on Growth and Yield of Spring Wheat in Semi-arid Rainfed Area. Jiangsu Agric. Sci. 2019, 47, 82–85, (In Chinese with English abstract). [Google Scholar]
  76. Ding, J.; Huang, Z.; Zhu, M.; Li, C.; Zhu, X.; Guo, W. Does cyclic water stress damage wheat yield more than a single stress? PLoS ONE 2018, 13, e0195535. [Google Scholar] [CrossRef] [Green Version]
  77. Ancev, T. Multiyear versus single-year drought: A comment on Peck and Adams. Aust. J. Agric. Resour. Econ. 2011, 55, 451–453. [Google Scholar] [CrossRef]
  78. Peck, D.E.; Adams, R.M. Farm-level impacts of prolonged drought: Is a multiyear event more than the sum of its parts? Aust. J. Agric. Resour. Econ. 2010, 54, 43–60. [Google Scholar] [CrossRef] [Green Version]
Figure 1. Spatial distribution of elevation and spring wheat sites in Qinghai of China.
Agronomy 12 01552 g001
Figure 2. The overall technology roadmap of the research.
Agronomy 12 01552 g002
Figure 3. Variations of monthly P, ET0, PET0 and soil moisture over 1961–2018 at Gonghe site.
Agronomy 12 01552 g003
Figure 4. Temporal variations of the monthly SPEI, SMDI0–10 and SMDI10–40 at the 1- to 6-month timescales during the growing seasons of spring wheat at the Gonghe site.
Agronomy 12 01552 g004
Figure 5. The r values between SPEI and SMDI0–10 (ac) or SPEI and SMDI10–40 (df) at the 1, 3 and 6-month timescales with lagged time of 0 to 5 months during growth period of spring wheat (March to August).
Agronomy 12 01552 g005
Figure 6. Coincidence degrees of identified drought events based on the selected drought indices.
Agronomy 12 01552 g006
Figure 7. Comparison of the observed and simulated values of anthesis date, maturity date and yield for spring wheat for calibrated and validated processes.
Agronomy 12 01552 g007
Figure 8. The annual variations of simulated (climatic) yields over 1961–2018 for the 8 selected sites. ((a) The 4 sites in the figure are located in the Qaidam Basin, and (b) the 4 sites in the figure are located in eastern Qinghai Province).
Agronomy 12 01552 g008
Figure 9. Annual Variations of yield reduction rate vs. 2-month-timescale SMDI0–10 in May at the selected 8 sites over 1961–2018. r1 and r2 mean the Pearson correlation coefficients between production reduction rate and SMDI0–10 in May in 1961–2000 and 1961–2018.
Agronomy 12 01552 g009
Figure 10. Variations in the linear slopes of spring wheat yield reduction rate vs. the 2-month SMDI0–10 in May. (The shaded area represents 95 confidence interval).
Agronomy 12 01552 g010
Table 1. Spring wheat growth period at 8 sites of Qinghai, China.
SiteGrowth Period
SowingEmergenceJointingHeadingMilk MaturityMaturity
Minhe28 Mar.09 Apr.17 May12 Jun.09 Jul.26 Jul.
Ledu11 Mar.05 Apr.19 May10 Jun.15 Jul.30 Jul.
Huangyuan31 Mar.26 Apr.07 May02 Jul.07 Jul.03 Sep.
Huzhu01 Apr.23 Apr.10 Jun.05 Jul.04 Aug.02 Sep.
Guide07 Mar.02 Apr.17 May10 Jun.15 Jul.30 Jul.
Datong28 Mar.22 Apr.05 Jun.01 Jul.05 Aug.01 Sep.
Xunhua28 Feb.28 Mar.14 May30 May30 Jun.22 Jul.
Tongren20 Mar.13 Apr.03 May24 Jun.24 Jul.15 Aug.
Table 2. Dry/wet condition classification based on SPEI and SMDI.
Dry/Wet Severity LevelRange of SPEIRange of SMDI
Extreme wet2 ≤ SPEI2≤ SMDI
Severe wet1.5 ≤ SPEI < 21.5 ≤ SMDI < 2
Moderate wet1 ≤ SPEI < 1.51≤ SMDI < 1.5
Mild wet0.5 ≤ SPEI < 10.5 ≤ SMDI < 1
Normal−0.5 < SPEI < 0.5−0.5 < SMDI < 0.5
Mild dry−1 < SPEI ≤ −0.5−1 < SMDI ≤ −0.5
Moderate dry−1.5 < SPEI ≤ −1−1.5 < SMDI ≤ −1
Severe dry−2 < SPEI≤ −1.5−2< SMDI ≤ −1.5
Extreme drySPEI≤ −2SMDI ≤ −2
Table 3. Genetic coefficients of spring wheat at the selected 8 sites.
SiteSpring Wheat Parameter
P1VP1DP5G1G2G3PHINT
Deling19.7238.59783.816.7637.681.76472.56
Geer19.7033.76799.917.0645.981.73161.30
Dulan19.1239.65789.819.8823.221.57095.08
Gonghe19.5737.65796.417.8721.581.20563.25
Minhe19.9138.34798.824.1526.961.61669.65
Nuomu19.9034.61773.019.0423.201.82063.35
Huangyuan19.6738.67786.119.7420.891.94261.40
Huzhu19.7938.66792.815.9720.461.48867.25
Mean19.6737.49790.0818.8127.501.6469.23
Standard deviation0.252.129.002.599.340.2311.20
Coefficient of variation/%1.285.671.1413.7533.9713.9116.18
Table 4. The correlation coefficient values between spring wheat yield (LAImax) vs. multi-scalar SPEI and SMDI0–10, The numbers 1–6 indicate the timescale of drought index from 1 to 6 months, respectively. (** represents p-value ≤ 0.05, and * represents p-value ≤ 0.1).
Growth IndexIndexSPEISMDI0–10
Timescale123456123456
Month
LAImaxMar.−0.21−0.26−0.21−0.20−0.22−0.250.25 **0.21 *0.170.120.04−0.01
Apr.−0.14−0.21−0.25−0.22−0.22−0.240.32 **0.32 **0.27 **0.23 *0.180.10
May0.00−0.07−0.13−0.16−0.15−0.150.35 **0.36 **0.35 **0.32 **0.28 **0.22 *
Jun.−0.030.00−0.05−0.10−0.12−0.110.24 *0.31 **0.32 **0.32 **0.29 **0.26 **
Jul.0.110.050.040.01−0.02−0.040.090.21 *0.25 **0.27 **0.27 **0.26 **
Aug.−0.20−0.06−0.05−0.02−0.04−0.070.010.060.140.200.22 *0.23 *
YieldMar.0.07 0.05 0.11 0.16 0.12 0.06 0.22 * 0.19 0.17 0.16 0.12 0.09
Apr.0.04 0.02 0.00 0.02 0.03 0.00 0.30 ** 0.26 ** 0.24 * 0.22 * 0.20 0.15
May0.16 0.13 0.11 0.10 0.12 0.12 0.37 ** 0.36 **0.33 **0.32 **0.30 ** 0.26 **
Jun.−0.11 0.04 0.03 0.03 0.03 0.05 0.30 ** 0.32 **0.32 **0.30 ** 0.29 ** 0.27 **
Jul.0.17 0.05 0.09 0.10 0.09 0.09 0.14 0.25 ** 0.27 ** 0.28 ** 0.27 ** 0.26 **
Aug.0.02 0.12 0.04 0.10 0.11 0.11 0.07 0.11 0.20 0.22 * 0.23 * 0.23 *
Table 5. The number of stations with r > 0.21 between pairs of spring wheat growth indices (LAImax or climatic yields) and drought indices (SPEI and SMDI0–10 at the 1- to 6-month timescales) over 1961–2018. (The sum of the unconditional counts for each row or column is 48). Growth index.
IndexSPEISMDI0–10
Timescale123456Sum123456Sum
Month
LAImaxMar.001011345322218
Apr.000001155543224
May000010145555529
Jun.000000044555528
Jul.001011312244518
Aug.100101302123311
Total103345 182321222222
YieldMar.10000012200004
Apr.00000004221009
May000000024121111
Jun.11111161111116
Jul.01111150111115
Aug.10111150001113
Sum323333 9105644
Publisher’s Note: MDPI stays neutral with regard to jurisdictional claims in published maps and institutional affiliations.

