Article

GWAS and Identification of Candidate Genes Associated with Seed Soluble Sugar Content in Vegetable Soybean

1
College of Horticulture, Nanjing Agricultural University, Nanjing 210095, China
2
Institute of Industrial Crops, Jiangsu Academy of Agricultural Sciences, Nanjing 210014, China
3
College of Life Sciences, Nanjing Agricultural University, Nanjing 210095, China
*
Authors to whom correspondence should be addressed.
Agronomy 2022, 12(6), 1470; https://doi.org/10.3390/agronomy12061470
Submission received: 21 April 2022 / Revised: 8 June 2022 / Accepted: 16 June 2022 / Published: 18 June 2022
(This article belongs to the Special Issue Frontier Studies in Legumes Genetic Breeding and Production)

Abstract

:
Total soluble sugar (TSS) is an important component in vegetable soybean seeds during the R6 stage and greatly impacts fresh soybean flavor. Increasing the TSS content is thus one of the most important breeding objectives for the creation of high-quality vegetable soybean germplasm. To better understand the genetic basis of the TSS at the R6 stage, we investigated 264 germplasm accessions in two environments. We obtained five associations with 27 significant SNPs using GWAS. The significant SNPs S15_10810881–S15_10843821 and S06_12044239–S06_12048607 were identified in both environments. We then conducted candidate gene analysis and uncovered nine candidate genes as potential regulators of TSS content in vegetable soybean seeds using RT-PCR. These genes may be involved in the regulation of soluble sugar content in soybean seeds. This study provides new knowledge for the understanding of the genetic basis of TSS at the R6 stage and will help improve regulation of TSS in vegetable soybean using molecular breeding.

1. Introduction

Soybean (Glycine max (L.) Merrill) is one of the most important economic crops worldwide. Vegetable soybean is a special kind of soybean that is usually harvested at the R6-R7 stage when full seeds and green pods are available for consumption [1]. In addition to protein, fat, vitamins, and minerals, fresh seeds at the R6 stage are rich in sugars (soluble sugar, starch, and other types), providing substantial nutritional supplementation to the human diet [2]. Fresh seeds at the R6 stage are rich in sugars (soluble sugar, starch, and other types) that make vegetable soybean one of the most favorable vegetables for human consumption. Soluble sugar strongly influences fresh seed organoleptic quality and is the key factor involved in the development of fresh and sweet flavors [3]. Unlike grain soybean, for which protein and oil are the ultimate breeding goal, soluble sugar is a more vital trait for fresh vegetable soybean seeds. The amount of carbohydrate in soybean seeds accounts for approximately 35% of the dry matter present in the seeds, and about 47% of the total carbohydrate content is composed of soluble sugar [4].
Soluble sugar content is a complex quality trait that is controlled by multiple genes and influenced by distinct environmental factors [5]. In soybean, linkage mapping and genome-wide association studies (GWAS) have been efficiently used as precise tools to uncover the genetic basis of quality traits [6]. At present, a large number of QTLs associated with flowering stage, maturity stage, plant height, number of main stem nodes, 100-grain weight, protein content, fat content, and stress resistance have been reported in soybean plants [7,8,9,10,11]. These studies have demonstrated that linkage mapping is an efficient approach for revealing the genetic architecture underlying complex quantitative traits. Linkage mapping consists of the construction of cross-populations such as recombinant inbred lines (RIL), backcross inbred lines (BIL), and near-isogenic lines (NIL), which is time consuming and labor intensive [12].
GWAS, or linkage disequilibrium (LD) mapping, is an effective methodology for identifying the relationship between a group of traits of interest and genetic markers or candidate genes [13,14]. In contrast to QTL mapping, GWAS offers a more efficient strategy that saves time and labor. Importantly, GWAS utilizes natural populations with higher amounts of genetic variation that enable the identification of genetic markers without the need to construct a genetic population [12]. GWAS has been widely used in soybean [15,16,17], but only a few studies investigated the amount of soluble sugar using this approach [18], which resulted in the identification of a set of associated markers distributed across the different soybean chromosomes.
In our previous study, we re-sequenced soybean accessions (≥12× depth) and identified 2,597,425 SNPs [19]. Here, we performed a genome-wide association study to dissect the genetic architecture of soluble sugar at the R6 growing stage in vegetable soybean seeds. This strategy allowed us to identify a total of five associations with 27 significant SNPs[−log10(p) > 5.5] in two environments, of which two peak SNPs were located on Chr.06 and two were located on Chr.15. Furthermore, based on gene annotation of the reference genome and quantitative real-time PCR analysis (RT-PCR), we selected nine candidate genes associated with the amount of soluble sugar at the R6 stage. These results provided helpful insights into the breeding quality of vegetable soybean.

2. Materials and Methods

2.1. Plant Materials and Experimental Conditions

A total of 264 germplasm accessions from China, including 52 landraces and 212 improved cultivars, were selected to construct an association mapping panel [19]. All materials were planted in Nanjing City, in the Jiangsu Province in the summers of 2019 and 2020. The experiment followed a randomized complete block design with a three-row plot and three replications. For description purposes, the two environments 2019 Nanjing and 2020 Nanjing were designated as E1 and E2, respectively. Samples from fresh vegetable soybean seeds were collected at the R6 stage, immediately transferred to liquid nitrogen, and finally stored at −80 °C to enable the determination of the amount of soluble sugar present and RNA extraction.

2.2. The Total of Soluble Sugar Measurement in Vegetable Soybean Fresh Seeds

For soluble sugar measurements, 50 fresh pods at the R6 stage were harvested and stored at 105 °C in an oven for 30 min, dried at 80 °C, and then ground. Each sample was taken from more than ten different plants and mixed as a biological replicate. A total of three biological replicates were taken. The content of soluble sugar in soybean seeds was determined by anthrone colorimetry [20].

2.3. Genome-Wide Association Study (GWAS) Analysis

SNP data from our previous study were used for a genome-wide association study of soluble sugar content in vegetable soybean [19]. This panel consisted of 2,597,425 SNPs (MAF > 0.5). For the GWAS, the package ‘Genomic Association and Prediction Integrated Tool (GAPIT)’ in R software was used which calculates the population structure and kinship automatically along with the GWAS running [21,22]. Manhattan plots and QQ plots were generated using R package ‘CMplot’ [23].
Total soluble sugar is a complex quantitative trait regulated by different loci. In the present study, the threshold was set as −log10(p) > 5.5 to detect more SNPs associated with TSS, to better understand the mechanism of TSS in soybean. In addition, it is a common and effective strategy to set the threshold lower than −log10(1/n, n as the number of SNP from the natural population re-sequencing) for revealing genetic bases of target traits in the previous studies [24,25]. Based on our previous work [19], the linkage disequilibrium (LD) decay rate of these 264 soybeans was 120 kb and the LD heatmaps with surrounding peaks in the GWAS results were visualized using the R package of ‘LDheatmap’ [26].

2.4. Survey of Candidate Genes

We identified potential candidate genes responsible for the total soluble sugar in fresh vegetable soybean seeds by focusing on genes in the LD decay distance upstream and downstream within 120 kb intervals of peak SNPs (the most significant SNPs with a maximum of −log10(p)-values). The functional annotation of soybean genes in the candidate regions were obtained from the SoyBase database (http://www.soybase.org/, accessed on 20 September 2021). We used soybean reference genome version Wm82.a2.v1.

2.5. RT-PCR for Candidate Genes

The total RNA in different development stages of soybean seeds was extracted using a TIANGEN kit (Beijing, China). A 1% agarose gel was used to check for contamination and degradation of RNA. Three biological replicates were included in each tissue. cDNA was synthesized using a Takara (Tokyo, Japan) kit with reverse transcriptase. Gene expression analysis using RT-PCR was performed on an ABI 7500 system (Applied Biosystems, Foster City, CA, USA) with the SYBR Green Real-Time Master Mix (Toyobo). The data were analyzed using an ABI 7500 real-time PCR System. The relative expression levels were quantified against the Actin11 gene using the 2ΔΔCT method [27]. Three independent biological replicates were implemented for each sample. The target candidate genes were selected from the gene modules based on their intramodular gene significance, and the annotation information from the soybean reference genome database (https://phytozome-next.jgj.doe.gov/, accessed on 15 December 2021).

3. Results

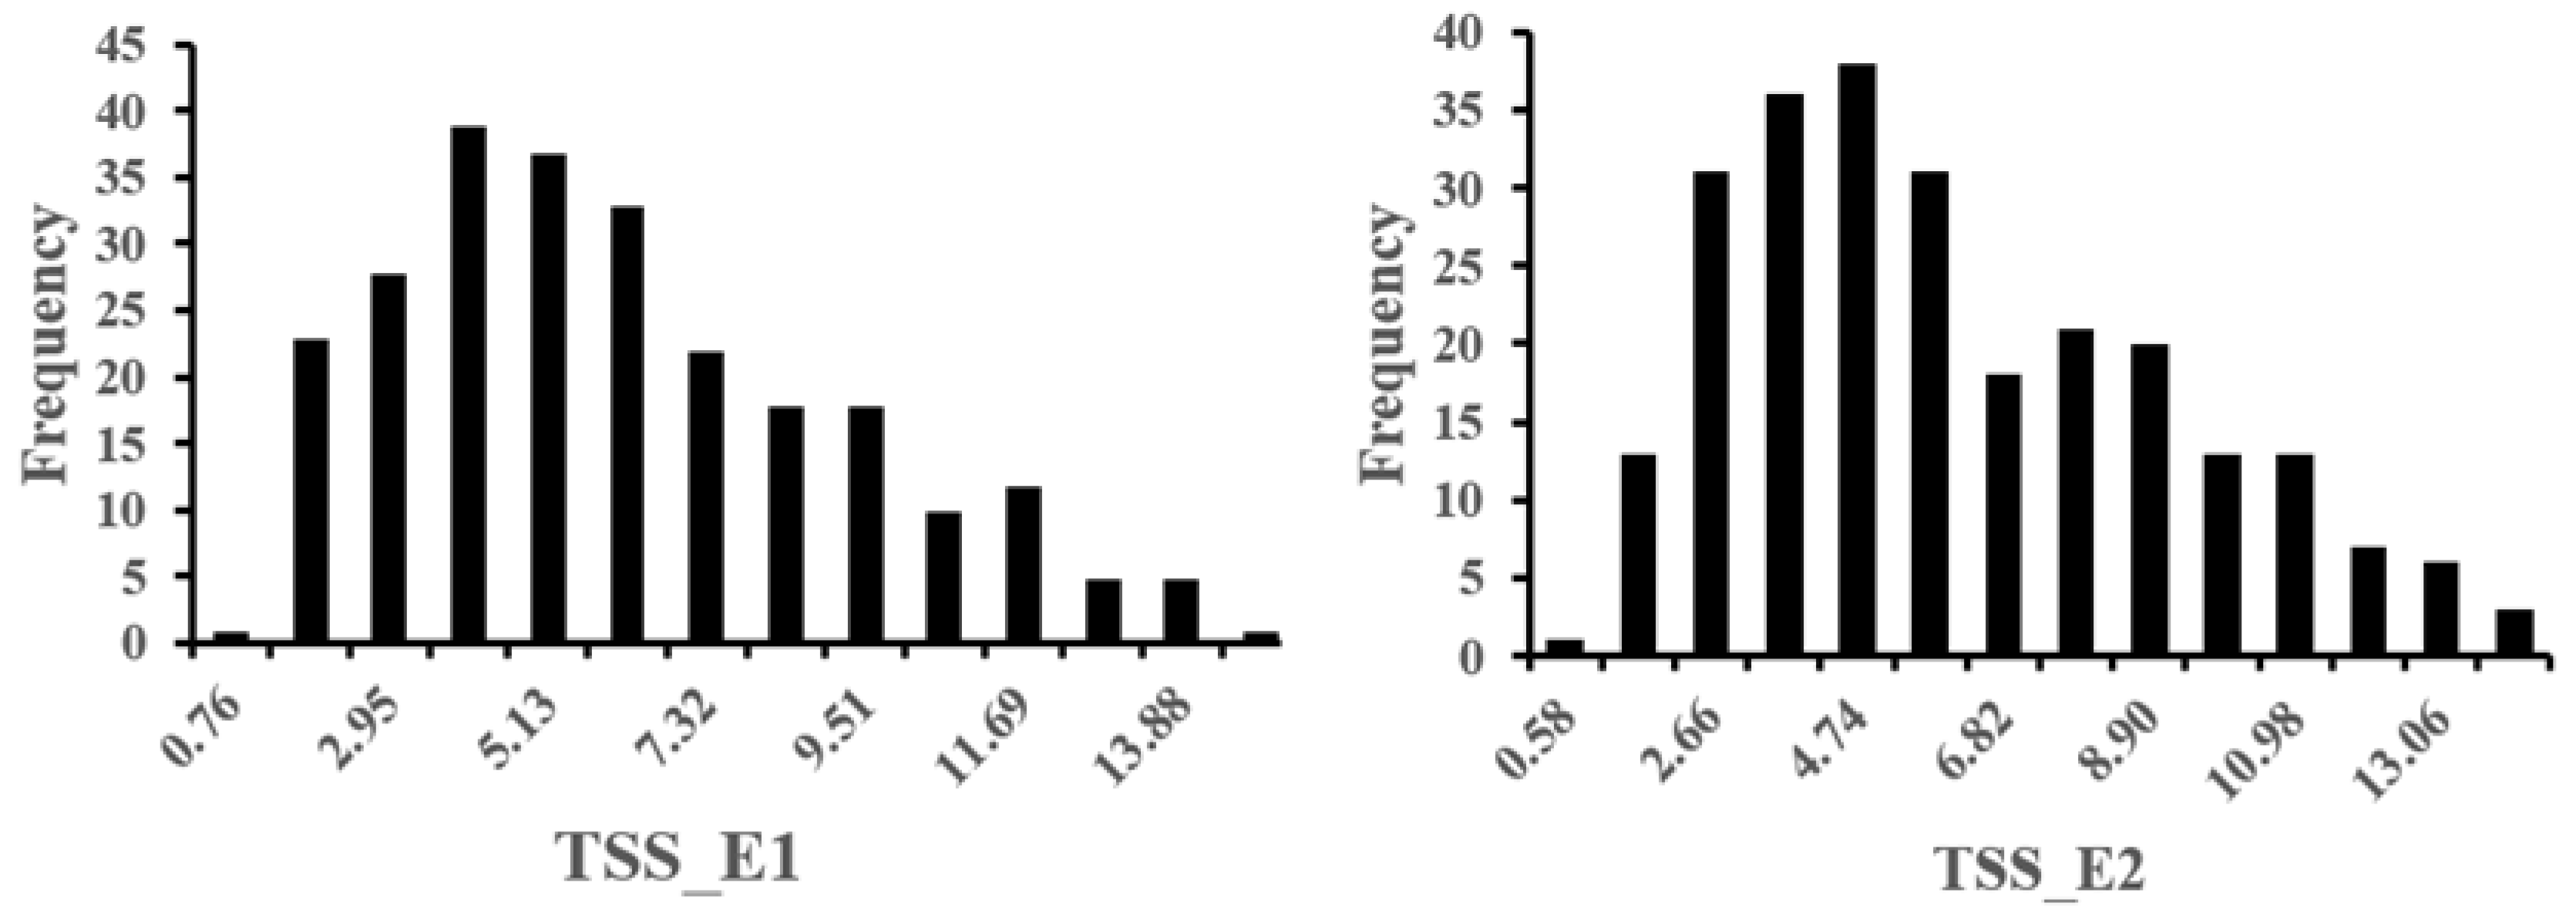
3.1. Phenotypic Variation

A total of 264 germplasm accessions were planted in two consecutive years (2019 and 2020), and the total soluble sugar (TSS) was measured at the R6 developmental stage. In this study, the TSS values ranged from 0.76% to 13.99%, and 0.58% to 13.62%, in E1 and E2. The soluble sugar of fresh seeds exhibited a continuous distribution (Figure 1; Table S1) and was quantitatively inherited. The mean TSS of E1 and E2 accessions were 5.68% and 5.71%, respectively.

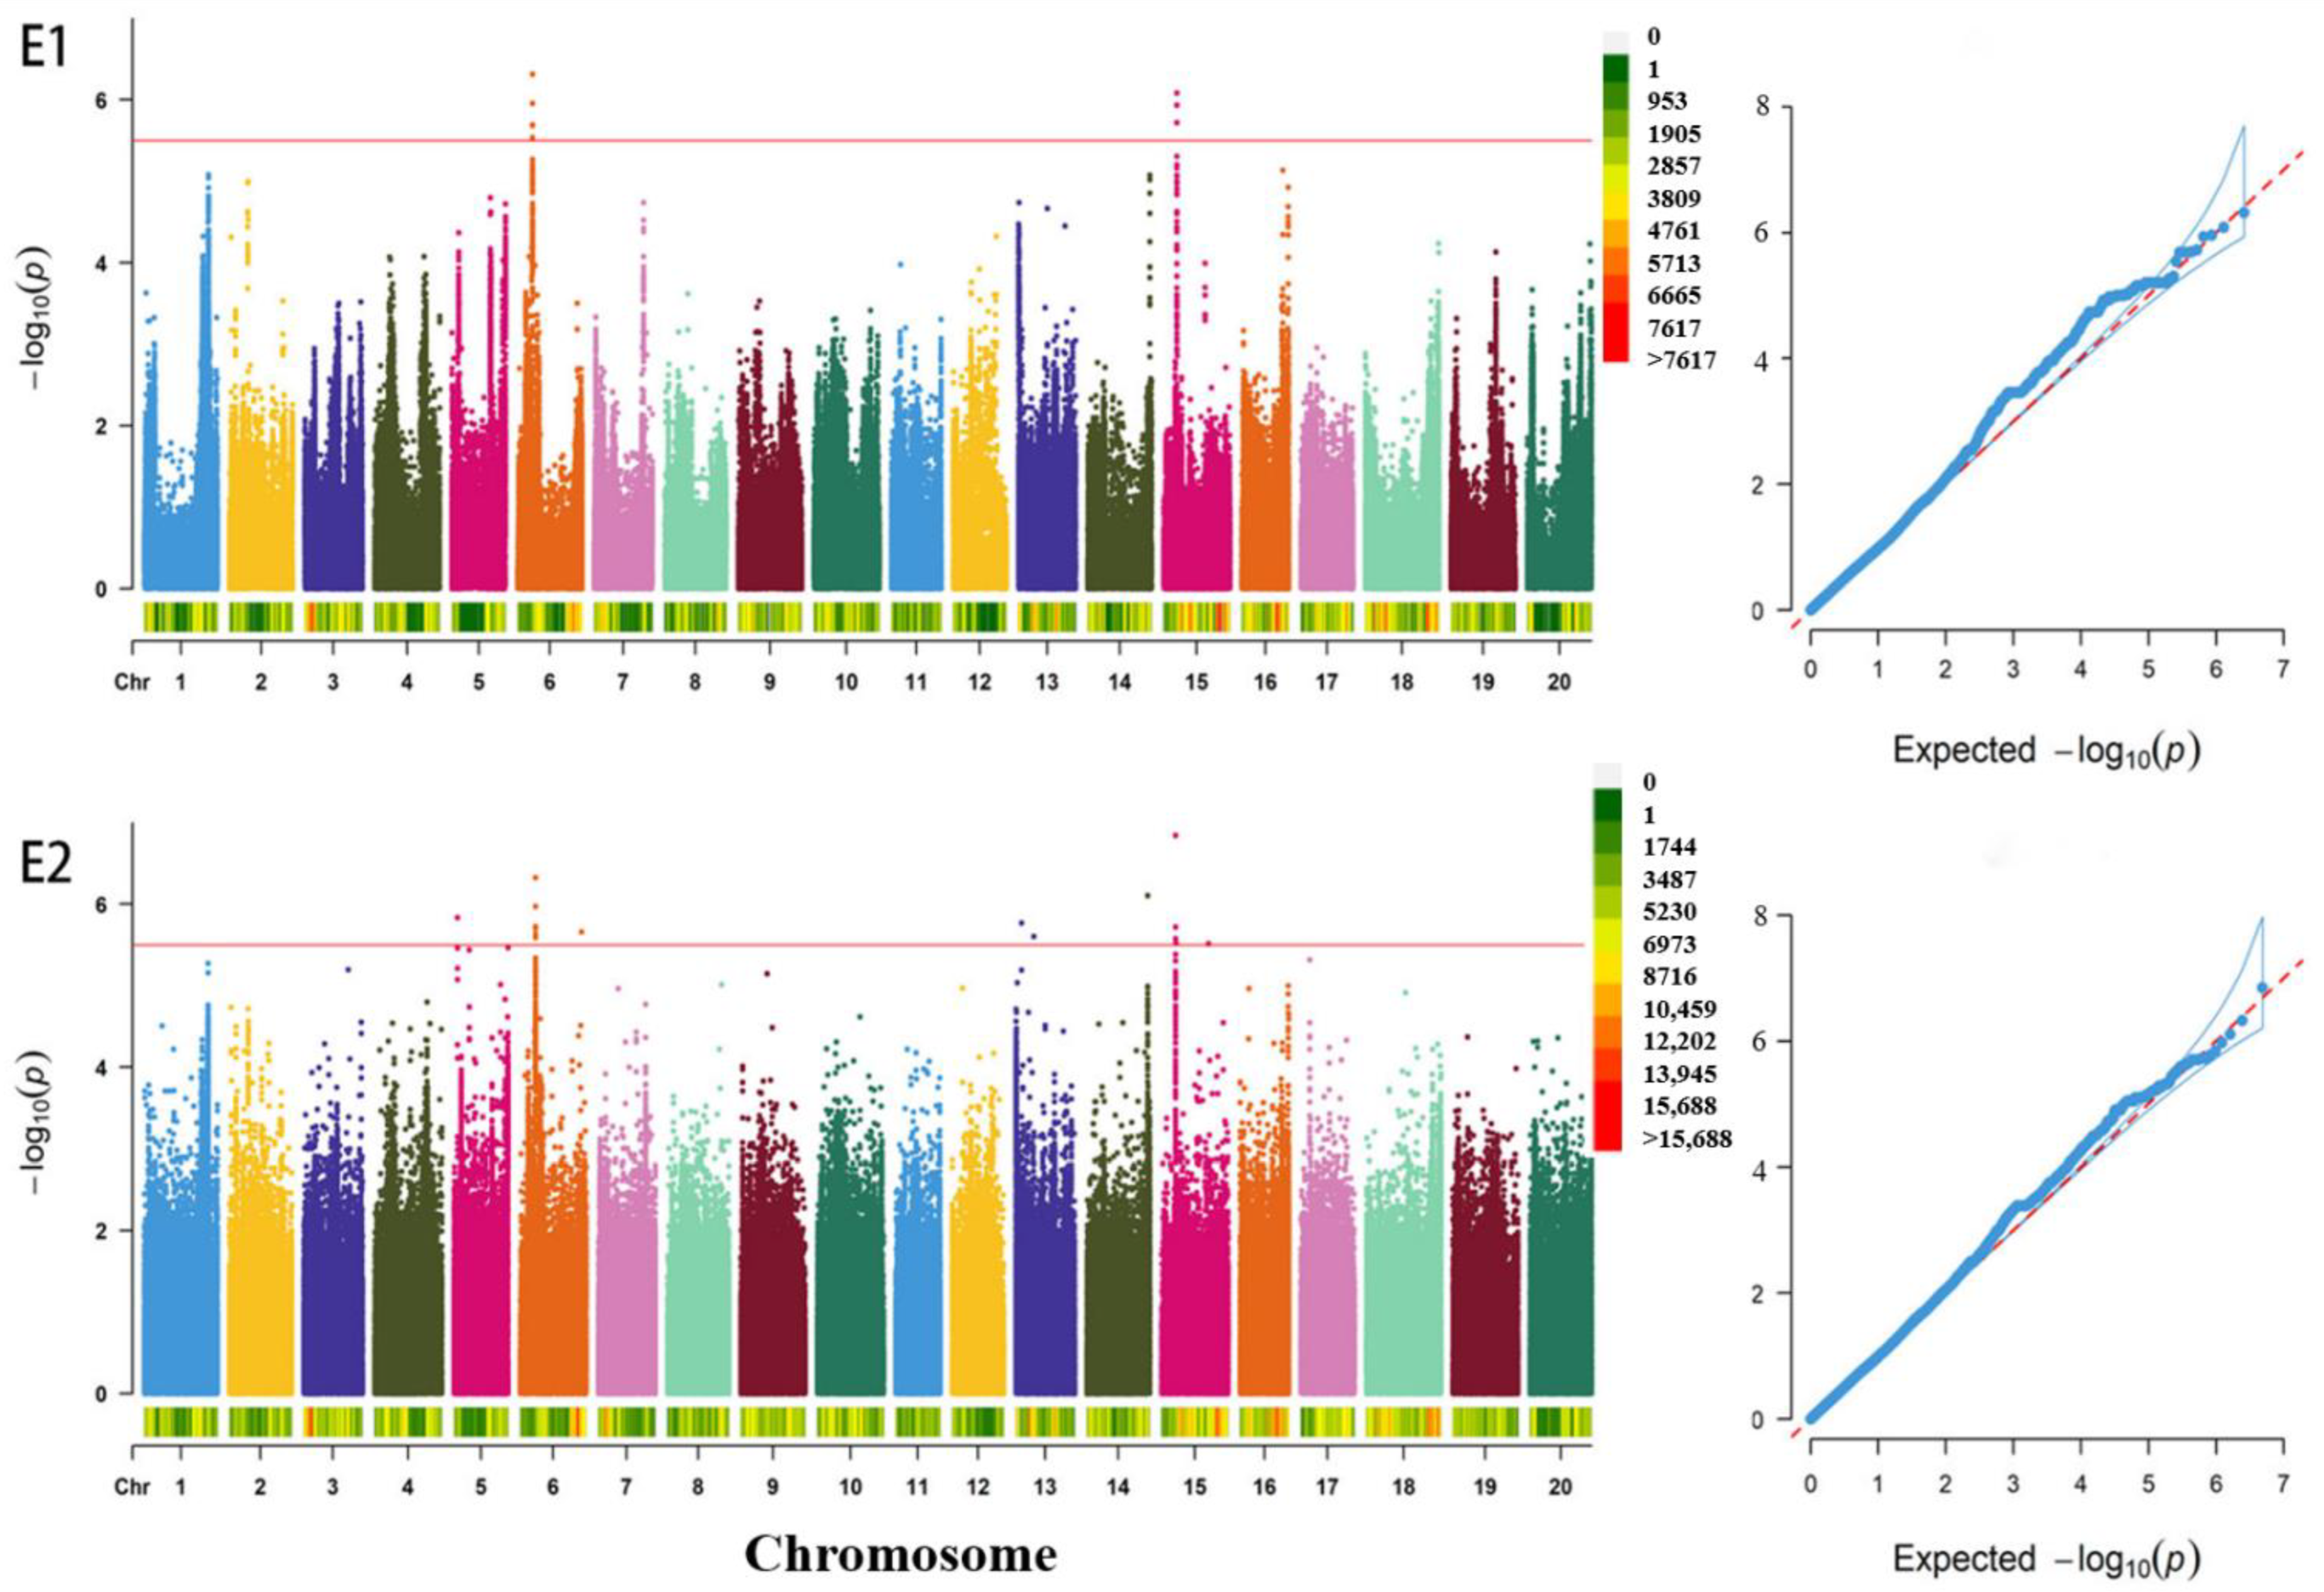
3.2. GWAS for the Total Soluble Sugar

We conducted a GWAS on the soluble sugar based on 2,597,425 SNPs using a mixed linear model (MLM). Manhattan and quantile-quantile plots for the GWAS results are shown in Figure 2. This analysis allowed us to identify a total of five associations (−log10(p) > 5.5) with 27 significant SNPs for TSS content. These five loci were located on Chr.05 (1 SNP), 06 (16 SNPs), 13 (2 SNPs), 14 (1 SNP), and 15 (7 SNPs) (Figure 2; Table 1). These results demonstrate that soluble sugar content in fresh vegetable soybean seeds is controlled by multiple genes. A single SNP explained between 8.70% and 18.77% of the observed phenotypic variation (Table 1). As shown, significant SNPs associated with TSS were mainly on Chr.06 and Chr.15 (Figure 3a,c) and exhibited strong linkage disequilibrium (Figure 3b,d).
Moreover, we found two peak SNPs located on Chr.15 (positions 10810881 and 10843821) and another two on Chr.06 (positions 12044239 and 12048607), in the two environments (Figure 2; Table 1). Annotation analysis showed that these SNPs were synonymous variation without amino acid change. Among the cultivars and landraces used in this study, we observed that soybean accessions carrying the SNP S06_12048607-A allele exhibited a significantly higher average of TSS than those carrying the S06_12048607-G allele, and the SNP S06_ 12044239 was just contrary (Figure 4a,b). Soybean accessions carrying the SNP S15_10843821-A allele and SNP S15_10810881-T allele exhibited a significantly higher average of TSS than those carrying the S15_10843821-G allele and S15_10810881-G allele (Figure 4c,d), indicating these regions are critical for the total soluble sugar at the R6 developmental stage in vegetable soybean seeds.

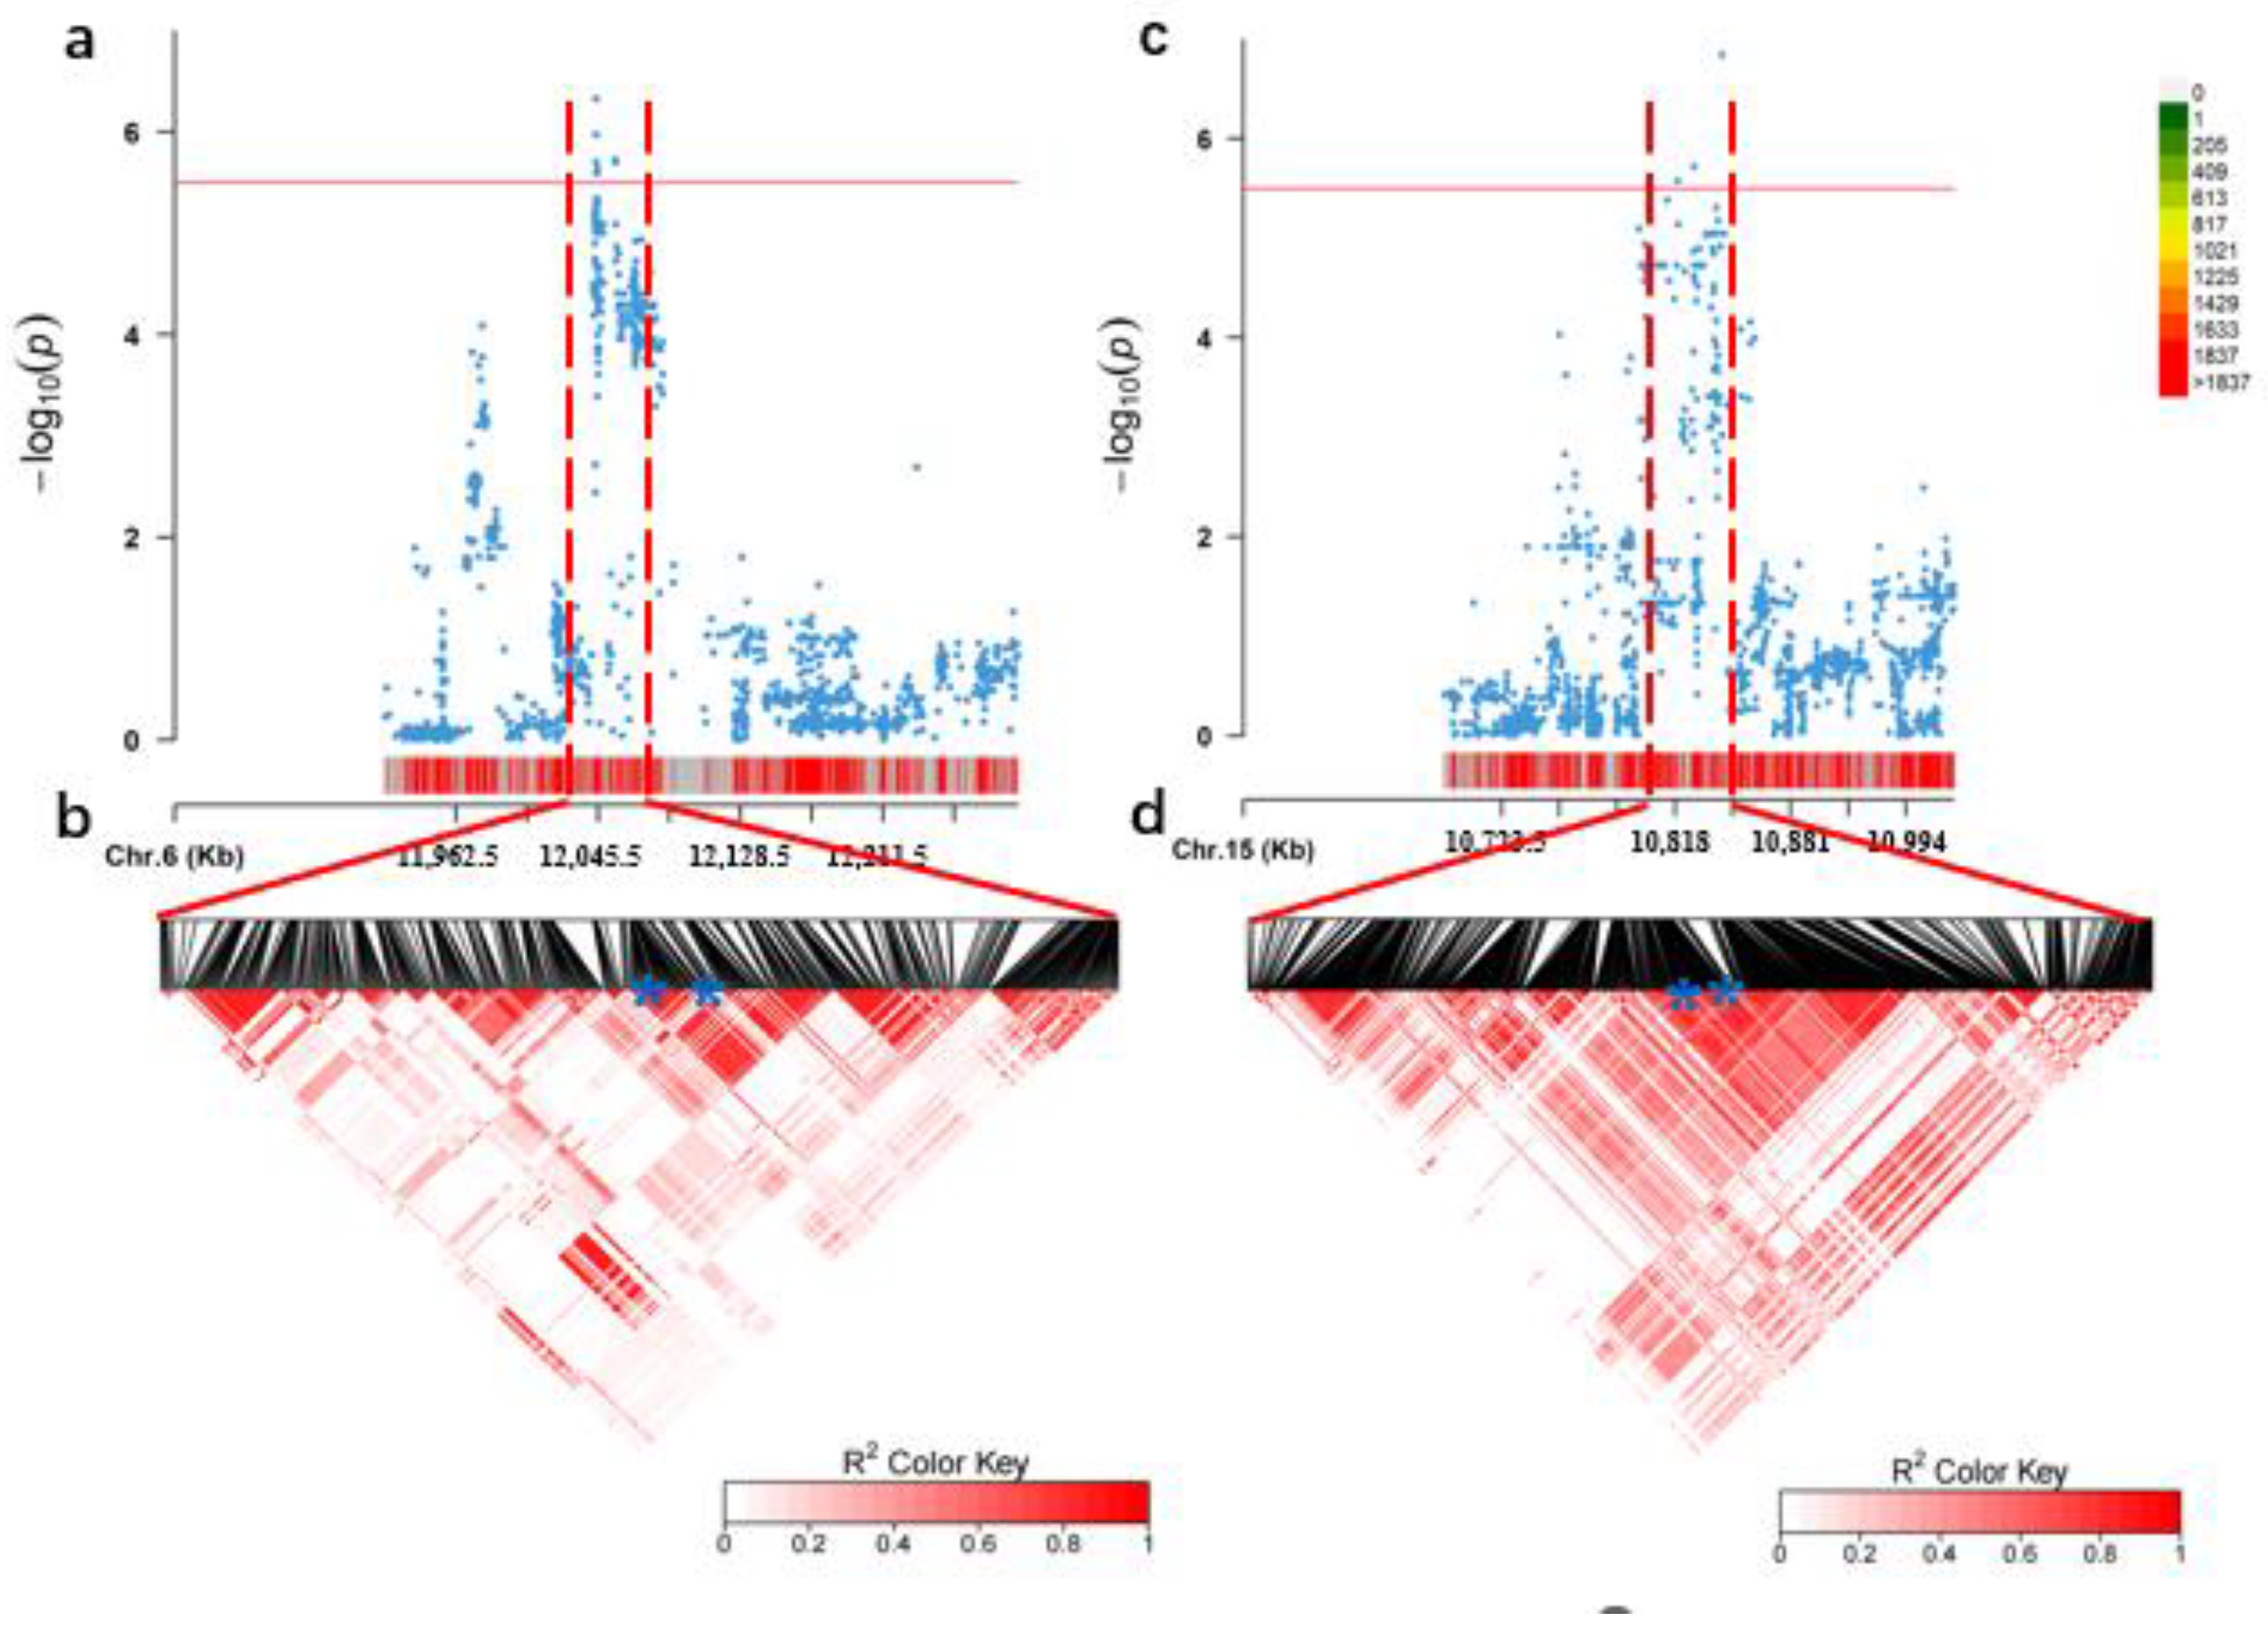
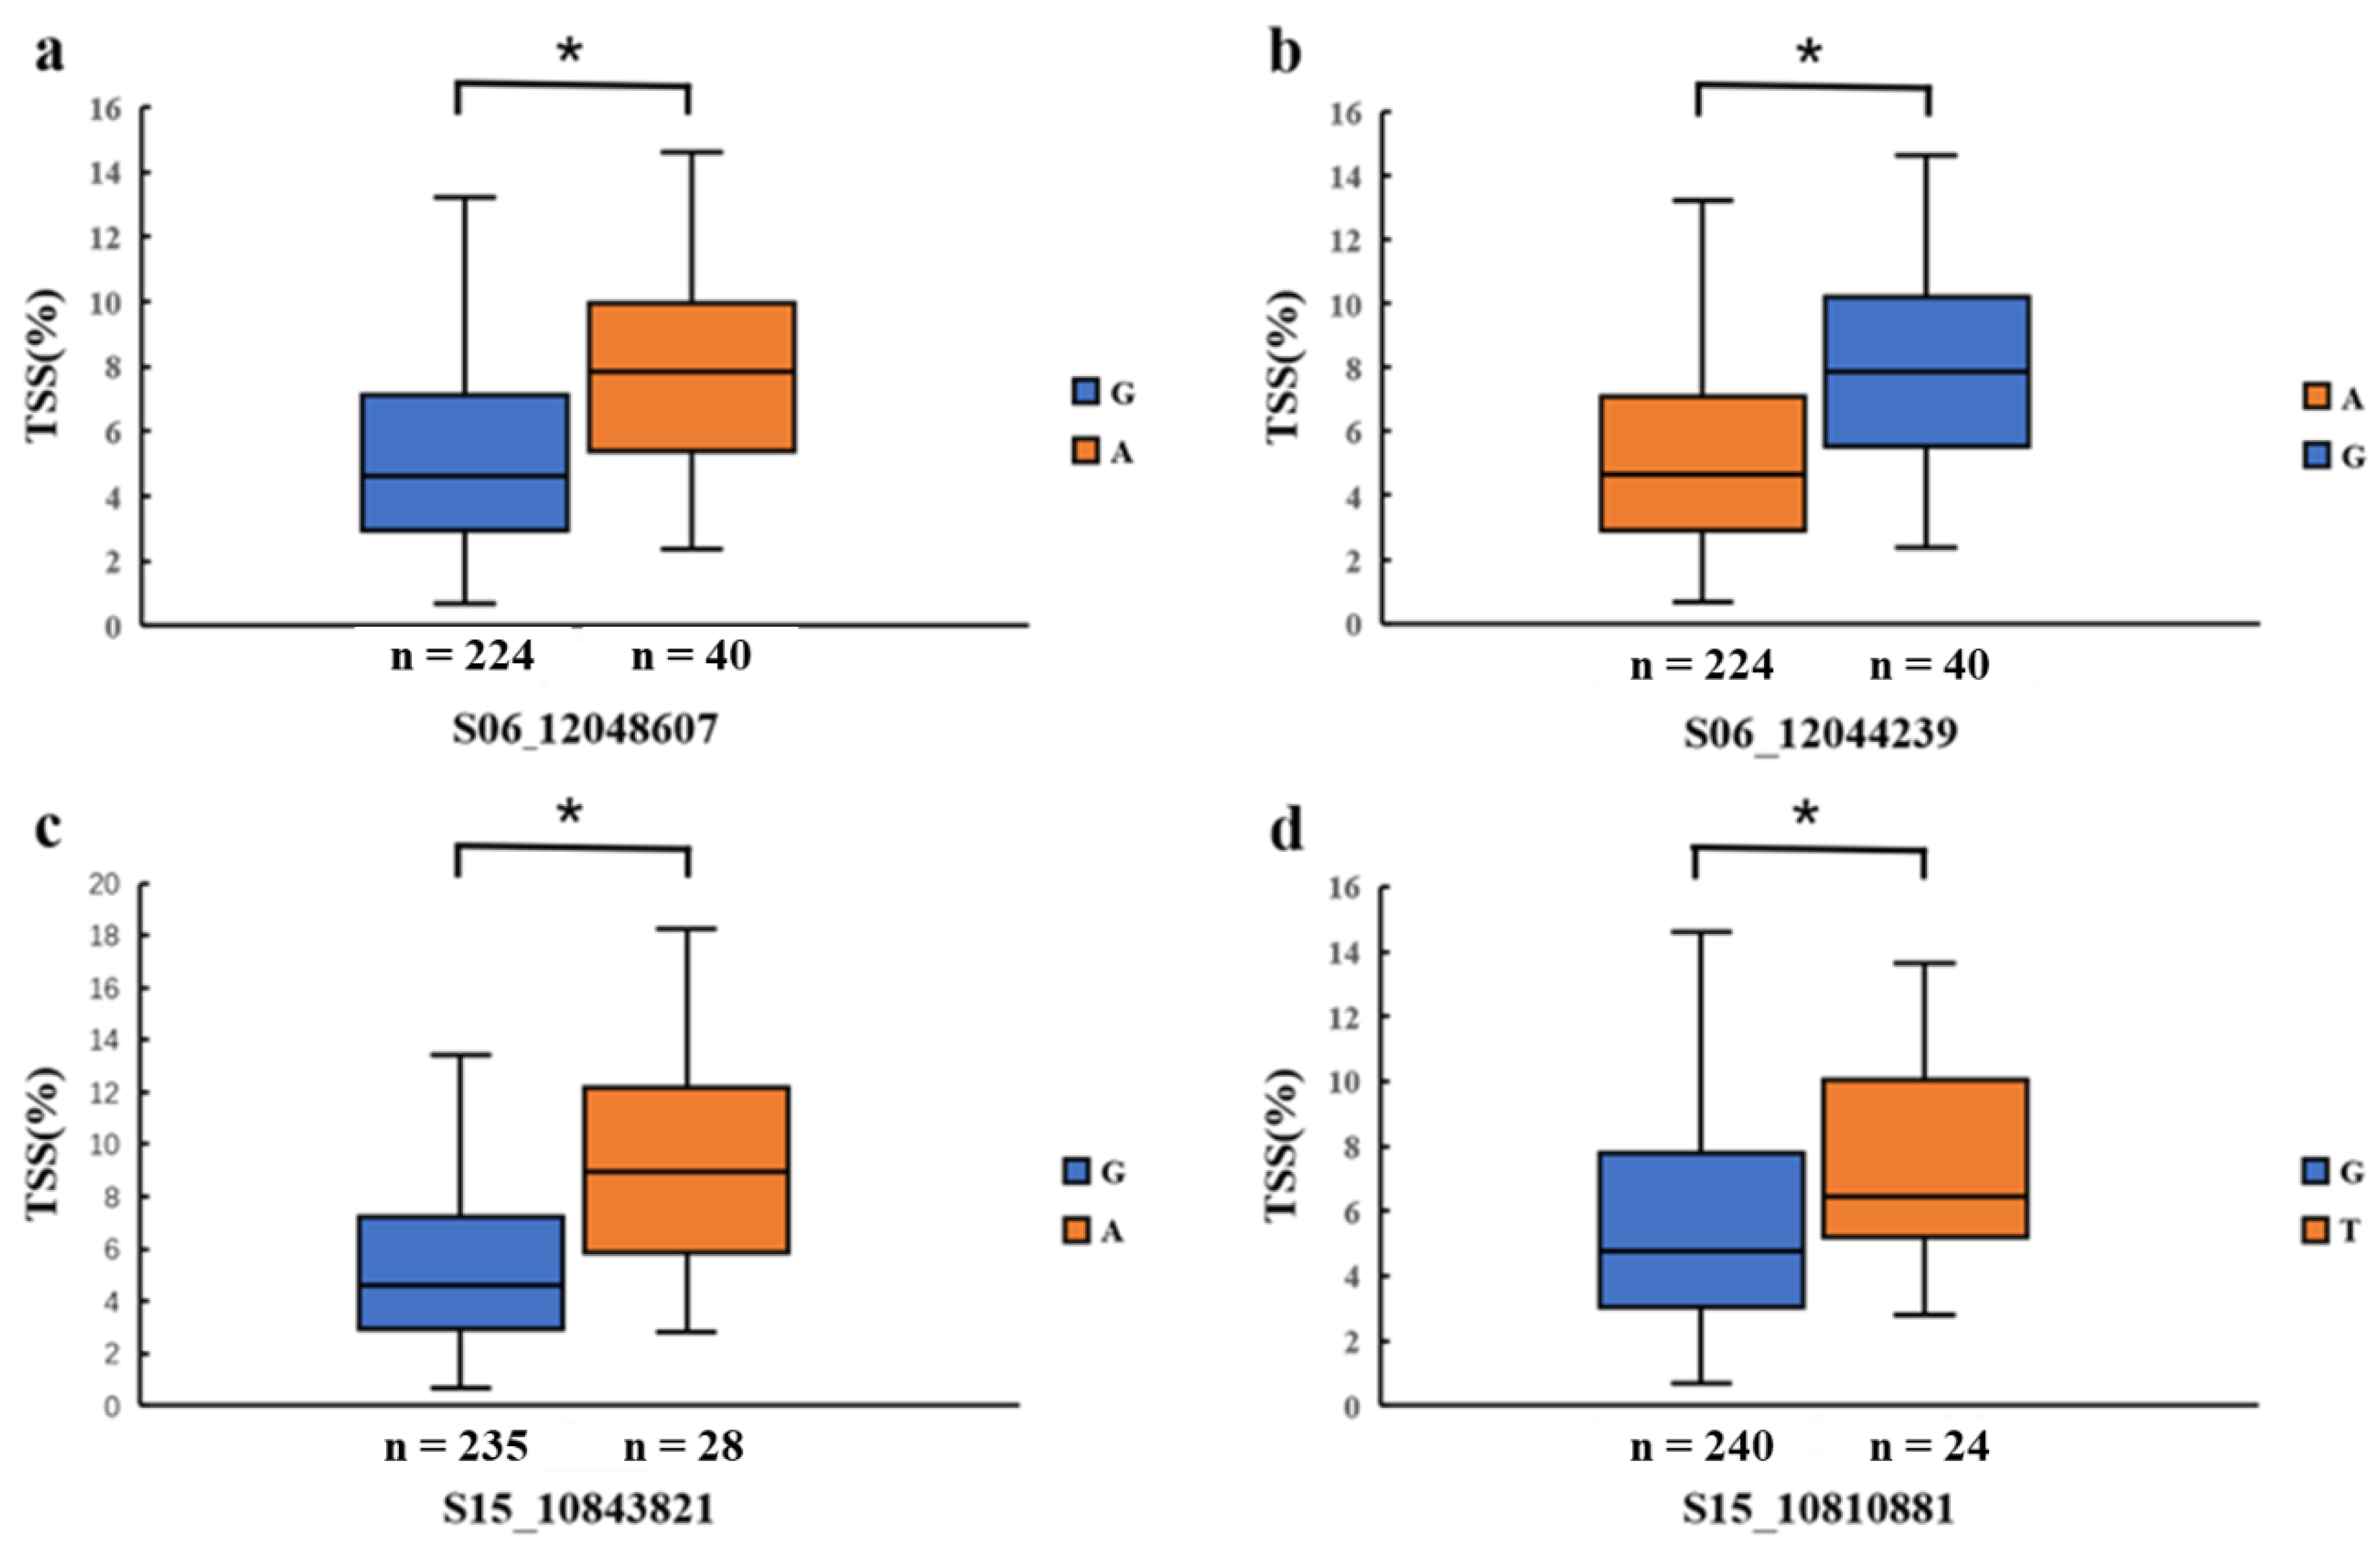
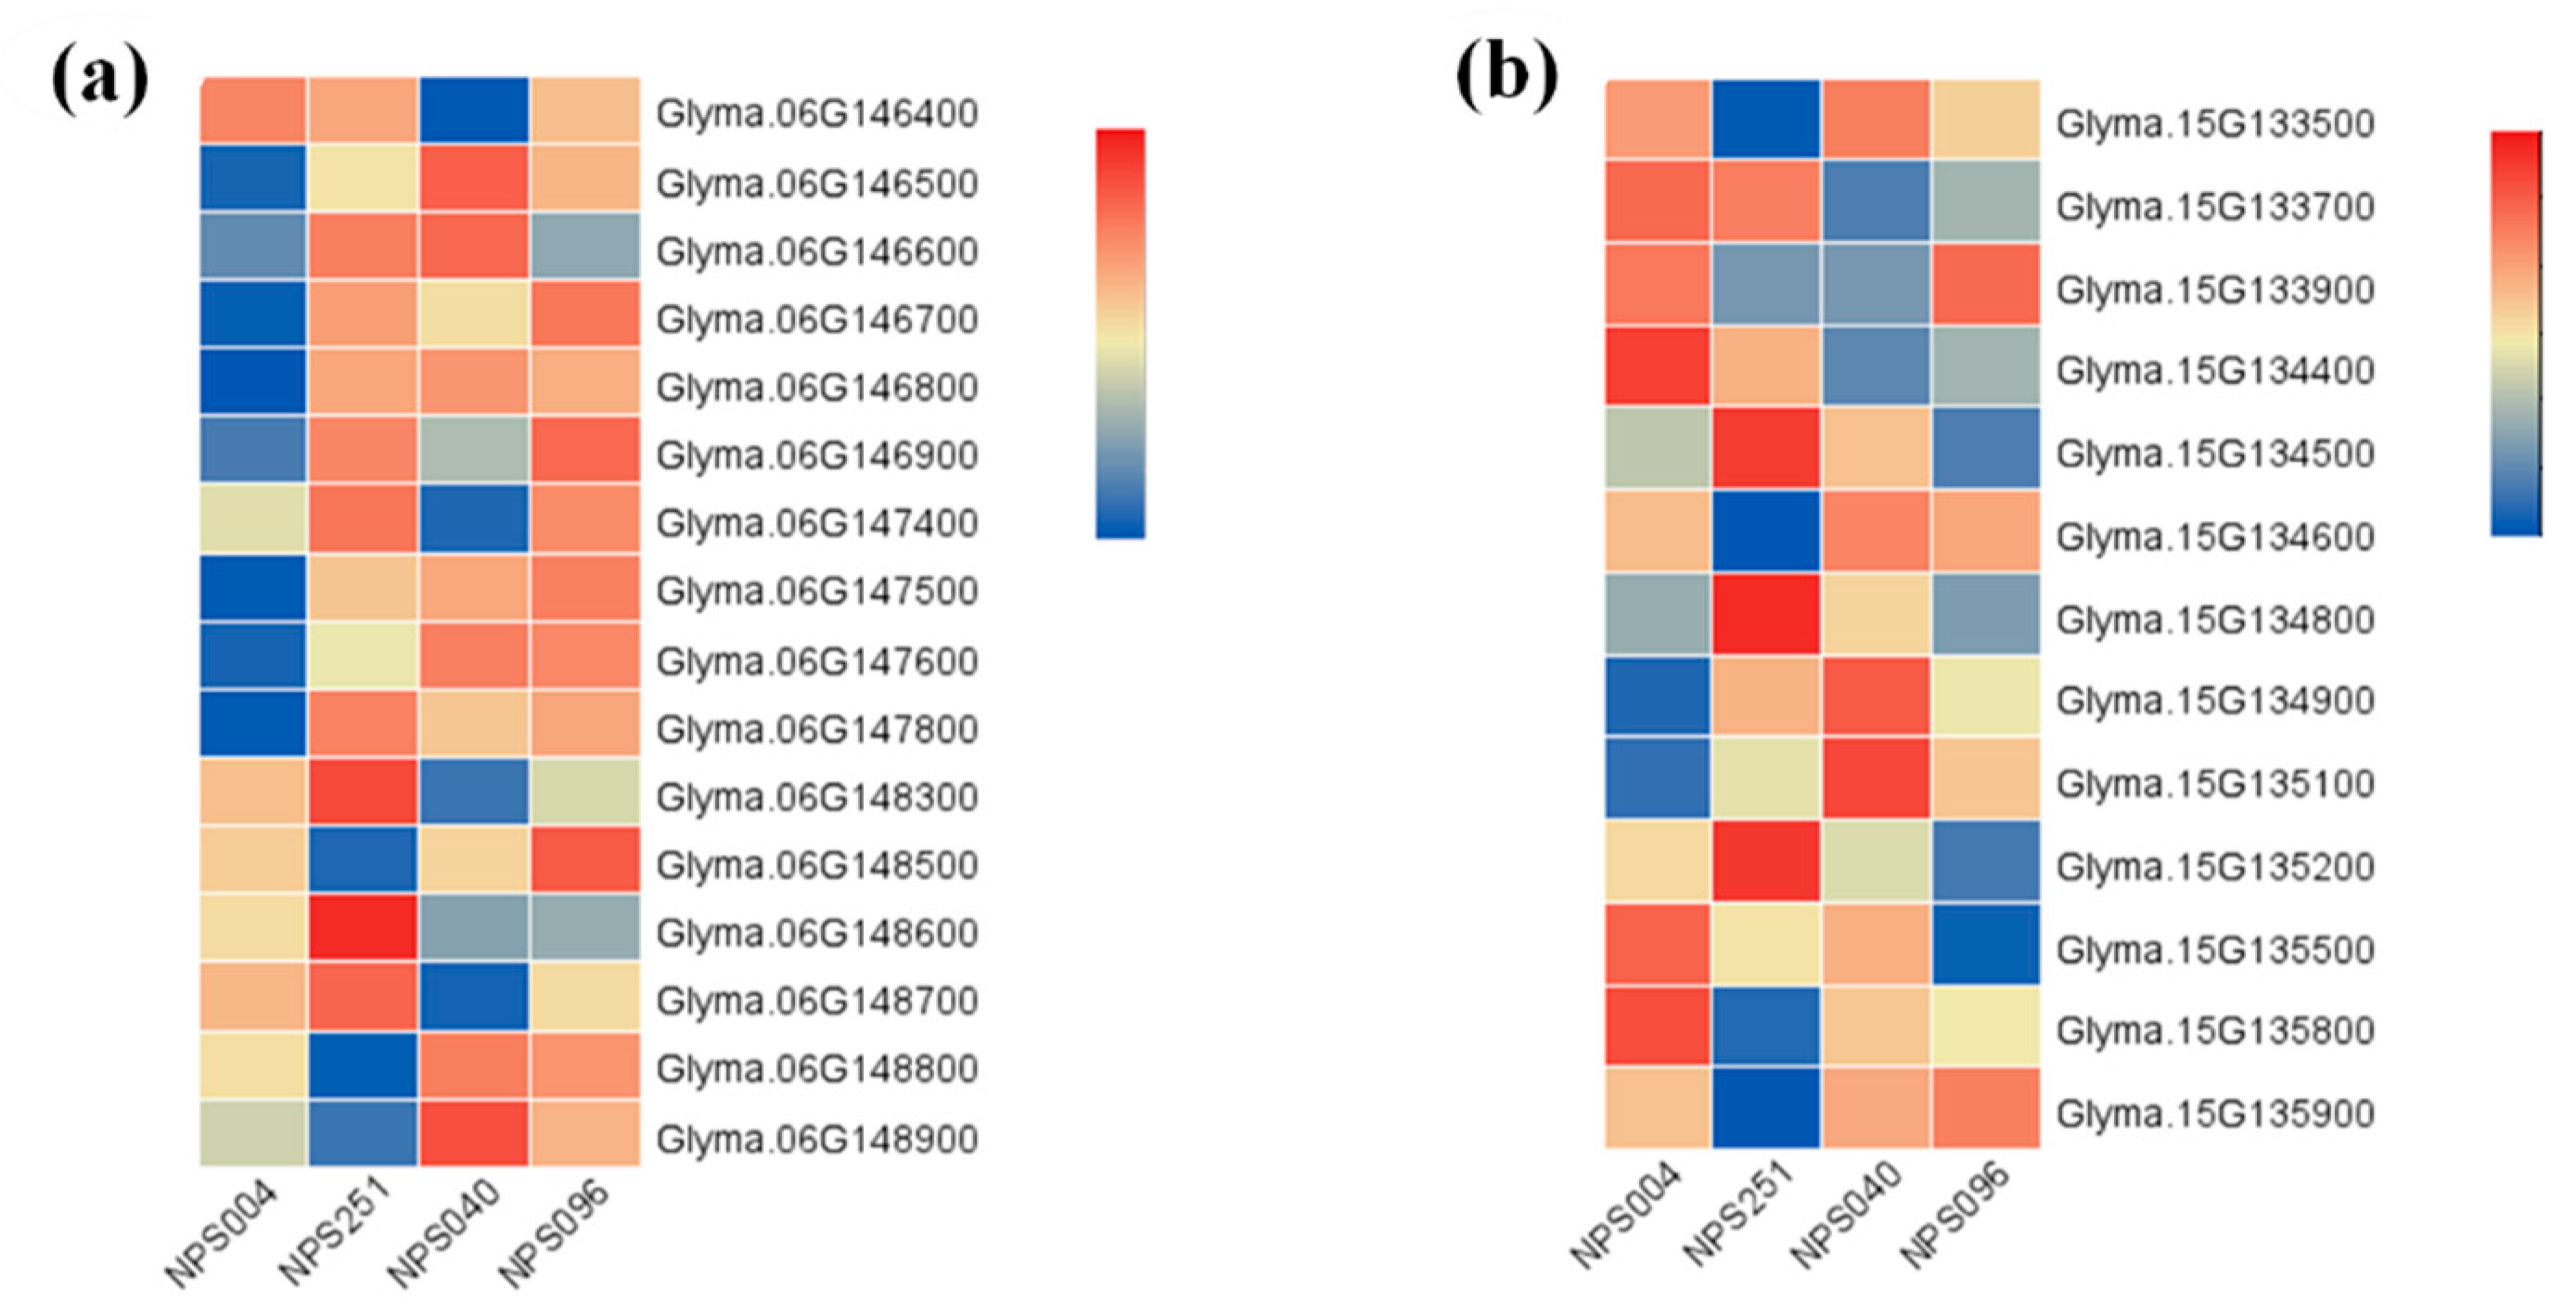
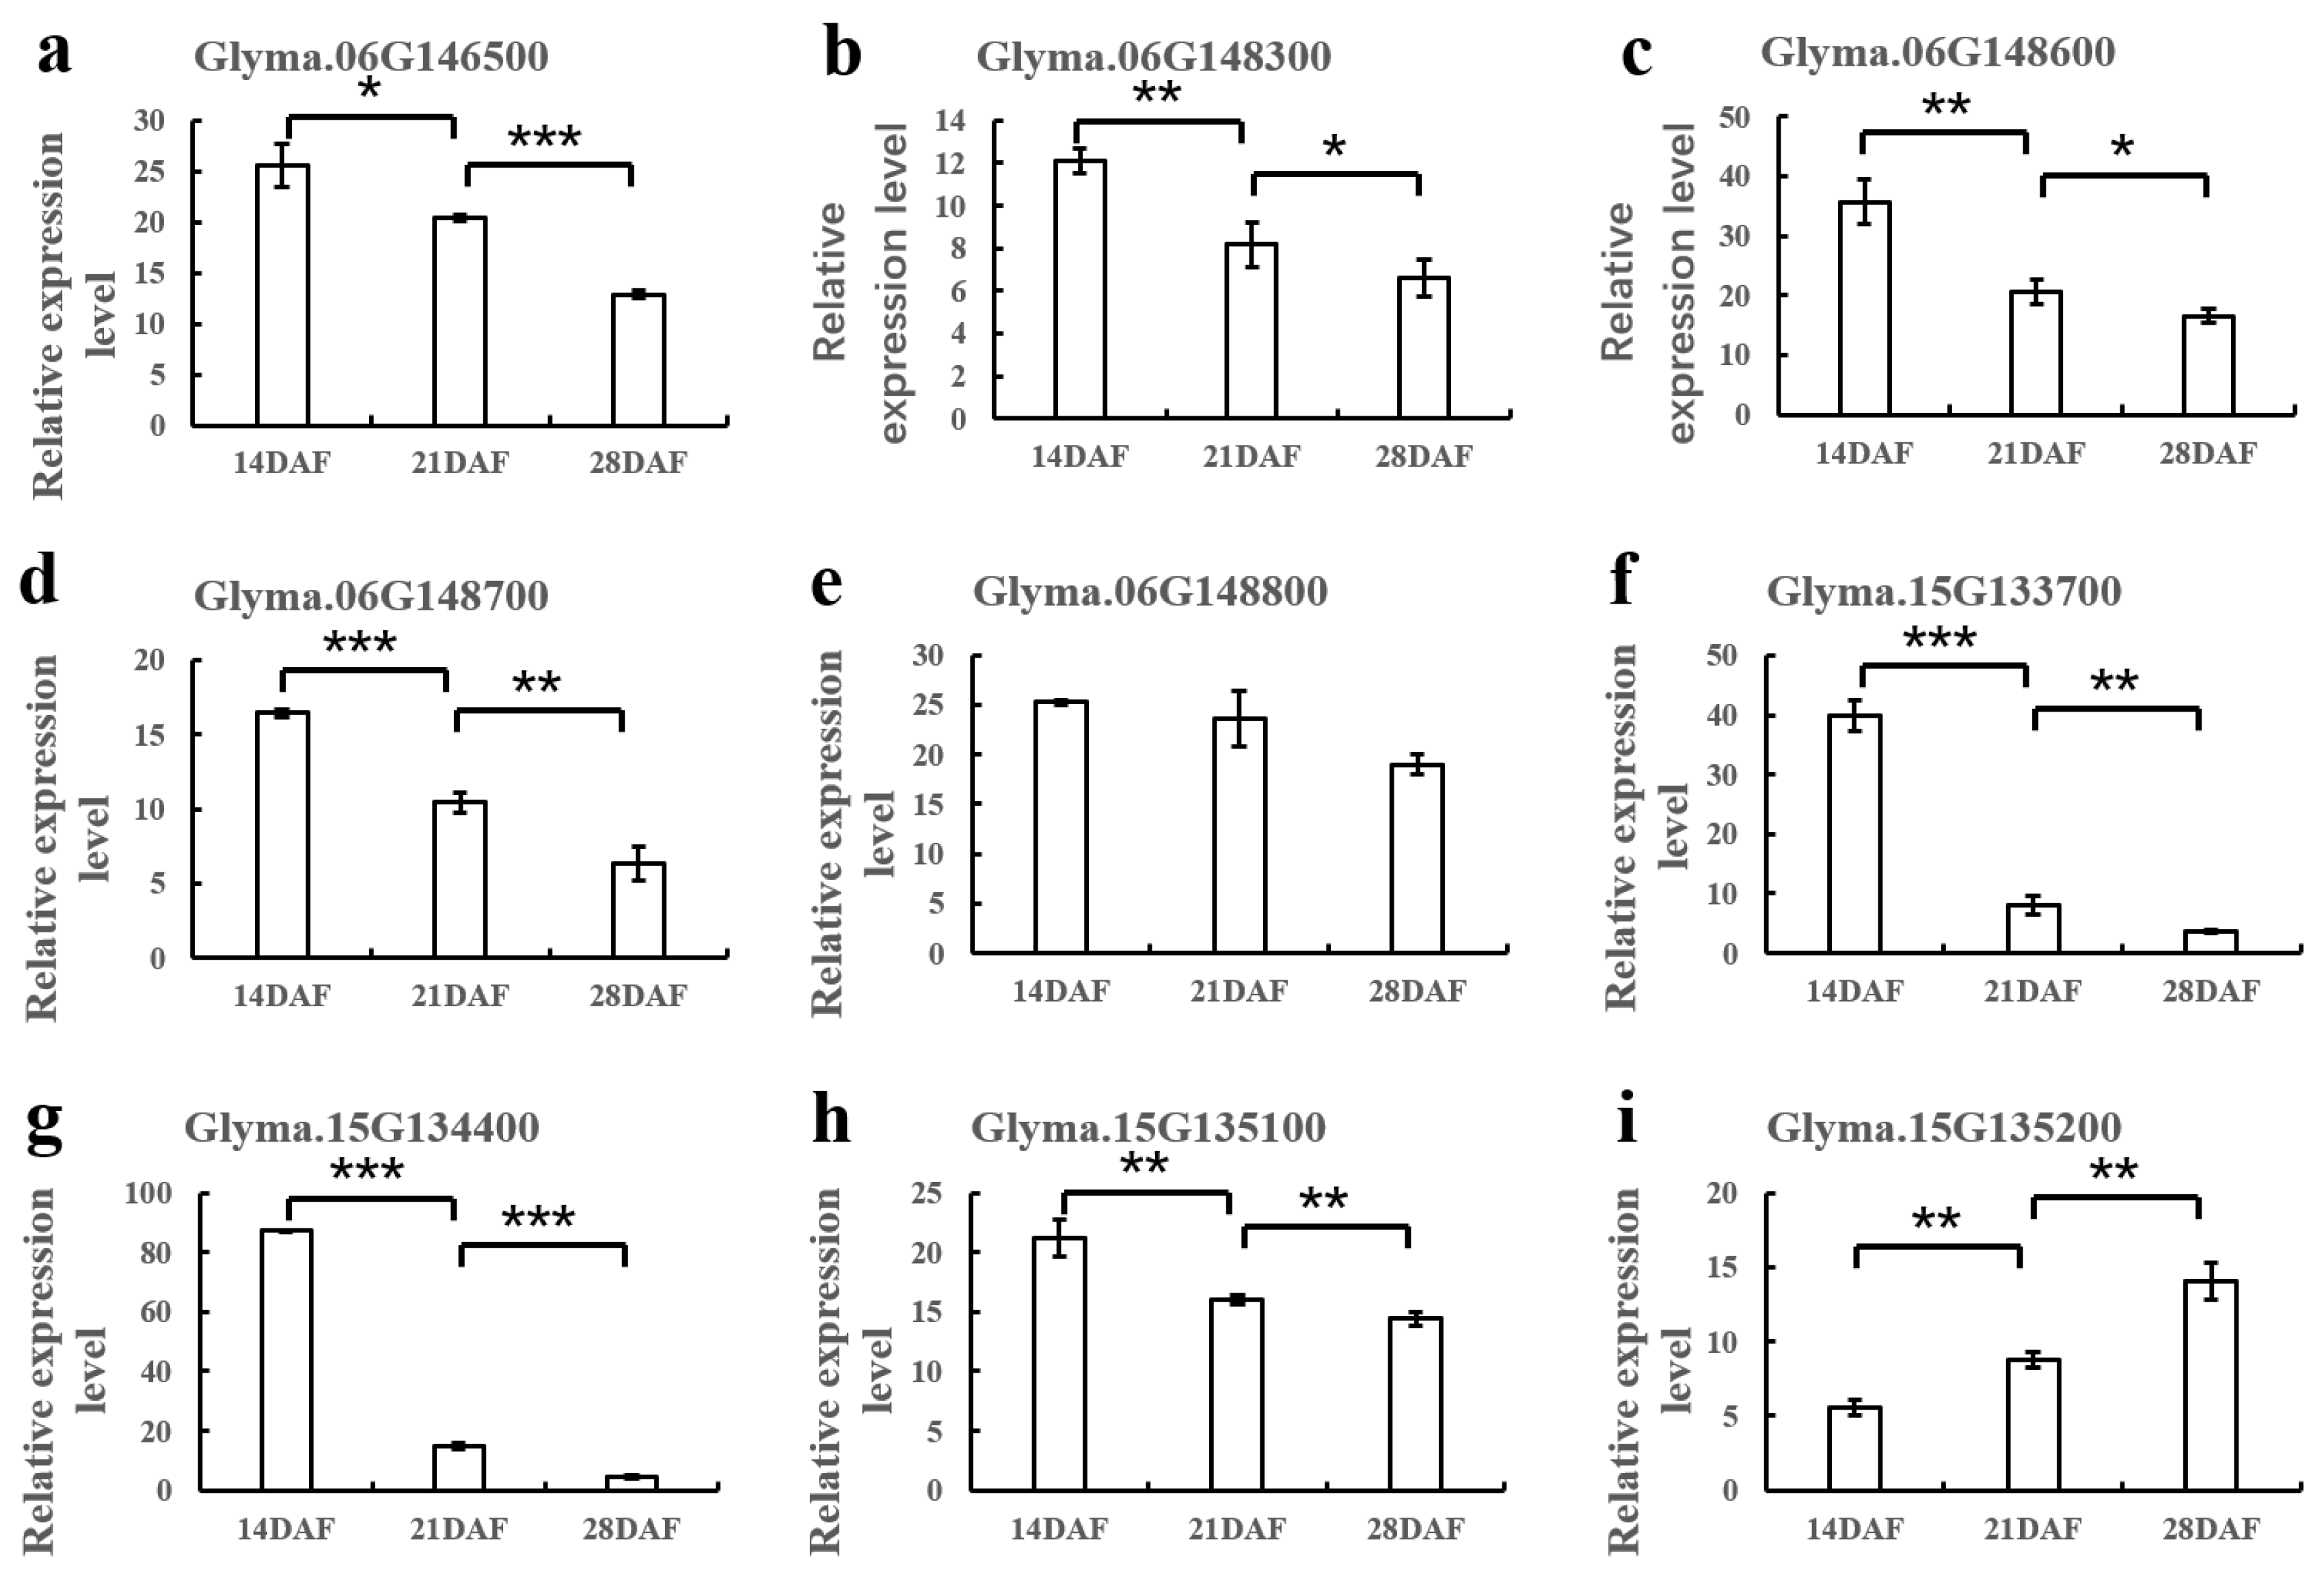
3.3. Identification of Candidate Genes

We found that the peak SNPs S15_10810881 and S15_10843821 were located 30 kb apart from each other, while S06_12044239 and S06_12048607 distanced 50 kb from each other (Table 1). According to gene annotation, we identified 26 and 25 candidate genes near these regions on Chr.06 and Chr.15, respectively (Table S2 and Table S3). To confirm which genes are associated with fresh seed soluble sugar, we performed a RT-PCR analysis to investigate the expression of these genes in soybean accessions that differed significantly in total soluble sugar (NPS004 and NPS251 with low TSS content, NPS040 and NPS096 with high TSS content). The results demonstrated that the expression of 10 genes on Chr.06 and 12 genes on Chr.15 were below the detection level, while 18 genes did not change significantly (Figure 5). However, seven (on Chr.06) and four (on Chr.15) genes showed a significant difference at R6 stage in soybean accessions (Figure 5). Based on the expression levels in soybean accessions with significantly different total soluble sugar, we found that the genes Glyma.06g146500, Glyma.06g147600, Glyma.06g148300, Glyma.06g148600, Glyma.06g148700, Glyma.06g148800, Glyma.06g148900, Glyma.15g133700, Glyma.15g134400, Glyma.15g135100, and Glyma.15g135200 were significantly different (Table S4). To further confirm which genes were associated with the total soluble sugar, RT-PCR were taken to analyze the relative expression of these genes from 14 days after flowering (DAF) to 28 DAF. As shown, expression levels were significantly different for most genes between 14 DAF and 28 DAF except Glyma.06g147600 and Glyma.06g148900. Finally, the expression levels of the gene Glyma.15g135200 increased while that of other genes decreased between 14 and 28 DAF (Figure 6; Table S5).
According to gene annotation in the soybean reference genome (Wm82.a2.v1), we identified the homologous genes of nine candidate genes, specifically AT2G21950, AT5G09900, AT1G43130, AT5G09880, AT1G76010, AT5G11720, AT1G30690, AT1G49950, and AT1G30690 (Table 2). These nine genes showed a significant difference in expression during the development of soybean seeds (Figure 6; Table S5).

4. Discussion

The amount of total soluble sugar is one of the most important indexes influencing the taste of fresh vegetable soybean seed [28]. Currently, the development of seed cultivars with high amounts of soluble sugar is one of the most challenging tasks in vegetable soybean improvement. Accordingly, it is essential to identify the genes governing this trait in soybean to improve vegetable soybean quality. In our phenotype dataset, the large phenotype variations observed within soluble sugar allowed us to identify the genes with the largest effects (Figure 1). The soluble sugar of fresh seeds exhibited a normal distribution and varied from 0.58% to 13.99%, which is similar to previous studies [29,30,31].
Fresh vegetable soybean seed soluble sugar is a complex quantitative trait governed by multiple genetic loci, each displaying minor effects. These minor effects are extremely difficult to disentangle due to different environmental factors. Several soybean sugar-related trait loci have been reported in different independent studies [32]. Here, we performed GWAS analysis on the amount of total soluble sugar at the R6 developmental stage. Using a natural population with abundant genetic variation, we identified a total of five significant soluble sugar-related associations involving 27 SNPs on Chr.05, 06, 13, 14, and 15, and explained 8.70% to 18.77% of phenotypic variation (Table 1). On Chr.06 and 15, four significant SNPs with close physical positions were located in different environments, indicating that these SNPs are essential for determining the amount of soluble sugar (Table 1). The SNPs S06_12044239 and S06_12048607 overlap with four previously reported QTLs located in seed protein 34-2, seed coat cracking 3-4, seed glycitein 13-8, and node number 5-1 [33,34]. The variants S15_10810881 and S15_10843821 are described here for the first time.
A total of five potential candidate genes were associated with the total soluble sugar at the R6 stage within the candidate regions of two large-effect SNP markers on Chr.06 (Figure 2; Table 1). On Chr.06, the gene Glyma.06g146500 is homologous to AT2G21950, which encodes a SKP1 interacting partner 6. AtSKIP participates in cytokinin-regulated leaf initiation and several other physiological processes, including flowering, cell cycle regulation, photomorphogenesis, and stress tolerance in Arabidopsis [35,36]. Glyma.06g148300 encodes one of two isoforms for the 26S proteasome regulatory protein (RN) subunit RPN5 and acts redundantly but independently of the paralogous gene RPN5b. Book (2009) showed that the gene pair encoding the regulatory particle non-ATPase subunit (RPN5) has a unique role in proteasome function and Arabidopsis development [37]. In common bean, RPN5 was found to be the most potential strain for ACC deaminase activity and solubilization of various inorganic and organic phosphates and strongly inhibited the growth of plant pathogenic fungi [38]. Glyma.06g148600 encodes an LCV2-likeCOV2 protein located in the Golgi apparatus [39], Glyma.06g148700 is a splicing factor encoding CC1-like protein, and Glyma.06g148800 encodes an Alba DNA/RNA-binding protein. The Alba proteins participate in a variety of regulatory pathways by controlling developmental gene expression, and interact with ribosomal subunits, translation factors, and other RNA-binding proteins [40].
There were four potential candidate genes associated with the total soluble sugar at the R6 stage within the candidate regions of two large-effect SNP markers on Chr.15 (Figure 2; Table 1). On Chr.15, Glyma.15g133700 encodes for a Glycosyl hydrolases family 31 protein (AGLU1). In Oryza sativa, AGLU1 is essential for the resistance of antifungal diseases, which can further enhance antibacterial activity in synergy with RCH10 [41]. Glyma.15g134400 is homologous to AT1G30690, which encodes a Sec14p-like phosphatidylinositol transfer family protein (PITPs). PITPs can mobilize PI from the ER to provide the substrate to the resident kinases for phosphorylation [42]. Glyma.15g135100 encodes telomere repeat binding factor 1 (TRB1), which is a protein from a single-myb-histone (SMH) family [43]. In apple, MdTRB1 acted as a positive modulator of anthocyanin and proanthocyanidin accumulation, and interacted with MdMYB9, which modulates JA-mediated accumulation of anthocyanin and proanthocyanidin [44]. The gene Glyma.15g135200 is homologous to AT2G32440, which encodes ent-kaurenoic acid hydroxylase 2 (AtKAO2) [45]. In Arabidopsis, AtKAO2 is related to the gibberellin biosynthetic gene, which is part of a class of cytochrome P450 mono-oxygenases belonging to the sub-family CYP88A, that catalyze the conversion of ent-kaurenoic acid (KA) to gibberellin (GA) GA12 (the precursor of all Gas) [46]. The expression levels of nine genes either showed a significant increase or decrease in the early stage of soybean seed development (14–28 days). The combined results suggest these genes are potential candidates to participate in the regulation of vegetable soybean seed development and thus influence the amount of total soluble sugar content present at R6 developmental stage seed.

Supplementary Materials

The following supporting information can be downloaded at: https://www.mdpi.com/article/10.3390/agronomy12061470/s1, Table S1: Phenotypic variation for the total soluble sugar (TSS) in two years; Table S2: Candidate genes on Chromosome.06; Table S3: Candidate genes on Chromosome.15; Table S4: The expression levels of candidate genes in NPS004, NPS251, NPS040, and NPS096; Table S5: The expression levels of candidate genes in 14, 21, and 28.

Author Contributions

W.X., Y.Z. and H.C. conceived the study and wrote the manuscript. W.X., S.L., H.L., W.T. and Y.L. performed experiments and collected the phenotypic data. H.Z., Q.W., X.L., X.C. (Xiaoyan Cui), Y.Z. and H.C. analyzed the data. W.Z. and X.C. (Xin Chen) helped revise the manuscript. All authors have read and agreed to the published version of the manuscript.

Funding

This research was funded by the National Key Research and Development Program of China (2018YFE0112200), the Key R&D project of Jiangsu Province (BE2019376), Jiangsu Agriculture Science and Technology Innovation Fund (JASTIF) CX (20)2007, and the priority academic program development of Jiangsu higher education institutions (PAPD).

Data Availability Statement

The data supporting the reported results will be available by request from the corresponding author.

Conflicts of Interest

The authors declare no conflict of interest.

References

  1. Young, G.; Mebrahtu, T.; Johnson, J. Acceptability of green soybeans as a vegetable entity. Mater. Veg. 2000, 55, 323–333. [Google Scholar] [CrossRef]
  2. Hou, A.; Chen, P.; Shi, A.; Alloatti, J.; Zhang, B.; Wang, Y.-J. Sugar Variation in Soybean Seed Assessed with a Rapid Extraction and Quantification Method. Int. J. Agron. 2008, 2009, 484571. [Google Scholar] [CrossRef] [Green Version]
  3. Umer, M.J.; Bin Safdar, L.; Gebremeskel, H.; Zhao, S.; Yuan, P.; Zhu, H.; Kaseb, M.O.; Anees, M.; Lu, X.; He, N.; et al. Identification of key gene networks controlling organic acid and sugar metabolism during watermelon fruit development by integrating metabolic phenotypes and gene expression profiles. Hortic. Res. 2020, 7, 193–206. [Google Scholar] [CrossRef]
  4. Moretti, A.; Arias, C.L.; Mozzoni, L.A.; Chen, P.; McNeece, B.T.; Mian, M.A.R.; McHale, L.K.; Alonso, A.P. Workflow for the Quantification of Soluble and Insoluble Carbohydrates in Soybean Seed. Molecules 2020, 25, 3806. [Google Scholar] [CrossRef]
  5. Shangguan, L.; Song, C.; Leng, X.; Kayesh, E.; Sun, X.; Fang, J. Mining and comparison of the genes encoding the key enzymes involved in sugar biosynthesis in apple, grape, and sweet orange. Sci. Hortic. 2014, 165, 311–318. [Google Scholar] [CrossRef]
  6. Zhang, S.; Du, H.; Ma, Y.; Li, H.; Kan, G.; Yu, D. Linkage and association study discovered loci and candidate genes for glycinin and β-conglycinin in soybean (Glycine max L. Merr.). Theor. Appl. Genet. 2021, 134, 1201–1215. [Google Scholar] [CrossRef] [PubMed]
  7. Fang, C.; Ma, Y.; Wu, S.; Liu, Z.; Wang, Z.; Yang, R.; Hu, G.; Zhou, Z.; Yu, H.; Zhang, M.; et al. Genome-wide association studies dissect the genetic networks underlying agronomical traits in soybean. Genome Biol. 2017, 18, 1–14. [Google Scholar] [CrossRef] [PubMed]
  8. Kumawat, G.; Xu, D.H. A major and stable quantitative trait locus qSS2 for seed size and shape traits in a soybean RIL popu-lation. Front. Genet. 2021, 12, 646102. [Google Scholar] [CrossRef] [PubMed]
  9. Lin, F.; Wani, S.H.; Collins, P.J.; Wen, Z.; Li, W.; Zhang, N.; McCoy, A.G.; Bi, Y.; Tan, R.; Zhang, S.; et al. QTL mapping and GWAS for identification of loci conferring partial resistance to Pythium sylvaticum in soybean (Glycine max (L.) Merr.). Mol. Breed. 2020, 40, 54. [Google Scholar] [CrossRef]
  10. Wu, D.P.; Zhan, Y.H.; Sun, Q.X.; Xu, L.X.; Lian, M.; Zhao, X.; Han, Y.P.; Li, W.B. Identification of quantitative trait loci underlying soybean (Glycine max [L.] Merr.) seed weight including main, epistatic and QTL × environment effects in different regions of Northeast China. Plant Breed. 2018, 137, 194–202. [Google Scholar] [CrossRef]
  11. Zhang, W.; Liao, X.; Cui, Y.; Ma, W.; Zhang, X.; Du, H.; Ma, Y.; Ning, L.; Wang, H.; Huang, F.; et al. A cation diffusion facilitator, GmCDF1, negatively regulates salt tolerance in soybean. PLoS Genet. 2019, 15, e1007798. [Google Scholar] [CrossRef] [PubMed] [Green Version]
  12. Li, X.; Zhou, Y.; Bu, Y.; Wang, X.; Zhang, Y.; Guo, N.; Zhao, J.; Xing, H. Genome-wide association analysis for yield-related traits at the R6 stage in a Chinese soybean mini core collection. Genes Genom. 2021, 43, 897–912. [Google Scholar] [CrossRef] [PubMed]
  13. Korte, A.; Farlow, A. The advantages and limitations of trait analysis with GWAS: A review. Plant Methods 2013, 9, 29. [Google Scholar] [CrossRef] [PubMed] [Green Version]
  14. Slatkin, M. Linkage disequilibrium—Understanding the evolutionary past and mapping the medical future. Nat. Rev. Genet. 2008, 9, 477–485. [Google Scholar] [CrossRef] [PubMed] [Green Version]
  15. Lee, T.; Kim, K.; Kim, J.-M.; Shin, I.; Heo, J.; Jung, J.; Lee, J.; Moon, J.-K.; Kang, S. Genome-Wide Association Study for Ultraviolet-B Resistance in Soybean (Glycine max L.). Plants 2021, 10, 1335. [Google Scholar] [CrossRef]
  16. Yang, Y.; Wang, L.; Zhang, D.; Cheng, H.; Wang, Q.; Yang, H.; Yu, D. GWAS identifies two novel loci for photosynthetic traits related to phosphorus efficiency in soybean. Mol. Breed. 2020, 40, 29. [Google Scholar] [CrossRef]
  17. Zhou, Z.; Jiang, Y.; Wang, Z.; Gou, Z.; Lyu, J.; Li, W.; Yu, Y.; Shu, L.; Zhao, Y.; Ma, Y.; et al. Resequencing 302 wild and cultivated accessions identifies genes related to domestication and improvement in soybean. Nat. Biotechnol. 2015, 33, 408–414. [Google Scholar] [CrossRef] [PubMed] [Green Version]
  18. Ficht, A.; Bruce, R.; Torkamaneh, D.; Grainger, C.M.; Eskandari, M.; Rajcan, I. Genetic analysis of sucrose concentration in soybean seeds using a historical soybean genomic panel. Theor. Appl. Genet. 2022, 135, 1375–1383. [Google Scholar] [CrossRef]
  19. Zhang, W.; Xu, W.; Zhang, H.; Liu, X.; Cui, X.; Li, S.; Song, L.; Zhu, Y.; Chen, X.; Chen, H. Comparative selective signature analysis and high-resolution GWAS reveal a new candidate gene controlling seed weight in soybean. Theor. Appl. Genet. 2021, 134, 1329–1341. [Google Scholar] [CrossRef]
  20. Dubois, M.; Gilles, K.A.; Hamilton, J.K.; Rebers, P.A.; Smith, F.G. A Colorimetric Method for the Determination of Sugars. Nature 1951, 168, 167. [Google Scholar] [CrossRef]
  21. Lipka, A.E.; Tian, F.; Wang, Q.; Peiffer, J.; Li, M.; Bradbury, P.J.; Gore, M.A.; Buckler, E.S.; Zhang, Z. GAPIT: Genome association and prediction integrated tool. Bioinformatics 2012, 28, 2397–2399. [Google Scholar] [CrossRef] [PubMed] [Green Version]
  22. Zhang, Z.; Ersoz, E.; Lai, C.-Q.; Todhunter, R.J.; Tiwari, H.K.; Gore, M.A.; Bradbury, P.J.; Yu, J.; Arnett, D.K.; Ordovas, J.M.; et al. Mixed linear model approach adapted for genome-wide association studies. Nat. Genet. 2010, 42, 355–360. [Google Scholar] [CrossRef] [PubMed] [Green Version]
  23. Yin, L.; Zhang, H.; Tang, Z.; Xu, J.; Yin, D.; Zhang, Z.; Yuan, X.; Zhu, M.; Zhao, S.; Li, X.; et al. rMVP: A Memory-efficient, Visualization-enhanced, and Parallel-accelerated Tool for Genome-wide Association Study. Genom. Proteom. Bioinform. 2021, 19, 619–628. [Google Scholar] [CrossRef] [PubMed]
  24. Li, Y.; Cao, K.; Zhu, G.; Fang, W.; Chen, C.; Wang, X.; Zhao, P.; Guo, J.; Ding, T.; Guan, L.; et al. Genomic analyses of an extensive collection of wild and cultivated accessions provide new insights into peach breeding history. Genome Biol. 2019, 20, 36. [Google Scholar] [CrossRef] [Green Version]
  25. Zhang, T.; Wu, T.; Wang, L.; Jiang, B.; Zhen, C.; Yuan, S.; Hou, W.; Wu, C.; Han, T.; Sun, S. A Combined Linkage and GWAS Analysis Identifies QTLs Linked to Soybean Seed Protein and Oil Content. Int. J. Mol. Sci. 2019, 20, 5915. [Google Scholar] [CrossRef] [Green Version]
  26. Shin, J.; Blay, S.; McNeney, B.; Graham, J. LDheatmap: An R function for graphical display of pairwise linkage disequilibria between single nucleotide polymorphisms. J. Stat. Softw. 2006, 16, 1–10. [Google Scholar] [CrossRef] [Green Version]
  27. Livak, K.J.; Schmittgen, T.D. Analysis of relative gene expression data using real-time quantitative PCR and the 2−ΔΔCT Method. Methods 2001, 25, 402–408. [Google Scholar] [CrossRef]
  28. Saldivar, X.; Wang, Y.-J.; Chen, P.; Mauromoustakos, A. Effects of blanching and storage conditions on soluble sugar contents in vegetable soybean. LWT 2010, 43, 1368–1372. [Google Scholar] [CrossRef]
  29. Hou, A.; Chen, P.; Alloatti, J.; Li, D.; Mozzoni, L.; Zhang, B.; Shi, A. Genetic Variability of Seed Sugar Content in Worldwide Soybean Germplasm Collections. Crop Sci. 2009, 49, 903–912. [Google Scholar] [CrossRef]
  30. Li, Y.-S.; Du, M.; Zhang, Q.-Y.; Wang, G.-H.; Hashemi, M.; Liu, X.-B. Greater differences exist in seed protein, oil, total soluble sugar and sucrose content of vegetable soybean genotypes [Glycine max (L.) Merrill] in Northeast China. Aust. J. Crop Sci. 2012, 6, 1681–1686. [Google Scholar] [CrossRef]
  31. Yu, X.; Yuan, F.; Fu, X.; Zhu, D. Profiling and relationship of water-soluble sugar and protein compositions in soybean seeds. Food Chem. 2016, 196, 776–782. [Google Scholar] [CrossRef] [PubMed]
  32. Ju, S.L.; Kim, S.M.; Kang, S. Fine mapping of quantitative trait loci for sucrose and oligosaccharide contents in soybean [Glycine max (L.) Merr.] using 180K Axiom® SoyaSNP genotyping platform. Euphytica 2016, 208, 195–203. [Google Scholar]
  33. Cregan, P.; Jarvik, T.; Bush, A.L.; Shoemaker, R.C.; Lark, K.G.; Kahler, A.L.; Kaya, N.; VanToai, T.T.; Lohnes, D.G.; Chung, J.; et al. An Integrated Genetic Linkage Map of the Soybean Genome. Crop Sci. 1999, 39, 1464–1490. [Google Scholar] [CrossRef] [Green Version]
  34. Hyten, D.L.; Cannon, S.B.; Song, Q.; Weeks, N.; Fickus, E.W.; Shoemaker, R.C.; Specht, J.E.; Farmer, A.D.; May, G.D.; Cregan, P.B. High-throughput SNP discovery through deep resequencing of a reduced representation library to anchor and orient scaffolds in the soybean whole genome sequence. BMC Genom. 2010, 11, 38. [Google Scholar] [CrossRef] [PubMed]
  35. Zhang, X.; Ju, H.-W.; Huang, P.; Chung, J.-S.; Kim, C.S. Functional identification of AtSKIP as a regulator of the cell cycle signaling pathway in Arabidopsis thaliana. J. Plant Biol. 2012, 55, 481–488. [Google Scholar] [CrossRef]
  36. Zhang, X.; Min, J.-H.; Huang, P.; Chung, J.-S.; Lee, K.-H.; Kim, C.S. AtSKIP functions as a mediator between cytokinin and light signaling pathway in Arabidopsis thaliana. Plant Cell Rep. 2014, 33, 401–409. [Google Scholar] [CrossRef] [PubMed]
  37. Book, A.J.; Smalle, J.; Lee, K.-H.; Yang, P.; Walker, J.M.; Casper, S.; Holmes, J.H.; Russo, L.A.; Buzzinotti, Z.W.; Jenik, P.D.; et al. The RPN5 Subunit of the 26s Proteasome Is Essential for Gametogenesis, Sporophyte Development, and Complex Assembly in Arabidopsis. Plant Cell 2009, 21, 460–478. [Google Scholar] [CrossRef] [Green Version]
  38. Kumar, P.; Dubey, R.C.; Maheshwari, D.K.; Bajpa, V.K. ACC deaminase producing Rhizobium leguminosarum RPN5 isolated from root nodules of Phaseolus vulgaris L. Bangladesh J. Bot. 2016, 45, 477–484. [Google Scholar]
  39. Parsons, H.T.; Christiansen, K.; Knierim, B.; Carroll, A.; Ito, J.; Batth, T.S.; Smith-Moritz, A.M.; Morrison, S.; McInerney, P.; Hadi, M.Z.; et al. Isolation and Proteomic Characterization of the Arabidopsis Golgi Defines Functional and Novel Components Involved in Plant Cell Wall Biosynthesis. Plant Physiol. 2012, 159, 12–26. [Google Scholar] [CrossRef] [Green Version]
  40. Da Costa, K.S.; Galúcio, J.M.P.; Leonardo, E.S.; Cardoso, G.; Leal, É.; Conde, G.; Lameira, J. Structural and evolutionary analysis of Leishmania Alba proteins. Mol. Biochem. Parasitol. 2017, 217, 23–31. [Google Scholar] [CrossRef]
  41. Mao, B.; Liu, X.; Hu, D.; Li, D. Co-expression of RCH10 and AGLU1 confers rice resistance to fungal sheath blight Rhizoctonia solani and blast Magnorpathe oryzae and reveals impact on seed germination. World J. Microbiol. Biotechnol. 2014, 30, 1229–1238. [Google Scholar] [CrossRef] [PubMed]
  42. Ashlin, T.G.; Blunsom, N.J.; Cockcroft, S. Courier service for phosphatidylinositol: PITPs deliver on demand. Biochim. Et Bio-Phys. Acta (BBA) Mol. Cell Biol. Lipids 2021, 1866, 158985. [Google Scholar] [CrossRef] [PubMed]
  43. Schrumpfová, P.P.; Vychodilová, I.; Hapala, J.; Schořová, Š.; Dvořáček, V.; Fajkus, J. Telomere binding protein TRB1 is associated with promoters of translation machinery genes in vivo. Plant Mol. Biol. 2016, 90, 189–206. [Google Scholar] [CrossRef] [PubMed]
  44. An, J.P.; Xu, R.R.; Liu, X.; Zhang, J.C.; Wang, X.F.; You, C.X.; Hao, Y.J. Jasmonate induces biosynthesis of anthocyanin and proanthocy-anidin in apple by mediating the JAZ1–TRB1–MYB9 complex. Plant J. 2021, 106, 1414–1430. [Google Scholar] [CrossRef] [PubMed]
  45. Dunkley, T.P.J.; Hester, S.; Shadforth, I.P.; Runions, J.; Weimar, T.; Hanton, S.L.; Griffin, J.L.; Bessant, C.; Brandizzi, F.; Hawes, C.; et al. Mapping the Arabidopsis organelle proteome. Proc. Natl. Acad. Sci. USA 2006, 103, 6518–6523. [Google Scholar] [CrossRef] [Green Version]
  46. Regnault, T.; Davière, J.M.; Heintz, D.; Lange, T.; Achard, P. The gibberellin biosynthetic genes AtKAO1 and AtKAO2 have overlapping roles throughout Arabidopsis development. Plant J. 2014, 80, 462–474. [Google Scholar] [CrossRef]
Figure 1. Frequency distribution of the total soluble sugar (TSS) in E1 and E2. E1: total soluble sugar in 2019; E2: total soluble sugar in 2020.
Agronomy 12 01470 g001
Figure 2. Manhattan plots and quantile-quantile for the GWAS for soluble sugar in E1 and E2. a E1: total soluble sugar in 2019; b E2: total soluble sugar in 2020. The red line indicates the significance threshold (−log10(p) = 5.5) (color figure online).
Agronomy 12 01470 g002
Figure 3. LD analysis between significant SNPs on chromosome 6 and chromosome 15. (a) Significant GWAS signal for the total soluble sugar on chromosome 6. (b) Pairwise LD analysis between significant SNPs on chromosome 6. (c) Significant GWAS signal for the total soluble sugar on chromosome 15. (d) Pairwise LD analysis between significant SNPs on chromosome 15. The LD plot is represented by the inverted triangle. The LD level between SNPs was indexed by the R2 value. * on chromosome 6 indicates the position of S06_12044239 and S06_12048607 in (b). * on chromosome 15 indicates the position of S15_10810881 and S15_10843821 in (d).
Agronomy 12 01470 g003
Figure 4. Comparison of the total soluble sugar in accessions with different alleles of four significant SNPs by boxplot. (ad) The boxplot of S06_12048067, S06_12044923, S15_110843821, and S15_10180881. n, the number of soybean accessions. *, p < 0.05.
Agronomy 12 01470 g004
Figure 5. Heatmap profiles of expressed candidate genes in soybean accessions. (a) Heatmap profiles of candidate genes on Chr.06; (b) heatmap profiles of candidate genes on Chr.15. Red is higher expression and blue lower, columns refer to accessions and rows to genes.
Agronomy 12 01470 g005
Figure 6. The expression of candidate genes at 14, 21, and 28 DAF. (ai) The relative expression level of Glyma.06g146500, Glyma.06g148300, Glyma.06g148600, Glyma.06g148700, Glyma.06g148800, Glyma.15g133700, Glyma.15g134400, Glyma.15g135100, and Glyma.15g135200 in 14, 21, and 28 DAF. DAF, days after flowering. *, p < 0.05; **, p < 0.01; ***, p < 0.001.
Agronomy 12 01470 g006
Table 1. SNPs significantly associated with total soluble sugar in two years based on GWAS.
YearChr.SNP IDPosition (bp)p-ValueR2
20196S06_12048607120486074.86 × 10−70.156
6S06_12049391120493912.06 × 10−60.156
6S06_12049420120494201.10 × 10−60.154
6S06_12060255120602552.06 × 10−60.156
6S06_12060477120604772.02 × 10−60.158
6S06_12060545120605452.06 × 10−60.156
15S15_10796464107964641.90 × 10−60.112
15S15_10801915108019151.17 × 10−60.110
15S15_10810881108108818.21 × 10−70.112
20205S05_272206927220691.46 × 10−60.168
6S06_12044204120442041.97 × 10−60.158
6S06_12044233120442331.06 × 10−60.156
6S06_12044239120442394.71 × 10−70.158
6S06_12044278120442782.56 × 10−60.156
6S06_12045115120451152.34 × 10−60.121
6S06_12045118120451182.34 × 10−60.121
6S06_12055116120551161.97 × 10−60.158
6S06_12055338120553381.88 × 10−60.160
6S06_12055406120554061.97 × 10−60.158
6S06_47846602478466022.19 × 10−60.133
13S13_426071242607121.69 × 10−60.136
13S13_13999262139992622.48 × 10−60.188
14S14_47665362476653627.82 × 10−70.087
15S15_10819276108192762.64 × 10−60.109
15S15_10828362108283621.90 × 10−60.111
15S15_10843821108438211.43 × 10−70.111
15S15_11110657111106573.01 × 10−60.162
R2: phenotypic variation explained.
Table 2. Candidate genes for the total soluble sugar.
Chr.Start (bp)End
(bp)
Candidate Gene IDHomologous Gene IDFunction Annotation
612044239 12048607Glyma.06g146500AT2G21950SKP1 interacting partner 6 (SKIP6)
Glyma.06g148300AT5G0990026S proteasome regulatory subunit, putative(RPN5) (EMB2107,MSA,RPN5A)
Glyma.06g148600AT1G43130Like COV 2
Glyma.06g148700AT5G09880Splicing factor, CC1-like
Glyma.06g148800AT1G76010Alba DNA/RNA-binding protein
151081088110843821Glyma.15g133700AT5G11720Glycosyl hydrolases family 31 protein
Glyma.15g134400AT1G30690Sec14p-like phosphatidylinositol transfer family protein
Glyma.15g135100AT1G49950Telomere repeat binding factor 1 (ATTRB1,TRB1)
Glyma.15g135200AT5G11720Glycosyl hydrolases family 31 protein
Publisher’s Note: MDPI stays neutral with regard to jurisdictional claims in published maps and institutional affiliations.

