Essay

Morphological and Physiological Responses of Melia azedarach Seedlings of Different Provenances to Drought Stress

Collaborative Innovation Centre of Sustainable Forestry in Southern China, College of Forest Science, Nanjing Forestry University (NJFU), 159 Longpan Road, Nanjing 210037, China
*
Authors to whom correspondence should be addressed.
Agronomy 2022, 12(6), 1461; https://doi.org/10.3390/agronomy12061461
Submission received: 30 May 2022 / Revised: 12 June 2022 / Accepted: 13 June 2022 / Published: 17 June 2022
(This article belongs to the Special Issue Advances in Plant Physiology of Abiotic Stresses)

Abstract

:
Melia azedarach Linn. is a deciduous tree of the Melia genus in the Meliaceae family that is native to China. To study the mechanism of drought resistance in Melia azedarach and evaluate the drought resistance capacity of each provenance, we selected eight provenances (Shandong Kenli, Jiangsu Pizhou, Hubei Shayang, Jiangsu Xuanwu, Jiangxi Xihu, Jiangsu Jurong, Guangdong Luogang, and Henan Shihe) as the research subjects and set four levels of drought stress treatment (CK: 75% of field capacity, mild drought: 60% of field capacity, moderate drought: 45% of field capacity, and severe drought: 30% of field capacity). The results showed that the growth in the seedling height and the ground diameter, the leaf relative water content, transpiration rate (Tr), net photosynthetic rate (Pn), stomatal conductance (Gs), and the content of chlorophyll (Chl) decreased with the increasing stress levels, while the root–shoot ratio, water saturation deficit, and the contents of malondialdehyde (MDA) increased. The SOD in most provenances initially increased and then decreased, reaching a peak during moderate drought. At the late stage of treatment, the magnitude of the changes in the photosynthetic indicators was more pronounced than in the physiological indicators. Principal component analysis showed that the contribution of all four principal components under the three drought stresses was above 85%, which represented the majority of the original data. Combined with the affiliation function method and weights, the comprehensive evaluation value (D value) of the drought resistance was calculated for the eight provenances. Then, we obtained the order of drought resistance of the test materials under the three drought stresses, respectively. The combined results revealed that the drought resistance of Henan Shihe and Jiangxi Xihu was stronger, while the drought resistance of Guangdong Luogang and Hubei Shayang was weaker. Based on the above findings, we can select provenances with strong and weak drought resistance for transcriptome sequencing to screen drought-resistant genes for an in-depth study at the molecular level.

1. Introduction

Water is not only the source of all life, but also the material for plant growth, since it affects the growth of plants and is an important component of the plant itself [1]. Drought stress in plants results from an insufficient amount of water available for the maintenance of normal physiological processes, such as photosynthesis, respiration, and cell, tissue, organ, and plant homeostasis [2]. According to most scientific sources, drylands account for 41% of the world’s land area [3]. China is one of the countries with the highest frequency of drought; arid and semiarid areas account for 47% of China’s territorial area, which threatens the sustainable development of agroforestry [4,5].
Melia azedarach [6] is a deciduous tree of the Melia genus, which also commonly known as the purple flower tree, forest tree, and golden Lingzi. It is a fast-growing and high-quality timber tree; it is also a good nectar plant and a vital plant pesticide. The timber, which resembles mahogany, is used to manufacture agricultural implements, furniture, plywood, etc. Melia azedarach is also of value for the health care and pharmaceutical industries, an effective composition due to its analgesic, anticancer, antiviral, antimalarial, antibacterial, antifeedent, and antifertility activity [7]. Furthermore, it is an important afforestation tree species, as are the surrounding greening tree species.
Melia azedarach is widely distributed. It is native to tropical Asia and has been introduced to the Philippines, the United States of America, Brazil, Argentina, many African countries, and many Arab countries [8]. In China, it is concentrated in the south and southwest, with a relatively concentrated distribution in the east and central regions, and a marginal distribution area in the north, southwest, and southern Shanxi and Gansu [9]. For this reason, Melia azedarach, as a tree native to China, has diverse provenances.
Currently, studies on Melia azedarach include the phenology, reproduction, cultivation, seeding, resistance, pharmacological action, comprehensive utilization, and the chemical constituents in the bark, leaf, and fruit of Melia azedarach [10,11,12], among which the resistance studies include low temperature stress, salt stress, heavy metal stress, water stress, etc. ROS production is a key characteristic of plant responses to various abiotic stresses, which leads to oxidative stress damage in plants. ROS can directly attack the membrane lipids, inactivate enzymes, and damage the nucleic acids leading, in some cases, to cell death [13,14]. As protection against ROS, plants have evolved an efficient defense system, with antioxidant enzymes and nonenzymatic compounds that can neutralize free radicals and reduce the potential damage of ROS. It was found that prolonged drought in Melia azedarach was very detrimental to its growth and the management of plantation forests [15]. It has been found that water stress induced stomatal closure, reduced net CO2 assimilation rate, and the intercellular CO2 in Melia azedarach, as well as the photosynthetic efficiency of PSII but not the pigment levels [16]. Water stress also upregulated the antioxidant enzymes and stimulated the production of antioxidant metabolites, preventing lipid peroxidation [16]. The study shows that Melia azedarach has the potential to acclimate to water shortage conditions. Although Melia azedarach is less distributed in the arid and semiarid regions of China, as a tree species that has been described as a “global problem solver”, we need to consider how it responds when grown in an arid or semiarid region, and how the response varies from one provenance to another.
Thus, we selected eight provenances and studied the drought resistance mechanism of Melia azedarach from the aspects of growth, physiology, and biochemistry. The drought resistance capacity of these eight provenances was evaluated and compared according to principal component analysis, the affiliation function, and the weights. In the following paragraphs, KL, PZ, SY, XW, XH, JR, LG, and SH represent Shandong Kenli, Jiangsu Pizhou, Hubei Shayang, Jiangsu Xuanwu, Jiangxi Xihu, Jiangsu Jurong, Guangdong Luogang, and Henan Shihe, respectively.

2. Materials and Methods

2.1. Plant Material and Experimental Design

Seeds were collected from the different provenances (Table 1) in 2017 and sown in March 2018 at Hefeng Nursery in the Lishui district, Nanjing, Jiangsu province, China. On 18 March 2019, seedlings from each locality with relatively average growth were transplanted to Nanjing Forest University’s Xiashu forest farm in Zhenjing, Jiangsu province (32°7′29″ N, 119°13′9″ E, elevation 20 m). This location has a north subtropical monsoon climate, with an annual average temperature of 15.2 °C, an average frost-free period of 233 days, an annual average precipitation of 1055.6 mm, and an annual average relative humidity of 79%, all of which contribute to a favorable natural environment for tree growth. In total, 260 seedlings were transplanted, each of which were grown in plastic culture pots (top diameter of 19 cm, bottom diameter of 14 cm, and a height of 17 cm) filled with a substrate weighing 3 kg (Vyellow mud:Vbog soil:Vperlite = 5:2:1) and a piece of gauze placed on the bottom of the pot. To ensure the growth and consistency of the seedlings, proper root pruning and cutting treatments were carried out. We plucked off the undesirable shoots until mid-April. After slow seedling management, the seedlings with relatively consistent growth were treated with 4 levels of drought stress, and each treatment contained 4 pots.
This experiment used the artificial water control method for potted plants, and four drought stress gradients were set in this experiment: control treatment (soil water content was 75% of field capacity), mild drought stress (soil water content was 60% of field capacity), moderate drought stress (soil water content was 45% of field capacity), and severe drought stress (soil water content was 30% of field capacity). The soil field capacity of the potting substrate was 32.5%, based on which the water weight under four drought stress treatments was calculated accordingly. Each pot was weighed individually beginning 22 July 2019. Until 2 August, the water content of each pot remained essentially constant within the intended parameters. After that, every other day at 3 p.m., an electronic scale was used to weigh each pot to replace the lost water and keep the water content within the predetermined range.
Drought stress treatment terminated on 26 August, and samples were taken on 2 August, 12 August, and 22 August, respectively. On branches in the middle of Melia azedarach, we chose leaves with essentially the same growth condition. Mixed samples were taken from four plants in each treatment, which were then separated into Ziploc bags by locality and treatment. All of the samples were put in an ice box and returned to the lab. Part of the fresh leaves was used for the indexes that needed to be determined immediately, while the rest was kept at −80 °C in an ultra-low temperature refrigerator. Three replicates were performed for each treatment from each provenance to determine the indicators.

2.2. Determination of Indexes

2.2.1. Determination of Field Water Capacity

The ring knife method was used to evaluate the field capacity (Sun et al., 2011) [17].

2.2.2. Measurement of Seedling Height and Ground Diameter

Four plants were chosen from each treatment of each provenance. On 2 August, the seedling height was measured as H0 with a tape measure, and the ground diameter was measured as G0 with a Vernier caliper. On 22 August, it was recorded as H1 and G1, for a seedling height growth of H = H1 − H0 and a ground diameter growth of G = G1 − G0.

2.2.3. Determination of Biomass

Three pots were chosen at random for destructive sampling of each provenance according to treatment at the end of the drought stress. We cleaned and dried the roots, weighed the roots, leaves, branches, and stems using electronic scales, and put them into envelopes with labels. They were heated for 30 min at 105 °C, then dried to a constant weight in an oven at 80 °C, and weighed individually.

2.2.4. Leaf Relative Water Content and Leaf Water Saturation Deficit

Leaf relative water content and leaf water saturation deficit were measured by the drying weighing method [18]. We took the fresh leaf, weighed its fresh weight, put the leaf in distilled water, and soaked it until saturation. Then, we put the leaves into the oven at 105 °C for 30 min; thereafter, we dried them at 80 °C to a constant weight and weighed their dry weight.

2.2.5. MDA Content

The thiobarbituric acid method [19] was used, with some modifications, with the weight of the fresh leaf sample, 0.2 g in this experiment, and centrifugation speed, 4000 r/min in this experiment.

2.2.6. Superoxide Dismutase Activity

The NBT photochemical reduction method was used [19].
First, 50% of the NBT photochemical reduction was expressed as an activity unit (U) of SOD enzyme; then, the SOD activity was calculated as follows:
SOD   total   activity   ( U · g 1 ) =   A Ck A E V T 1 2 A Ck m V s
The total SOD activity was expressed in units of enzyme per gram of fresh weight of sample (U·g−1). ACK is the absorbance of illumination pair care, AE is the absorbance of the sample tube, VT is the total volume of the sample solution (mL), VS is the amount of the sample at the time of determination (mL), m is the fresh mass of the sample (g), 1/2 is the conversion factor for one unit of enzyme defined (50% inhibition of NBT photoreduction).

2.2.7. Chlorophyll Content

The determination of the chlorophyll content was slightly modified from X-K Wang’s ethanol extraction method (We eliminated the grinding step and soaked the leaves in 95% ethanol protected from light until they turned white) [19]. The chlorophyll content was calculated according to the following formula:
Ca = 13.95 A665 − 6.88 A649
Cb = 24.96 A649 − 7.32 A665
Chloroplast   pigment   content   ( mg / g ) = C V N m 1000
C is the pigment content (mg/L); V is the volume of extracted liquid (mL); N is the dilution ratio; m is the sample mass (g); and 1000 means 1 L equals 1000 mL.

2.2.8. Photosynthetic Indexes

A CIRAS-3 photosynthesizer manufactured by pp Systems LTD in the UK was used. The light intensity and CO2 concentration were set to 500 μmol m−2 s−1 and 400 ± 20 μmol mol−1, respectively. Mature leaves in the middle of the plant with similar sizes were selected to determine the intercellular carbon dioxide concentration (Ci), net photosynthetic rate (Pn), transpiration rate (Tr), and stomatal conductance (Gs) at three periods (before, during, and after treatment), respectively. For each treatment, three plant pots were selected at random.

2.3. Data Statistics and Analysis

Data analysis was performed by SPSS 25. Data analysis between the different provenances was tested by one-way ANOVA, and the significance of differences was obtained by Duncan’s test. The presence of outliers was judged by box plots, and the Shapiro-Wilk normality test was used. when the assumption of variance chi-squared was not satisfied, welch ANOVA was used. The graphs in the text were created using origin pro.

2.3.1. Principal Component Analysis

The data for performing principal component statistical analysis were the ratio of the measured values under the three drought stresses to the measured values of the control (drought tolerance coefficient).
The Kaiser–Meyer–Olkin (KMO) and Bartlett tests were first performed on the data, and the principal components were extracted according to the cumulative contribution rate greater than 85% or the eigenvalue greater than 1 for the principal component analysis to determine the composite indexes. The value of each composite indicator was calculated according to the following formula:
Y i k = j = 1 n X i j × f j k
In the formula: Yik is the value of the kth composite index of the ith provenance, Xij is the drought tolerance coefficient of the jth index of the ith provenance, and fjk is the score coefficient of the jth index of the kth composite index, which is the corresponding eigenvector, calculated by the following formula:
f j = b j k λ k
In the formula: bjk is the loading coefficient of the jth indicator in the kth principal component, and λk is the kth principal component of the eigenvalues.

2.3.2. Calculation of Affiliation Function Values

The value of the affiliation function for each composite indicator per provenance was obtained by the following formula:
U Y i k = Y i k X k m i n X k m a x X k m i n
In the formula: Yik is the value of the kth composite index of the ith provenance, Xkmin is the minimum value of the kth composite index, and Xkmax is the maximum value of the kth composite index.

2.3.3. Comprehensive Evaluation of Drought Resistance

First, we calculated the weight of each composite index affiliation function value according to the following formula:
w k = p k Σ k = 1 n P k k = 1 , 2 ,   n
In the formula: Wk denotes the importance of the kth composite indicator among all composite indicators; Pk is the contribution rate of the kth composite indicator of each provenance.
The degree of drought resistance by provenance is indicated by D:
D = k = 1 n U Y i k × w k k = 1 , 2 ,   n

3. Results

3.1. Seedling Height Increment and Ground Diameter Increase

With the deepening of the drought stress and the extension of the stress time, the seedling height growth of the eight provenances declined to varing degrees (Table 2). The variation in the seedling height growth for all test materials ranged from 13.43 to 24.63 cm, 11.68 to 17.35 cm, 2.93 to 14.70 cm, and 1.63 to 9.40 cm under the control, mild drought, moderate drought, and severe drought, respectively. The difference in seedling height growth of the XH was not significant under all four treatments, but the other seven provenances were significantly different between the control and under severe drought (p < 0.05). In terms of the decline relative to the control group, that of the XW decreased less (32.17%, 51.88%) and that of the JR decreased more (83.22%, 91.74%) under moderate and severe drought.
The ground diameter increase in the eight provenances basically showed a decreasing trend, except for the KL, where the ground diameter growth under moderate drought stress increased slightly compared to the mild drought. The LG had the largest increase in ground diameter in the control group (2.74 cm), nearly double that of the other provenances. Meanwhile, as the stress increased, the decrease in the LG’s ground diameter was the highest in all stress treatments relative to the control group (68%, 78%, and 88%) (Table 3).

3.2. The Biomass and Root–Crown Ratio

After the drought stress treatment, destructive sampling was used to determine the dry weight of the aboveground and underground parts, as well as the root–crown ratio of the seedlings. It can be shown that when the stress level increased, the aboveground biomass of the eight provenances declined, while the underground part exhibited a general rising trend. Under severe drought stress, the aboveground biomass of the JR, as well as the underground biomass of the SH, were considerably different from that of the control group (p < 0.05). In terms of the decrease in aboveground biomass, that of the XH had the highest decline (13.24%), while that of the SY had the lowest decline (2.32%). The SH had the largest increase (12.14%) in underground biomass, while the XW had the smallest increase in underground biomass (1.68%) (Table 4).
The root–crown ratio of the eight provenances tended to rise in general. The severe drought stress in the JR differed significantly from the other treatments, which were similar to the severe drought stress in the SH and the control group. Numerically, the PZ had a larger root–crown ratio than the other seven provenances under any treatment, while the LG had a smaller root-crown ratio than the other provenances following drought stress (Table 5).

3.3. Leaf Water Status

The relative water content of the seedling leaves decreased as the stress increased in the three sample periods (Figure 1). The average relative water content of the leaves of the JR was the highest in the early and middle stages of the experiment (67.64%, 83.06%) but the lowest in the late stage of stress (68.57%). The LG was also affected by this change, and the average value over time was only slightly lower than that of the JR. When compared to the control group, that of the PZ had the smallest fall in all three drought stress treatments, while that of the JR had the largest decrease under mild and moderate drought stress, and that of the KL had the largest decrease under severe drought stress.
With the escalation in stress, the leaf water saturation deficit of the eight provenances gradually rose (Figure 2). When compared to the control group, the increase in the water saturation deficit of the SY was always the largest under drought stress, while that of the KL was the lowest under mild and severe drought stress, and the PZ saturation deficit increased the least under moderate drought stress. Numerically, the water saturation deficit of the SH was higher in the late stage of stress (153.66%, 171.19%, 192.21%). The longer the duration of stress and the greater the degree of stress, the more significant differences were shown between the eight provenances (p < 0.05).

3.4. Response of Photosynthesis and Photosynthetic Pigment

The changes in the photosynthetic parameters were distinct in each of the eight provenances. At each treatment level, the average Pn and Tr of the SH were relatively high throughout the experimental period. In the early stages of treatment, the Pn of the SY and JR under drought stress was significantly different from that of the control group. The Pn and Tr of the SH under severe drought stress were considerably different from those of the control group in the middle of the treatment, while the Pn and Tr of the XW under severe drought stress were likewise significantly different from those of the control group in the late stage of treatment (p < 0.05) (Figure A1 and Figure A2). It is obvious that both the Pn and Tr of the SH were higher in the middle period of the stress (Figure 3 and Figure 4).
Under the control group and mild drought, the Ci of the KL was higher, whereas that of the SY was higher under moderate and severe drought (Figure 5). The average values of the Ci in the LG were the lowest under the three drought stress treatments (226.17, 207, and 209.17 μmol·mol−1). The average of the KL’s Gs in three periods was the largest among the eight provenances under the four treatment levels; whereas, the that of the XH was the smallest under mild and moderate drought stress, and that of the JR was the smallest under the control and severe drought stress (Figure 6).
As the stress degree and duration increased, the chlorophyll A content of the eight provenances dropped or increased initially and subsequently decreased (Figure 7). The average chlorophyll A content of the SH was the highest in all four treatment levels (2.636, 2.662, 2.656, and 2.582 mg/g), while that of the PZ was the lowest (1.776, 1.727, 1.634, 1.640 mg/g). In the early stages of the treatment, the average chlorophyll A content of the severe drought stress groups of PZ, SY, and LG were significantly different from that of the control group, as were those of the severe drought stress groups of SY and XH in the late stages (p < 0.05). In the middle of treatment, the average chlorophyll A content of both the LG and SH under mild drought stress was significantly different from that of the control group (p < 0.05). The chlorophyll A content of the JR, LG, and SH under mild and moderate drought stress was considerably different from that of the control group in the later treatment period (p < 0.05) (Figure A3). It is apparent that the chlorophyll content of SY was the lowest in each period and under each treatment.

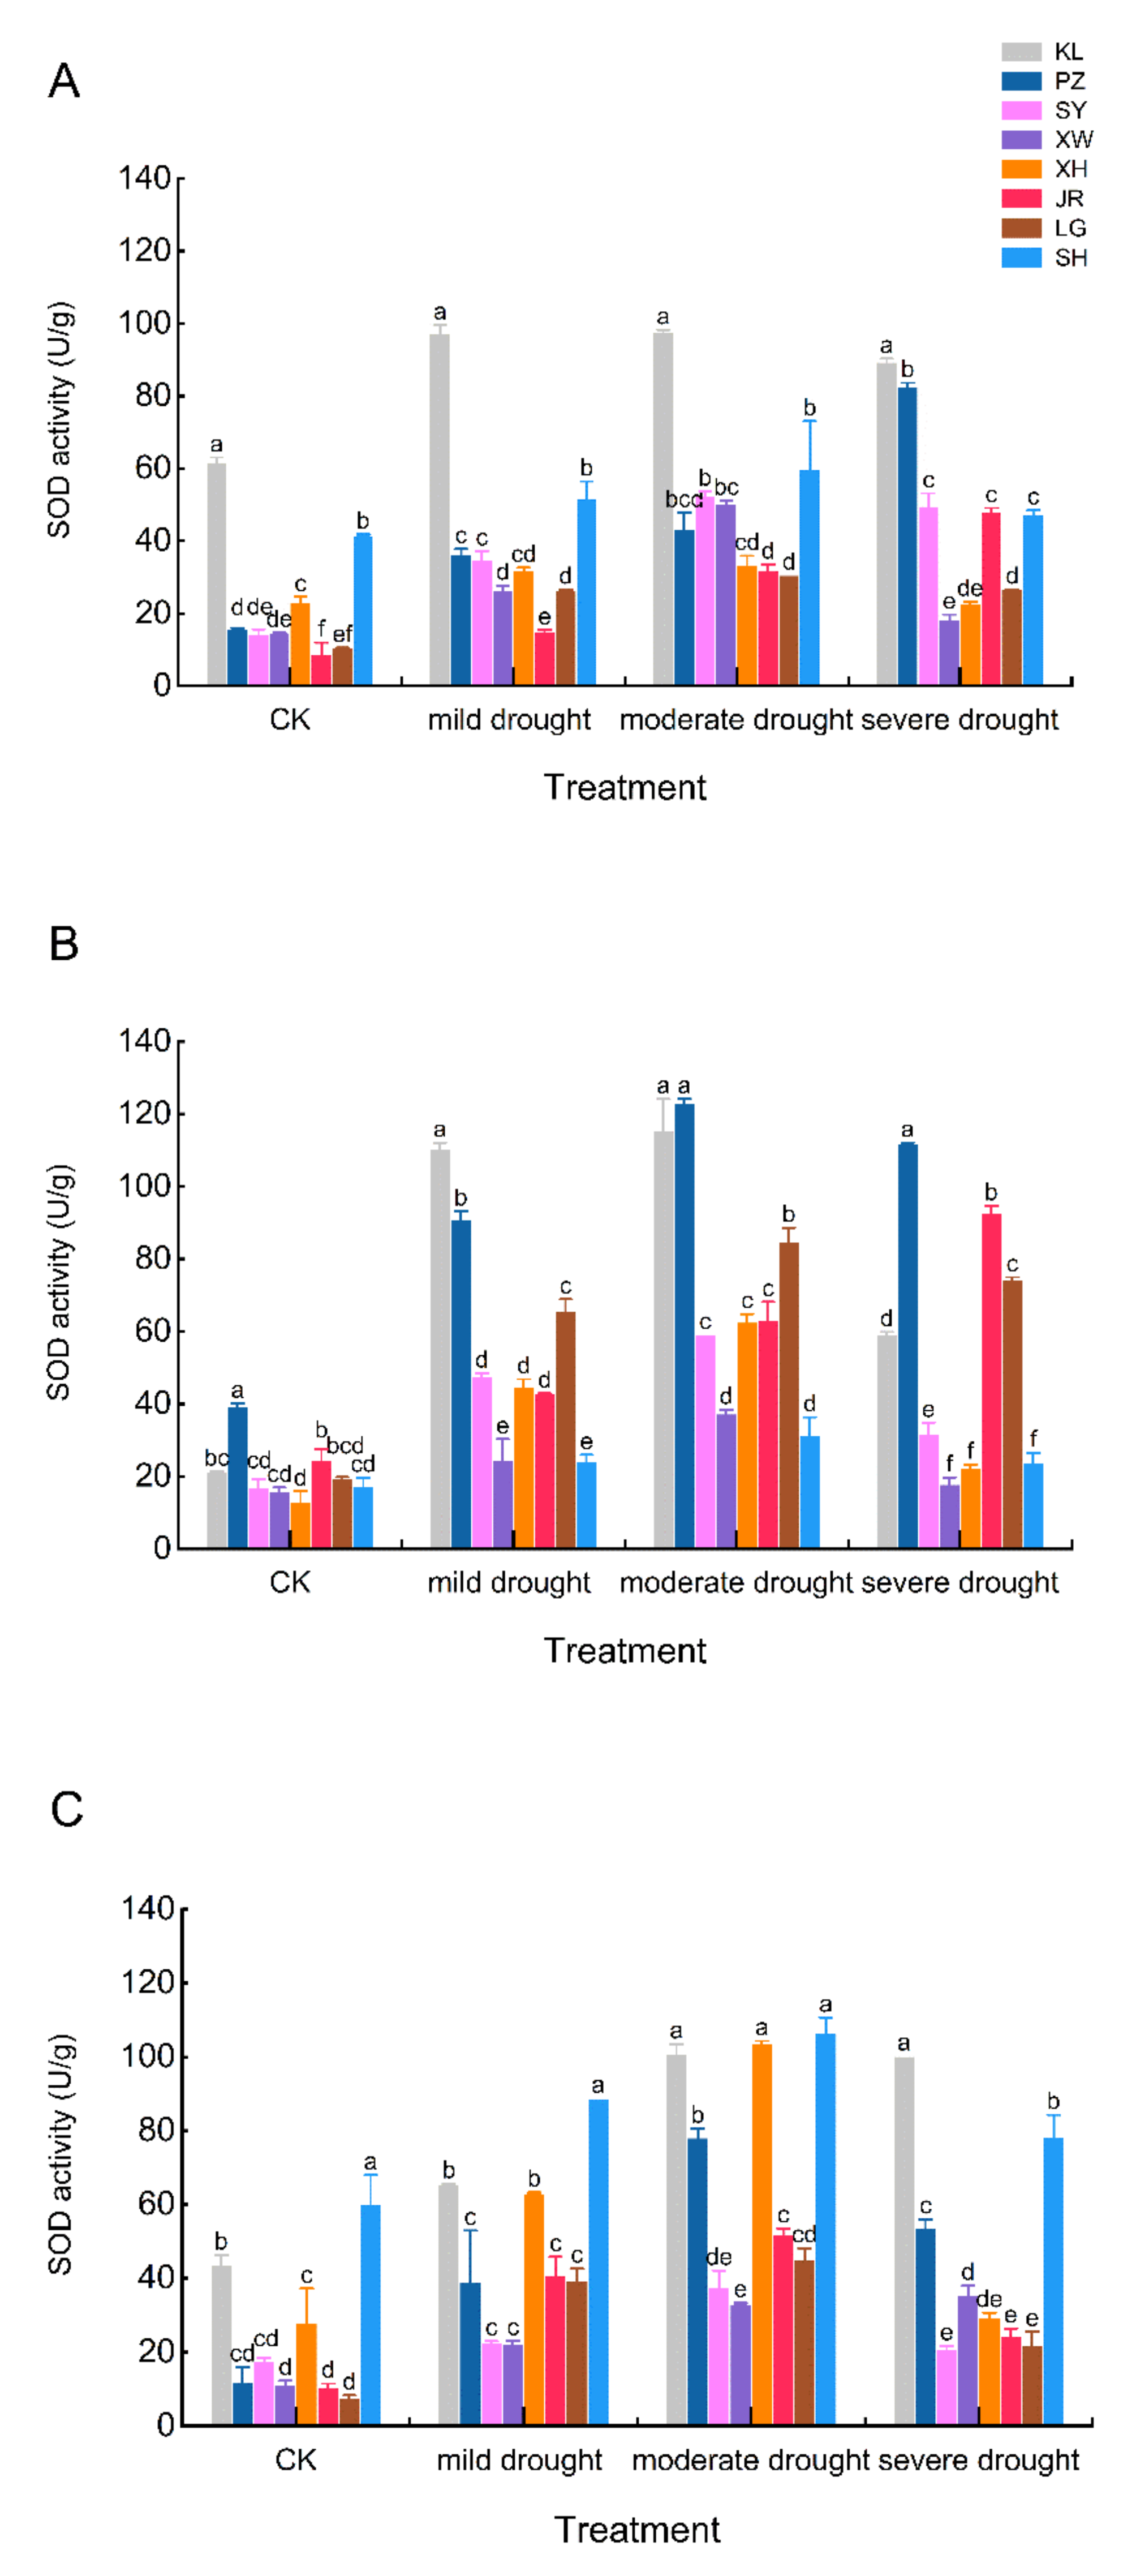
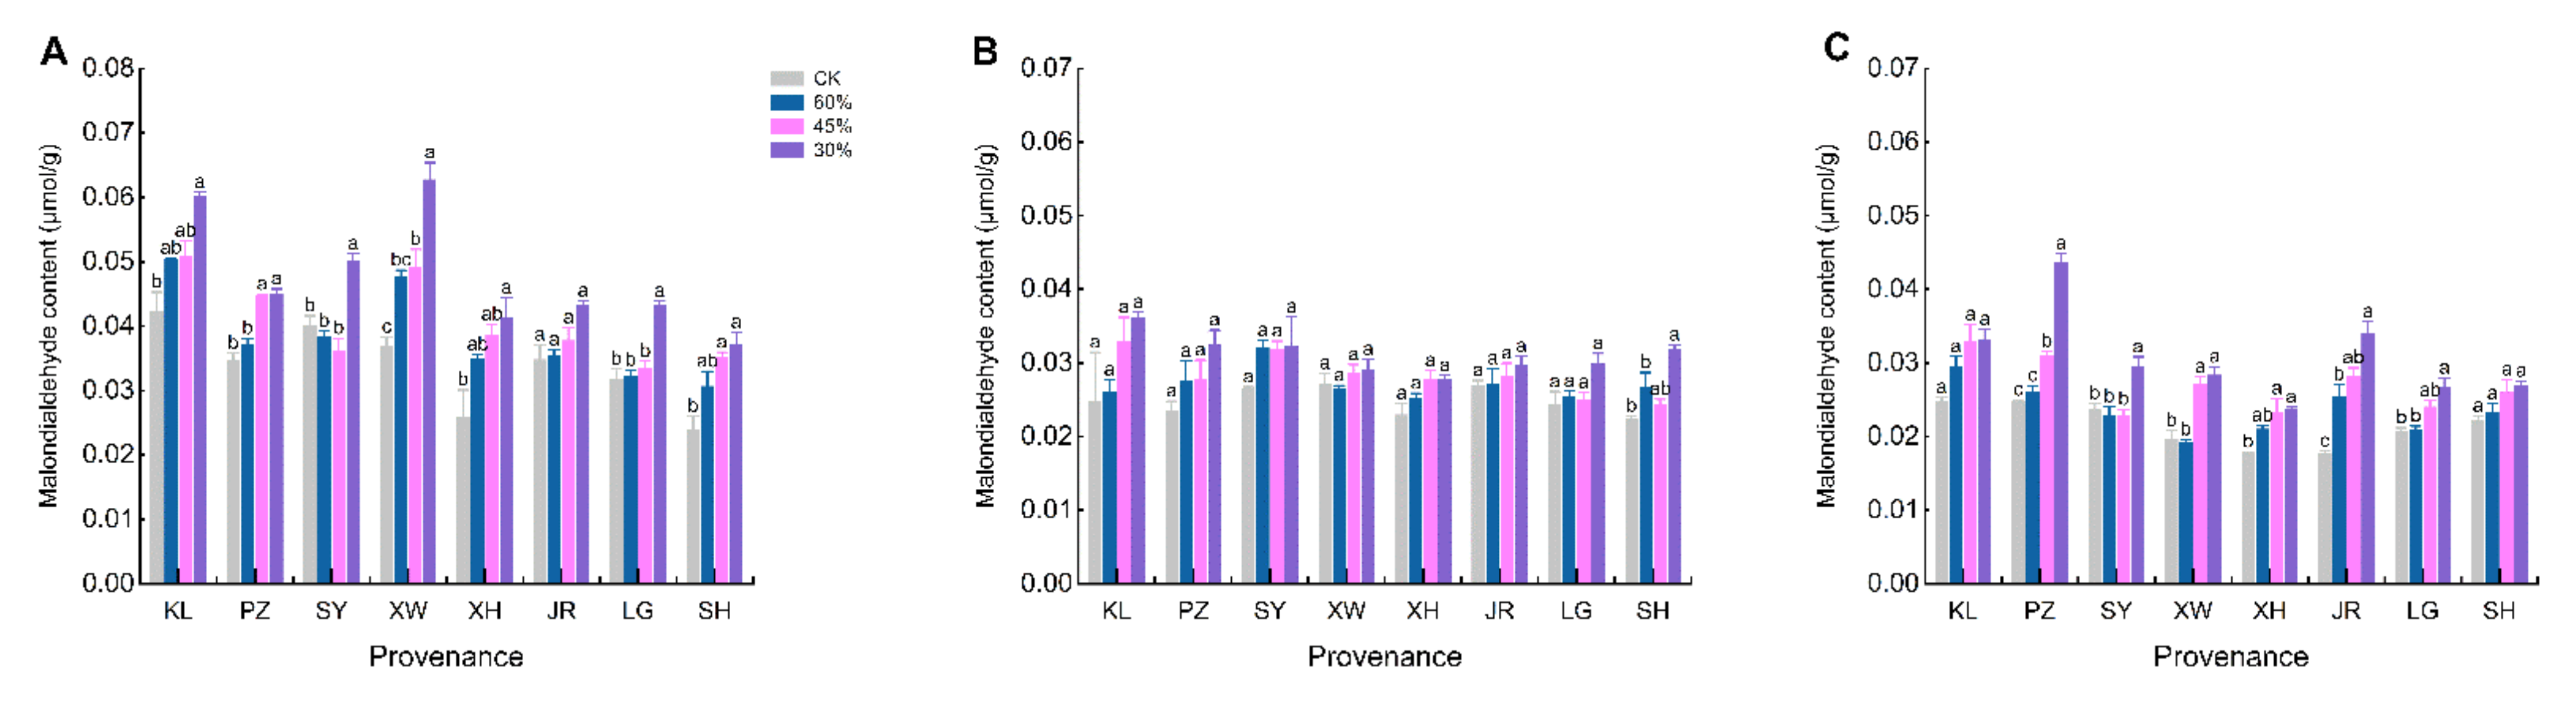
3.5. Response of MDA and SOD

The change in the MDA rose gradually as the level and duration of the stress increased (Figure 8). In all four treatment levels, the KL had the highest average MDA (0.0308, 0.0355, 0.0390, and 0.0433 μmol/g). Under control and severe drought stress, the XH MDA was the lowest (0.0223 and 0.0311 μmol/g), whereas that of the LG was the lowest (0.0006 and 0.0276 μmol/g) under mild and moderate drought stress. All provenances, with the exception of the JR, demonstrated a substantial difference in MDA in severe drought stress in the early stages of treatment as compared to that of the control group (p < 0.05). In the middle of the treatment, only the MDA in the severe drought group of the SH was significantly different from that of the control group (p < 0.05). Except for the KL and SH, there was a significant difference between the MDA in the severe drought and the control group at the late stages of treatment in six provenances (p < 0.05) (Figure A4).
The SOD activity decreased after the initial increase with the deepening of the stress degree and the extension of the stress time (Figure 9). The average SOD activity of the KL under the four treatment levels was the highest (42.128, 90.948, 104.59, and 82.879 U/g), while that of LG was the lowest in the control group (12.444 U/g), and that of XW was the lowest in the three drought stress treatment groups (24.406, 40.158, and 23.920 U/g). In the early and middle stages of treatment, the SOD of the KL, PZ, SY and LG under the three drought stresses were significantly different from that of the control group (p < 0.05), as was that of the JR in the middle stage of treatment and that of the KL and the XW in the late stage of treatment (Figure A5).

3.6. Comprehensive Evaluation of the Drought Resistance of Melia azedarach in Different Provenances

The correlation analysis of the drought resistance coefficients of the 12 indicators of Melia azedarach shows that there was a correlation between all the measured indicators (Table A1, Table A4 and Table A7). Individual indicators or some of them could not fully evaluate the drought resistance of each provenance. In addition, the weight of the individual indicators for the evaluation of the drought resistance in Melia azedarach was inconsistent. Therefore, the drought resistance of Melia azedarach should be analyzed through the screening of the combined indicators.
The results of the principal component analysis of the 12 indicators showed that there were four principal components with eigenvalues greater than 1 under the three drought stresses, with cumulative contributions of 86.539%, 91.285%, and 85.526%, respectively (Table 6, Table 7 and Table 8). This indicates that these four principal components reflected most of the information of the original data, and a comprehensive evaluation of Melia azedarach drought resistance can be carried out by these four integrated indicators.
The D value represents the comprehensive evaluation of the drought resistance of each provenance under drought stress; the larger the value, the more drought resistant it was.
As can be seen from Table 9, Table 10, Table 11, the drought resistance of the eight provenances of Melia azedarach under mild drought stress was ranked from largest to smallest: XH, LG, JR, XW, KL, SH, PZ, and SY. The ranking under moderate drought stress was: SH, XH, KL, JR, XW, PZ, SY, and LG, and under severe drought stress, it was: SH, XH, XW, KL, PZ, JR, SY, and LG. The drought resistance of the XH was stronger, while that of the SY was poorer, under all three drought stresses. The SH ranked lower under mild drought, but was the most resistant to drought under moderate and severe stress. The LG, in contrast, had the weakest drought resistance under moderate and severe stress.

4. Discussion

4.1. Morphological Growth

The analysis of plant growth under water deficit conditions is important for understanding plant responses to drought stress at the whole plant level [20]. Drought can have a devastating impact on plant growth [21]. It inhibits seedling growth by lowering carbon domestication and allocation as well as slowing cell expansion [22]. The reduction in plant height is mainly due to reduced cell expansion, increased leaf abscission, and impaired mitosis under drought conditions [23]. Morphological changes in plants under drought stress include a decrease in the size, area, and number of leaves and an increase in the length of roots and shoots. This is due to the stimulation of the ABA precursor ACC, which prevents the growth and early maturation of the roots. The rapid root growth and low number of stomata increase leaf thickness, curling, folding, and wax formation, thus preventing water loss from leaves and roots [24]. Under drought stress, the leaf area, seedling height, ground diameter, biomass, root–shoot ratio and other indexes have been used to evaluate the drought resistance of the test materials. Most studies have shown that the seedling height, ground diameter, and biomass were all inhibited to varying degrees, but the root–crown ratio increased slightly or significantly with the increase in drought stress [25,26,27]. This has been explained by studies in that when plants are stressed by drought, the biomass is distributed more underground in order to absorb more water and nutrients, while minimizing water loss due to transpiration [28]. It also can be concluded from the studies of Ying, Narayan Bhusal, and Lei et al. that drought stress had distinct impacts on the morphological growth of various tree species, as well as on different variations or provenances of the same tree species [29,30,31]. In this study, the seedling height growth, ground diameter growth, and the aboveground biomass of different provenances declined as the stress levels increased, which was consistent with the above results. In addition, the underground biomass increased with the deepening of the stress degree, and the root–crown ratio also exhibited an upward trend in this study. The underground biomass and root–crown ratio of the SH increased significantly under severe drought stress compared to that of the control group, which showed that the SH was more sensitive to drought stress and utilized the water in the soil by increasing the biomass of the belowground part.

4.2. Water Status

When plants are stressed by drought, the rate of water loss by transpiration from leaves exceeds the rate of water uptake through roots [32]. The tissue water content and water potential decrease dramatically, and the cells lose tension, which makes the leaves appear curled, yellowed, scorched, and permanently wilted [33]. The relative water content, leaf water potential, stomatal resistance, transpiration rate, leaf temperature, and canopy temperature are important characteristics that affect plant–water relations [34]. The leaf relative water content and leaf water saturation deficit are key markers of plant water status and are frequently used by researchers to assess plant drought tolerance. The exposure of plants to drought stress substantially decreased the leaf water potential, relative water content, and transpiration rate, with a concomitant increase in leaf temperature but increased leaf water saturation deficit. [35]. This study yielded the same findings. In addition, the relative water content of the leaves in the PZ declined the least in comparison to that of the control group, but the water saturation deficit of the leaves in the SY rose the highest, indicating that the PZ and SY had greater water retention abilities under drought stress.

4.3. Photosynthesis and Photosynthetic Pigment

Photosynthesis is “the most important chemical reaction on Earth”. The main force behind plant growth and biomass production is photosynthesis, which provides the energy and carbon needed for the biosynthesis of the organic compounds needed for development [36]. Drought stress causes photosynthetic inhibition, which happens as a result of stomatal closure, chlorophyll degradation, and damage to the photochemical equipment, leading to a reduction in the intercellular CO2 concentration (Ci) [37]. According to the intercellular carbon dioxide concentration, stomatal conductance, transpiration rate, and net photosynthetic rate, researchers frequently evaluate and explore plant stress resistance and the factors that cause a drop in the photosynthetic rate. Previous studies have offered an explanation for the Pn decline: when Gs decreases while Ci increases or remains steady, it is non-stomatal limitation. When both Gs and Ci decrease, it is stomatal limitation [38]. During drought, plants tend to reduce water loss due to transpiration, which is consistent with our findings [39]. The Pn and Gs exhibited a declining trend as the stress levels increased in studies by Silva, Wu, Gao et al. [40,41,42], which was consistent with the results of previous studies. In this study, the KL had the highest Gs under all treatments, and the highest Ci under the control and mild drought. The Gs of the XH was the lowest under mild and moderate drought, while the Gs of the JR was the lowest under the control and severe drought. The Ci of the LG was the lowest under drought stress. It was found, as shown in the figure, that in the early stages of drought stress, the decrease in Pn in several provenances might be caused by some damage to the chloroplast structure to a certain extent, the intensification of membrane lipid peroxidation, and the generation of superoxide free radicals and other non-stomatal restrictions, which corresponded to the decrease in chlorophyll A and the increase in MDA. In the middle stage of drought stress, stomatal restriction was the major reason for the Pn decline in most provenances, which might be due to the adaptation of the test materials to water stress. At the late stage of drought stress, the XW, JR, and LG were affected by non-stomatal restriction, and not only did the chlorophyll A decrease, but the MDA increased, and the SOD activity also decreased, indicating that these three provenances were severely impacted by drought stress and had poor drought resistance.
Chlorophyll plays an indispensable role in the absorption, transmission, and transformation of light energy in photosynthesis. Plants accumulate a considerable quantity of reactive oxygen species in their bodies during drought stress, leading to changes in membrane structure and consequently altering chlorophyll concentration [43]. Among them, chlorophyll A is a component of the photosynthetic reaction center and LHC (the most abundant pigment protein complex in thylakoid membrane) [44]. According to Ghobadi, M., et al. [45,46], the value of chlorophyll A under sufficient water stress was higher than that under moderate and severe drought stress. On the other hand, drought stress has been shown in certain experiments to increase the chlorophyll content [47,48]. The chlorophyll A content of the eight provenances in this study was not always highest in the control group, which could be related to the enrichment effect of leaf water loss and extended leaf growth. It is also conceivably due to other elements, such as light. The chlorophyll A content of the SH was the highest under the four treatments, indicating that it had superior photosynthetic efficiency, could maintain plant growth, and was more drought resistant.

4.4. Membrane Lipid Peroxidation and Protective Enzyme Activity

Under the normal growth of plants, the production and elimination of free radicals in cells are balanced. However, under drought stress, the cell structure is disrupted, the relative permeability of plasma membrane of cells increases, and the internal oxides increase, leading to cell membrane peroxidation [49]. Malondialdehyde is the final decomposition product of the membrane lipid peroxidation reaction in plants, which has been used as a lipid peroxidation marker in studies related to oxidative stress and redox signaling [50]. Its content will increase when plants suffer from adversity. Khaleghi and Marcia Carvalho et al. [51,52] found in drought stress experiments that malondialdehyde content increased as the depth of the drought stress increased, supporting the results of our study, and indicating that drought stress induced or exacerbated the membrane lipid peroxidation. It was found that under moderate and severe drought stress, the MDA content in the SY increased the least compared to that of the control group, indicating that the damage degree of the cell membrane in the SY was the least. It is worth noting that the MDA content of the KL was the highest under the four treatments, and the rate of increase in the drought stress treatment group was relatively higher than that of the control group. At the same time, the SOD activity of the KL was the highest among the four treatments, and the increase in SOD activity in the drought stress group was also larger than that in the control group. As a result, plants with increased SOD activity may be able to defend against reactive oxygen species produced by membrane lipid peroxidation, making them more drought-resistant.
One of the most essential defensive enzymes for scavenging superoxide anions and H2O2 is superoxide dismutase (SOD). When plants are exposed to drought, they will scavenge accumulated superoxide radicals by increasing the superoxide dismutase activity, in order to maintain the balance of the reactive oxygen metabolism, and slow down the damage caused by free radicals to the cell membrane system, allowing plants to resist drought to some extent. In this study, the SOD activity of different provenances increased initially and, then, subsequently decreased with increasing stress levels, which was consistent with the results of Wang, Zhang et al. [53,54]. Among them, the SOD activity of the KL was the highest in all treatments. The SOD activity of the LG was the lowest in the control group. Under drought stress, the SOD activity of the XW was the lowest. In the study of stress, catalase (CAT), peroxidase (POD), ascorbate peroxidase (APX), and other antioxidant enzymes are commonly utilized as physiological indicators to identify plant stress resistance. Multiple indicators can help to strengthen a conclusion.

5. Conclusions

The relative water content of the leaves in the eight provenances declined as the drought stress became more severe; whereas, the water saturation deficit increased. In different stress treatment periods, the changes in the intercellular CO2 concentration in the eight provenances were not consistent. With the deepening of the drought stress, the transpiration rate, net photosynthetic rate, and stomatal conductance of the eight provenances showed a general trend of decline, and the drop in the net photosynthetic rate was mainly due to stomatal and non-stomatal factors. In general, chlorophyll A content decreased. With the severity of the drought stress, the malondialdehyde content showed an increasing trend, and the SOD activity increased at first and, then, decreased. A comprehensive evaluation of drought resistance was performed for eight provenances of Melia azedarach. The results showed that the SH and XH were more drought resistant, while the LG and SY were less drought resistant.
The physiological mechanism of the drought stress response in the eight different provenances was preliminarily identified from the growth traits and physiological responses in this study, and the drought resistance ability of the eight provenances was ranked. If the molecular response mechanism of Melia azedarach to drought stress can be analyzed at the transcriptome level, it will help to identify prospective drought-resistant genes in Melia azedarach. These results may be used to build a drought resistance gene database for Melia azedarach and provide a theoretical basis for studying the molecular mechanism of Melia azedarach’s drought stress response.

Author Contributions

Conceptualization, W.Y. and C.H.; methodology, W.Y. and C.H.; software, J.C. and Z.L.; validation, F.Y. and W.Y.; investigation, C.H. and W.Y.; resources, W.Y.; writing—original draft preparation, C.H.; writing—review and editing, F.Y., W.Y. and H.C.; project administration, F.Y.; funding acquisition, F.Y. All authors have read and agreed to the published version of the manuscript.

Funding

The research was funded by the National Important Research and Development Program Subjects, grant number 2017YFD0600701, the National Natural Science Foundation of China, grant number C161101, and the Forestry Science and Technology Innovation and Promotion Project in Jiangsu Province, grant number LYKJ(2021)30.

Institutional Review Board Statement

Not applicable.

Informed Consent Statement

Not applicable.

Conflicts of Interest

The authors declare no conflict of interest.

Appendix A

Table A1. Correlation analysis of the drought resistance coefficients of each index under mild drought stress.
IndicatorRWCWSDChlATrPnGsCiMDASODSeedling HeightGround DiameterRoot–Crown Ratio
RWC1.000
WSD0.1421.000
ChlA−0.3290.7171.000
Tr−0.349−0.3540.0751.000
Pn−0.087−0.650−0.3040.4601.000
Gs−0.510−0.3240.0070.6010.1991.000
Ci−0.1180.0340.3150.199−0.0280.4531.000
MDA−0.443−0.546−0.0460.3330.4690.4470.7061.000
SOD0.245−0.129−0.2970.2110.070−0.524−0.659−0.4221.000
Seedling height−0.170−0.1850.0140.0160.1520.407−0.268−0.190−0.3401.000
Ground diameter−0.326−0.1030.3240.2570.1900.4840.9480.857−0.673−0.2041.000
Root–crown ratio−0.2300.0240.027−0.413−0.0740.3770.5310.439−0.9100.1620.5671.000
Table A2. The eigenvectors of the principal components under mild drought stress.
TraitsComponents
P1P2P3P4
Ground diameter0.44−0.080.23−0.12
MDA0.410.180.17−0.22
Ci0.40−0.170.26−0.16
SOD−0.370.280.320.04
Gs0.350.15−0.190.31
Root–crown ratio0.32−0.25−0.36−0.25
WSD−0.12−0.520.160.23
Pn0.130.45−0.02−0.08
Tr0.150.380.320.40
Chl A0.10−0.370.260.47
Seedling height0.040.08−0.630.36
RWC−0.24−0.070.01−0.43
Table A3. The value of the comprehensive indexes of the different provenances under mild drought stress.
ProvenanceYik
Yi1Yi2Yi3Yi4
KL0.840.370.930.57
PZ0.900.170.920.36
SY1.01−0.180.870.48
XW1.350.090.370.76
XH1.260.361.200.54
JR1.140.241.020.58
LG0.210.801.440.79
SH1.68−0.170.310.34
Table A4. Correlation analysis of the drought resistance coefficients of each index under moderate drought stress.
IndicatorRWCWSDChlATrPnGsCiMDASODSeedling HeightGround DiameterRoot–Crown Ratio
RWC1.000
WSD0.1051.000
ChlA−0.4790.3661.000
Tr−0.412−0.3720.0051.000
Pn−0.105−0.0240.1620.5501.000
Gs−0.413−0.283−0.0480.9290.6001.000
Ci−0.0210.6630.3120.163−0.1180.1561.000
MDA0.156−0.604−0.1750.6200.0700.3840.0341.000
SOD−0.130−0.366−0.225−0.485−0.647−0.480−0.613−0.2301.000
Seedling height0.005−0.230−0.0020.7920.8570.7080.0190.546−0.7111.000
Ground diameter0.0790.1990.2030.436−0.1250.2740.7270.598−0.4420.2621.000
Root–crown ratio0.8150.305−0.044−0.300−0.184−0.3580.4410.273−0.3980.0010.4641.000
Table A5. The eigenvectors of the principal components under moderate drought stress.
TraitsComponents
P1P2P3P4
Tr0.4527−0.1419−0.00070.1780
Seedling height0.4391−0.04900.0931−0.2727
Gs0.4193−0.1644−0.07610.0629
SOD−0.3560−0.29880.09720.2899
Pn0.3367−0.1160−0.1373−0.5226
Root–crown ratio−0.01980.48340.3202−0.1168
Ci0.14060.4644−0.21620.2286
WSD−0.09080.4102−0.3861−0.1886
Ground diameter0.24200.36230.08230.4376
RWC−0.10240.28500.4826−0.3560
Chl A0.05310.1321−0.47650.1208
MDA0.29280.01040.43850.3135
Table A6. The value of the comprehensive indexes of the different provenances under moderate drought stress.
ProvenanceYik
Yi1Yi2Yi3Yi4
KL1.0020.7780.6070.993
PZ0.0720.8851.0401.185
SY0.4511.3060.5040.900
XW0.8590.9260.5730.914
XH0.6211.3080.8731.134
JR0.4210.9950.7051.377
LG−0.0090.3780.6061.200
SH1.3741.8090.6510.375
Table A7. Correlation analysis of the drought resistance coefficients of each index under severe drought stress.
IndicatorRWCWSDChlATrPnGsCiMDASODSeedling HeightGround DiameterRoot–Crown Ratio
RWC1.000
WSD0.0511.000
Chl A−0.339−0.2521.000
Tr0.332−0.5750.1451.000
Pn0.296−0.4010.3730.7281.000
Gs0.325−0.259−0.2220.8640.6101.000
Ci−0.3880.5220.021−0.027−0.0920.1941.000
MDA0.134−0.2190.0680.065−0.036−0.098−0.6601.000
SOD−0.0760.405−0.416−0.759−0.913−0.686−0.1740.3011.000
Seedling height0.241−0.344−0.1220.1130.1620.157−0.7110.447−0.0771.000
Ground diameter0.135−0.4460.5640.6700.7410.503−0.008−0.226−0.8700.2861.000
Root–crown ratio−0.0040.1930.3700.1670.5490.1450.0660.377−0.338−0.0950.0851.000
Table A8. The eigenvectors of the principal components under severe drought stress.
TraitsComponents
P1P2P3P4
SOD−0.4380.193−0.0240.039
Pn0.434−0.0390.0740.185
Tr0.4190.010−0.1790.022
Ground diameter0.407−0.0770.076−0.242
Gs0.349−0.068−0.4000.146
WSD−0.265−0.258−0.0980.454
Ci−0.048−0.592−0.1040.070
Seedling height0.1240.478−0.041−0.117
MDA−0.0040.4730.2690.323
Chl A0.175−0.1290.626−0.139
RWC0.1250.244−0.4110.321
Root–crown ratio0.152−0.0670.3760.657
Table A9. The value of the comprehensive indexes of the different provenances under severe drought stress.
ProvenanceYik
Yi1Yi2Yi3Yi4
KL0.3760.5740.5832.649
PZ−0.6691.1920.4972.891
SY0.2360.3350.3772.697
XW0.6230.8440.4692.509
XH0.9830.2960.6802.997
JR−0.6180.7420.7892.983
LG−0.2910.7150.4322.347
SH0.9790.3361.0743.474
Figure A1. The transpiration rate of Melia azedarach among the different provenances: (A): early stage, (B): middle stage, and (C): late stage. Note: The error line in the figure is the mean ± standard error, and different lowercase letters in the same provenance indicate significant differences at the 0.05 level, as in the following figures.
Agronomy 12 01461 g0a1
Figure A2. The net photosynthetic rate of Melia azedarach among the different provenances: (A): early stage, (B): middle stage, and (C): late stage. Note: The error line in the figure is the mean ± standard error, and different lowercase letters in the same treatment indicate significant differences at the 0.05 level.
Agronomy 12 01461 g0a2
Figure A3. The chlorophyll a content of Melia azedarach among the different provenances: (A): early stage, (B): middle stage, and (C): late stage. Note: The error line in the figure is the mean ± standard error, and different lowercase letters in the same treatment indicate significant differences at the 0.05 level.
Agronomy 12 01461 g0a3
Figure A4. The malondialdehyde content of Melia azedarach among the different provenances: (A): early stage, (B): middle stage, and (C): late stage. Note: The error line in the figure is the mean ± standard error, and different lowercase letters in the same treatment indicate significant differences at the 0.05 level.
Agronomy 12 01461 g0a4
Figure A5. The superoxide dismutase activity of Melia azedarach among the different provenances: (A): early stage, (B): middle stage, and (C): late stage. Note: The error line in the figure is the mean ± standard error, and different lowercase letters in the same treatment indicate significant differences at the 0.05 level.
Agronomy 12 01461 g0a5

References

  1. Ayaz, A.; Huang, H.; Zheng, M.; Zaman, W.; Li, D.; Saqib, S.; Zhao, H.; Lü, S. Molecular Cloning and Functional Analysis of GmLACS2-3 Reveals Its Involvement in Cutin and Suberin Biosynthesis along with Abiotic Stress Tolerance. Int. J. Mol. Sci. 2021, 22, 9175. [Google Scholar] [CrossRef] [PubMed]
  2. Rane, J.; Singh, A.K.; Tiwari, M.; Prasad, P.V.V.; Jagadish, S.V.K. Effective Use of Water in Crop Plants in Dryland Agriculture: Implications of Reactive Oxygen Species and Antioxidative System. Front. Plant Sci. 2022, 12, 778270. [Google Scholar] [CrossRef] [PubMed]
  3. Prăvălie, R. Drylands extent and environmental issues. A global approach. Earth-Sci. Rev. 2016, 161, 259–278. [Google Scholar] [CrossRef]
  4. Mao, D.; Wang, Z.; Wu, B.; Zeng, Y.; Luo, L.; Zhang, B. Land degradation and restoration in the arid and semiarid zones of China: Quantified evidence and implications from satellites. Land Degrad. Dev. 2018, 29, 3841–3851. [Google Scholar] [CrossRef]
  5. Sakadevan, K.; Nguyen, M.-L. Extent, Impact, and Response to Soil and Water Salinity in Arid and Semiarid Regions. Adv. Agron. 2010, 109, 55–74. [Google Scholar] [CrossRef]
  6. Editorial Committee of the Flora of China, Chinese Academy of Sciences. Flora of China; Science Press: Beijing, China, 1997; Volume 143, ISBN 9787030012050. (In Chinese) [Google Scholar]
  7. Sen, A.; Batra, A. Melia Azedarach L.-A paradise tree. Indian J. 2011, 1, 59–69. [Google Scholar]
  8. Adan, Y.; Rubea, A.L. The Potential Uses of Melia Azedarach L. as pesticidal and Medicinal Plant, Review. Am.-Eurasian J. Sustain. Agric. 2009, 3, 185–194. [Google Scholar]
  9. Cheng, S.M.; Gu, W.C. The phenological Division of Distribution area in China for Melia Azedarach. Sci. Silvae Scinicae 2005, 41, 186–191. (In Chinese) [Google Scholar]
  10. Vishnukanta, A.R. Melia azedarach: A phytopharmacological review. Pharmacogn. Rev. 2008, 2, 173–179. [Google Scholar]
  11. Sultana, S.; Asif, H.M.; Akhtar, N.; Waqas, M.; Rehman, S.U. Comprehensive review on ethanobotanical use, phytochemistry and pharmacological properties of Melia Azederach Linn. Asian J. Pharm. Res. Health Care 2014, 16, 26–32. [Google Scholar]
  12. Kumar, R.; Singh, R.; Meera, P.S.; Kalidhar, S.B. Chemical components and insecticidal properties of Bakain (Melia azedarach L.)–A review. Agric. Rev. 2003, 24, 101–115. [Google Scholar]
  13. Silva, S.; Pinto, G.; Correia, B.; Pinto-Carnide, O.; Santos, C. Rye oxidative stress under long term Al exposure. J. Plant Physiol. 2013, 170, 879–889. [Google Scholar] [CrossRef] [PubMed]
  14. Dias, M.C.; Pinto, G.; Santos, C. Acclimatization of micropropagated plantlets induces an antioxidative burst: A case study with Ulmus minor Mill. Photosynthetica 2011, 49, 259–266. [Google Scholar] [CrossRef]
  15. Jhou, H.-C.; Wang, Y.-N.; Wu, C.-S.; Yu, J.-C.; Chen, C.-I. Photosynthetic gas exchange responses of Swietenia macrophylla King and Melia azedarach L. plantations under drought conditions. Bot. Stud. 2017, 58, 57. [Google Scholar] [CrossRef] [Green Version]
  16. Dias, M.C.; Azevedo, C.; Costa, M.; Pinto, G.; Santos, C. Melia azedarach plants show tolerance properties to water shortage treatment: An ecophysiological study. Plant Physiol. Biochem. 2014, 75, 123–127. [Google Scholar] [CrossRef]
  17. DB11/T 770-2010; Growth media for ornamental. Beijing Quality and Technology Supervision Bureau: Beijing, China, 2010.
  18. Li, H.S. Principles and Techniques of Plant Physiological and Biochemical Experiments; Higher Education Press: Beijing, China, 2000; ISBN 9787040080766. (In Chinese) [Google Scholar]
  19. Wang, X.K. Principles and Techniques of Plant Physiological and Biochemical Experiments, 3rd ed.; Higher Education Press: Beijing, China, 2006; ISBN 9787040396461. (In Chinese) [Google Scholar]
  20. Kuromori, T.; Fujita, M.; Takahashi, F.; Shinozaki, K.Y.; Shinozaki, K. Inter-tissue and inter-organ signaling in drought stress response and phenotyping of drought tolerance. Plant J. 2021, 109, 342–358. [Google Scholar] [CrossRef]
  21. Suzuki, N.; Rivero, R.M.; Shulaev, V.; Blumwald, E.; Mittler, R. Abiotic and biotic stress combinations. New Phytol. 2014, 203, 32–43. [Google Scholar] [CrossRef]
  22. Jabbari, H.; Akbari, G.A.; Sima, N.A.K.K.; Rad, A.H.S.; Alahdadi, I.; Hamed, A.; Shariatpanahi, M.E. Relationships between seedling establishment and soil moisture content for winter and spring rapeseed genotypes. Ind. Crop. Prod. 2013, 49, 177–187. [Google Scholar] [CrossRef]
  23. Yang, X.; Lu, M.; Wang, Y.; Wang, Y.; Liu, Z.; Chen, S. Response Mechanism of Plants to Drought Stress. Horticulturae 2021, 7, 50. [Google Scholar] [CrossRef]
  24. Bogati, K.; Walczak, M. The Impact of Drought Stress on Soil Microbial Community, Enzyme Activities and Plants. Agronomy 2022, 12, 189. [Google Scholar] [CrossRef]
  25. Zhang, X.; Zang, R.; Li, C. Population differences in physiological and morphological adaptations of Populus davidiana seedlings in response to progressive drought stress. Plant Sci. 2004, 166, 791–797. [Google Scholar] [CrossRef]
  26. Li, F.; Bao, W.; Wu, N.; You, C. Growth, biomass partitioning, and water-use efficiency of a leguminous shrub (Bauhinia faberi var. microphylla) in response to various water availabilities. New For. 2008, 36, 53–65. [Google Scholar] [CrossRef] [Green Version]
  27. Lei, Y. Physiological responses of Populus przewalskii to oxidative burst caused by drought stress. Russ. J. Plant Physiol. 2008, 55, 857–864. [Google Scholar] [CrossRef]
  28. Brunner, I.; Herzog, C.; Dawes, M.A.; Arend, M.; Sperisen, C. How tree roots respond to drought. Front. Plant Sci. 2015, 6, 547. [Google Scholar] [CrossRef] [PubMed] [Green Version]
  29. Eying, Y.; Song, L.L.; Jacobs, D.; Emei, L.; Eliu, P.; Ejin, S.; Ewu, J. Physiological response to drought stress in Camptotheca acuminata seedlings from two provenances. Front. Plant Sci. 2015, 6, 361. [Google Scholar] [CrossRef] [PubMed] [Green Version]
  30. Bhusal, N.; Lee, M.; Lee, H.; Adhikari, A.; Han, A.R.; Han, A.; Kim, H.S. Evaluation of morphological, physiological, and biochemical traits for assessing drought re-sistance in eleven tree species. Sci. Total Environ. 2021, 779, 146466. [Google Scholar] [CrossRef]
  31. Lei, Y.; Yin, C.; Li, C. Differences in some morphological, physiological, and biochemical responses to drought stress in two contrasting populations of Populus przewalskii. Physiol. Plant. 2006, 127, 182–191. [Google Scholar] [CrossRef]
  32. Goche, T.; Shargie, N.G.; Cummins, I.; Brown, A.P.; Chivasa, S.; Ngara, R. Comparative physiological and root proteome analyses of two sorghum varieties responding to water limitation. Sci. Rep. 2020, 10, 11835. [Google Scholar] [CrossRef]
  33. Corso, D.; Delzon, S.; Lamarque, L.J.; Cochard, H.; Torres-Ruiz, J.M.; King, A.; Brodribb, T. Neither xylem collapse, cavitation, or changing leaf conductance drive stomatal closure in wheat. Plant Cell Environ. 2020, 43, 854–865. [Google Scholar] [CrossRef]
  34. Anjum, S.A.; Xie, X.Y.; Wang, L.C.; Saleem, M.F.; Man, C.; Lei, W. Morphological, physiological and biochemical responses of plants to drought stress. Afr. J. Agric. Res. 2011, 6, 2026–2032. [Google Scholar]
  35. Siddique, M.R.B.; Hamid, A.; Islam, M.S. Drought stress effects on water relations of wheat. Bot. Bull. Acad. Sin. 2000, 41, 35–39. [Google Scholar]
  36. Nowicka, B.; Ciura, J.; Szymanska, R.; Kruk, J. Improving photosynthesis, plant productivity and abiotic stress tolerance current trends and future perspectiv-es. J. Plant Physiol. 2018, 231, 415–433. [Google Scholar] [CrossRef] [PubMed]
  37. Bohnert, H.J.; Jensen, R.G. Strategies for engineering water-stress tolerance in plants. Trends Biotechnol. 1996, 14, 89–97. [Google Scholar] [CrossRef]
  38. Farquhar, G.D.; Sharkey, T.D. Stomatal conductance and photosynthesis. Annu. Rev. Plant Physiol. 1982, 33, 317–345. [Google Scholar] [CrossRef]
  39. Rawat, J.M.; Rawat, B.; Tewari, A.; Joshi, S.C.; Nandi, S.K.; Palni, L.M.S.; Prakash, A. Alterations in growth, photosynthetic activity and tissue-water relations of tea clones in response to different soil moisture content. Trees 2017, 31, 941–952. [Google Scholar] [CrossRef]
  40. Silva, E.N.; Ribeiro, R.V.; Ferreira-Silva, S.L.; Vieira, S.A.; Ponte, L.F.; Silveira, J.A. Coordinate changes in photosynthesis, sugar accumulation and antioxidative enzymes improve the performance of Jatropha curcas plants under drought stress. Biomass-Bioenergy 2012, 45, 270–279. [Google Scholar] [CrossRef]
  41. Wu, F.Z.; Bao, W.K.; Li, F.L.; Wu, N. Effects of water stress and nitrogen supply on leaf gas exchange and fluorescence parameters of Sophora davidii seedlings. Photosynthetica 2008, 46, 40–48. [Google Scholar] [CrossRef]
  42. Gao, L.; Caldwell, C.D.; Jiang, Y. Photosynthesis and Growth of Camelina and Canola in Response to Water Deficit and Applied Nitrogen. Crop Sci. 2018, 58, 393–401. [Google Scholar] [CrossRef]
  43. Smirnoff, N. Antioxidant systems and plant response to the environment. In Environment and Plant Metab-Olism: Flexibility and Acclimation; Smirnoff, N., Ed.; BIOS Scientific Publishers: Oxford, UK, 1995; pp. 217–243. [Google Scholar]
  44. Oster, U.; Tanaka, R.; Tanaka, A.; Rüdiger, W. Cloning and functional expression of the gene encoding the key enzyme for chlorophyll b biosynthesis (CAO) from Arabidopsis thaliana. Plant J. 2000, 21, 305–310. [Google Scholar] [CrossRef]
  45. Ghobadi, M.; Taherabadi, S.; Ghobadi, M.-E.; Mohammadi, G.-R.; Jalali-Honarmand, S. Antioxidant capacity, photosynthetic characteristics and water relations of sunflower (Helianthus annuus L.) cultivars in response to drought stress. Ind. Crop. Prod. 2013, 50, 29–38. [Google Scholar] [CrossRef]
  46. Efeoğlu, B.; Ekmekçi, Y.; Çiçek, N. Physiological responses of three maize cultivars to drought stress and recovery. S. Afr. J. Bot. 2009, 75, 34–42. [Google Scholar] [CrossRef] [Green Version]
  47. Cui, L.; Zheng, F.; Zhang, D.; Li, C.; Li, M.; Ye, J.; Zhang, Y.; Wang, T.; Ouyang, B.; Hong, Z.; et al. Tomato methionine sulfoxide reductase B2 functions in drought tolerance by promoting ROS scavenging and chlorophyll accumulation through interaction with Catalase 2 and RBCS3B. Plant Sci. 2022, 318, 111206. [Google Scholar] [CrossRef] [PubMed]
  48. Hao, S.R.; Guo, X.P.; Wang, W.M.; Zhang, L.J.; Wang, Q. Effect of water stress and rehydration on leaf chloroplast pigments during rice nodulation. J. Hohai Univ.-Y (Nat. Sci. Ed.) 2006, 4, 397–400. [Google Scholar]
  49. Golldack, D.; Li, C.; Mohan, H.; Probst, N. Tolerance to drought and salt stress in plants: Unraveling the signaling networks. Front. Plant Sci. 2014, 5, 151. [Google Scholar] [CrossRef] [PubMed] [Green Version]
  50. Morales, M.; Munné-Bosch, S. Malondialdehyde: Facts and Artifacts. Plant Physiol. 2019, 180, 1246–1250. [Google Scholar] [CrossRef] [PubMed] [Green Version]
  51. Khaleghi, A.; Naderi, R.; Brunetti, C.; Maserti, B.; Salami, S.A.; Babalar, M. Morphological, physiochemical and antioxidant responses of Maclura pomifera to drought stress. Sci. Rep. 2019, 9, 19250. [Google Scholar] [CrossRef]
  52. Carvalho, M.; Castro, I.; Moutinho-Pereira, J.; Correia, C.; Egea-Cortines, M.; Matos, M.; Rosa, E.; Carnide, V.; Lino-Neto, T. Evaluating stress responses in cowpea under drought stress. J. Plant Physiol. 2019, 241, 153001. [Google Scholar] [CrossRef]
  53. Wang, L.-F. Physiological and molecular responses to drought stress in rubber tree (Hevea brasiliensis Muell. Arg.). Plant Physiol. Biochem. 2014, 83, 243–249. [Google Scholar] [CrossRef]
  54. Zhang, M.; Jin, Z.-Q.; Zhao, J.; Zhang, G.; Wu, F. Physiological and biochemical responses to drought stress in cultivated and Tibetan wild barley. Plant Growth Regul. 2015, 75, 567–574. [Google Scholar] [CrossRef]
Figure 1. The relative water content in the leaves of Melia azedarach among different provenances: (A): early stage, (B): middle stage, and (C): late stage. Note: The error line in the figure is the mean ± standard error, and different lowercase letters in the same treatment indicate significant differences at the 0.05 level.
Agronomy 12 01461 g001
Figure 2. The water saturation deficit in the leaves of Melia azedarach among different provenances: (A): early stage, (B): middle stage, and (C): late stage. Note: The error line in the figure is the mean ± standard error, and different lowercase letters in the same treatment indicate significant differences at the 0.05 level.
Agronomy 12 01461 g002
Figure 3. The net photosynthetic rate of Melia azedarach among different provenances: (A): early stage (B): middle stage, and (C): late stage. Note: The error line in the figure is the mean ± standard error, and different lowercase letters in the same treatment indicate significant differences at the 0.05 level.
Agronomy 12 01461 g003aAgronomy 12 01461 g003b
Figure 4. The transpiration rate of Melia azedarach among different provenances: (A): early stage, (B): middle stage, and (C): late stage. Note: The error line in the figure is the mean ± standard error, and different lowercase letters in the same treatment indicate significant differences at the 0.05 level.
Agronomy 12 01461 g004aAgronomy 12 01461 g004b
Figure 5. The intercellular CO2 concentration of Melia azedarach among different provenances: (A): early stage, (B): middle stage, and (C): late stage. Note: The error line in the figure is the mean ± standard error, and different lowercase letters in the same treatment indicate significant differences at the 0.05 level.
Agronomy 12 01461 g005aAgronomy 12 01461 g005b
Figure 6. The stomatal conductance of Melia azedarach among different provenances: (A): early stage, (B): middle stage, and (C): late stage. Note: The error line in the figure is the mean ± standard error, and different lowercase letters in the same treatment indicate significant differences at the 0.05 level.
Agronomy 12 01461 g006aAgronomy 12 01461 g006b
Figure 7. The chlorophyll a content of Melia azedarach among different provenances: (A): early stage, (B): middle stage, and (C): late stage. Note: The error line in the figure is the mean ± standard error, and different lowercase letters in the same treatment indicate significant differences at the 0.05 level.
Agronomy 12 01461 g007aAgronomy 12 01461 g007b
Figure 8. The malondialdehyde content of Melia azedarach among different provenances: (A): early stage, (B): middle stage, and (C): late stage. Note: The error line in the figure is the mean ± standard error, and different lowercase letters in the same treatment indicate significant differences at the 0.05 level.
Agronomy 12 01461 g008aAgronomy 12 01461 g008b
Figure 9. The superoxide dismutase activity of Melia azedarach among different provenances: (A): early stage, (B): middle stage, and (C): late stage. Note: The error line in the figure is the mean ± standard error, and different lowercase letters in the same treatment indicate significant differences at the 0.05 level.
Agronomy 12 01461 g009
Table 1. Location and climatic conditions of the Melia azedarach. L seed collection sites in 2017.
Original AreaLongitudeLatitudeAltitude/mAnnual Average Temperature/°CAnnual Precipitation/mmFrost-Free Season/d
KL118.5837.423~512.8555.9206
PZ117.9934.3518~3214.2868.6210
SY112.1830.3730~5515.91250255
XW118.8332.0912~2015.41106.5237
XH115.8728.6755~11217.61458277
JR119.1332.075~3015.21055.6233
LG113.2523.1115~22211720190
SH114.0131.8260~15015.31100225
Note: KL, PZ, SY, XW, XH, JR, LG, and SH represent Shandong Kenli, Jiangsu Pizhou, Hubei Shayang, Jiangsu Xuanwu, Jiangxi Xihu, Jiangsu Jurong, Guangdong Luogang, and Henan Shihe, respectively.
Table 2. The seedling height growth of Melia azedarach among different provenances under drought stress.
ProvenanceSeedling Height Growth/cmRelative Decline
I/%
Relative Decline
II/%
Relative Decline
III/%
CKIIIIII
KL22.80 ± 5.25 a11.75 ± 4.25 ab8.98 ± 2.53 b3.65 ± 1.93 b48.47%60.64%83.99%
PZ19.00 ± 0.53 a14.88 ± 1.13 a2.93 ± 2.33 b3.48 ± 1.14 b21.71%84.61%81.71%
SY24.63 ± 5.44 a13.93 ± 3.94 ab10.40 ± 2.52 b4.18 ± 0.65 b43.45%57.77%83.05%
XW19.53 ± 0.95 a14.50 ± 2.10 ab13.25 ± 3.57 ab9.40 ± 2.39 b25.77%32.17%51.88%
XH24.55 ± 0.05 a17.35 ± 3.45 a14.70 ± 0.80 a9.00 ± 8.10 a29.33%40.12%63.34%
JR19.67 ± 6.63 a13.08 ± 4.51 ab3.30 ± 1.19 b1.63 ± 0.31 b33.52%83.22%91.74%
LG15.93 ± 1.26 a14.65 ± 4.01 a6.65 ± 2.02 b4.55 ± 2.20 b8.01%71.43%58.24%
SH13.43 ± 3.42 a11.68 ± 1.66 a7.23 ± 3.40 ab1.78 ± 0.63 b13.00%46.00%87.00%
Note: Different lowercase letters in the same line indicate a significant difference between different treatments of the same variety (p < 0.05). I: mild drought; II: moderate drought; III: severe drought.
Table 3. Ground diameter increase in the Melia azedarach seedlings among different provenances under drought stress.
ProvenanceDiameter Growth/cmRelative Decline
I/%
Relative Decline
II/%
Relative Decline
III/%
CKIIIIII
KL1.02 ± 0.30 a0.80 ± 0.10 a0.97 ± 0.40 a0.31 ± 0.10 a22%5%70%
PZ1.10 ± 0.08 a0.40 ± 0.23 b0.34 ± 0.05 b0.19 ± 0.07 b64%69%83%
SY0.89 ± 0.13 a0.76 ± 0.25 a0.53 ± 0.30 a0.28 ± 0.06 a15%40%69%
XW1.39 ± 0.32 a0.89 ± 0.08 b0.44 ± 0.05 c0.30 ± 0.10 c36%69%79%
XH1.05 ± 0.07 a0.64 ± 0.21 a0.50 ± 0.16 a0.52 ± 0.10 a40%53%51%
JR1.10 ± 0.21 a0.52 ± 0.05 b0.47 ± 0.13 b0.23 ± 0.04 b53%57%79%
LG2.74 ± 1.18 a0.89 ± 0.26 ab0.59 ± 0.14 b0.34 ± 0.09 b68%78%88%
SH1.28 ± 0.11 a0.62 ± 0.13 b0.40 ± 0.08 bc0.20 ± 0.07 c52%69%85%
Note: Different lowercase letters in the same line indicate a significant difference between different treatments of the same variety (p < 0.05). I: mild drought; II: moderate drought; III: severe drought.
Table 4. The biomass distribution of the Melia azedarach seedlings among different provenances under drought stress.
ProvenanceBiomass/g·Plant-1
The Aboveground Part/g·Plant-1The Underground Part/g·Plant-1
CKIIIIICKIIIIII
KL16.76 ± 3.04 a16.59 ± 0.99 a16.49 ± 3.14 a11.98 ± 1.34 a13.81 ± 3.79 a14.51 ± 2.30 a14.33 ± 3.02 a16.27 ± 1.79 a
PZ16.40 ± 1.47 a13.94 ± 2.78 a13.91 ± 2.73 a12.14 ± 3.10 a17.10 ± 3.03 a17.56 ± 4.44 a23.51 ± 2.68 a21.98 ± 1.97 a
SY17.03 ± 2.54 a16.62 ± 3.04 a15.32 ± 0.87 a14.71 ± 0.39 a10.47 ± 0.81 a12.35 ± 0.32 a13.67 ± 3.26 a15.09 ± 1.64 a
XW19.31 ± 5.24 a15.76 ± 0.74 a14.24 ± 2.43 a13.49 ± 1.21 a15.75 ± 0.61 a16.61 ± 2.94 a16.63 ± 2.39 a17.43 ± 1.70 a
XH27.49 ± 11.15 a20.02 ± 2.71 a16.37 ± 4.98 a14.25 ± 0.18 a12.74 ± 2.83 a13.44 ± 2.57 a16.11 ± 1.65 a17.79 ± 6.65 a
JR28.72 ± 0.98 a25.62 ± 1.23 a23.00 ± 2.47 ab18.85 ± 0.17 b17.33 ± 1.29 a19.70 ± 2.05 a20.04 ± 2.12 a23.16 ± 0.56 a
LG26.85 ± 6.07 a26.40 ± 5.61 a22.48 ± 0.05 a21.13 ± 1.65 a18.25 ± 3.56 a13.91 ± 2.37 a17.17 ± 3.78 a21.00 ± 2.01 a
SH21.26 ± 3.20 a16.04 ± 1.01 a15.58 ± 2.30 a15.53 ± 3.16 a11.41 ± 0.88 b14.46 ± 1.44 b15.18 ± 1.89 b23.55 ± 1.86 a
Note: Different lowercase letters in the same line indicate a significant difference between different treatments of the same variety (p < 0.05). I: mild drought; II: moderate drought; III: severe drought.
Table 5. The root–shoot ratio of the Melia azedarach seedlings among different provenances under drought stress.
ProvenanceRoot-Crown Ratio
CKIIIIII
KL0.81 ± 0.08 a0.89 ± 0.19 a0.87 ± 0.02 a1.39 ± 0.31 a
PZ1.03 ± 0.09 a1.38 ± 0.59 a1.80 ± 0.55 a1.89 ± 0.32 a
SY0.62 ± 0.05 a0.77 ± 0.12 a0.92 ± 0.20 a0.98 ± 0.05 a
XW0.89 ± 0.27 a1.16 ± 0.15 a1.06 ± 0.01 a1.31 ± 0.24 a
XH0.60 ± 0.35 a0.67 ± 0.04 a1.05 ± 0.22 a1.25 ± 0.48 a
JR0.61 ± 0.07 b0.77 ± 0.12 b0.87 ± 0.00 b1.23 ± 0.02 a
LG0.76 ± 0.31 a0.52 ± 0.02 a0.81 ± 0.18 a0.93 ± 0.02 a
SH0.54 ± 0.18 b0.90 ± 0.28 b0.97 ± 0.19 ab1.52 ± 0.25 a
Note: Different lowercase letters in the same line indicate a significant difference between different treatments of the same variety (p < 0.05). I: mild drought; II: moderate drought; III: severe drought.
Table 6. The eigenvalues, contribution ratio, and cumulative contribution ratio of the principal components under mild drought stress.
Principal ComponentEigenvaluesContribution Ratio/%Cumulative Contribution Rate/%
14.40436.69936.699
22.72922.74459.442
31.66513.87773.320
41.58613.21986.539
Table 7. The eigenvalues, contribution ratio, and cumulative contribution ratio of the principal components under moderate drought stress.
Principal ComponentEigenvaluesContribution Ratio/%Cumulative Contribution Rate/%
14.28535.70735.707
23.00525.04060.748
32.16418.03478.782
41.50012.50391.285
Table 8. The eigenvalues, contribution ratio, and cumulative contribution ratio of the principal components under severe drought stress.
Principal ComponentEigenvaluesContribution Ratio/%Cumulative Contribution Rate/%
14.28535.70735.707
23.00525.04060.748
32.16418.03478.782
41.50012.50391.285
Table 9. The function value of the comprehensive indexes (U(Yik)), weight (Wk), and the comprehensive evaluation value (D) of the different provenances under mild drought stress.
ProvenanceU(Yik)D ValueRank
U(Yi1)U(Yi2)U(Yi3)U(Yi4)
KL0.4290.5610.5490.5110.4955
PZ0.4690.3570.5400.0440.3867
SY0.54400.4960.3110.3588
XW0.7760.2760.0530.9330.5534
XH0.7140.5510.7880.44480.6421
JR0.6330.4290.62880.53380.5633
LG01110.5762
SH10.010000.4276
Weights0.4240.2630.1600.153
Table 10. The function value of the comprehensive indexes (U(Yik)), weight (Wk), and the comprehensive evaluation value (D) of the different provenances under moderate drought stress.
ProvenanceU(Yik)D ValueRank
U(Yi1)U(Yi2)U(Yi3)U(Yi4)
KL0.7310.2800.1920.6170.4853
PZ0.0590.35410.8080.4296
SY0.3330.64800.5240.3807
XW0.6280.3830.1290.5380.4505
XH0.4560.6500.6880.7570.5962
JR0.3110.4310.37510.4514
LG000.1900.8230.1508
SH110.27400.7191
Weights0.3910.2740.1980.137
Table 11. The function value of the comprehensive indexes (U(Yik)), weight (Wk), and the comprehensive evaluation value (D) of the different provenances under severe drought stress.
ProvenanceU(Yik)D ValueRank
U(Yi1)U(Yi2)U(Yi3)U(Yi4)
KL0.6330.3100.2960.2680.4444
PZ010.1720.4830.3465
SY0.5480.04400.3110.2967
XW0.7820.6120.1320.1440.5413
XH100.4350.5770.5952
JR0.0310.4980.5910.5640.3166
LG0.2290.4680.07900.2328
SH0.9980.045110.7591
Weights0.4420.2510.1700.137
Publisher’s Note: MDPI stays neutral with regard to jurisdictional claims in published maps and institutional affiliations.

