Article

Response of Bread Wheat Genotypes for Drought and Low Nitrogen Stress Tolerance

1
School of Agricultural, Earth and Environmental Sciences, University of KwaZulu-Natal, P/Bag X01, Pietermaritzburg 3209, South Africa
2
Agricultural Research Council-Small Grain (ARC-SG), P/Bag X29, Bethlehem 9700, South Africa
*
Author to whom correspondence should be addressed.
Agronomy 2022, 12(6), 1384; https://doi.org/10.3390/agronomy12061384
Submission received: 19 April 2022 / Revised: 3 June 2022 / Accepted: 5 June 2022 / Published: 8 June 2022
(This article belongs to the Topic Plant Metabolism under Stress)

Abstract

:
Drought stress and nitrogen (N) deficiency are the major causes of yield losses in bread wheat (Triticum aestivum) production. Breeding wheat cultivars with combined drought and low N stress tolerance is an economical approach for yield gains. The objective of this study was to evaluate the response of diverse bread wheat genotypes under drought and low N stress conditions to select high-performing genotypes for developing breeding populations and production to mitigate against drought and low N stress. Fifty bread wheat genotypes were evaluated under drought-stressed (DS) and non-stressed (NS) conditions and N application rates of 50, 100 and 200 kg N ha−1. The experiments were conducted in a controlled environment and field conditions during the 2019/20 cropping season. Data on grain yield and yield components were collected and subjected to statistical analysis. The four-way interaction involving genotype, water regime, N treatments and testing environment had a significant (p < 0.05) effect on all assessed agronomic traits, suggesting that genotype response depended on the treatment combinations. Drought stress and 50 kg N ha1 reduced grain yield by 20% compared to NS and 50 kg N ha−1. The grain yield ranged from 120 to 337 g/m2, with a mean of 228 g/m2 under DS. Under DS and 200 kg N ha−1, the genotype designated as SBO 19 had a higher grain yield of 337 g/m2, followed by SBO 22 (335 g/m2), SBO 16 (335 g/m2), SBO 04 (335 g/m2) and SBO 33 (335 g/m2). Grain yields under DS and 50 kg N ha−1, and NS and 50 kg N ha−1 had a positive and significant correlation (r > 0.5; p < 0.01) with most of the evaluated traits. Highly correlated traits directly contribute to total yield gain and should be incorporated during the selection of high-yielding genotypes. The study identified the 10 best lines that are high-yielding with early flowering and maturity under DS or NS conditions and the three N treatments. The selected lines are recommended as breeding parents to develop drought-adapted and N-use efficient genetic resources. The identified genotypes are important for sustainable wheat production and effective breeding of improved cultivars to mitigate drought stress and soil nutrient deficiencies, to ensure food security in Sub-Saharan Africa.

1. Introduction

Wheat (Triticum aestivum L., 2n = 6x = 42, AABBDD) is one of the world’s most widely grown commodity crops. Global wheat production is estimated at 200 million tons per annum. The average productivity of wheat is 2.5 tons per hectare in sub-Saharan Africa (SSA) [1]. South Africa (SA) produces 1.3 to 2 million tons per annum with a mean yield of 1.1 to 3.6 tons per hectare on an area of 524,000 hectares, making it the second-largest wheat producer after Ethiopia, followed by Sudan and Kenya in SSA [1]. The production levels range between 2 to 4 t/ha under rainfed conditions and 7 to 9 t/ha under irrigation. Wheat grain accounts for 40% of the calorie intake in the human diet, while 60% of the wheat produced is used in the feed industry, globally [2]. However, a deficit in wheat supply is forecasted due to a projected 60% increase in demand, owing to rapid population growth by 2050 [3] and a dwindling global production due to several challenges. There is a need to increase wheat productivity to meet the current and future demand for wheat products. Higher wheat production can be achieved through improving grain yield rather than increasing the cropping area because arable land is non-renewable and a scarce resource [4,5].
Wheat production is challenged by abiotic stresses, including drought stress, poor soil fertility and high or low-temperature conditions, among others [6,7,8]. Drought stress and nitrogen (N) deficiency are the two major constraints of wheat production in arid and semi-arid agro-ecologies. Drought stress occurs when the water supply in the soil is inadequate to meet the plant growth and development requirements [9]. Drought stress affects many morphological, physiological and biochemical processes and yield gains. Stomatal opening and closing, inhibition of enzyme activity, decreased CO2 assimilation and cellular oxidation stress are major physiological components that collectively reduce plant growth and productivity [10,11].
Plant responses to drought stress involve two distinct mechanisms: drought avoidance and tolerance. Drought avoidance consists of morphological and physiological adjustments that provide an escape from water limitation and nutrient deficiency. Attributes, including deep root architecture, reduced stomatal cavity and conductance, leaf thickness, decreased leaf area, and leaf rolling, minimize evapotranspiration [12]. Cuticular wax formation on the leaf surface of the plant is also considered an important adaptive response [13]. Drought tolerance involves maintaining cellular and biochemical modifications through osmotic adjustments. Some plants have developed various transcriptional factors that are coordinated by a complex network of functionally diverse regulatory proteins, including activators, co-activators, repressors and chromatin modifiers to withstand drought stress and nutrient deficiencies. Several positive transcriptional regulations of gene expression in crops have been studied extensively and reviewed [14,15].
The effects of drought stress manifest in the agronomic traits, such as reduced plant height, reduced spike length, reduced number of spikelets per spike, progressive reduction in the number of grains per spike, and consequent reduction in 1000-grain weight, which are essential yield components. The impact of drought stress on these traits has a direct and indirect impact on total grain yields. The effect of drought stress is dependent on genotypic differences, crop growth stage and the confounding effect of other environmental factors (e.g., soil fertility, diseases and insect pests) and their interactions.
In wheat production, the impact of drought is severe during booting and anthesis compared to any other growth stage. At anthesis, drought stress causes embryo abortion due to reduced photosynthesis and the subsequent reduction in assimilates available to the developing seeds [16]. Qaseem et al., 2019, reported that 56.47% of yield losses are incurred due to heat and drought stresses in semi-arid climatic conditions [17], while Zampieri et al., 2017, asserted that an average of 40% yield loss is incurred globally due to drought and heat stresses [18]. In SA, the average wheat productivity of 2–4 t/ha under rainfed conditions has been reported compared to 7–9 t/ha under irrigation [1]. Drought stress is also exacerbated by low N during plant growth and development. The simultaneous occurrence of drought stress and N deficiency can cause up to 80% yield losses in wheat production [19].
Most soils in South Africa are highly degraded with poor N status. Wheat production in SA is practised with a high application rate of inorganic or organic N to support plant growth and grain yield production. In SA, a minimum of 130 kg N ha−1 is recommended for a target grain yield of 5 tons ha−1, while above 200 kg N ha−1 is applied to achieve yields of ≥8 tons ha−1 [20]. High N application increases the cost of wheat production and causes environmental pollution, such as soil acidity and eutrophication in fresh water [21]. A high volume of N can be lost through volatilization or denitrification in the soil, leading to N deficiency. Nitrogen deficiency reduces photosynthesis and plant growth and development, which later causes early leaf senescence and poor grain fill, yield and quality. More than 50% of all leaf N is directly involved in chlorophyll formation, which is responsible for photosynthesis [22,23]. Low N conditions before flowering promote poor leaf area development and reduced photosynthesis, leading to embryo deformation or abortion due to low assimilation [24,25].
Nitrogen use efficiency is defined as yield productivity per unit N used from the soil. NUE involves two major components, which are N uptake and utilisation efficiency. Each component consists of complex physiological processes and biochemical pathways that control assimilates production and grain development [26]. Developing wheat cultivars with high N use efficiency (NUE) and enhanced grain yield potential is vital to mitigate the impact of N deficiency on wheat production [27,28]. Indirectly, the development of N-use efficient cultivars will help to reduce environmental problems, such as the emission of nitrous oxide (N2O), a potent greenhouse gas.
Several studies have reported the physiological responses of plants subjected to either drought stress or N deficiency while not fitting the interactions between these two factors with genotypes and test environments [29,30,31,32,33]. Shi et al., 2014 and Ahmad et al., 2018 reported that drought stress reduces or inhibits seed germination and seedling vigor of the wheat plant [34,35]. Further, drought stress reduces the intake of CO2 through stomatal closure, which later affects the rate of respiration and photosynthesis; as a result, it damages the production of carbohydrates, lipids, nucleic acids and proteins. The combination of water limitation and N deficiency in the soil affects the leaf water potential, chlorophyll fluorescence and photosynthesis, thereby reducing the grain filling period and causing poor grain weight and productivity [36].
The successful development of drought and low N tolerant cultivars requires a comprehensive evaluation of genetically diverse breeding populations to determine their genetic, morphological and physiological responses to the combined effects of drought stress and low N [37,38]. Attributes, such as deep root system, dense stomata, cool canopies, optimal carbohydrates and assimilate partitioning and remobilization, and optimum hydraulic conductance have been reported to be essential for drought and low N stress tolerance [39,40,41,42]. Understanding the extent of genetic variation for these essential attributes among the genetic pools is imperative for determining the selection response and identifying superior genotypes for breeding. Therefore, in light of the above background, the objective of this study was to determine the response of genetically diverse bread wheat genotypes under drought and low N stress conditions, to select best-performing genotypes for developing breeding populations to mitigate against drought and low N stress. The information presented in this paper will guide crop breeders in developing a new generation of wheat cultivars with desirable traits, including high-yielding potential and tolerance to drought stress, poor soil fertility and the promotion of food and nutrition security in sub-Saharan Africa.

2. Materials and Methods

2.1. Plant Materials and Study Sites

Fifty bread wheat (T. aestivum) genotypes, consisting of 46 lines obtained from the heat and drought stress nursery at the International Maize and Wheat Improvement Centre (CIMMYT) and four checks obtained from a local seed company, were evaluated in this study. Information on genotype names, pedigrees and their origin are presented in Table 1. The CIMMYT genotypes were selected based on their genetic variation for drought and heat stress tolerance. The local checks, which are leading commercial spring wheat cultivars, were used as comparative controls due to their selection history and their performance in the National Cultivar Evaluation trials. Two of the local checks (Check#1 and Cheack#2) were selected for their ability to adapt under low N availability in the soil [20]. Genotypes were evaluated in the greenhouse and under field conditions during the 2019 growing season at the University of KwaZulu-Natal (UKZN). Day and night temperatures in the greenhouse were maintained between 20 and 30 °C, respectively, while the humidity ranged between 45% and 55%. The field experiment was conducted at Ukulinga Research Farm of the UKZN (29°60′ S and 30°37′ E; 596 m above sea level). The soil properties and mean temperatures are presented in Table 2 and Table 3.

2.2. Experimental Design and Crop Establishment

2.2.1. Greenhouse Experiment

The experiment was conducted under a controlled environmental condition at UKZN. Experiments were laid out using a 10 × 5 alpha lattice design with two replications. Ten wheat seeds were planted in 5-litre capacity plastic pots filled with composted pine bark growing media and thinned to eight plants after 95% of seedling emergence. Fifty pots were allocated per incomplete block, and genotypes were randomly assigned to each pot to minimize the experimental error due to water and fertiliser discharge through a drip irrigation system. The automated drip irrigation system with small tubes was directly inserted into each pot to supply water and N fertiliser at 50 kg N ha−1 and 200 kg of P2O5 ha1. After six weeks of planting, different water regimes and nitrogen N treatments were initiated. Fertiliser treatments were applied using a drip irrigation system to supply N fertiliser at 50, 100 and 200 kg N ha1, which represented N deficiency (low N), intermediate N and South Africa recommended N application rates, respectively. The N rates were based on the wheat production guidelines of South Africa [20]. For water regimes, the drought-stressed (DS) condition involved withholding irrigation until soil moisture fell to 35% of field capacity before re-watering, while under the non-stress (NS) condition, plants were exposed to 80% of field capacity. The soil moisture content was monitored using a tensiometer reading and weighing of the pots. Treatment combinations (genotype × water regime × N rates × testing conditions) were maintained until plant physiological maturity.

2.2.2. Field Experiment

The field experiment was established at Ukulinga Research Farm (29°60′ S and 30°37′ E; 596 m above sea level) of UKZN using a 10 × 5 alpha lattice design with two replications. The average annual temperature and rainfall at Ukulinga Research Farm are 19 °C and 760 mm, respectively. Soil properties and weather data for the duration of the experiment period are presented in Table 2 and Table 3. Experiments were conducted during the winter season, from March to August, when rainfall is minimal. Field plots for each genotype were 1.5 m long rows with inter-and intra-row spacings of 45 and 15 cm, respectively. Custom-made plastic mulch was used to cover the experimental plots and prevent rain water from infiltrating the soil, and small holes of 5 cm were drilled on the soil ridges for sawing. Plant biomass covered the drilled holes after emergence to exclude rainwater. Four wheat seeds were planted in each hole, and each row had 10 genotypes serving as an incomplete block. Basal fertiliser of 10:20:10 kg ha−1 (N:P:K) was applied at planting, then after four weeks of planting. Nitrogen treatments were band placed away from the seedling at 50, 100 and 200 kg N ha−1 using urea fertiliser. Three N applications were performed for each N level to prevent leaching and to ensure continuous plant growth and development. Water application was performed using a drip irrigation system to maintain soil moisture at field capacity under a well-irrigated condition, while under drought stress conditions, the water supply was withheld after four weeks of planting when the plants had reached canopy cover. Water stress treatment was initiated from 50% heading to physiological maturity to stimulate terminal drought stress. Under well-watered conditions, continuous optimal irrigation was applied until 95% of the plants showed physiological maturity. Other agronomic practices were performed as recommended in the wheat production guidelines of South Africa [20].

2.3. Data Collection

Data on 12 agronomic traits were collected. Days to 50% seedling emergence (SE) were calculated as the number of days between the sowing date and the date when 50% of the seedlings had emerged from the soil. The number of days to heading (DTH) was computed from the sowing date to the date when 50% of the spikes showed above the flag leaf. The number of productive tillers (TN) was recorded at physiological maturity as the average number of tillers per plant in a plot, and plant height (PH) was measured in centimeters (cm) from the ground to the tip of the spike at maturity as an average of five randomly sampled and tagged plants before harvest. Days to maturity (DTM) were counted from the sowing date to the day when 50% of the spikes showed signs of senescence. Spike length (SL) was measured using a ruler (cm), and spikelet per spike (SPS) and kernels per spike (KPS) were counted after harvest from five tillers of randomly selected and tagged plants. Fresh plant biomass (BM) was measured on a digital scale in grams by weighing the above-ground plant parts, and thousand seed weight (TSW) was the weight of 1000 randomly sampled seeds after harvest. Grain yield (GY) was the total weight in grams of the harvested and shelled grain per plot. Finally, the harvest index (HI) was calculated as the ratio of grain yield to total above-ground plant biomass.

2.4. Data Analysis

The data from the field and greenhouse experiments were tested for normality and homogeneity of variance prior to pooling for analysis of variance (ANOVA). The ANOVA was conducted for a lattice design using GenStat, version 18 [43]. The treatment means of genotypes were separated using Fisher’s unprotected least significant difference (LSD) at a 0.05 significance level to determine the contribution of genotype, water regime, N treatment and environment and their interactions. The bivariate correlations for agronomic traits were calculated using the Pearson correlation coefficients (r) separately for the stress and non-stress environments using GenStat, version 18. Principal component analysis (PCA), based on the correlation matrix, was performed using GenStat, 18th edition, to identify the multivariate relationships among agronomic traits. A PCA biplot was constructed using the R software, Version 3.0-2, described by Tadesse, Habtemariam Zegeye [44].

3. Results

3.1. Genotype Responses and Environmental Impact

The ANOVA showed that the four-way interaction involving genotype, environment, water regime and N treatments had significant (p < 0.01) effects on the number of days to heading (DTH) and maturity (DTM), plant height (PH), productive tiller number (TN), spikelets per spike (SPS), kernels per spike (KPS), thousand seed weight (TSW), grain yield (GY), plant biomass (BM), and harvest index (HI). The genotype and N treatment interaction effects were significant (p < 0.001) for PH, SL and BM. There were highly significant (p < 0.001) differences among the genotypes for all assessed traits, except HI. The water regime significantly (p < 0.01) affected DTM, PH, SL, GY, BM, HI, SPS and KPS (Table 4).

3.2. Mean Performance of Genotypes

Table 5 shows the mean values for the agronomic traits of the top 10 and the bottom 5 genotypes evaluated under non-stressed (NS), drought-stressed (DS) and three nitrogen (N) levels. The genotypes exhibited significant variation for the assessed agronomic traits under the NS and DS conditions and across the N treatments. Under DS, GY ranged from 120 to 337 g/m2, with a mean of 228 g/m2. SBO 19 was the highest yielding genotype under DS at 337 g/m2 followed by genotype SBO 22 (335 g/m2), SBO 16 (335 g/m2), SBO 04 (335 g/m2) and SBO 33 (335 g/m2). Under the DS and low N conditions, the highest yielding genotype was SBO 19 with a mean of 332 g/m2 followed by SBO 10 (329 g/m2), SBO 16 (328 g/m2) and SBO 36 (327 g/m2) with the overall average grain yield of 225 g/m2. The highest yielding genotypes under DS and intermediate N were SBO (337 g/m2), SBO (335 g/m2) and SBO (333 g/m2), while SBO 19 (337 g/m2), SBO 04 (336 g/m2), SBO 22 (335 g/m2) and SBO 16 (333 g/m2) had high grain yields under the South African recommended N level (Table 5).
Under the NS condition, GY ranged between 121 and 344 g/m2 with a mean of 235 g/m2, and SBO 33 (344 g/m2), SBO 24 (340 g/m2), SBO 18 (340 g/m2), SBO 19 (339 g/m2) and SBO 26 (339 g/m2) were the highest yielding genotypes. The highest grain yielding genotypes under the NS and low N conditions were SBO 22 (337 g/m2), SBO 16 (335 g/m2) and SBO 19 (334 g/m2) with a mean value of 331 g/m2. SBO 04 was the highest yielding (337 g/m2) genotype under NS and intermediate N followed by SBO 24 (336 g/m2), SBO 19 (334 g/m2) and SBO 26 (335 g/m2) with a mean of 333 g/m2. The highest yielding genotypes under NS and the nationally recommended N levels were SBO 33 (344 g/m2), SBO 24 (340 g/m2), SBO 18 (340 g/m2) and SBO 19 (339 g/m2). These genotypes had mean GY ranges of 134 to 344 g/m2. In addition, under the NS conditions, 95% of the genotypes outperformed the overall mean GY of the standard checks, while under DS, 75% of the genotypes attained a better grain yield than the standard checks (Table 5).
The DTH mean was 69 days under the NS and low N conditions, greater than the 52 days under the DS condition. The early flowering genotypes were check#1 (51 days), check#3 and check#2 (52 days), check#4 (54 days) and SBO (55 days) under the DS and low N conditions. Genotypes check#1 and check#2 were early flowering with 50 and 54 days under DS and 100 kg N ha−1 compared to check#1, check#2, SBO 46 and check#3, which had a mean value of 63 days under DS and 200 kg N ha−1. Under NS, the mean number of days to heading was 54 days when using 50 kg N ha−1 less than the 64 days recorded under 100 and 200 kg N ha−1. The early flowering genotypes under NS and 50 kg N ha−1 were check#1, check#3 and check#2 with mean DTH values of 57, 58, and 60 days, while check#1 and check#4 had mean values of 61 and 65 days under 100 and 200 kg N ha−1, respectively (Table 5).
The DTM mean of the early maturity genotypes was 94 days under DS compared to the 116 days recorded under the NS conditions. The mean DTM values were 92, 100, and 118 days under NS and low, intermediate and recommended N, respectively. Similarly, the DTM mean value under NS and low N was 92 days less than the 96 and 100 days observed under the intermediate and recommended N conditions. Plant height (PH) varied significantly, from 69.13 cm recorded for genotype check#1 to 87.85 cm for SBO 16, with a mean of 81.85 cm under DS, while under NS, 67.05 and 87.18 cm were recorded for check#1 and SBO 33. The mean PH values under DS were 79.18, 81.24 and 84.33 cm for the low, intermediate and recommended N applications. Under the NS conditions, the mean PH values of 81.53, 81.09 and 86.75 cm were obtained under 50, 100 and 200 kg N ha−1. The shortest genotype was check#1 across different water regimes and N treatments (Table 5). Other agronomic traits varied significantly based on the test environments.

3.3. Correlations between Agronomic Traits and Grain Yield

Table 6 summarises the correlation coefficients (r), describing the degree of associations amongst the variables under the two water regimes and three N levels. Under the DS and low N conditions (A, right diagonal), grain yield showed positive and significant correlations with BM (r = 0.84, p < 0.05), DTM (r = 0.76, p < 0.05), TN (r = 0.70, p < 0.01), PH (r = 0.63, p < 0.01), KPS (r = 0.63, p < 0.01), TSW (r = 0.56, p < 0.05) and SL (r = 0.51, p < 0.01), while negative correlations were recorded with DTH (r = −00.16), SPS (r = −00.30) and SE (r = −00.33). Positive and significant correlations were recorded between DTH and KPS (r = 0.83, p < 0.01), SL (r = 0.82, p < 0.01), TSW (r = 0.66, p < 0.05), TN (r = 0.61, p < 0.01) and BM (r = 0.53, p < 0.01) under the DS and low N conditions (A, right diagonal). The number of days to maturity under drought and low N conditions was significantly correlated (p < 0.01) with TN, SL, SPS, KPS, TSW, GY and BM (A, right diagonal). DTM had a weak negative correlation with PH (r = −0.19), SE (r = −0.24), and HI (r = −0.32) under drought and low N conditions (A, right diagonal). Under DS and low N (A, right diagonal), PH was positively and significantly correlated (p < 0.01) with most assessed traits except for SE, DTM, TN and HI. Furthermore, the number of productive tillers was significant (p < 0.01) and positively correlated with DTH (r = 0.76), BM (r = 0.69), HI (r = 0.57) and SPS (r = 0.53), while it showed weak negative and non-significant correlations with PH (r = −0.21), KPS (r = −0.17) and TSW (r = −0.45).
Under the NS and low N conditions (A, left diagonal), grain yield had strong positive and highly significant correlations (p < 0.01) with BM (r = 0.84), DTM (r = 0.81), DTH (r = 0.73), SPS (r = 0.64), PH (r = 0.62) and TN (r = 0.55). However, weak and negative correlations were observed between the grain yield and SE (r = −0.13), KPS (r = −0.16), SL (r = −0.21) and HI (r = −0.24) (A, left diagonal). The DTM was significantly correlated (p < 0.01) with GY (r = 0.71), SPS (r = 0.66) and DTH (r = 0.56) under NS and low N (A, left diagonal). Under NS and low N, SPS was positively correlated with TSW (r = 0.88, p < 0.01) (A, left diagonal). Similar associations were observed between SPS and TSW (r = 0.52, p < 0.01) (A, right diagonal) under DS and low N. PH was positively correlated (p < 0.01) with SL (r = 0.96), SE (r = 0.80) and GY (r = 0.62) and had a negative correlation with TN (r = −0.16) under NS and low N (A, left diagonal). SPS was positively and significantly correlated with most traits under both water regimes and 50 kg N ha−1 (A).
Under the DS and intermediate N (100 kg N ha−1) conditions (B, right diagonal), GY was significantly (p < 0.01) and positively correlated with BM (r = 0.75), HI (r = 0.66), DTH (r = 0.58), TSW (r = 0.56) and TN (r = 0.53). However, under the NS condition (B, left diagonal) GY was positively correlated with BM (r = 0.77), TN (r = 0.65), HI (r = 0.55), SPS (r = 0.54) and TSW (r = 0.54). The number of days to heading under DS and intermediate N (B, right diagonal) was significantly (p < 0.01) correlated with SL (r = 0.79), TN (r = 0.62), BM (r = 0.58) and DTM (r = 0.54), however, the reverse was observed between DTH and BM (r = −0.20), TN (r = −0.21) and SL (r = −0.25) under NS and 100 kg N ha−1 (B, left diagonal). Plant height, number of productive tillers and 1000-seed weight were significantly (p < 0.01) correlated with DTH, SL, SPS, KPS, GY and BM under DS and 100 kg N ha−1 (B, right diagonal), while under NS and 100 kg N ha−1 (B, left diagonal) DTH was significantly (p < 0.05) correlated with SE, BM and HI. The number of kernels per spike was negatively correlated with GY (r = −0.24) under DS and 100 kg N ha−1 (B, right diagonal) and similar trends were noted between KPS and GY (r = −0.26) under NS and 100 kg N ha−1.
Under DS and 200 kg N ha−1 (C, right diagonal), GY was significantly (p < 0.05) and positively correlated with DTM (r = 0.89), HI (r = 0.73), DTH (r = 0.68), BM (r = 0.54) and SPS (r = 0.50). Whereas, GY had a negative correlation with SE (r = −0.16) and TSW (r = −0.26). Under NS and 200 kg N ha−1 (C, left diagonal), grain yield was significantly (p < 0.01) and positively correlated with SPS (r = 0.76), TSW (r = 0.71), HI (r = 0.67), SE (r = 0.62), BM (r = 0.60), DTM (r = 0.56) and SL (r = 0.55). Whereas grain yield had significant (p < 0.01) and negative correlations with PH (r = −0.21) and DTH (r = −0.25) (C, left diagonal). The DTH was significantly (p < 0.01) and positively correlated with DTM (r = 0.78), PH (r = 0.72) and TN (r = 0.69). Negative correlations were recorded between DTH and BM (r = −0.13, p < 0.05), SE (r = −0.21, p < 0.01), GY (r = −0.25, p < 0.01) and HI (r = −0.26, p < 0.05) under NS and 200 kg N ha−1 (C, left diagonal). The SL exhibited a negative correlation with PH (r = −0.37) under DS and 200 kg N ha−1 (C, right diagonal) and a similar trend was recorded for PH (r = −0.14) under NS and 200 kg N ha−1 (C, left diagonal).

3.4. Principal Component Analysis

Table 7 presents the results of the principal component analysis (PCA) of the assessed agronomic traits. The rotated component matrix explains the contribution of total variance by different principal components and their correlations with traits. Under DS and at the three N levels, two principal components (PCs) were identified with Eigenvalues > 1.
Under DS and low, intermediate and recommended N conditions, two principal components (PC1 and PC2) were computed, each contributing significantly to the total variation for the agronomic traits with cumulative variances of 53, 65 and 73%, respectively, of the N rates. Under DS and 50 kg N ha−1, PC1 contributed the most and showed high loading scores correlated with SL (0.75), SPS (0.73), BM (0.69), KPS (0.64), DTH (0.61), PH (0.60), while PC2 correlated with HI (0.71), TN (0.59) and BM (0.56). The PC1 contributed significantly and had high loading scores with SPS (0.96), KPS (0.83), SE (0.78), PH (0.68), GY (0.67), DTH (0.64) and BM (0.60), with PC2 revealing high correlations with SL (0.85), HI (0.78), GY (0.75), TN (0.69) and BM (0.59) under DS and 100 kg Nha−1. At 200 kg N ha−1, PC1 showed high loading scores correlated with SPS (0.91), DTH (0.79), PH (0.68), SE (0.64) and SL (0.58), whereas PC2 correlated with TN (0.87) and SL (0.76) and SE (0.70) under the DS condition.
Under NS and 100 and 200 kg N ha−1, two principal components had larger contributions with Eigenvalues > 1, while 50 kg N ha−1 had an Eigenvalue of 0.88. A total of 56, 76 and 80% of the variation explained by the agronomic traits were explained by the two principal components under NS and at the three N levels (50, 100 and 200 kg N ha−1), in that order. Under NS and low N, PC1 revealed high loading scores correlated with SE (0.95), GY (0.79), KPS (0.76), SPS (0.67), DTM (0.66), TSW (0.56) and DTM (0.51), while PC2 correlated with TN (0.85), BM (0.79), SL (0.67) and KPS (0.52). Whereas under NS and 100 kg N ha−1, PC1 was strongly associated with TN (0.94), DTH (0.92), TSW (0.88), PH (0.79), SPS (0.70) and BM (0.69). However, PC2 was positively correlated with DTM (0.62) and TN (0.59). PC1 was also well related with HI (0.90), BM (0.82), DTH (0.71), SL (0.67), KPS (0.62) and SE (0.54), whilst PC2 showed high loading scores and correlations with GY (0.71), TSW (0.62) and PH (0.58) under NS and 200 kg N ha−1. Other PCs showed weak correlations with the remaining agronomic traits under different water regimes and at different N treatments.

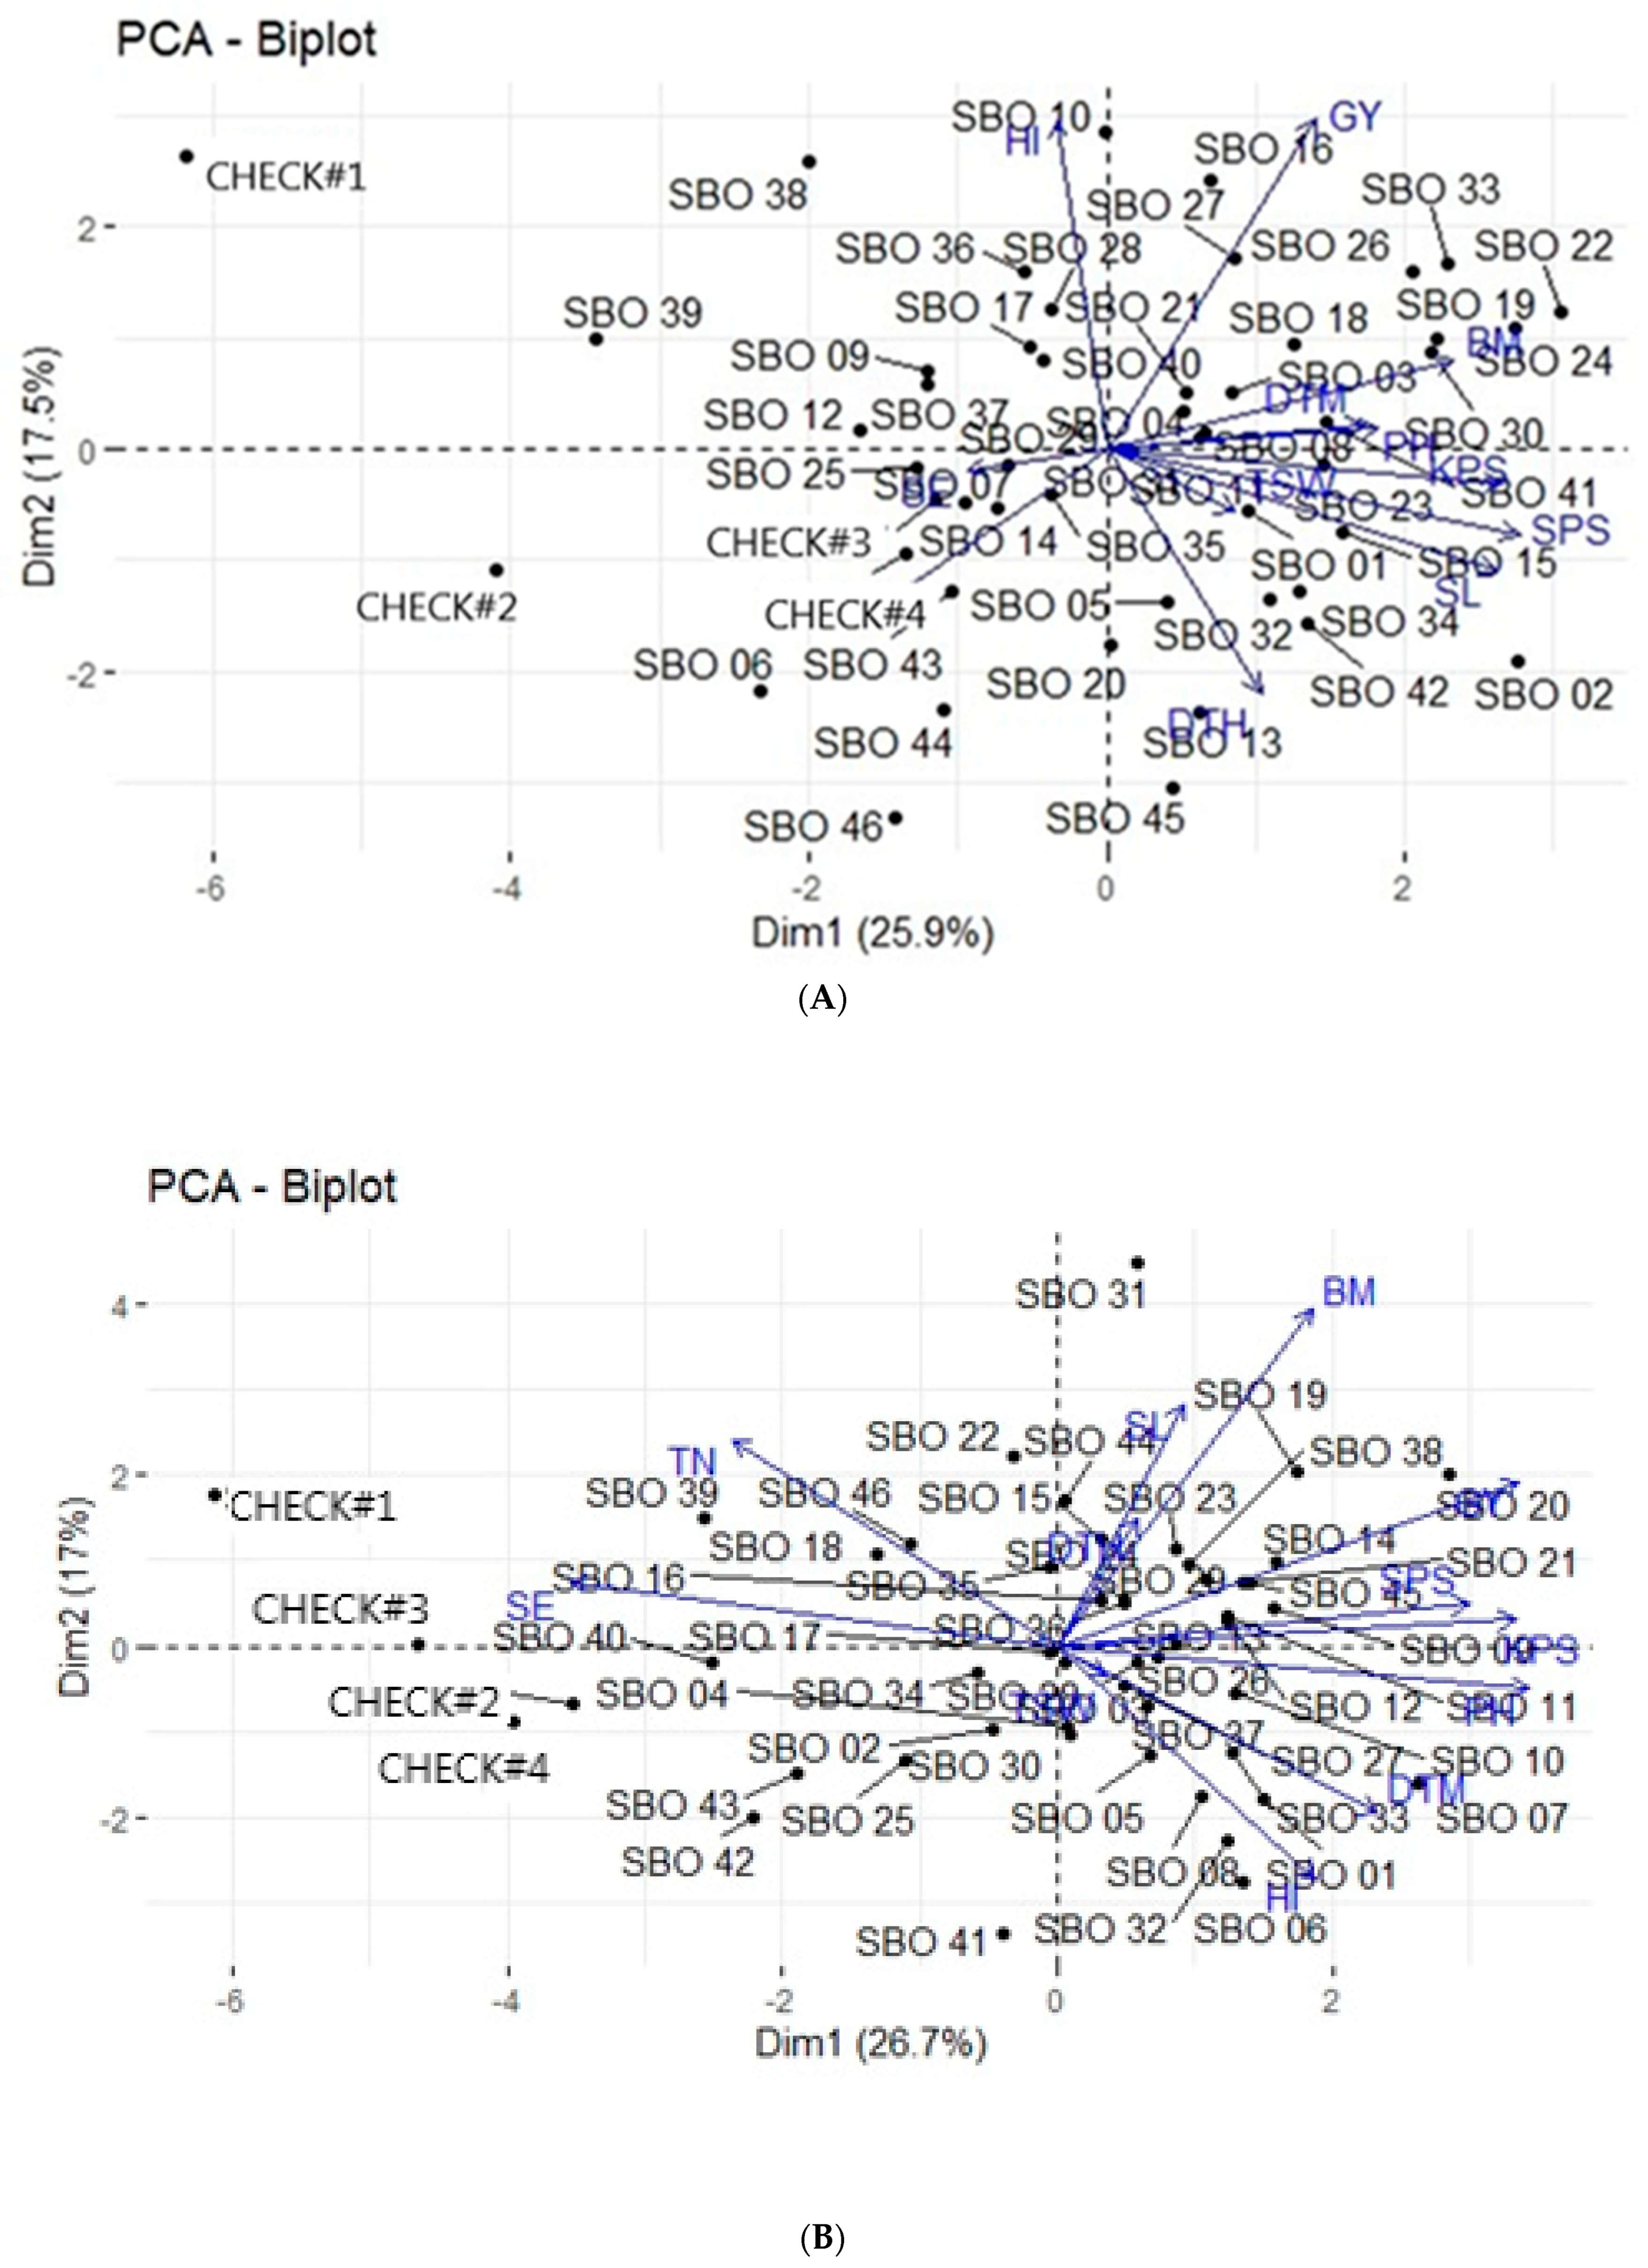
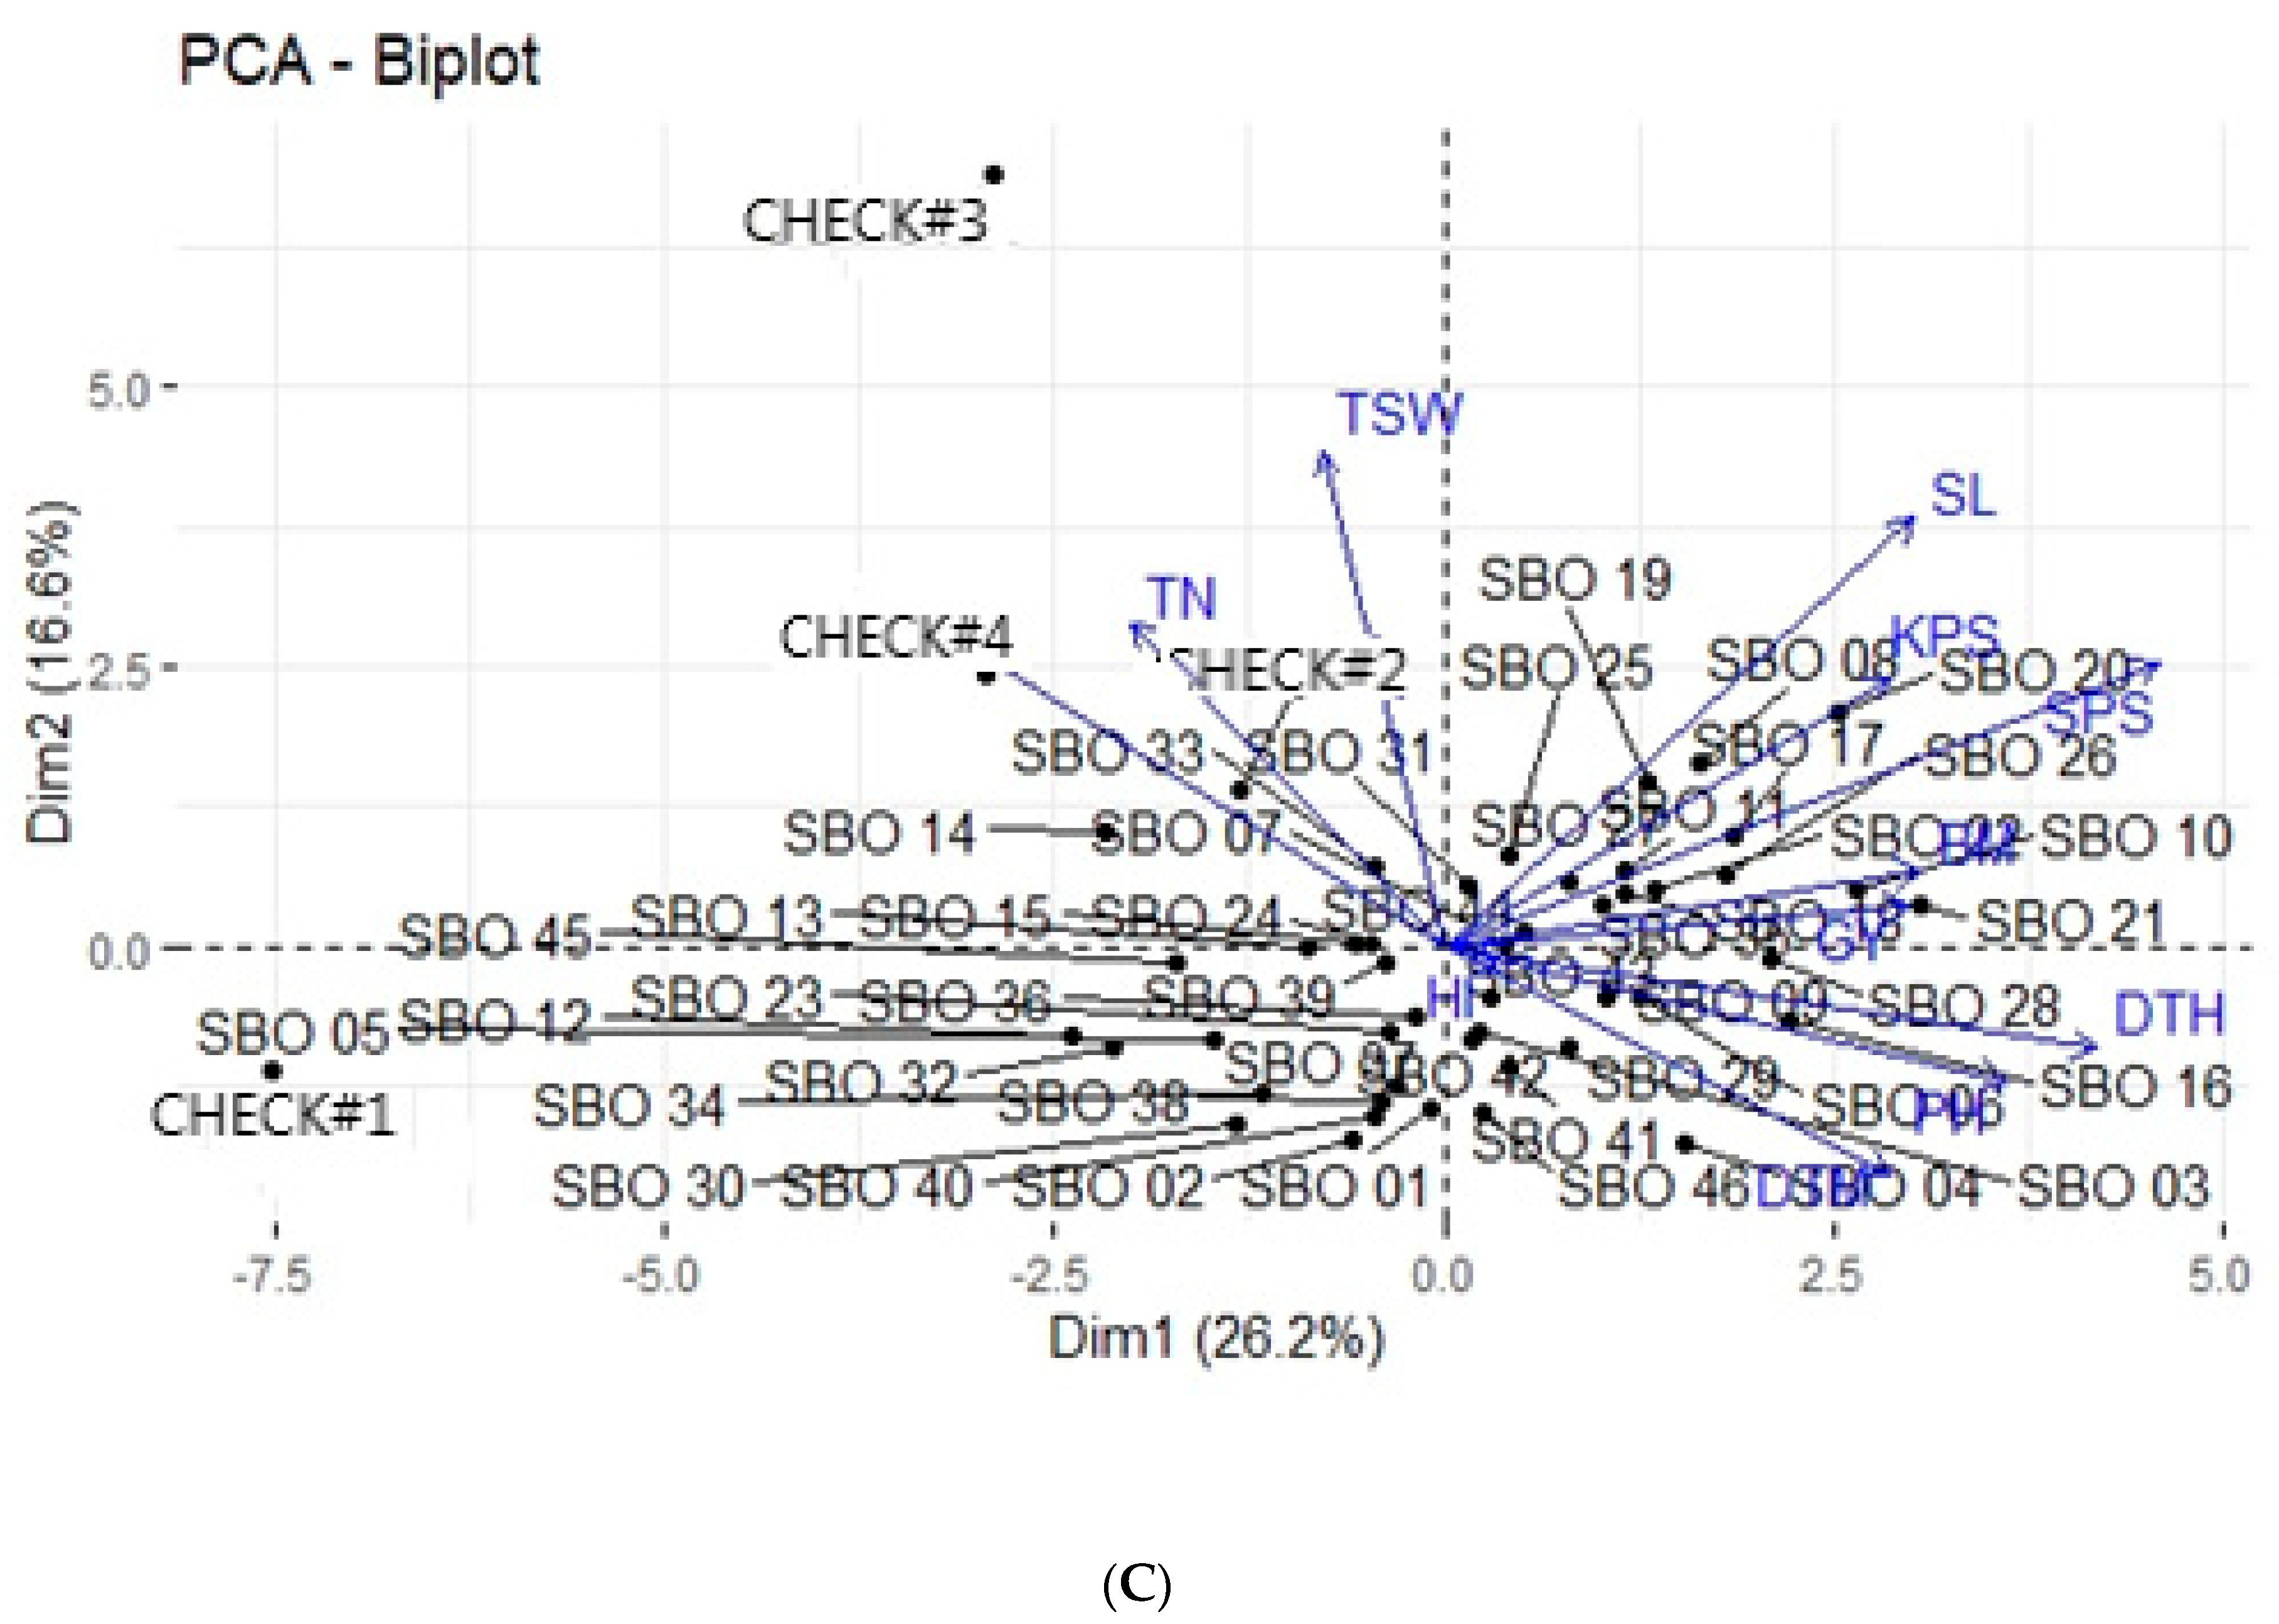
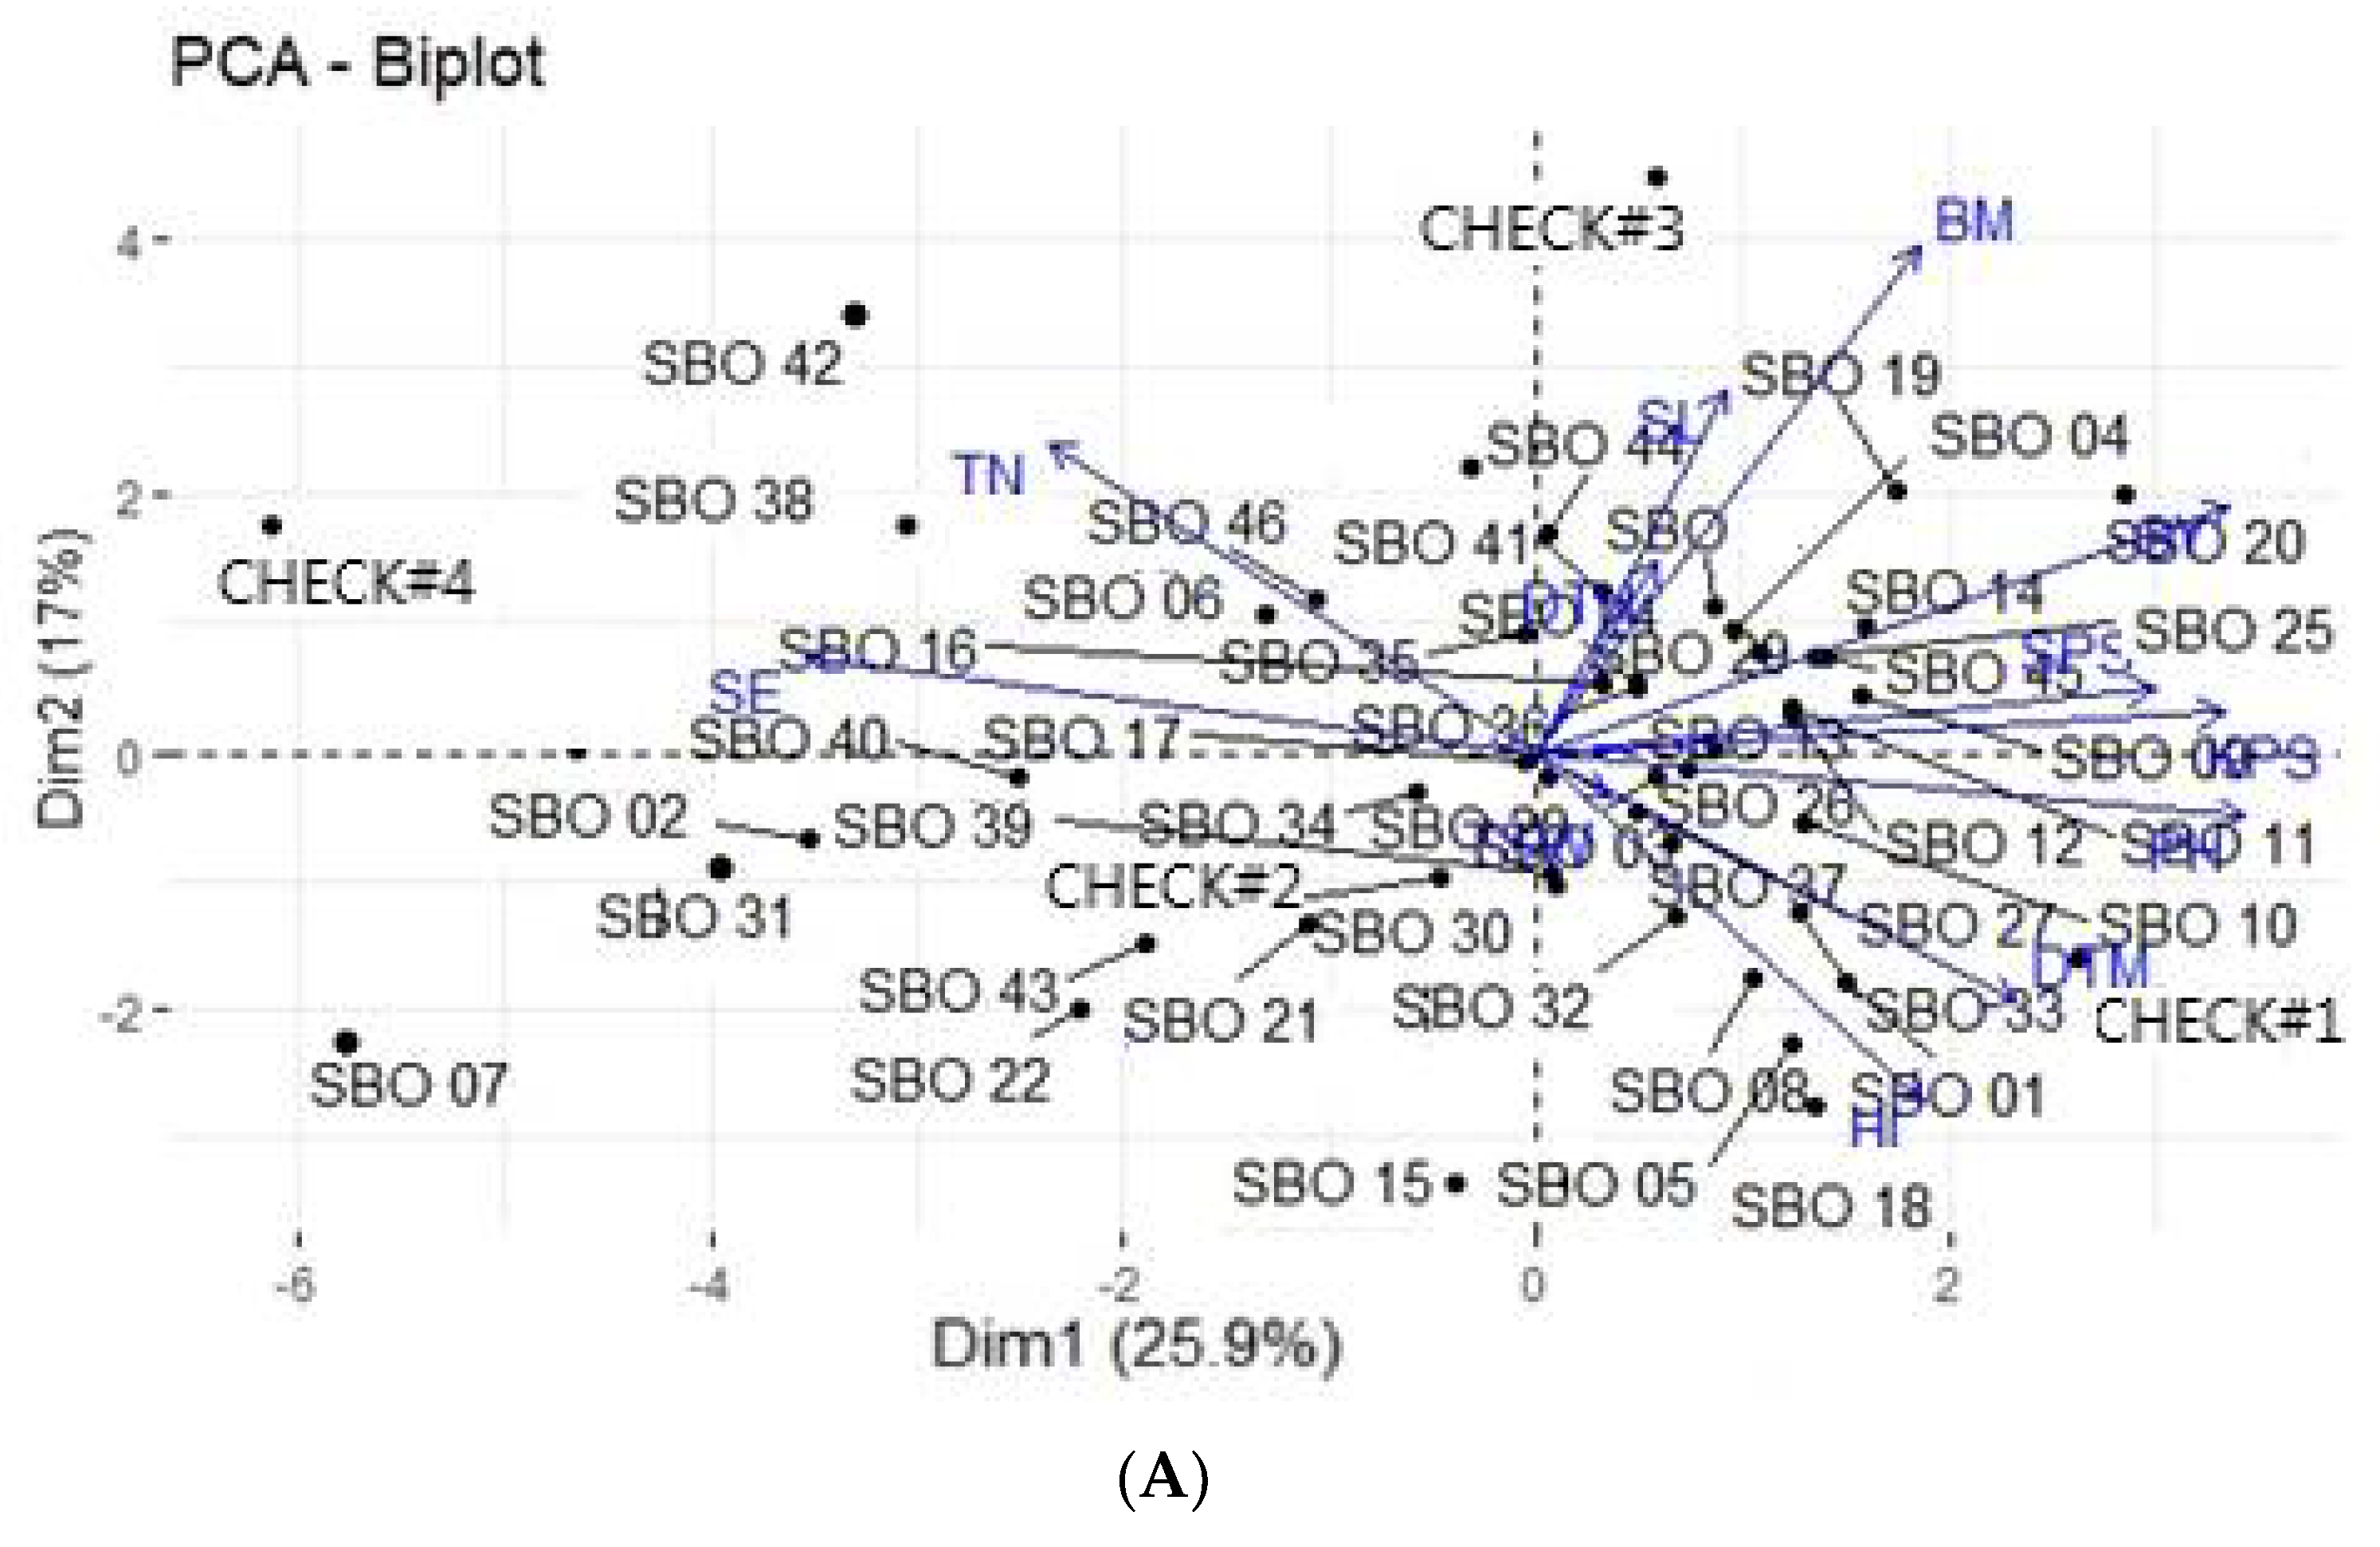
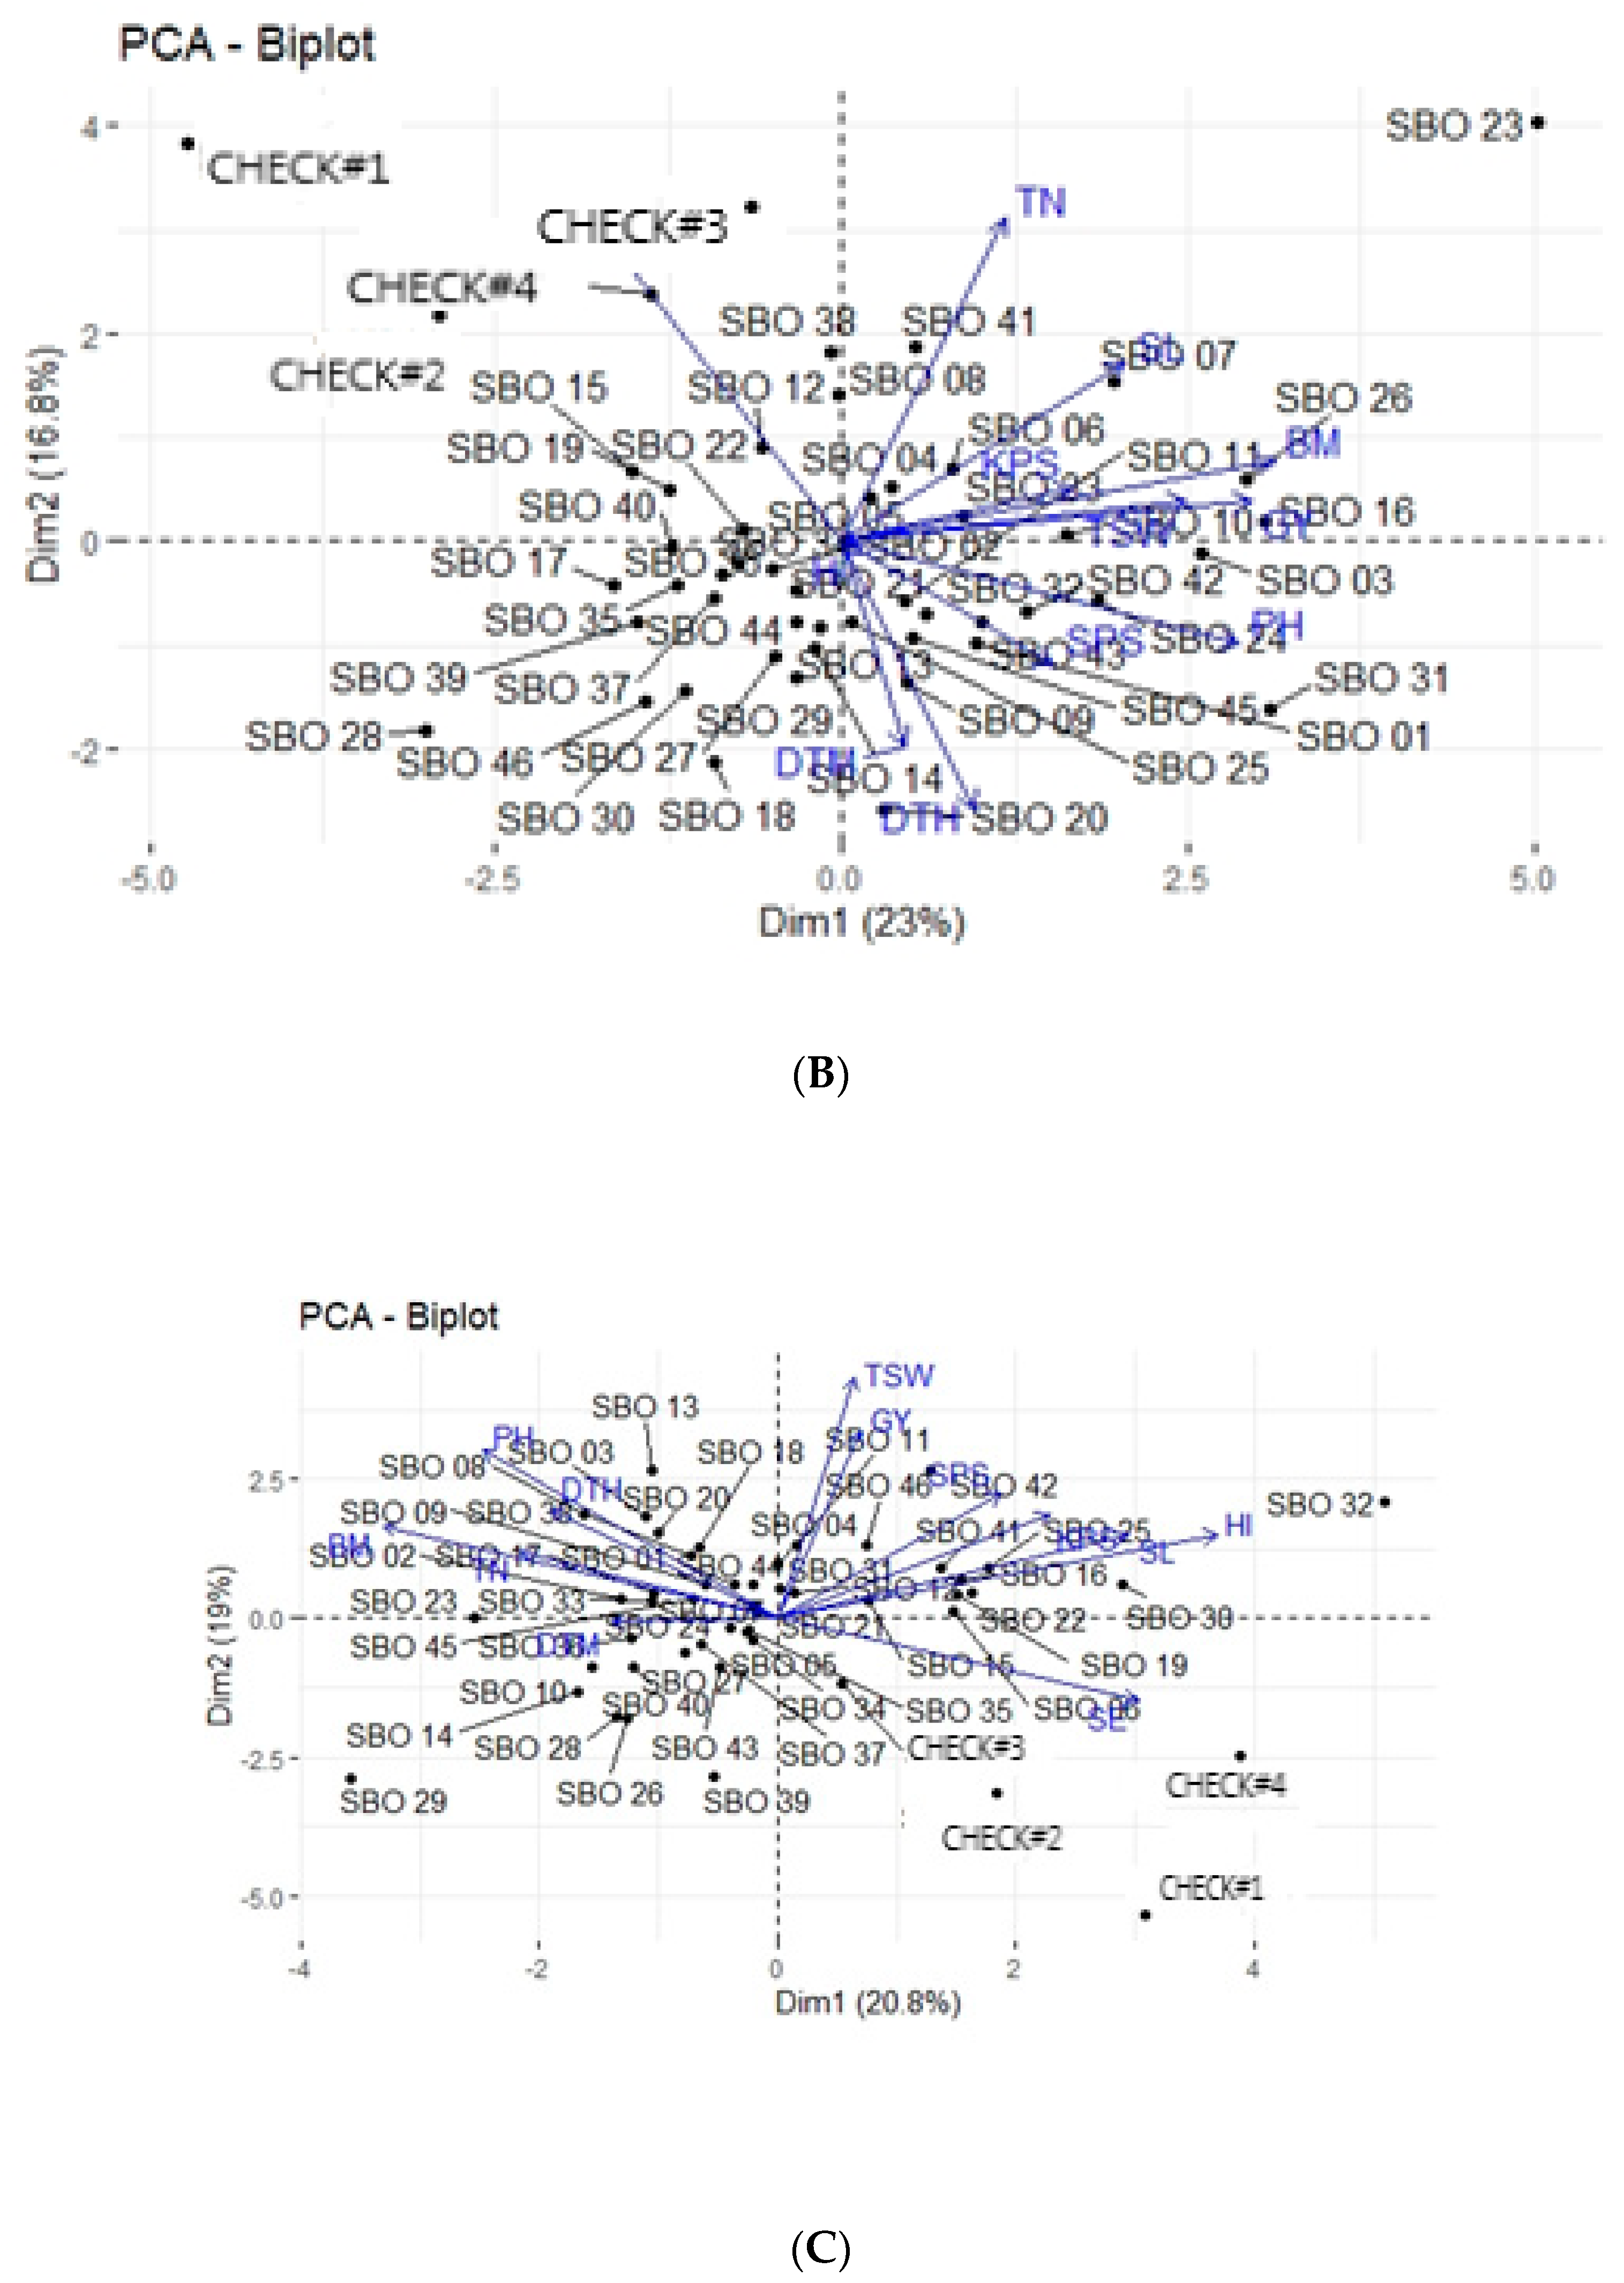
3.5. Principal Component Biplot Analysis

The association between genotypes and agronomic traits was further explained using principal component biplots (Figure 1 and Figure 2). The Figures represent DS and NS conditions, each consisting of three N treatments at A, 50 kg N ha−1; B, 100 kg N ha−1 and C, 200 kg N ha−1, respectively. The angles between the dimension vectors measure traits’ correlations to the genotype position, indicating the discriminating ability. The contribution of the trait concerning the performance of a genotype is considered successfully high yielding if the angle between its vector and the genotype is less than 90° (acute angle); near average if 90° (right angle) and below-average if greater than 90° (obtuse angle) [45,46].
Under the DS and low N conditions, the percentage of variation accounted for by dimension 1 (Dim 1) and Dim 2 axes were 26% and 17% (Figure 1A), whereas the total variation at 100 and 200 kg N ha−1 were 44% and 43%, respectively (Figure 1B,C). Genotypes SBO 16, SBO 33, SBO 27, SBO 26, SBO 18, SBO 22, SBO 19 and SBO 24 were located furthest from the point of origin in the positive direction and positively correlated with traits GY, BM, DTM and PH (Figure 1A). Genotypes SBO 40, SBO 04, SBO 29, SBO 08, SBO 11, SBO 35, SBO 37, and SBO 07 exhibited the closest position to the biplot origin; these genotypes had yields close to the overall mean yield, as indicated in Figure 1A. The following genotypes were positively correlated with traits closer to them: SBO 16 (GY), SBO 19 (BM), SBO 03 (DTM), SBO 30 (PH and KPS), SBO 11 (TSW), SBO 15 (SL and SPS), SBO 13 (DTH), SBO 0166 (TN), SBO 07 (SE) and SBO 10 (HI) under DS and 50 kg N ha−1 (Figure 1A). Under 100 and 200 kg N ha−1, genotypes SBO 19, SBO 26 and SBO 01 were inclined in the direction of the BM, SPS and GY traits and had above-average yields and were located on the acute angle of Dim 1 (Figure 1B,C). All check genotypes occupied a negative angle of Dim 2 on the biplots, indicating a negative correlation with most evaluated traits, especially check#1, which was the furthest of them all across the treatment combinations, as shown in Figure 1A,C. Other genotypes remained strongly positively correlated with traits closer to them.
Figure 2 shows the percentage of variation accounted for by Dim 1 and Dim 2 under the NS conditions and at different N levels. Each treatment combination contributed 43%, 40% and 40% to the total variation, respectively (Figure 2A–C). Genotypes located on the positive angle of Dim 2 showed a strong positive correlation with traits closer to them. Hence, genotypes SBO 20, CHECK#3, SBO 45, SBO 09 and SBO 44 were inclined more in the direction of GY, BM, SPS, KPS and SL under NS (Figure 2A). Genotypes SBO 03, SBO 29, SBO 34, SBO 35 and SBO 36 showed broad adaptability, as they were located closer to the centre of the biplot, while genotypes SBO 04, SBO 14 and SBO 25 had above-average yields and were located on the acute angle of Dim 1 (Figure 2A). Under the NS conditions, genotypes SBO 16, SBO 42 and SBO 04 were inclined in the positive direction of the SPS, KPS and GY traits, which indicated a strong positive correlation and were selected as high-yielding genotypes (Figure 2B,C). All the check genotypes occupied the furthest negative direction from the point of origin and had below-average yields under NS (Figure 2A,B). However, the checks exhibited the closest point to the centre of origin and had an average grain yield under the NS conditions, as indicated in Figure 2 (200 kg N ha−1). Most genotypes were located closer to the centre of origin and had average grain yields.

4. Discussion

The development of genotypes with drought and low N tolerance is the ultimate goal in wheat breeding programs, especially in marginal agro-ecologies. Conventional screening methods are effective ways for genotype evaluation under different water regimes and nitrogen applications to select contrasting genotypes for pre-breeding and breeding programs. The significant genotypic differences (p < 0.001) among traits showed that the genetic stocks used in this study could be used as a source of genetic variability for pre-breeding and production purposes (Table 4). The findings agree with Anwaar, Perveen [47] and Lv, Ding [33], who reported a highly significant genotypic variation in durum wheat genotypes under field screening conditions. A study conducted by Akcura, Partigoç [48] also reported significant genotypic differences among 47 wheat genotypes under drought stress conditions in Turkey. The variable genotypic responses were a consequence of the difference in the genetic background of the genotypes tested, given that the 46 genotypes were initially selected under drought and heat stress nursery programmes at CIMMYT, whereas the four local checks are currently the leading commercial wheat cultivars in the dryland spring wheat areas of South Africa and were previously characterized to originate from the drought-tolerant nurseries in SA (Table 1). Complementary genotypes can be selected for specific purposes based on the treatment combinations (Table 5). The four-way interaction effect was significant (p < 0.01) between genotypes, water regimes, N levels and sites, suggesting the role of the four factors in selecting an ideal genotype. Hence, the sampling of test genotypes and the inclusions of the two testing sites (greenhouse and field conditions), two water regimes (drought and non-stress), and three N treatments (50, 100, and 200 kg N ha−1) were appropriate as a guide for genotype selection. The variation of agronomic traits, such as PH, SL, grain size and quality, influence farmers’ preferences [49].
Reportedly, genotype responses are affected by the contribution of genotype by environment interactions (GEI) supporting the differential performances observed in the current study. Under field test conditions, genotypes showed taller PH, late flowering and maturity, longer spikes, high SPS and KPS and higher 1000-grain weight than in the greenhouse environment. Such differences are attributable to the effect of the environment, such as temperature, humidity, soil fertility, radiation and evapotranspiration. Genotypic variation is mainly attributed to the differences in the genetic constitution of the test genotypes, which is critical for wheat breeders [50]. Monneveux, Jing [37] and Sallam, Mourad [51] reported a highly significant effect of the environment in reducing the phenotypic expression of the genotype by decreasing the positive correlation between the genotype and phenotype. This form of correlation complicates the identification and ranking of stable and high-yielding genotypes.
Drought stress and N deficiency severely reduced BM and yield parameters, such as PH, SL, SPS and KPS and TSW (Table 5). These results agree with Mwadzingeni, Shimelis [52], who reported a high reduction in biomass production and trait performance, such as SL and TSW under DS compared to the NS conditions. The early leaf senescence observed among genotypes under DS and low N can be explained by the co-occurrence of the two constraints. The leaf senescence might have exceeded the threshold level, causing the plant to lose its biomass production, affecting photosynthesis, grain formation, and biochemical and physiological processes.
Nitrogen is a critical element and is essential for crop growth and development. Notably, it is crucial for chlorophyll formation, photosynthesis, grain formation and grain filling. Therefore, any limitation to the N uptake imposed by the environment, soil type and genotype may cause yield penalties [53]. This was noted under the DS and low N levels, where plants revealed stunted growth, reduced TSW and poor GY (Table 5). Grain yield is determined by the variability in nitrogen uptake efficiency (NUpE) and utilisation efficiency (NUtE) [54,55]. Genotypes exposed to DS and at different N treatments (50 and 100 kg N ha−1) could not absorb the maximum N content due to the water limitation responsible for assimilating mobilisation compared to the NS conditions. The combination of optimal water and N availability was significant in maintaining the green biomass, contributing to photosynthesis and the physiological properties of the genotype. Nitrogen use efficiency (NUE) is influenced by the size of the root system [56], leaf size and rate of photosynthesis [57,58], stay-green traits [59,60] and increased post-anthesis N-uptake [57]. Such promising traits explain the genetic variability and yield variation under drought and low N conditions.

4.1. Effect of Water Regime and Nitrogen Treatment on Genotype Performance and Grain Yield

The selection of high-yielding entries under different treatment combinations was possible by ranking the genotypes based on their yielding ability. Some genotypes showed marked yield response and desirable performance for agronomic traits across different environments (Table 5). High yields were observed for genotypes SBO 16, SBO 33, SBO 22, SBO 26, SBO 19, SBO 27 and SBO 03 under the DS and 50 kg N ha−1 conditions. This agrees with Bagrei and Bybordi’s [61] findings, which pinpointed that genotypes performing well under NS and an optimal N application could retain high yields under drought and low N stress. However, the high cross-over interaction that was observed due to the severe stress conditions under the drought and low N conditions resulted in average yield losses of 36.91% compared to 26% obtained under mild stress [62]. In the present study, genotypes exposed to drought and low N had an average grain yield of 223.47 g/m2 compared to 231.08 g/m2 obtained under NS and 50 kg N ha−1 (Table 5).
The combined effect of drought and low N severely reduced yield parameters, such as the number of TN, KPS and 1000-seed weight (Table 5), which are critical for GY gain. Wheat genotypes with high-yielding ability under the DS and low N conditions can double GY when exposed to NS and optimal N environments [63]. The highest yielding genotypes, such as SBO 19, SBO 16, 22, SBO 04 and SBO 33, maintained their productivity across the two water regimes and three N levels. This response allowed the test genotypes to allocate more biomass towards spike length and increased SPS and KPS. Hence, such genotypes can be exploited for their ability to tolerate DS and N deficiency, which is a common phenomenon in Sub-Saharan Africa (SSA), where drought and N stresses co-occur.
The current study found that the genotypes exposed to drought and low N stress had stunted plant growth, reduced plant biomass, early leaf senescence, seed deformation and poor grain yield compared to genotypes tested under NS and 100 and 200 kg N ha−1. The local checks revealed short plants, reduced plant biomass, early leaf senescence, short spike length and a reduced number of grains per spike, wrinkled seeds and poor grain quality across the treatment combinations, which were more noticeable under drought than non-stress conditions (Table 5). Mojaddam [64] and Basal and Szabó [65] reported comparable results and pinpointed that DS reduced plant biomass by 13% in sunflowers and 40% in soybean. Plant height and plant biomass measure the contribution of water and N availability required for trait expressions, such as productive tillers, spike length and spikelets per spike, which influences yield improvement [34,66].
The wide genetic variability observed among the presently evaluated germplasm under two water regimes and at three N treatments, provided new insights for wheat improvement in South Africa and similar agro-ecologies. This allowed for the selection of best-performing genotypes adapted under drought or low N conditions, which is vital for breeding programmes. For instance, genotype check#1 had early maturity across all the treatment combinations, while SBO 19 was the highest yielding genotype under DS and three N levels. Trait integration from one genotype into another can create selectable segregates that mature earlier with high-yielding ability under limited water and N conditions. This study identified the 10 best high-yielding genotypes with broad adaptability under different water regimes and N treatments. The selected genotypes had an outstanding yield and agronomic performance compared to the local checks (Table 5). The selected genotypes reached their total grain production within a short growing period, which is an advantage for escaping drought and tolerating low N stresses in the field [33,67,68]. Genotypes selected under drought and heat stress nurseries had better adaptation to the summer season than the local checks, which are winter wheat types. Additionally, the genetic combination of these genotypes can provide useful germplasm diversity for future breeding programs.

4.2. Correlation of Agronomic Traits Tested under Variable Water Regimes and Nitrogen Treatments

Grain yields under DS and 50 kg N ha−1 and NS and 50 kg N ha−1 showed a strong positive correlation and high significance (r > 0.5; p < 0.01) with most of the traits (Table 6). This indicates the direct contribution of the yield parameters to grain yield. Yield components should be incorporated during the breeding and selection of high-yielding genotypes. The present study identified significant (p < 0.01) and positive correlations between GY and BM (r = 0.84), DTM (r = 0.76), TN (0.70), PH (r = 0.63), KPS (r = 0.63), TSW (0.56) and SL (r = 0.51) under the DS and low N (Table 6A, right diagonal) conditions. These results revealed that genotypes selected based on these traits have a greater capacity for increasing GY under stressed environments. Dodig, Zorić [69] and Sareen, Tyagi [70] reported positive correlations between PH and BM and mentioned that greater root development improves water uptake and nutrient absorption, which is required for plant growth and development. Other agronomic traits exhibited variable degrees of correlations (either positive or negative), suggesting that phenotypic traits can influence GY differently depending on drought and N availability. This study found high mean values for the 1000-kernel weight that were complemented by the increase in SL and the KSP under 100 kg N ha−1 (Table 5). Sedri, Amini [66] evaluated the effect of drought and N deficiency on bread wheat and found that the genotypes tested under DS and 120 kg N ha−1 had greater 1000-grain weight and contributed significantly to higher GY, despite the reduction in the SPS.
The associations of GY with DTH, DTM, PH, TN, SPS and BM were significant (p < 0.01) under NS and low N (Table 6A, left diagonal). The DTH and DTM are critical stages, influencing plant growth and grain development. A reduced number of DTH and DTM allows the plant to efficiently utilise necessary assimilates for grain filling before drought and low N stresses in the experimental units [71,72]. However, it is essential to allow the normal plant life cycle to maintain its essential traits that contribute to high yields. It was observed that the local checks which had the early maturing and shortest genotypes, check#2, check#3, check#4, check#1 and check#2, had remarkable yield reductions due to severe drought and low N stress. These results agree with Liu, Zhang [73], who reported that short wheat genotypes with two dwarfism alleles, Rht-B1b and Rht-D1b, yielded lower than those with one or none of the dwarfing alleles under both water regimes.
The local checks showed a low capacity to accumulate sufficient tillers responsible for water and nutrient supply to the grain. The local check#1 was the earliest and shortest but had many productive tillers and a higher 1000-grain weight across the treatment combinations (Table 5). These results reportedly implicated that a lengthy grain filling period is essential to maintain high GY and quality [24,35]. Furthermore, the reduced plant growth observed under drought and low N compromised the yield-related traits. Genotypes exposed to DS and low to intermediate N applications revealed a reduction in BM accumulation and GY due to evapotranspiration and a lack of adequate soil N absorption, especially under field conditions. These findings agree with the results of Mursalova, Akparov [74] and Ballesta, Mora [75], who obtained poor grain quality and low genetic gains in transgenic wheat plants under drought and low N conditions. The future breeding programme should consider the positive correlation between GY and BM, which measures the contribution of assimilates to total GY improvement [76,77,78]. Parameters, such as plant growth and development, leaf senescence and seed abortion still remain the best for identifying genotypes tolerant to drought and low N stresses when performing the phenotypic selection.
Genotype responses were further analysed using principal component analysis (PCA). The PCA allows the identification of important agronomic traits influencing GY improvement among evaluated genotypes. This study revealed variable PC scores under the two water regimes and three N levels, which measured the relatedness of the traits (Table 7). Agronomic traits, such as SL, SPS, BM, KPS, DTH, PH, HI, TN and BM were identified as the most important parameters due to their high contribution to PC1 and PC2 under drought and low N conditions. These results indicate the importance of the traits during germplasm selection. Accessions that showed high and desirable mean performances based on a specific trait can be selected for crop improvement programs in a target production environment. Other studies have mentioned that traits’ contribution to PC1 and PC2 depends on the genetic diversity of the germplasm and the number of traits tested [79,80,81]. Under drought and intermediate and recommended N conditions, PH, TN, SL, KPS, TSW and BM were vital traits for indirect selection for GY due to their relatedness with GY and high PC scores.
This was further emphasised by Pour-Aboughadareh, Ahmadi [32], who pointed out that the selection of traits should be based on high PC1 and PC2 values, serving as a measure that distinguishes the contribution of each trait to total variation. The grain yield variations observed among different genotypes under both water regimes and at different N applications agree with Shi, Yasuor [34], who reported an increase in GY in wheat exposed to drought and low N stress. The authors suggested the occurrence of some level of osmotic adjustment. A similar trend of limited water and N supply was observed between GY and genotypes SBO 16, SBO 33, SBO 27, SBO 26, SBO 18, SBO 22, and 19, which indicated a strong positive correlation under the DS conditions (Figure 1A). The positive correlation showed that the genotypes had a lengthy period to accumulate enough assimilates to provide a high GY. This was also noted for the derivatives of the wheat cultivar, Chines Spring, which was drought-tolerant compared to the susceptible cultivars [82]. Such genotypes should be incorporated into future breeding programs to exploit their genetic constituents.
Most yield components have contributed significantly to GY formation, implying that the selection of any yield component could result in more remarkable yield improvement, except for the traits HI, SL and TN (Figure 1B and Figure 2A). Under the NS and 100 kg N ha−1 conditions, the high SPS and KPS contributed more to GY when compared to other yield components (Figure 2B,C). The strong positive correlation observed between GY and the traits DTH, DTM, PH and SL suggest that these genotypes have effective water use efficiency, short maturation and genetic potential for the formation and mobilisation of assimilates, which are beneficial for grain filling and yield response. The selected genotypes with desired traits should be incorporated into future breeding programs to exploit their genetic constitution. Genomic resources and marker-assisted selection can be used to explore the genes controlling transcription regulators for morpho-physiological traits, including root architecture, stomatal conductance and osmotic adjustments.

5. Conclusions

Breeding progress for simultaneous drought and low N tolerance in wheat is still limited to achieving significant yield improvement and productivity in dryland agro-ecologies. Drought stress and nitrogen deficiency are complex traits, which are controlled by several major and minor genes that influence crop adaptability. This study evaluated 50 genetically diverse bread wheat genotypes under drought and low N stress conditions to select superior genotypes for developing breeding populations or direct production to mitigate against drought and low N stress. The genotypes revealed marked genetic variation in agronomic traits, such as the DTH, DTM, PH, SL, SPS, KSP, TSW, GY and BM. The combined analysis of data explained a significant (p < 0.001) genotype by environment interaction effect for most traits, notably for DTM, PH, SL, GY, BM, HI, SPS and KPS. These results indicated that the tested germplasm consisted of important genetic resources for developing drought and low N tolerant genotypes. The positive correlation of GY and most morphological traits, especially DTH, DTM, PH, TN, SL, KPS, TSW and BM, proved that it is possible to simultaneously select for high GY and genotypes tolerant to drought and low N stress. Genetic diversity analysis for the quantitative agronomic traits identified 10 promising and contrasting genotypes, which were selected as parental lines for further breeding programs. The assessed local checks can be integrated into future crossing programs to exploit their early heading and maturity and short PH characters, which are critical for drought and low N stress escape. The selected genotypes are recommended for breeding new generation wheat cultivars tolerant to a combination of drought and low N stresses to promote yield improvement in related agro-ecologies. In addition, these genotypes could provide novel genes and other important agronomic characteristics to benefit subsequent improvement in wheat grain yield and quality.

Author Contributions

All authors listed have made a direct and intellectual contribution to this paper and approved it for publication. All authors have read and agreed to the published version of the manuscript.

Funding

The South African Cultivar and Technology Agency (SACTA) and the National Research Foundation (NRF).

Institutional Review Board Statement

Not applicable.

Informed Consent Statement

Not applicable.

Data Availability Statement

Data and information associated with the current study are presented in the manuscript.

Acknowledgments

The authors thank the South African Cultivar and Technology Agency (SACTA) and the National Research Foundation (NRF) of South Africa for funding, and the African Centre for Crop Improvement (ACCI) of the University of KwaZulu-Natal for providing technical support. We thank Susan van der Merwe and Ian Doidge (CEF/Ukulinga Research fam), Duma Sanele, Dlamini Nkazimulo, Khumalo Nontobeko and Khumalo Njabulo (University of KwaZulu-Natal) for their assistance during the field experiments.

Conflicts of Interest

The authors declare no conflict of interest.

References

  1. Tadesse, W.; Bishaw, Z.; Assefa, S. Wheat production and breeding in Sub-Saharan Africa: Challenges and opportunities in the face of climate change. Int. J. Clim. Change Strateg. Manag. 2019, 11, 696–715. [Google Scholar] [CrossRef] [Green Version]
  2. Zörb, C.; Ludewig, U.; Hawkesford, M.J. Perspective on wheat yield and quality with reduced nitrogen supply. Trends Plant Sci. 2018, 23, 1029–1037. [Google Scholar] [CrossRef] [PubMed] [Green Version]
  3. Ullah, M.I.; Mahpara, S.; Bibi, R.; Shah, R.U.; Ullah, R.; Abbas, S.; Ullah, M.I.; Hassan, A.M.; Elshehawi, A.M.; Brestic, M. Grain yield and correlated traits of bread wheat lines: Implications for yield improvement. Saudi J. Biol. Sci. 2021, 28, 5714–5719. [Google Scholar] [CrossRef] [PubMed]
  4. Lamaoui, M.; Jemo, M.; Datla, R.; Bekkaoui, F. Heat and drought stresses in crops and approaches for their mitigation. Front. Chem. 2018, 6, 26. [Google Scholar] [CrossRef] [PubMed]
  5. Yadav, M.R.; Choudhary, M.; Singh, J.; Lal, M.K.; Jha, P.K.; Udawat, P.; Gupta, N.K.; Rajput, V.D.; Garg, N.K.; Maheshwari, C. Impacts, Tolerance, Adaptation, and Mitigation of Heat Stress on Wheat under Changing Climates. Int. J. Mol. Sci. 2022, 23, 2838. [Google Scholar] [CrossRef]
  6. Ahmad, R.; Waraich, E.A.; Ashraf, M.; Ahmad, S.; Aziz, T. Does nitrogen fertilization enhance drought tolerance in sunflower? A review. J. Plant Nutr. 2014, 37, 942–963. [Google Scholar] [CrossRef]
  7. Abid, M.; Tian, Z.; Ata-Ul-Karim, S.T.; Cui, Y.; Liu, Y.; Zahoor, R.; Jiang, D.; Dai, T. Nitrogen nutrition improves the potential of wheat (Triticum aestivum L.) to alleviate the effects of drought stress during vegetative growth periods. Front. Plant Sci. 2016, 7, 981. [Google Scholar] [CrossRef] [Green Version]
  8. Haider, I.; Raza, M.A.S.; Iqbal, R.; Aslam, M.U.; Habib-ur-Rahman, M.; Raja, S.; Khan, M.T.; Aslam, M.M.; Waqas, M.; Ahmad, S. Potential effects of biochar application on mitigating the drought stress implications on wheat (Triticum aestivum L.) under various growth stages. J. Saudi Chem. Soc. 2020, 24, 974–981. [Google Scholar] [CrossRef]
  9. Weber, V.S.; Melchinger, A.E.; Magorokosho, C.; Makumbi, D.; Bänziger, M.; Atlin, G.N. Efficiency of managed-stress screening of elite maize hybrids under drought and low nitrogen for yield under rainfed conditions in Southern Africa. Crop Sci. 2012, 52, 1011–1020. [Google Scholar] [CrossRef] [Green Version]
  10. Fang, Y.; Du, Y.; Wang, J.; Wu, A.; Qiao, S.; Xu, B.; Zhang, S.; Siddique, K.H.; Chen, Y. Moderate drought stress affected root growth and grain yield in old, modern and newly released cultivars of winter wheat. Front. Plant Sci. 2017, 8, 672. [Google Scholar] [CrossRef] [Green Version]
  11. Hasanuzzaman, M.; Raihan, M.; Hossain, R.; Masud, A.A.C.; Rahman, K.; Nowroz, F.; Rahman, M.; Nahar, K.; Fujita, M. Regulation of Reactive Oxygen Species and Antioxidant Defense in Plants under Salinity. Int. J. Mol. Sci. 2021, 22, 9326. [Google Scholar] [CrossRef] [PubMed]
  12. Goufo, P.; Moutinho-Pereira, J.M.; Jorge, T.F.; Correia, C.M.; Oliveira, M.R.; Rosa, E.A.; António, C.; Trindade, H. Cowpea (Vigna unguiculata L. Walp.) metabolomics: Osmoprotection as a physiological strategy for drought stress resistance and improved yield. Front. Plant Sci. 2017, 8, 586. [Google Scholar] [CrossRef] [PubMed] [Green Version]
  13. Lee, S.B.; Suh, M.C. Recent advances in cuticular wax biosynthesis and its regulation in Arabidopsis. Mol. Plant 2013, 6, 246–249. [Google Scholar] [CrossRef] [PubMed] [Green Version]
  14. López-Maury, L.; Marguerat, S.; Bähler, J. Tuning gene expression to changing environments: From rapid responses to evolutionary adaptation. Nat. Rev. Genet. 2008, 9, 583–593. [Google Scholar] [CrossRef] [PubMed]
  15. Joshi, R.; Wani, S.H.; Singh, B.; Bohra, A.; Dar, Z.A.; Lone, A.A.; Pareek, A.; Singla-Pareek, S.L. Transcription factors and plants response to drought stress: Current understanding and future directions. Front. Plant Sci. 2016, 7, 1029. [Google Scholar] [CrossRef] [Green Version]
  16. Savin, R.; Slafer, G.A.; Cossani, C.M.; Abeledo, L.G.; Sadras, V.O. Cereal yield in Mediterranean-type environments: Challenging the paradigms on terminal drought, the adaptability of barley vs. wheat and the role of nitrogen fertilization. In Crop Physiology; Elsevier: LIeida, Spain, 2015; pp. 141–158. [Google Scholar]
  17. Qaseem, M.F.; Qureshi, R.; Shaheen, H. Effects of pre-anthesis drought, heat and their combination on the growth, yield and physiology of diverse wheat (Triticum aestivum L.) genotypes varying in sensitivity to heat and drought stress. Sci. Rep. 2019, 9, 6955. [Google Scholar] [CrossRef] [PubMed] [Green Version]
  18. Zampieri, M.; Ceglar, A.; Dentener, F.; Toreti, A. Wheat yield loss attributable to heat waves, drought and water excess at the global, national and subnational scales. Environ. Res. Lett. 2017, 12, 064008. [Google Scholar] [CrossRef]
  19. Van der Westhuizen, L.; Trapnell, L. How do we compare with “down under”. In Measuring and Comparing the Competitiveness of South African Wheat Industry with Australia; SA Graan/Grain: Pretoria, South Africa, 2015; pp. 51–57. [Google Scholar]
  20. Sosibo, N.Z.; Muchaonyerwa, P.; Visser, L.; Barnard, A.; Dube, E.; Tsilo, T.J. Soil fertility constraints and yield gaps of irrigation wheat in South Africa. S. Afr. J. Sci. 2017, 113, 1–9. [Google Scholar] [CrossRef] [Green Version]
  21. Leip, A.; Billen, G.; Garnier, J.; Grizzetti, B.; Lassaletta, L.; Reis, S.; Simpson, D.; Sutton, M.A.; De Vries, W.; Weiss, F. Impacts of European livestock production: Nitrogen, sulphur, phosphorus and greenhouse gas emissions, land-use, water eutrophication and biodiversity. Environ. Res. Lett. 2015, 10, 115004. [Google Scholar] [CrossRef]
  22. Mhike, X.; Okori, P.; Magorokosho, C.; Ndlela, T. Validation of the use of secondary traits and selection indices for drought tolerance in tropical maize (Zea mays L.). Afr. J. Plant Sci. 2012, 6, 96–102. [Google Scholar]
  23. Nazir, M.; Pandey, R.; Siddiqi, T.O.; Ibrahim, M.M.; Qureshi, M.I.; Abraham, G.; Vengavasi, K.; Ahmad, A. Nitrogen-deficiency stress induces protein expression differentially in low-N tolerant and low-N sensitive maize genotypes. Front. Plant Sci. 2016, 7, 298. [Google Scholar] [CrossRef] [PubMed] [Green Version]
  24. Shahrasbi, S.; Emam, Y.; Ronaghi, A.; Pirasteh-Anosheh, H. Effect of drought stress and nitrogen fertilizer on grain yield and agronomic nitrogen use efficiency of wheat (Triticum aestivum L. cv. Sirvan) in Fars Province, Iran conditions. Iran. J. Crop Sci. 2015, 17, 349–363. [Google Scholar]
  25. Abdel-Motagally, F.; El-Zohri, M. Improvement of wheat yield grown under drought stress by boron foliar application at different growth stages. J. Saudi Soc. Agric. Sci. 2018, 17, 178–185. [Google Scholar] [CrossRef] [Green Version]
  26. Swain, E.Y.; Rempelos, L.; Orr, C.H.; Hall, G.; Chapman, R.; Almadni, M.; Stockdale, E.A.; Kidd, J.; Leifert, C.; Cooper, J.M. Optimizing nitrogen use efficiency in wheat and potatoes: Interactions between genotypes and agronomic practices. Euphytica 2014, 199, 119–136. [Google Scholar] [CrossRef]
  27. Hawkesford, M.J. Reducing the reliance on nitrogen fertilizer for wheat production. J. Cereal Sci. 2014, 59, 276–283. [Google Scholar] [CrossRef] [Green Version]
  28. Nehe, A.; Misra, S.; Murchie, E.; Chinnathambi, K.; Foulkes, M. Genetic variation in N-use efficiency and associated traits in Indian wheat cultivars. Field Crops Res. 2018, 225, 152–162. [Google Scholar] [CrossRef]
  29. Banziger, M.; Diallo, A. Progress in developing drought and N stress tolerant maize cultivars for eastern and southern Africa. In Proceedings of the 7th Eastern and Southern Africa Regional Maize Conference, Nairobi, Kenya, 5–11 February 2001. [Google Scholar]
  30. Nawaz, F.; Ahmad, R.; Waraich, E.; Naeem, M.; Shabbir, R. Nutrient uptake, physiological responses, and yield attributes of wheat (Triticum aestivum L.) exposed to early and late drought stress. J. Plant Nutr. 2012, 35, 961–974. [Google Scholar] [CrossRef]
  31. Naeem, M.K.; Ahmad, M.; Kamran, M.; Shah, M.K.N.; Iqbal, M.S. Physiological responses of wheat (Triticum aestivum L.) to drought stress. Int. J. Plant Soil Sci. 2015, 6, 1–9. [Google Scholar] [CrossRef]
  32. Pour-Aboughadareh, A.; Ahmadi, J.; Mehrabi, A.A.; Etminan, A.; Moghaddam, M.; Siddique, K.H. Physiological responses to drought stress in wild relatives of wheat: Implications for wheat improvement. Acta Physiol. Plant. 2017, 39, 106. [Google Scholar] [CrossRef]
  33. Lv, X.; Ding, Y.; Long, M.; Liang, W.; Gu, X.; Liu, Y.; Wen, X. Effect of Foliar Application of Various Nitrogen Forms on Starch Accumulation and Grain Filling of Wheat (Triticum aestivum L.) Under Drought Stress. Front. Plant Sci. 2021, 12, 463. [Google Scholar] [CrossRef]
  34. Shi, J.; Yasuor, H.; Yermiyahu, U.; Zuo, Q.; Ben-Gal, A. Dynamic responses of wheat to drought and nitrogen stresses during re-watering cycles. Agric. Water Manag. 2014, 146, 163–172. [Google Scholar] [CrossRef]
  35. Ahmad, Z.; Waraich, E.A.; Akhtar, S.; Anjum, S.; Ahmad, T.; Mahboob, W.; Hafeez, O.B.A.; Tapera, T.; Labuschagne, M.; Rizwan, M. Physiological responses of wheat to drought stress and its mitigation approaches. Acta Physiol. Plant. 2018, 40, 80. [Google Scholar] [CrossRef]
  36. Astaneh, N.; Bazrafshan, F.; Zare, M.; Amiri, B.; Bahrani, A. Nano-fertilizer prevents environmental pollution and improves physiological traits of wheat grown under drought stress conditions. Sci. Agropecu. 2021, 12, 41–47. [Google Scholar] [CrossRef]
  37. Monneveux, P.; Jing, R.; Misra, S. Phenotyping for drought adaptation in wheat using physiological traits. Front. Physiol. 2012, 3, 429. [Google Scholar] [CrossRef] [Green Version]
  38. Passioura, J. Phenotyping for drought tolerance in grain crops: When is it useful to breeders? Funct. Plant Biol. 2012, 39, 851–859. [Google Scholar] [CrossRef]
  39. Wasson, A.; Richards, R.; Chatrath, R.; Misra, S.; Prasad, S.S.; Rebetzke, G.; Kirkegaard, J.; Christopher, J.; Watt, M. Traits and selection strategies to improve root systems and water uptake in water-limited wheat crops. J. Exp. Bot. 2012, 63, 3485–3498. [Google Scholar] [CrossRef] [Green Version]
  40. Farooq, M.; Hussain, M.; Siddique, K.H. Drought stress in wheat during flowering and grain-filling periods. Crit. Rev. Plant Sci. 2014, 33, 331–349. [Google Scholar] [CrossRef]
  41. Hendriks, P.-W.; Kirkegaard, J.; Lilley, J.M.; Gregory, P.; Rebetzke, G. A tillering inhibition gene influences root–shoot carbon partitioning and pattern of water use to improve wheat productivity in rainfed environments. J. Exp. Bot. 2016, 67, 327–340. [Google Scholar] [CrossRef]
  42. Zahra, N.; Wahid, A.; Hafeez, M.B.; Ullah, A.; Siddique, K.H.; Farooq, M. Grain development in wheat under combined heat and drought stress: Plant responses and management. Environ. Exp. Bot. 2021, 188, 104517. [Google Scholar] [CrossRef]
  43. Payne, R.; Murray, D.; Harding, S. An Introduction to the GenStat Command Language; VSN International: Hemel Hempstead, UK, 2011. [Google Scholar]
  44. Tadesse, Z.; Habtemariam Zegeye, D.A.; Tafesse Solomon, Y.S.; Debele, T. Identification of Stable Bread Wheat (Triticum Aestivum L.) Genotypes using AMMI Analysis in Ethiopia. Int. J. Res. Agric. For. 2018, 5, 6–14. [Google Scholar]
  45. Yan, W.; Kang, M.S.; Ma, B.; Woods, S.; Cornelius, P.L. GGE biplot vs. AMMI analysis of genotype-by-environment data. Crop Sci. 2007, 47, 643–653. [Google Scholar] [CrossRef]
  46. Duma, S.W.; Shimelis, H.; Ramburan, S.; Shayanowako, A.I. Genotype-by-region interactions of released sugarcane varieties for cane yield in the South African sugar industry. J. Crop Improv. 2019, 33, 478–504. [Google Scholar] [CrossRef]
  47. Anwaar, H.A.; Perveen, R.; Mansha, M.Z.; Abid, M.; Sarwar, Z.M.; Aatif, H.M.; ud din Umar, U.; Sajid, M.; Aslam, H.M.U.; Alam, M.M. Assessment of grain yield indices in response to drought stress in wheat (Triticum aestivum L.). Saudi J. Biol. Sci. 2020, 27, 1818–1823. [Google Scholar] [CrossRef] [PubMed]
  48. Akcura, M.; Partigoç, F.; Kaya, Y. Evaluating of drought stress tolerance based on selection indices in Turkish bread wheat landraces. J. Anim. Plant Sci. 2011, 21, 700–709. [Google Scholar]
  49. Mäder, P.; Hahn, D.; Dubois, D.; Gunst, L.; Alföldi, T.; Bergmann, H.; Oehme, M.; Amadò, R.; Schneider, H.; Graf, U. Wheat quality in organic and conventional farming: Results of a 21 year field experiment. J. Sci. Food Agric. 2007, 87, 1826–1835. [Google Scholar] [CrossRef]
  50. Balouchi, H. Screening wheat parents of mapping population for heat and drought tolerance, detection of wheat genetic variation. Int. J. Nucl. Quantum Eng. 2010, 4, 63–73. [Google Scholar]
  51. Sallam, A.; Mourad, A.M.; Hussain, W.; Stephen Baenziger, P. Genetic variation in drought tolerance at seedling stage and grain yield in low rainfall environments in wheat (Triticum aestivum L.). Euphytica 2018, 214, 169. [Google Scholar] [CrossRef]
  52. Mwadzingeni, L.; Shimelis, H.; Tesfay, S.; Tsilo, T.J. Screening of bread wheat genotypes for drought tolerance using phenotypic and proline analyses. Front. Plant Sci. 2016, 7, 1276. [Google Scholar] [CrossRef] [Green Version]
  53. Barraclough, P.B.; Howarth, J.R.; Jones, J.; Lopez-Bellido, R.; Parmar, S.; Shepherd, C.E.; Hawkesford, M.J. Nitrogen efficiency of wheat: Genotypic and environmental variation and prospects for improvement. Eur. J. Agron. 2010, 33, 1–11. [Google Scholar] [CrossRef]
  54. Wang, R.; An, D.; Hu, C.; Li, L.; Zhang, Y.; Jia, Y.; Tong, Y. Relationship between nitrogen uptake and use efficiency of winter wheat grown in the North China Plain. Crop Pasture Sci. 2011, 62, 504–514. [Google Scholar] [CrossRef]
  55. Hawkesford, M.J. Genetic variation in traits for nitrogen use efficiency in wheat. J. Exp. Bot. 2017, 68, 2627–2632. [Google Scholar] [CrossRef] [PubMed]
  56. Sinha, S.K.; Kumar, A.; Tyagi, A.; Venkatesh, K.; Paul, D.; Singh, N.K.; Mandal, P.K. Root architecture traits variation and nitrate-influx responses in diverse wheat genotypes under different external nitrogen concentrations. Plant Physiol. Biochem. 2020, 148, 246–259. [Google Scholar] [CrossRef] [PubMed]
  57. Nehe, A.; Misra, S.; Murchie, E.; Chinnathambi, K.; Tyagi, B.S.; Foulkes, M. Nitrogen partitioning and remobilization in relation to leaf senescence, grain yield and protein concentration in Indian wheat cultivars. Field Crops Res. 2020, 251, 107778. [Google Scholar] [CrossRef] [PubMed]
  58. Ma, C.; Xie, P.; Zhang, K.; Yang, J.; Li, X.; Liu, F.; Lin, L.; Zhang, H. Contribution of the flag leaf to lead absorption in wheat grain at the grain-filling stage. Ecotoxicol. Environ. Saf. 2021, 225, 112722. [Google Scholar] [CrossRef] [PubMed]
  59. Mirosavljević, M.; Momčilović, V.; Mikić, S.; Trkulja, D.; Brbaklić, L.; Zorić, M.; Abičić, I. Changes in stay-green and nitrogen use efficiency traits in historical set of winter barley cultivars. Field Crops Res. 2020, 249, 107740. [Google Scholar] [CrossRef]
  60. Anderegg, J.; Aasen, H.; Perich, G.; Roth, L.; Walter, A.; Hund, A. Temporal trends in canopy temperature and greenness are potential indicators of late-season drought avoidance and functional stay-green in wheat. Field Crops Res. 2021, 274, 108311. [Google Scholar] [CrossRef]
  61. Bagrei, B.; Bybordi, A. Yield and yield components in bread wheat (Triticum aestivum L.) under non-stress and drought stress conditions. Int. J. Biosci. 2015, 6, 338–348. [Google Scholar]
  62. Foulkes, M.; Sylvester-Bradley, R.; Weightman, R.; Snape, J. Identifying physiological traits associated with improved drought resistance in winter wheat. Field Crops Res. 2007, 103, 11–24. [Google Scholar] [CrossRef]
  63. Ullah, H.; Santiago-Arenas, R.; Ferdous, Z.; Attia, A.; Datta, A. Improving water use efficiency, nitrogen use efficiency, and radiation use efficiency in field crops under drought stress: A review. Adv. Agron. 2019, 156, 109–157. [Google Scholar]
  64. Mojaddam, M. Effect of drought stress on physiological characteristics and seed yield of sunflower at different levels of nitrogen. Electron. J. Crop Prod. 2017, 9, 121–136. [Google Scholar]
  65. Basal, O.; Szabó, A. The combined effect of drought stress and nitrogen fertilization on soybean. Agronomy 2020, 10, 384. [Google Scholar] [CrossRef] [Green Version]
  66. Sedri, M.H.; Amini, A.; Golchin, A. Evaluation of nitrogen effects on yield and drought tolerance of rainfed wheat using drought stress indices. J. Crop Sci. Biotechnol. 2019, 22, 235–242. [Google Scholar] [CrossRef]
  67. Feiziasl, V.; Fotovat, A.; Astarae, A.; Lakzian, A.; Mousavi, S. Effect of optimized nitrogen application in reducing drought stress effect on grain yield of some rainfed bread wheat genotypes. Seed Plant Prod. J. 2014, 30–32, 169–198. [Google Scholar]
  68. Alvar-Beltrán, J.; Dao, A.; Dalla Marta, A.; Saturnin, C.; Casini, P.; Sanou, J.; Orlandini, S. Effect of drought, nitrogen fertilization, temperature and photoperiodicity on quinoa plant growth and development in the Sahel. Agronomy 2019, 9, 607. [Google Scholar] [CrossRef] [Green Version]
  69. Dodig, D.; Zorić, M.; Kandić, V.; Perović, D.; Šurlan-Momirović, G. Comparison of responses to drought stress of 100 wheat accessions and landraces to identify opportunities for improving wheat drought resistance. Plant Breed. 2012, 131, 369–379. [Google Scholar] [CrossRef]
  70. Sareen, S.; Tyagi, B.S.; Sarial, A.K.; Tiwari, V.; Sharma, I. Trait analysis, diversity, and genotype x environment interaction in some wheat landraces evaluated under drought and heat stress conditions. Chil. J. Agric. Res. 2014, 74, 135–142. [Google Scholar] [CrossRef] [Green Version]
  71. Blum, A. Plant Breeding for Water-Limited Environments; Springer Science & Business Media: Berlin/Heidelberg, Germany, 2010. [Google Scholar]
  72. Khakwani, A.A.; Dennett, M.; Munir, M.; Abid, M. Growth and yield response of wheat varieties to water stress at booting and anthesis stages of development. Pak. J. Bot. 2012, 44, 879–886. [Google Scholar]
  73. Liu, Y.; Zhang, J.; Hu, Y.-G.; Chen, J. Dwarfing genes Rht4 and Rht-B1b affect plant height and key agronomic traits in common wheat under two water regimes. Field Crops Res. 2017, 204, 242–248. [Google Scholar] [CrossRef] [Green Version]
  74. Mursalova, J.; Akparov, Z.; Ojaghi, J.; Eldarov, M.; Belen, S.; Gummadov, N.; Morgounov, A. Evaluation of drought tolerance of winter bread wheat genotypes underdrip irrigation and rain-fed conditions. Turk. J. Agric. For. 2015, 39, 817–824. [Google Scholar] [CrossRef]
  75. Ballesta, P.; Mora, F.; Del Pozo, A. Association mapping of drought tolerance indices in wheat: QTL-rich regions on chromosome 4A. Sci. Agric. 2020, 77, e20180153. [Google Scholar] [CrossRef] [Green Version]
  76. Paul, K.; Pauk, J.; Deák, Z.; Sass, L.; Vass, I. Contrasting response of biomass and grain yield to severe drought in Cappelle Desprez and Plainsman V wheat cultivars. PeerJ 2016, 4, e1708. [Google Scholar] [CrossRef] [PubMed]
  77. Pennacchi, J.P.; Carmo-Silva, E.; Andralojc, P.J.; Feuerhelm, D.; Powers, S.J.; Parry, M.A. Dissecting wheat grain yield drivers in a mapping population in the UK. Agronomy 2018, 8, 94. [Google Scholar] [CrossRef] [Green Version]
  78. Thompson, J.P.; Clewett, T.G. Impacts of root-lesion nematode (Pratylenchus thornei) on plant nutrition, biomass, grain yield and yield components of susceptible/intolerant wheat cultivars determined by nematicide applications. Agronomy 2021, 11, 296. [Google Scholar] [CrossRef]
  79. Leilah, A.; Al-Khateeb, S. Statistical analysis of wheat yield under drought conditions. J. Arid. Environ. 2005, 61, 483–496. [Google Scholar] [CrossRef]
  80. Khodadadi, M.; Fotokian, M.H.; Miransari, M. Genetic diversity of wheat (Triticum aestivum L.) genotypes based on cluster and principal component analyses for breeding strategies. Aust. J. Crop Sci. 2011, 5, 17–24. [Google Scholar]
  81. Beheshtizadeh, H.; Rezaie, A.; Rezaie, A.; Ghandi, A. Principal component analysis and determination of the selection criteria in bread wheat (Triticum aestivum L.) genotypes. Int. J. Agric. Crop Sci. 2013, 5, 2024. [Google Scholar]
  82. Marcińska, I.; Czyczyło-Mysza, I.; Skrzypek, E.; Filek, M.; Grzesiak, S.; Grzesiak, M.T.; Janowiak, F.; Hura, T.; Dziurka, M.; Dziurka, K. Impact of osmotic stress on physiological and biochemical characteristics in drought-susceptible and drought-resistant wheat genotypes. Acta Physiol. Plant. 2013, 35, 451–461. [Google Scholar] [CrossRef] [Green Version]
Figure 1. Principal component biplot showing genotypic grouping under drought-stressed conditions and at three nitrogen levels ((A), 50 kg ha−1; (B), 100 kg ha−1 and (C), 200 kg ha−1). SE, number of seedlings emerged; DTH, days to 50% heading; DTM, days to maturity; PH, plant height (cm); TN, number of productive tillers; SL, spike length (cm); SPS, number of spikelets per spike; KPS, number of kennels per spike; TSW, thousand seed weight (g/1000 seed); GY, gain yield (g/m2); BM, biomass (g/m2); HI, harvest index. See codes of genotypes in Table 1.
Agronomy 12 01384 g001aAgronomy 12 01384 g001b
Figure 2. Principal component biplot showing genotypic grouping under non-stressed conditions and at three nitrogen levels ((A), 50 kg ha−1; (B), 100 kg ha−1 and (C), 200 kg ha−1). SE, number of seedlings emerged; DTH, days to 50% heading; DTM, days to maturity; PH, plant height (cm); TN, number of productive tillers; SL, spike length (cm); SPS, number of spikelets per spike; KPS, number of kennels per spike; TSW, thousand seed weight (g/1000 seed); GY, gain yield (g/m2); BM, biomass (g/m2); HI, harvest index. See codes of genotypes in Table 1.
Agronomy 12 01384 g002aAgronomy 12 01384 g002b
Table 1. List of wheat genotypes used in the study.
Entry
Code
Pedigree/Name
Genotypes from CIMMYT’s Drought and Heat Nurseries
SBO01ACHTAR*3//KANZ/KS85-8-5/4/MILAN/KAUZ//PRINIA/3/BAV92/5/MILAN/KAUZ//PRINIA/3/BAV92
SBO02MILAN/KAUZ//PRINIA/3/BAV92/5/TRAP#1/BOW//VEE#5/SARA/3/ZHE JIANG 4/4/DUCULA
SBO03FRET2*2/4/SNI/TRAP#1/3/KAUZ*2/TRAP//KAUZ/5/ONIX
SBO04ONIX/4/MILAN/KAUZ//PRINIA/3/BAV92
SBO05BAU/KAUZ//PASTOR
SBO06CNO79//PF70354/MUS/3/PASTOR/4/BAV92/5/FRET2/KUKUNA//FRET2/6/MILAN/KAUZ//PRINIA/3/BAV92
SBO07CMSA04M00297S-040ZTP0Y-040ZTM-040SY-23ZTM-03Y-0B
SBO08SOKOLL*2/TROST
SBO09BUC/MN72253//PASTOR
SBO10MILAN/KAUZ//PRINIA/3/BABAX
SBO11SW89-5124*2/FASAN/3/ALTAR 84/AESQ//2*OPATA
SBO12SOKOLL/ROLF07
SBO13ROLF07/3/T.DICOCCON PI94625/AE.SQUARROSA (372)//3*PASTOR
SBO14HD30/5/CNDO/R143//ENTE/MEXI75/3/AE.SQ/4/2*OCI
SBO15RL6043/4*NAC//PASTOR/3/BAV92/4/ATTILA/BAV92//PASTOR
SBO16CROC_1/AE.SQUARROSA (205)//KAUZ/3/SLVS
SBO17CROC_1/AE.SQUARROSA (224)//2*OPATA/3/2*RAC655
SBO18GOUBARA-1/2*SOKOLL
SBO19SW89.5277/BORL95//SKAUZ
SBO20PBW343
SBO21PRL/2*PASTOR
SBO22MUNAL #1
SBO23QUAIU
SBO24WBLL1*2/BRAMBLING
SBO25WHEAR//2*PRL/2*PASTOR
SBO26FRET2/KUKUNA//FRET2/3/YANAC/4/FRET2/KIRITATI
SBO27YUNMAI 48//2*WBLL1*2/KURUKU
SBO28ATTILA/3*BCN//BAV92/3/TILHI/4/SHA7/VEE#5//ARIV92
SBO29PRL/2*PASTOR*2//SKAUZ/BAV92
SBO30C80.1/3*BATAVIA//2*WBLL1/3/ATTILA/3*BCN*2//BAV92/4/WBLL1*2/KURUKU
SBO31ATTILA*2/HUITES//FINSI/3/ATTILA*2/PBW65
SBO32ATTILA*2//CHIL/BUC*2/3/KUKUNA
SBO33D67.2/P66.270//AE.SQUARROSA (320)/3/CUNNINGHAM
SBO34CNDO/R143//ENTE/MEXI_2/3/AEGILOPS SQUARROSA (TAUS)/4/WEAVER/5/2*FRAME
SBO35WBLL1//UP2338*2/VIVITSI
SBO36WBLL1*2/4/SNI/TRAP#1/3/KAUZ*2/TRAP//KAUZ/5/KACHU
SBO37HUW234+LR34/PRINIA*2//YANAC
SBO38SAUAL/3/MILAN/S87230//BAV92
SBO39WBLL1*2/VIVITSI/6/CNDO/R143//ENTE/MEXI_2/3/AEGILOPS SQUARROSA
SBO40(TAUS)/4/WEAVER/5/2*JANZ
SBO41BABAX/3/PRL/SARA//TSI/VEE#5/4/CROC_1/AE.SQUARROSA (224)//2*OPATA
SBO42SW94.60002/4/KAUZ*2//DOVE/BUC/3/KAUZ/5/SW91-12331
SBO43FRET2/KUKUNA//FRET2/3/PASTOR//HXL7573/2*BAU/5/FRET2*2/4/SNI/TRAP#1/3/KAUZ*2/TRAP//KAUZ
SBO44ROLF07/TUKURU/5/WBLL1*2/4/YACO/PBW65/3/KAUZ*2/TRAP//KAUZ
SBO45ROLF07/YANAC//TACUPETO F2001/BRAMBLING
SBO46FRET2/KUKUNA//FRET2/3/PARUS/5/FRET2*2/4/SNI/TRAP#1/3/KAUZ*2/TRAP//KAUZ
Leading commercial spring wheat cultivars as per the recommendation of the NWCET
Check#1Local with PBR
Check#2Local with PBR
Check#3Local with PBR
Check#4Local with PBR
CIMMYT, International Maize and Wheat Improvement Center; PBR, Plant Breeder’s Right; NWCET, National Wheat Cultivar Evaluation Trials.
Table 2. Soil properties and mean temperatures for two study sites.
Soil PropertiesGreenhouse SoilField Soil
Bulk density0.731.21
pH (KCL)5.114.67
Nitrogen (%)0.450.21
Phosphorus (mg/L)125.0038.00
Potassium (mg/L)275.00239.00
Magnesium (mg/L)400.00301.00
Calcium (mg/L)1874.001378.00
Organic carbon (%)5.433.21
Clay (%)17.0029.00
Mean temperature (°C)26.8921.54
KCL, Potassium chloride.
Table 3. Monthly weather data during the field study at the Ukulinga Research Station of the University of KwaZulu-Natal during the 2019 growing season.
MonthTmax (°C)Tmin (°C)RHmax (%)Rhmin (%)Rs (MJ/m2)ET0 (mm)
March28.0318.7099.7763.7418.63111.75
April27.4017.9189.3052.0119.09126.11
May26.4717.0995.8159.1218.35119.44
June26.0816.7397.1850.6517.30102.80
July26.6615.5187.1144.6816.5493.19
August28.3017.9890.3661.7619.62120.77
Tmax, average maximum temperature; Tmin, average minimum temperature; Rhmax, average maximum relative humidity; Rhmin, average minimum relative humidity; Rs, average total radiation; ET0, average total relative evapotranspiration.
Table 4. Mean squares and significant tests after combined analysis of variance for 12 phenotypic traits of 50 wheat genotypes evaluated in two sites under drought stress (DS) and non-stressed (NS) conditions, three nitrogen treatments, and two replications.
Source of VariationDFTraits
SEDTHDTMPHTNSLSPSKPSTSWGYBMHI
Incomplete block10.5494.23101.049.10269.547.545.8968.114.6389.78124.530.04
Replication (Rep)10.097.3612.811.47*1127.140.04 *16.494.42 *15.66248.5210,870.300.07
Genotype (Gen)4911.53 ***35.44 ***79.58 ***214.41 ***50.91 ***10.67 ***7.12 ***73.81 ***4.85 ***155.82 ***716.10 ***0.02 **
Environment (Env)10.03 *187.231708.85 **2144.74 **333.911.27 **7.64 *947.436.01 **96,250.49 **278,121.20 **1.34
Water Regime (WR)10.13104.43371.85 **1650.48 **2643.309.56 **9.85 *155.51 *1.4111,688.27 **31,382.60 **0.32 **
Nitrogen rate (NT)219.571255.76 **562.12 **642.29 ***4503.29 **46.49 ***30.09 **123.1428.78 *3615.80 **76,065.60 ***0.47 **
Gen*Env490.03 **34.59 **48.94 **64.30 **35.39 **9.39 *3.78 **32.75 **1.75 *142.13 **789.40 **0.09 **
Gen*WR491.28 **3.7241.66 *53.01 **35.018.68 *3.41 *51.965.08 **60.10 **451.70 **0.08 *
Gen*NT981.88 **31.01 **30.03 **39.55 **29.63 *5.41 **3.7243.29 *2.70 **70.65 **341.10 **0.01 **
Gen*Env*WR490.036.08 **35.5732.2234.77 **8.852.7736.81 **1.4445.40 **408.80 *0.01
Gen*Env*NT980.0318.26 **24.91 **37.75 **29.664.99*3.73 ***34.07 **4.5664.76 **375.20 **0.02 **
Gen*WR*NT981.39 **7.76 **25.68 **39.50 **27.70 **5.22**4.03 *36.80 **3.07 **65.38 **414.40 **0.02 **
Gen*Env*WR*NT980.035.68 **27.62 **32.22 **37.70 **5.433.30 **44.80 **4.35 **63.11 **433.00 **0.12 **
Residual6790.707.7033.0843.4835.106.293.3848.063.9470.92447.200.01
DF, degrees of freedom; SE, number of seedlings emerged; DTH, days to 50% heading; DTM, days to maturity; PH, plant height (cm); TN, number of productive tillers; SL, spike length (cm); SPS, number of spikelets per spike; KPS, number of kennels per spike; TSW, thousand seed weight (g/1000 seed); GY, gain yield (g/m2); BM, biomass (g/m2); HI, harvest index; *, ** and *** denote significant at p < 0.05; p < 0.01 and p < 0.001 probability levels, respectively.
Table 5. Mean values for 12 agronomic traits of the top 10 and bottom 5 yielding genotypes selected after evaluation of 50 wheat genotypes under drought stress (DS) and non-stressed (NS) conditions and three nitrogen levels using two replications.
GenotypeSE DTH
NSDS NS DS
LIRLIRMeanLIRLIRMean
Top ten genotypes
SBO 198.177.007.007.508.007.677.5661.5063.0060.5059.0061.0060.5060.92
SBO 167.338.008.008.006.507.007.4763.3061.5059.0059.0062.0059.0060.63
SBO 227.837.507.506.508.508.007.6461.3358.5065.5061.0060.0065.5061.97
SBO 047.837.507.506.007.507.337.2862.8358.5063.5061.5060.5063.5061.72
SBO 337.178.008.007.507.507.337.5862.5064.0064.5056.0058.5064.5061.67
SBO 247.178.508.006.006.507.147.2260.3359.5066.0059.0061.5066.0062.06
SBO 187.007.506.508.507.007.837.3963.8363.5066.5058.0062.5066.5063.47
SBO 037.506.508.006.507.507.337.2263.0063.5063.5058.0062.5063.5062.33
SBO 267.166.508.507.507.007.007.2860.8360.0063.0058.0063.5063.0061.39
SBO 276.338.008.007.506.507.337.2861.6664.0063.5057.0063.5063.5062.19
Bottom five genotypes
Check#110.007.508.009.679.508.508.8657.5061.5065.5050.6650.0062.0060.36
Check#47.678.007.507.678.007.507.7261.1761.0064.8153.6061.5064.5062.30
Check#29.506.507.509.179.507.508.2859.6662.5064.5052.0058.5063.5061.01
SBO 467.179.008.006.678.006.507.5662.8363.5066.0054.5058.5063.0062.72
Check#39.677.508.509.167.507.008.2258.5063.5066.5051.8054.0063.5060.42
Mean7.517.417.207.327.507.317.3861.5763.6564.1555.8862.0763.2856.98
SED0.880.740.840.730.740.640.763.144.213.862.452.743.503.32
LSD (5%)1.732.011.841.831.941.361.796.185.456.624.824.054.125.21
C.V (%)11.7012.6311.1212.3813.1612.5012.255.104.255.454.014.675.524.83
Genotype DTM PH
NS DS NS DS
LIRLIRMeanLIRLIRMean
Top ten genotypes
SBO 1996.0093.0094.0089.5092.5094.5093.2580.4183.2386.6082.8675.5086.2282.47
SBO 1694.5094.5095.0093.5097.5095.5093.2582.8181.5378.8878.3387.8581.8581.88
SBO 2293.33105.00115.5091.0091.5095.5091.4780.1184.2585.8083.4579.4282.4782.58
SBO 0490.5094.5098.0095.6691.50100.5091.9486.6780.6878.8078.9486.8283.7782.61
SBO 3395.3390.50105.5093.1791.0095.0091.9284.6881.0887.1883.2784.1284.9584.21
SBO 2493.33100.0097.0096.1798.0091.5094.3382.5486.2276.6673.9081.5082.7580.60
SBO 1893.8389.50130.0091.1799.5093.0093.0083.5680.1585.6581.8379.4285.3382.66
SBO 0394.00100.5093.0094.3394.50110.0092.5684.6982.5782.0580.3682.2776.5781.42
SBO 2697.6695.00120.5095.33105.50100.5094.7584.2583.4086.8081.8982.1580.3583.14
SBO 2796.8391.0092.5094.3387.0093.0092.4479.6083.4080.1781.6376.6085.7281.19
Bottom five genotypes
Check#190.4991.2592.5285.3392.5594.4591.2267.0575.4575.2269.1376.2376.6676.42
Check#493.4996.5097.2090.6792.5086.4193.3083.5876.2881.8576.1481.5385.6580.84
Check#292.6692.0094.0091.8391.5094.0592.3472.9879.6782.4770.0284.2585.0579.07
SBO 4693.5095.5093.0892.0094.5097.1594.6279.2579.5083.7775.3280.6886.8080.89
Check#394.0093.5094.5087.8391.0095.3492.2077.7282.7584.9572.6281.0886.1780.88
Mean94.1497.53118.2592.0396.1799.5693.4081.5381.0986.7579.1881.2484.3381.85
SED5.855.254.445.815.555.805.456.585.156.046.876.305.566.08
LSD (5%)11.5012.4111.0011.4311.4511.6011.5712.9612.7811.4713.5212.5612.7012.67
C.V (%)6.215.456.526.245.626.336.068.107.957.888.677.198.127.99
GenotypeTN SL
NSDS NS DS
LIRLIRMeanLIRLIRMean
Top ten genotypes
SBO 1918.8320.0024.5018.6616.7520.0019.798.548.008.509.068.238.768.52
SBO 1621.6628.0025.2516.8316.2520.7521.468.788.068.569.148.319.128.66
SBO 2219.1719.0027.7517.9920.0020.2520.698.598.758.889.178.218.328.65
SBO 0422.0823.7524.7515.8321.2522.7521.748.498.538.228.578.789.568.69
SBO 3322.9924.2526.0019.6621.2519.7522.328.388.638.818.769.209.198.83
SBO 2419.7521.0023.5017.2423.7522.5021.298.418.148.228.668.669.758.64
SBO 1821.4928.0039.7519.9119.7523.2525.368.468.478.558.769.069.138.74
SBO 0322.2424.7521.7517.2517.7522.7521.088.417.728.288.648.729.478.54
SBO 2621.7525.7528.7517.4116.5025.5022.618.548.239.099.259.2512.729.51
SBO 2721.0022.7527.5016.2520.5020.5021.428.768.538.438.798.259.098.64
Bottom five genotypes
Check#120.1722.8521.2523.4120.0024.5022.037.248.559.757.218.759.348.47
Check#420.1620.7521.2519.1622.7522.2521.058.118.109.138.589.7812.009.28
Check#213.0024.2523.7519.7519.8923.7520.737.998.259.478.819.099.188.80
SBO 4620.9122.7519.7520.4123.0024.5021.898.638.3312.7210.4111.0111.2510.39
Check#320.7522.7517.7521.5020.0024.5021.218.358.989.099.049.479.389.05
Mean21.3323.1530.2518.3621.6822.2022.838.628.949.198.807.759.628.82
SED6.766.025.895.464.615.665.733.253.803.751.512.051.452.64
LSD (5%)13.3014.5213.1010.7411.4511.0912.376.405.556.322.971.842.564.27
C.V (%)31.7029.0030.5629.7130.3529.3430.1137.7034.0237.1517.1716.4617.7526.71
GenotypeSPS KPS
NSDS NS DS
LIRLIRMeanLIRLIRMean
Top ten genotypes
SBO 1915.9015.3816.2516.7115.5416.8916.1128.7532.8133.6237.2337.6229.0633.18
SBO 1616.9816.0016.7516.3915.9216.8116.4835.7332.5033.5634.4235.9433.8134.33
SBO 2216.4216.5617.2516.6816.1215.8116.4732.4033.3133.7533.3533.8734.6333.55
SBO 0416.4616.3716.3815.5516.8115.9416.2534.1734.6329.3131.7337.4442.3134.93
SBO 3315.6716.0017.3816.3517.2316.1216.4632.5233.0034.5634.3034.8037.1334.39
SBO 2415.8515.9416.0017.0416.9416.7516.4231.5032.5625.4435.4239.2537.3133.58
SBO 1816.9017.5015.6216.3516.5615.6216.4332.0632.0632.3131.9831.6239.3733.23
SBO 0315.8315.3815.8816.0217.5617.5016.3633.3729.4433.0132.5430.0832.1931.77
SBO 2615.7315.4416.1916.7016.3116.4416.1432.5031.3134.5035.4031.4438.0033.86
SBO 2715.1115.1918.5016.0715.6716.0016.0930.8333.4433.9433.1927.8134.5032.29
Bottom five genotypes
Check#114.6216.0014.7512.7015.1216.9415.0226.3536.6934.5626.5838.6239.3133.69
Check#416.6517.7515.0014.8516.2418.1216.4430.2733.4525.4428.6135.4439.3732.10
Check#214.1618.2516.5015.5118.2319.7517.0729.4134.5632.3129.0635.8736.1932.90
SBO 4615.5519.0013.5515.7117.9419.6216.9031.4533.0633.0126.5837.0438.0033.19
Check#315.3717.0012.7516.5518.5619.5016.6233.7835.4434.5032.3334.9837.5034.76
Mean15.8616.5013.4516.0415.8916.5115.7131.9532.2530.0532.6735.5536.0033.08
SED1.951.431.651.751.491.251.596.126.385.797.737.806.586.73
LSD (5%)3.843.613.563.453.253.153.4812.0412.4811.8415.2114.9515.7413.71
C.V (%)12.2911.5612.4510.9111.4710.9311.6019.1418.7419.6523.6421.3622.3620.82
Genotype TSW GY
NS DS NS DS
LIRLIRMeanLIRLIRMean
Top ten genotypes
SBO 1937.8954.1654.1047.7743.6752.9743.93134.40234.75339.25132.32233.25336.75234.20
SBO 1639.0044.2553.6144.8549.9053.5044.85134.91231.00337.50127.99235.33313.25232.07
SBO 2243.9743.9944.0533.7753.0053.6443.74136.82234.25337.25129.57226.50325.41232.82
SBO 0435.8244.2653.2846.4451.5152.6246.66132.74237.50337.00127.49234.32305.56233.10
SBO 3333.8654.1353.8345.7848.5551.5245.78130.07231.50343.75128.33235.50325.25232.65
SBO 2444.1844.0063.4733.5933.3143.6043.69133.82236.25340.25126.82224.50335.00232.77
SBO 1838.2254.6744.5339.4438.3647.3042.92128.49232.75340.00126.66226.25331.00230.86
SBO 0334.1245.6253.1234.4443.9250.2543.91137.32231.75338.50125.66226.25310.75231.71
SBO 2643.8844.2754.0533.6754.4563.5944.82133.16234.75339.00125.49225.75331.75231.65
SBO 2744.0153.8454.1233.6943.4253.6543.79130.24232.25337.50125.01232.25330.75230.50
Bottom five genotypes
Check#134.3644.4444.6033.2233.5934.6233.97121.50135.50237.75120.92126.25231.50129.74
Check#432.5644.2844.3933.6134.0043.9234.96123.99132.50234.25120.87125.75230.56127.99
Check#233.2443.4854.4634.2933.9334.0835.91122.99130.25234.00120.39126.45228.75126.97
SBO 4639.7045.7848.1035.3443.5543.3933.98129.65135.75236.50120.12125.32229.12130.24
Check#332.8247.6345.4533.5133.6243.9834.17129.32133.75238.00119.66127.50232.07130.05
Mean33.8744.5243.9535.8138.8439.9936.1631.0533.2534.00124.81226.31231.00228.45
SED0.660.580.642.712.222.121.498.547.458.128.497.548.158.05
LSD (5%)1.301.251.685.344.855.233.2816.8116.0516.5816.7217.2516.5016.65
C.V (%)17.0716.7517.5371.1765.3070.0042.9727.5026.0027.6034.2429.6532.4429.57
Genotype BM HI
NS DS NS DS
LIRLIRMeanLIRLIRMean
Top ten genotypes
SBO 1912731296141611811264138712840.460.500.370.410.460.520.45
SBO 1612821374167012781271135912690.430.410.360.400.470.410.41
SBO 2211831392139911671286129012860.450.470.370.310.390.380.40
SBO 0411821271148712801282139212820.400.660.480.340.480.380.46
SBO 3312791282151712701245138412870.400.500.410.440.350.350.41
SBO 2411881274137611741295129812840.390.500.550.360.400.360.43
SBO 1812731374169511771289138612820.390.460.440.350.480.320.41
SBO 0312951274161212741283139512870.420.450.380.350.360.360.39
SBO 2611851395131712701210128712910.400.520.370.370.450.300.40
SBO 2711761260138412731279137712750.390.510.460.340.410.380.42
Bottom five genotypes
Check#111731174119011661273138211760.370.600.470.340.500.460.46
Check#411711172119512691279128611780.370.550.420.380.510.420.44
Check#211701174118912581164137511720.340.500.550.350.460.560.46
SBO 4611801184119811631364137911780.370.460.450.320.460.430.42
Check#311771176118712641367127311740.370.440.370.320.510.370.40
Mean11811275149512711276128611810.390.480.400.360.450.380.41
SED22.1428.1323.1021.0819.2021.6922.560.100.160.120.120.1840.140.14
LSD (5%)43.5735.4137.2841.4838.5335.2538.590.190.250.170.240.190.330.23
C.V. (%)27.1426.0028.1529.5428.5432.0128.5625.1016.8524.3333.4322.3624.1524.37
SE, number of seedlings emerged; DTH, days to 50% heading; DTM, days to maturity; PH, plant height (cm); TN, number of productive tillers; SL, spike length (cm); SPS, number of spikelets per spike; KPS, number of kennels per spike; TSW, thousand seed weight (g/1000 seed); GY, gain yield (g/m2); BM, biomass (g/m2); HI, harvest index; NS, non-stress; DS, drought stress; L, low nitrogen (50 kg/ha); I, intermediate nitrogen (100 kg/ha); R, South Africa recommended nitrogen level (200 kg/ha); SED, standard error of the mean differences; LSD, least significant difference; C.V., coefficient of variation.
Table 6. Pearson’s correlation coefficients (r) revealing the associations of 12 agronomic traits measured in 50 wheat genotypes evaluated under drought stress (DS) and non-stressed (NS) conditions and three nitrogen levels.
A.
NS, Low N (50 kgha−1)DS, Low N (50 kgha−1)
TraitsSEDTHDTMPHTNSLSPSKPSTSWGYBMHI
SE10.024 *−0.236 *−0.106 *0.032−0.0930.158 *−0.0360.129 **−0.332 *−0.0260.039 *
DTH0.020 *10.336 **0.068 **0.614 **0.825 **0.0220.834 **0.658 **−0.156 *0.289 **0.531 **
DTM−0.128 *0.558 **1−0.188 *0.207 **0.225 **0.153 *0.234 **0.086 **0.758 *0.335 **−0.325 *
PH0.799 **0.0520.004 *1−0.2110.173 **0.279 **0.236 **0.161 **0.634 **0.262 **0.051 *
TN0.105 **0.757 **−0.091 *−0.159 *1−0.0230.341 **−0.450 **0.096 **0.699 **0.689 **0.571 **
SL−0.131 *0.029 **−0.032 *0.958 **0.014 *10.482 **0.425 **0.076 **0.509 **0.188 **−0.106
SPS−0.258 **0.159 **0.664 **0.1040.526 *0.288 **10.630 **0.516 **−0.301 *0.149 *−0.015 *
KPS−0.183 *−0.0190.652 *0.133 *−0.169 *0.207 **0.457 **10.106 **0.442 **0.298 **0.078
TSW−0.136 *0.234 **0.131 **0.173 *−0.452 **0.019 **0.884 **0.331 **10.518 *0.052 **0.027 *
GY−0.1300.732 **0.715 **0.625 **0.547 **−0.207 **0.637 **−0.1560.411 **10.787 **0.328 **
BM0.067 **−0.270 *−0.199 *0.059 *0.488 **0.0910.363 **−0.140 *−0.552 **0.842 **1−0.282 **
HI0.079 *−0.057 *0.123 **0.092 *0.387 **0.0940.052 *0.207 **0.271 **−0.241−0.260 **1
B.
NS, Intermediate N (100 kgha−1)DS, Intermediate N (100 kgha−1)
TraitsSEDTHDTMPHTNSLSPSKPSTSWGYBMHI
SE10.047 *−0.251 *0.273 **0.127 **0.0350.066−0.170 *0.012 *0.085 *−0.014 *0.101 **
DTH−0.121 *10.543 *0.103 *0.619 *0.786 **0.0310.158 *0.049 **0.576 **0.580 **−0.100 *
DTM−0.062 *0.305 **10.006 *0.152 *−0.036 *−0.106 *0.0340.107 **0.093 *0.013 **0.109 *
PH−0.215 **0.035 **−0.015 *10.153 **0.054 **0.120 **0.176 *0.102 **−0.161−0.091 *0.107 **
TN0.191 **−0.208 *−0.0310.150 *10.096 *−0.037 *0.112 **0.046 **0.536 **0.087 **0.151 **
SL0.017−0.246−0.063 *0.069 **0.132 **10.191 **0.049 *0.022 *0.046 *0.148 *−0.102
SPS−0.0500.083−0.082 *0.131 **−0.013 *0.038 **10.498 **0.0790.125 *0.1160.0118 *
KPS0.039 *−0.809 *−0.025 *0.026 **0.2160.077 *0.350 **10.022 **−0.236 *−0.008 *0.188 **
TSW0.099 **0.042 *0.100 **−0.016 *0.017 **0.035−0.105 *0.180 *10.559 **0.213 **0.096
GY0.105 *−0.037 **0.045 *−0.0560.648 **0.028 *0.538 **−0.263 *0.543 **10.749 **0.664 **
BM0.079 **−0.204 *0.347 **0.0850.005 **−0.039 *0.0050.183 **0.487 **0.766 **10.187 **
HI0.045 *−0.1150.069 *0.189 **−0.111 *0.0080.051 **0.222 **0.167 *0.551 **0.082 **1
C.
NS, Recommended N (200 kgha−1)DS, Recommended N (200 kgha−1)
TraitsSEDTHDTMPHTNSLSPSKPSTSWGYBMHI
SE1−0.211 **−0.198 **−0.163 *0.233 **0.016 *−0.145 *−0.069 *0.125 **−0.156 *−0.052 *−0.031 *
DTH−0.211 **10.231 **0.139 *0.0140.072 *0.084 *0.051 **0.028 **0.682 **0.027 *0.094 **
DTM−0.012*0.779 **10.152 *−0.1240.057 **0.136 **0.087 **0.036 **0.891 **0.047 **−0.016 *
PH−0.135*0.716 **0.044 *1−0.199 **−0.366 *0.222 *−0.074 *0.074 **0.0590.077 *0.011 **
TN0.044 **0.687 **−0.040 *0.195 **10.054−0.1160.179 *0.063 **−0.1160.042 **−0.122
SL0.130 **0.074 *0.029 **−0.141 *0.03010.532 **0.489 **0.056 *0.135 **0.138 **0.034
SPS0.086 **0.092 *0.018 *0.055 **0.054 *0.236 **10.532 **0.118 **0.498 **0.100 *0.054 *
KPS0.099 **0.013 *0.085 **0.095 *0.056 *0.256 **0.504 **10.015 **0.150 *0.0310.150 *
TSW−0.110*0.0290.158 *−0.163 *−0.221 **0.104 *0.231 **0.064 *1−0.264 *0.024 **−0.085 *
GY0.618 **−0.247 **0.560 **−0.211 **0.130 *0.548 **0.761 **0.045 *0.706 **10.541 **0.733 **
BM−0.055 *−0.128 *0.094−0.074 *−0.028 *0.147 *0.213 **0.012 **0.493 *0.603 **1−0.129 *
HI0.087 **−0.256 *0.166−0.225 **−0.172 *0.053 **0.181 *0.053 **0.504 *0.673 **−0.026 *1
SE, number of seedlings emerged; DTH, days to 50% heading; DTM, days to maturity; PH, plant height (cm); TN, number of productive tillers; SL, spike length (cm); SPS, number of spikelets per spike; KPS, number of kennels per spike; TSW, thousand seed weight (g/1000 seed); GY, gain yield (g/m2); BM, biomass (g/m2); HI, harvest index; *, p < 0.05; **, p < 0.01 level. Note A, B and C denote low, intermediate and recommended N under drought stress (right diagonals) and non-stressed (left diagonals) conditions, respectively.
Table 7. Rotated component matrix of 12 phenotypic traits of 50 wheat genotypes evaluated in greenhouse and field conditions under drought-stressed (DS) and non-stressed (NS) conditions and three nitrogen treatments.
Parameters Drought-Stressed Non-stressed
50 kg N ha−1100 kg N ha−1200 kg N ha−150 kg N ha−1100 kg N ha−1200 kg N ha−1
PC1PC2PC1PC2PC1PC2PC1PC2PC1PC2PC1PC2
Eigenvalues3.102.103.202.033.131.983.590.882.762.022.492.28
Proportion of total variance (%)35.8917.5141.7016.9646.1516.5739.9815.7138.0216.8347.7719.04
Cumulative variance (%)35.8953.4041.7064.6746.1572.7239.9855.7048.0275.8647.7779.81
SE−0.10−0.120.78−0.170.640.700.95−0.120.39−0.160.540.36
DTH0.61−0.300.64−0.400.79−1.180.51−0.240.920.120.71−0.19
DTM0.45−0.18−0.19−0.130.400.040.66−0.11−0.220.62−0.21−0.03
PH0.60−0.120.68−0.520.680.010.270.310.79−0.20−0.160.58
TN−0.090.59−0.400.69−0.620.87−0.420.850.940.59−0.820.31
SL0.750.31−0.120.850.580.76−0.300.67−0.38−0.290.670.28
SPS0.73−0.150.960.210.91−0.150.67−0.010.700.11−0.10−0.04
KPS0.64−0.350.83−0.19−0.34−0.240.760.52−0.41−0.770.62−0.17
TSW−0.18−0.12−0.170.26−0.54−0.320.56−0.110.88−0.460.410.62
GY−0.22−0.450.670.750.01−0.180.790.42−0.300.43−0.720.71
BM0.690.560.600.59−0.39−0.64−0.290.790.690.210.82−0.32
HI−0.280.71−0.330.78−0.110.06−0.41−0.300.04−0.040.90−0.46
SE, number of seedlings emerged; DTH, days to 50% heading; DTM, days to maturity; PH, plant height (cm); TN, number of productive tillers; SL, spike length (cm); SPS, number of spikelets per spike; KPS, number of kennels per spike; TSW, thousand seed weight (g/1000 seed); GY, gain yield (g/m2); BM, biomass (g/m2); HI, harvest index; PC1, principal component 1; PC2, principal component 2.
Publisher’s Note: MDPI stays neutral with regard to jurisdictional claims in published maps and institutional affiliations.

