Article

Identification and Genetic Mapping of Potential QTLs Conferring Heat Tolerance in Cotton (Gossypium hirsutum L.) by Using Micro Satellite Marker’s Approach

1
Institute of Pure and Applied Biology, Bahauddin Zakariya University, Multan 60800, Pakistan
2
Institute of Molecular Biology & Biotechnology, Bahauddin Zakariya University, Multan 60800, Pakistan
*
Author to whom correspondence should be addressed.
Agronomy 2022, 12(6), 1381; https://doi.org/10.3390/agronomy12061381
Submission received: 8 April 2022 / Revised: 26 May 2022 / Accepted: 26 May 2022 / Published: 8 June 2022

Abstract

:
High-temperature stress can cause serious abiotic damage that limits the yield and quality of cotton plants. Heat Tolerance (HT) during the different developmental stages of cotton can guarantee a high yield under heat stress. HT is a complex trait that is regulated by multiple quantitative trait loci (QTLs). In this study, the F2 population derived from a cross between MNH-886, a heat-tolerant cultivar, and MNH-814, a heat-sensitive variety, was used to map HT QTLs during different morphological stages in cotton. A genetic map covering 4402.7 cm, with 175 marker loci and 26 linkage groups, was constructed by using this F2 population (94 individuals). This population was evaluated for different 23 morpho-physiological HT contributing traits QTL analysis via composite interval mapping detected 17 QTLs: three QTLs each for Total Number of Sympodes (TNS), Length of Bract (LOB), and Length of Staminal-column (LOS); two QTLs for First Sympodial Node Height (FSH), and one QTL each for Sympodial Node Height (SNH), Percent Boll set on second position along Sympodia (PBS), Total Number of Nodes (TNN), Number of Bolls (NOB), Total Number of Buds (TNB), and Length of Petal (LOP). Individually, the QTLs accounted for 7.76%–36.62% of phenotypic variation. QTLs identified linked with heat tolerance traits can facilitate marker-assisted breeding for heat tolerance in cotton.

1. Introduction

Cotton is a miracle of the plant realm as it fulfills most of the vital needs and provides more than 90% of the world’s total production of fiber for the textile industry and edible oil for almost half of the world’s population [1]. It has been observed that more than 50% of cotton around the globe is affected by abiotic stress such as salinity, drought, and heat stress that lead to deficient production of this field crop, especially when affected at the seedling stage [2]. Cotton growth requires sufficient fresh water for better fiber quality, but if it faces drought or heat stress the fiber production is reduced [3]. Many new drought tolerant cultivars of cotton have been introduced with improved plant growth, and even other genetically engineered genotypes of cotton by breeding techniques are being cultivated that can tolerate many abiotic stresses [4]. However, the genetic basics and amendments behind these stresses need to be evaluated more to combat these problems from the genetic roots. Cotton is divided into eight genomes (groups) from A to G and K including 45 diploids and the basic seven tetraploid [5,6]. Evolutionary data based on DNA sequencing suggested that about six to seven million years, ago due to trans-oceanic dispersal, D genome divergence gave rise to the A genome and in America (primarily Mexico), it became a separate lineage [7,8]. An incredible diversification occurred over this time that resulted in the worldwide spread of the Gossypium species. Domestication of wild varieties of cotton by human beings resulted in lot of change in all phenotypic and genotypic characteristics.
In terms of production, Pakistan is at the fourth position among the cotton growers of the world; raw cotton exported from Pakistan holds third position in the world as per records of 2012–2013 [9]. Pakistan is more prone to climate changes due to its geographical location [10]. Heat stress is a combination of different intricate functions of intensity duration of temperature. Because of its geographical position, in Pakistan during the summer in some locations, the temperature reaches up to 50 °C and the scorching heat adversely affects cotton plants. Cotton is cultivated in hot areas in Pakistan [11]. High temperature affects growth and development of the plant as well as fiber quality traits [12,13]. Episodes of periodic heat stress and increase in average temperature for the full season enhances the detrimental effects on almost all the factors of plant growth, and that is the reason there is great reduction in the seed number, fiber quality, and content [14]. Cotton yield is suppressed when the plant faces heat and drought stress due to decreased plant transpiration and reduced biomass accumulation, resulting in an inadequate yield [15]; these stresses adversely affect cell elongation, differentiation, and division and also suppress stomatal conductance [16].
The cotton plant has a wide range of adaptability [17], but high temperature is one of the major constraints in cotton productivity and greatly reduces seed cotton yield and quality, which can be addressed by breeding methods. Marker-assisted selection fastens the breeding technology with an accurate approach towards the desired phenotypic traits among the breeding population [18], and it requires detection and analysis of genetic variations using advanced genetic approaches, leading to phenotypic traits of quantitative and agro-economic importance [19]. Genomic selection (GS) and MAS developed by molecular markers techniques has made it possible to map quantitative trait loci (QTL) and identifying QTLs for high-temperature stress and breeding heat-tolerant varieties is an effective way to address this issue. MAS methodology has been used globally to acquire ordered and swift ways for cotton improvement on large scales internationally, with both highly demanded attributes like high seed production and excellent quality of fiber [20]. For dissection of QTLs related to traits with complex genetic patterns of inheritance, molecular marker use has been an efficient tool and these markers have also facilitated MAS breeding [21].
Both agronomic and economically important traits are approached by researchers for obtaining the aim of better yield of cotton [22]. The main challenging goal for current cotton breeders is to further enhance cotton production. However, this aim is hindered by the use of locally available germplasm and extreme environmental fluctuations that influence yield attributing traits [23,24]. Certain different genes cause different expressions of characters regarding tolerance of heat stress at vegetative and reproductive growth stages [25]. Genes attributing to relative water content, stomatal conductance, especially along with Percent Boll set on the First Position along Sympodia (PBF), Percent Boll set on the second Position along Sympodia (PBS), Cell Injury (CIY), Boll Number (BON), Total number of Buds (TNB), Size of Petiole (SOP), Total number of Flowers (TNF), Length of Bract (LOB), Length of Petal (cm) (LOP), Length of Staminal Column (LOS), Length of Pistil (LPI), and Proline Con. (μg mL−1) (PCO) have been reported as crucial for heat stress determination [26,27]. Therefore, during the selection of heat tolerant varieties, both vegetative and reproductive traits should be considered equally.
Molecular genetic methods, especially molecular markers, have been applied widely in cotton in recent couple of decades. Recently, the development of molecular markers was accelerated with the release of assembled genome sequences of G. hirsutum [28,29]. Numerous genetic linkage maps including the intraspecific map of G. hirsutum have been constructed using restriction fragment length polymorphisms (RFLPs), simple sequence repeats (SSRs), and single nucleotide polymorphisms (SNPs). Thousands of quantitative trait loci (QTLs) for yield and fiber quality in cotton have been documented in Cotton QTLdb, Release 2.3 [30,31]. However, there are few studies about the simultaneous dissection of the genetic basis underlying complex traits and their genetic correlations in multiple upland cotton populations by QTL mapping. In the situation of changing weather and elevating temperature around the globe, it is of the utmost importance to recognize QTLs for morphological, architectural, and physiological traits that are directly or indirectly affected by high heat stress at some stages of cotton plant development. This study was conducted to identify and map quantitative trait loci (QTLs) conferring heat tolerance in an Intraspecific cross and used microsatellite markers to identify polymorphism between two upland cotton cultivars in the scorching heat of Multan (Pakistan) during summer. QTL identified in this project could be helpful for future cotton growers of high-temperature regions in the world.
In this study, F2 populations were used, which were derived from hybridization of two G. hirsutum normal lines (MNH-886 and MNH-814). The corresponding genetic linkage map was constructed using 175 polymorphic SSR markers. QTL mapping was implemented with the integration of the genotypic and phenotypic data of twenty-three agronomic and economic traits contributing towards heat tolerance; the aim of this study was to (a) screen cotton cultivars for heat tolerance, (b) select diverse cultivars as parental lines and then their assessment by SSRs for parental survey, (c) develop the segregating/mapping population (F2) of selected parents and collect phenotypic trait data at different time intervals, (d) survey the F2 population by polymorphic markers obtained from the parental survey, (e) evaluate phenotypic traits with the association of genotypic markers (SSR) data, (f) identify QTLs directing heat tolerance by QTL cartographer software, and (g) construct a genetic linkage map of Gossypium from the obtained information. The outcomes of this study will help plant breeders to produce heat-resistant varieties that will help farmers and countries with agriculture-dependent economies, especially in high-temperature areas around the globe.

2. Materials and Methods

This study was conducted to identify and map QTLs conferring heat tolerance in an Intraspecific cross and used microsatellite markers to identify polymorphism between two upland cotton cultivars in the scorching heat of Multan (Pakistan) during summer. QTL identified in this project could be helpful for future cotton growers of high temperature regions in the world. The research was arranged at Cotton Research Station (CRS) Multan to coincide the reproductive phase with higher temperature. The field work encompassed 14 cultivars sown in Randomized Complete Block Design (RCBD) replicated three times during the year 2012. All fourteen cultivars were tagged randomly altogether to evaluate 23 morphological and physiological parameters contributing to heat tolerance for identifying the genomic regions under plant breeding techniques; F2 generation was observed for screening purposes. The cultivars named as CIM-557, CIM-573, NN-3, Cyto-108, NIAB-852, CIM-588, BH-172, GH-102, NIAB-2008, MNH 886, CIM-554, Shahbaz-12, MNH-2007, and MNH 814 were chosen for screening of heat tolerance based on different agronomic traits related to heat, and their genomic basics were screened out. Different morpho-physiological characters included plant height (PH), fully dehiscent anther (FDA %), Total number of sympods (TNS), Total Number of Nodes (TNN), Pollen Viability (%) (POV), First Sympodial Node Number (FSN), First Sympodial Node Height (cm) (FSH), Sympodial Node Number bearing first effective boll (SNF), Sympodial Node Height (cm) bearing first effective boll (SNH), Sympodial Node Number bearing Last effective boll (SNL), Sympodial Node Height (cm) bearing last effective boll (SNB), Percent Boll set on First Position along Sympodia (PBF), Percent Boll set on second Position along Sympodia (PBS), Cell Injury (CIY), Boll Number (BON), Total number of Buds (TNB), Size of Petiole (SOP), Total number of Flowers (TNF), Length of Bract (LOB), Length of Petal (cm) (LOP), Length of Staminal Column (LOS), Length of Pistil (LPI), and Proline Con. (μg mL−1) (PCO).

2.1. Heat Stress Estimation

Heat stress was measured in plants that were sown late in the month of April and traits were compared to plants sown earlier in May because temperature in the latter was higher than 46–48 °C during the research time period and the heat stress-related 23 morphophysiological traits were observed to be affected by temperature in late-sown irrigated conditions. The heat was estimated by a weather forecast taken from the automated metrological station of cotton research station, Multan, as given in the Table 1:
Heat-susceptible and -resistant varieties (MNH-814 and MNH-886 respectively) were selected on the basis of data for relative water content, osmotic potential, cell injury, and proline concentration. Relative water content was measured by the following [32] formula:
R W C = f r e s h   w e i g h t D r y   w e i g h t T u r g i d   w e i g h t D r y   w e i g h t × 100
Cell Injury (CIY) was measured when the crop was 55–60 days old, and a sufficient number of leaves was taken from the upper portion and stored in a paper bag. By the use of a punching machine, 15–25 discs of 1 cm diameter were cut. With distilled water, leaf discs were washed three times, were put in test tubes, and then the test tubes were filled up to 40 mL with distilled water. Three sets were made each of 14 test tubes containing leaf discs of 14 cultivars. The first set of test tubes was kept at room temperature as control and the electrical conductivity of the water was noted. The second set was heated at 48 °C for 45 min in a water bath. When water was cooled after 6 h, its electrical conductivity was recorded, while the third set of test tubes was autoclaved at 15 lbs (pressure) for 15 min and electrical conductivity was noted when water was cooled.
The greater the EC, greater the damage caused to plant cells due to heat stress as the maximum number of electrolytes came out of the cell due to cell injury. Consequently, cell injury was also greater. Cell injury was expressed in percentage. Proline is an organic compound synthesized from glutamine. It is located in cytoplasm under stressed conditions as nontoxic compatible organic solute to compensate for the dehydrating effects of high osmotic pressure in the vacuole and in the external media. The proline concentration at 700 mol m3 was not inhibitory to enzymes and develops in consequences of poor plant growth under toxic effects. Therefore, its exogenous application should promote tolerance [33]. Different workers stated that upon heat stress, when starch and protein synthesis are inhibited, proline might be used by the plant for growth [34,35]. Proline from different tissues was measured by Spectrophotometry based on the method of ref. [36].

2.2. Parental Lines Screening

Fourteen tetraploid cotton cultivars were chosen, named CIM-557, CIM-573, NN-3, Cyto-108, NIAB-852, CIM-588, BH-172, GH-102, NIAB-2008, MNH 886, CIM-554, Shahbaz-12, MNH-2007, and MNH 814 for altogether 23 morphological and physiological characteristics, viz Total Plant Height (TPH), Fully Dehiscent Anther (%) (FDA), Total Number of Sympodes (TNS), Total Number of Nodes (TNN), Pollen Viability (%) (POV), 1st Sympodial Node number (FSN), 1st Sympodial node Height (cm) (FSH), Sympodial Node number having 1st effective boll (SNF), Sympodial Node Height (cm) having 1st effective boll (SNH), Sympodial Node Number having Last effective boll (SNN), Sympodial Node Height (cm) having last effective boll (SNH), Percent boll set on 1st position with sympodia (PBF), Percent boll set on 2nd position with sympodia (PBS), Cell Injury (CIY), Number of Bolls (NOB), Total number of buds (TNB), Size of Petiole (SOP), Total Number of Flowers (TNF), Length of Bract (LOB), Length of Petal (cm) (LOP), Length of Staminal column (LOS), Length of Pistil (LPI), and Proline Con. (μg mL−1) (PCO), contributing to heat tolerance to identify the genomic regions. Arithmetic means of three replicates were calculated for fourteen cultivars for each characteristic. The data were compared. The variance and standard deviation were also calculated. The computation of trait correlation was carried out using Minitab Inc., University Park, PA, USA and the following shortlisted traits had considerably varying phenotypes among two genotypes, i.e., MNH 886 and MNH 814 (Figure 1).

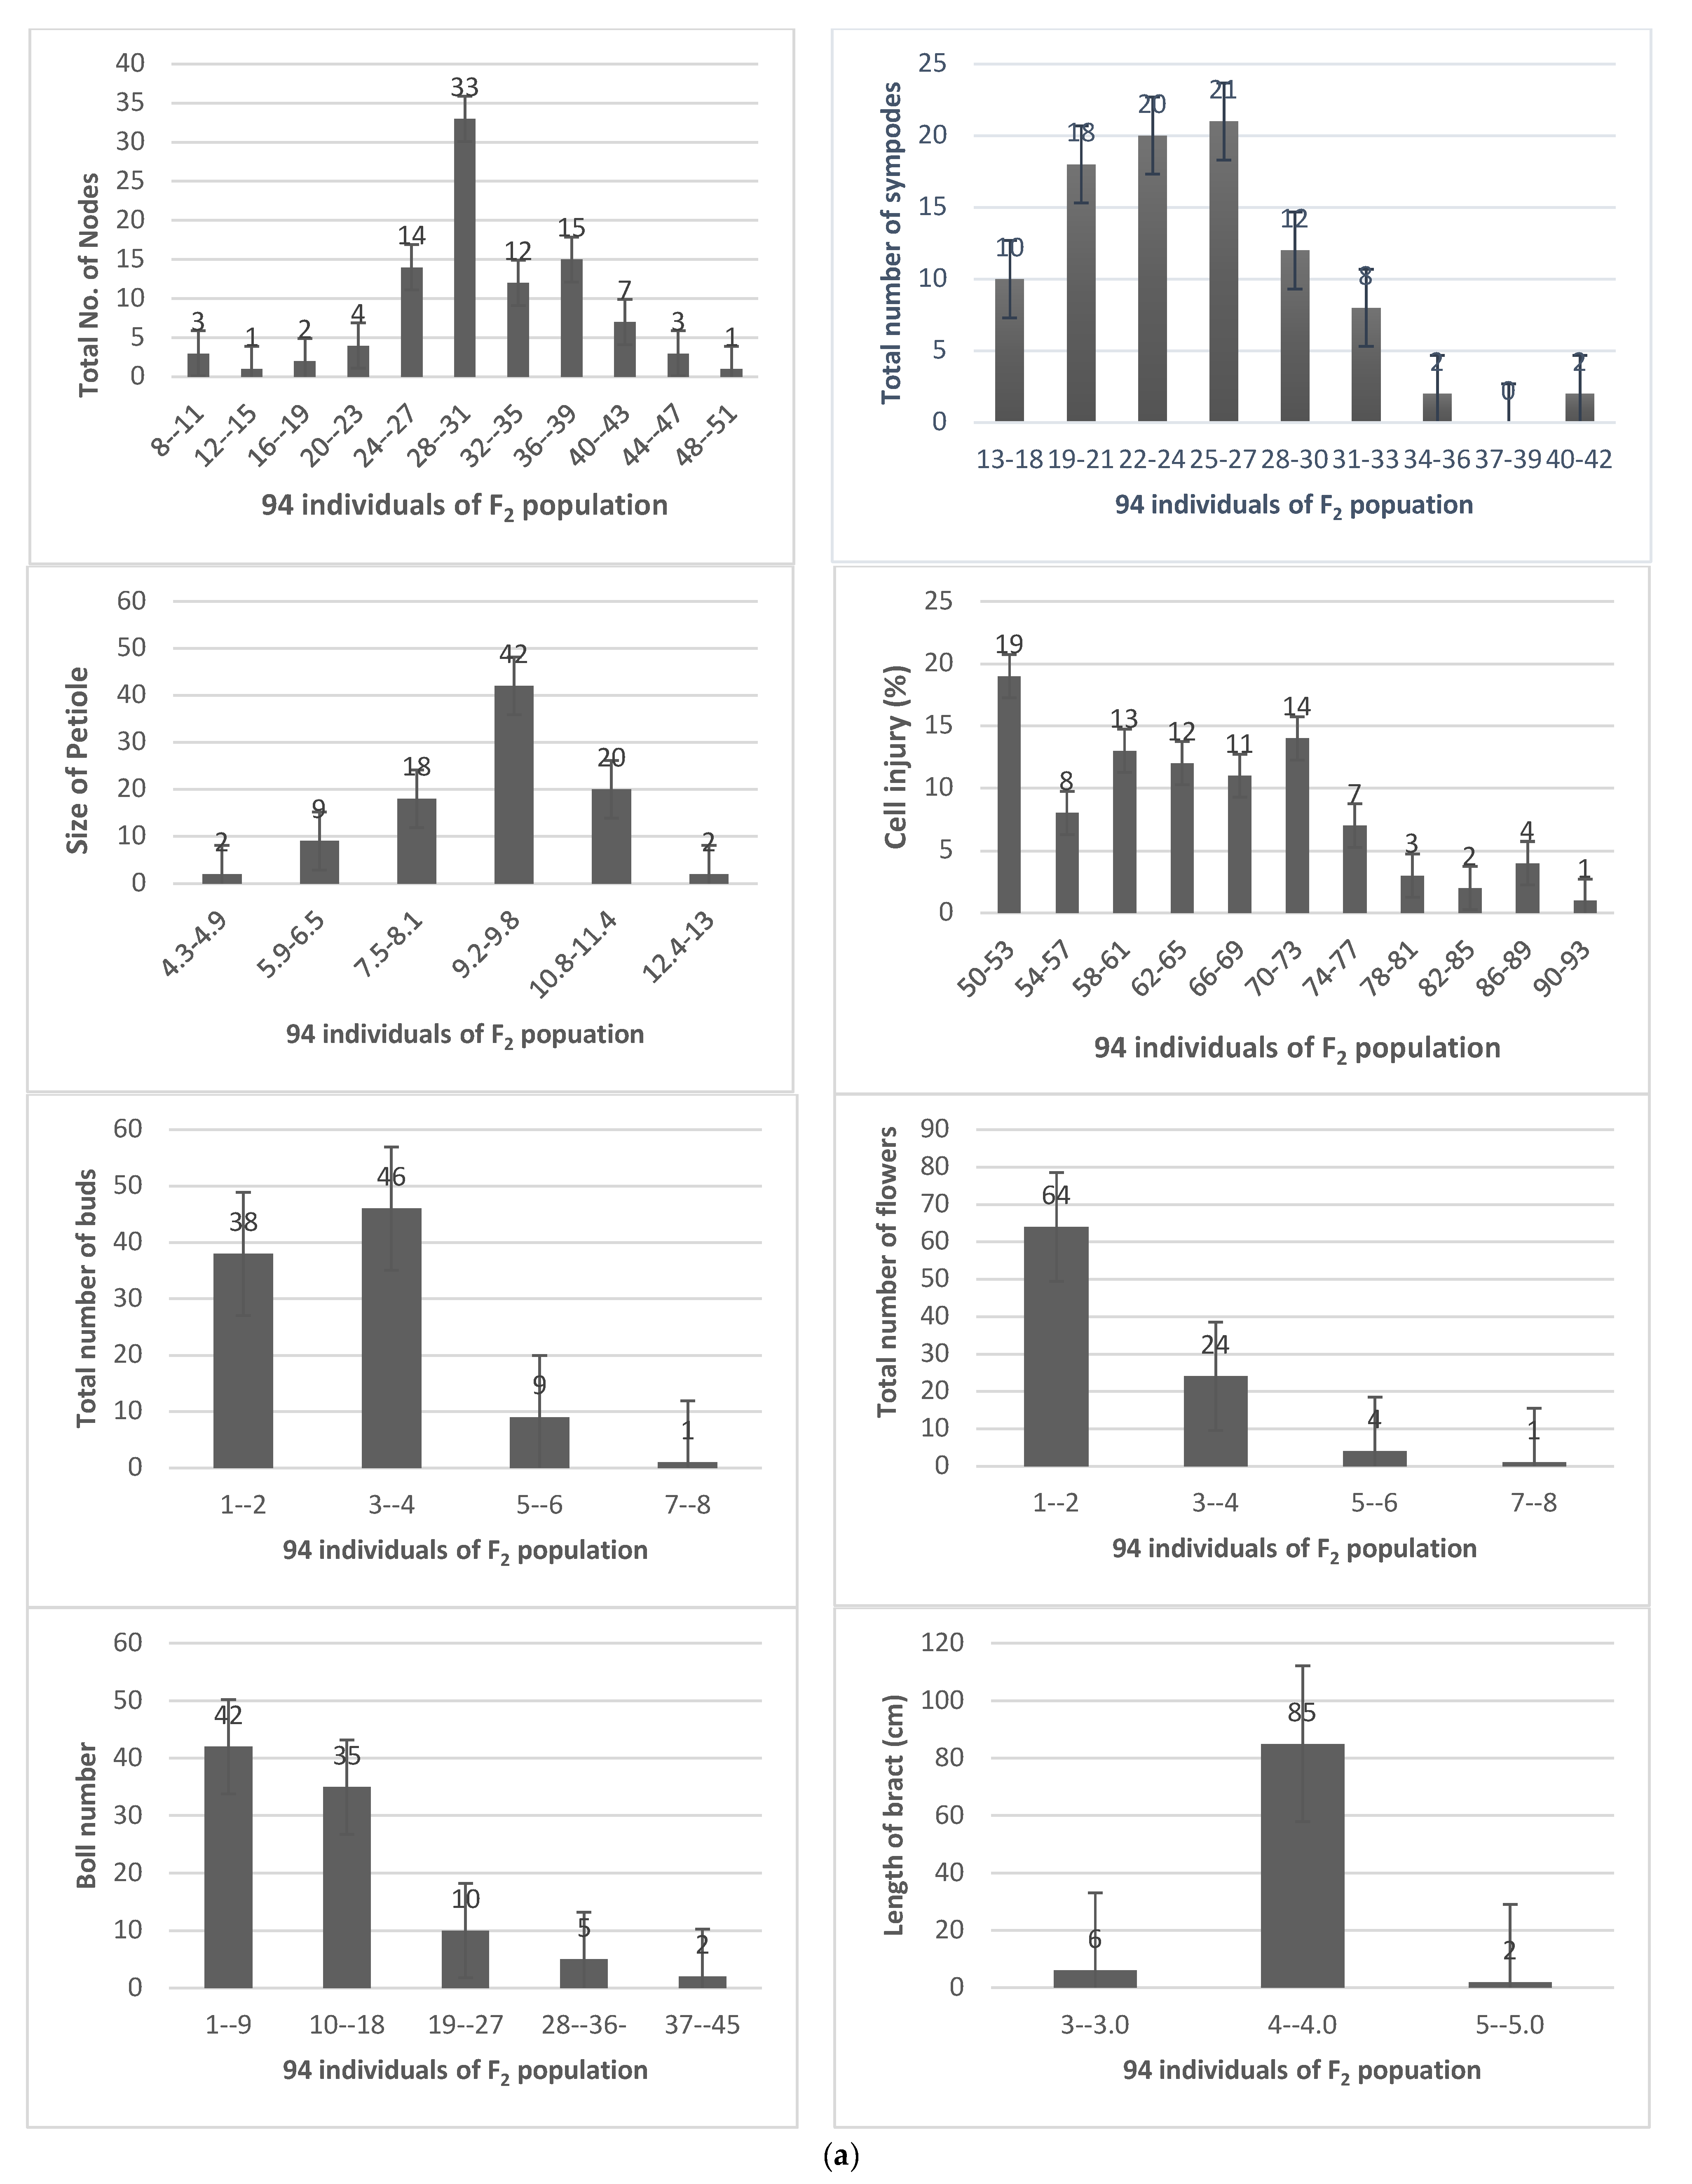
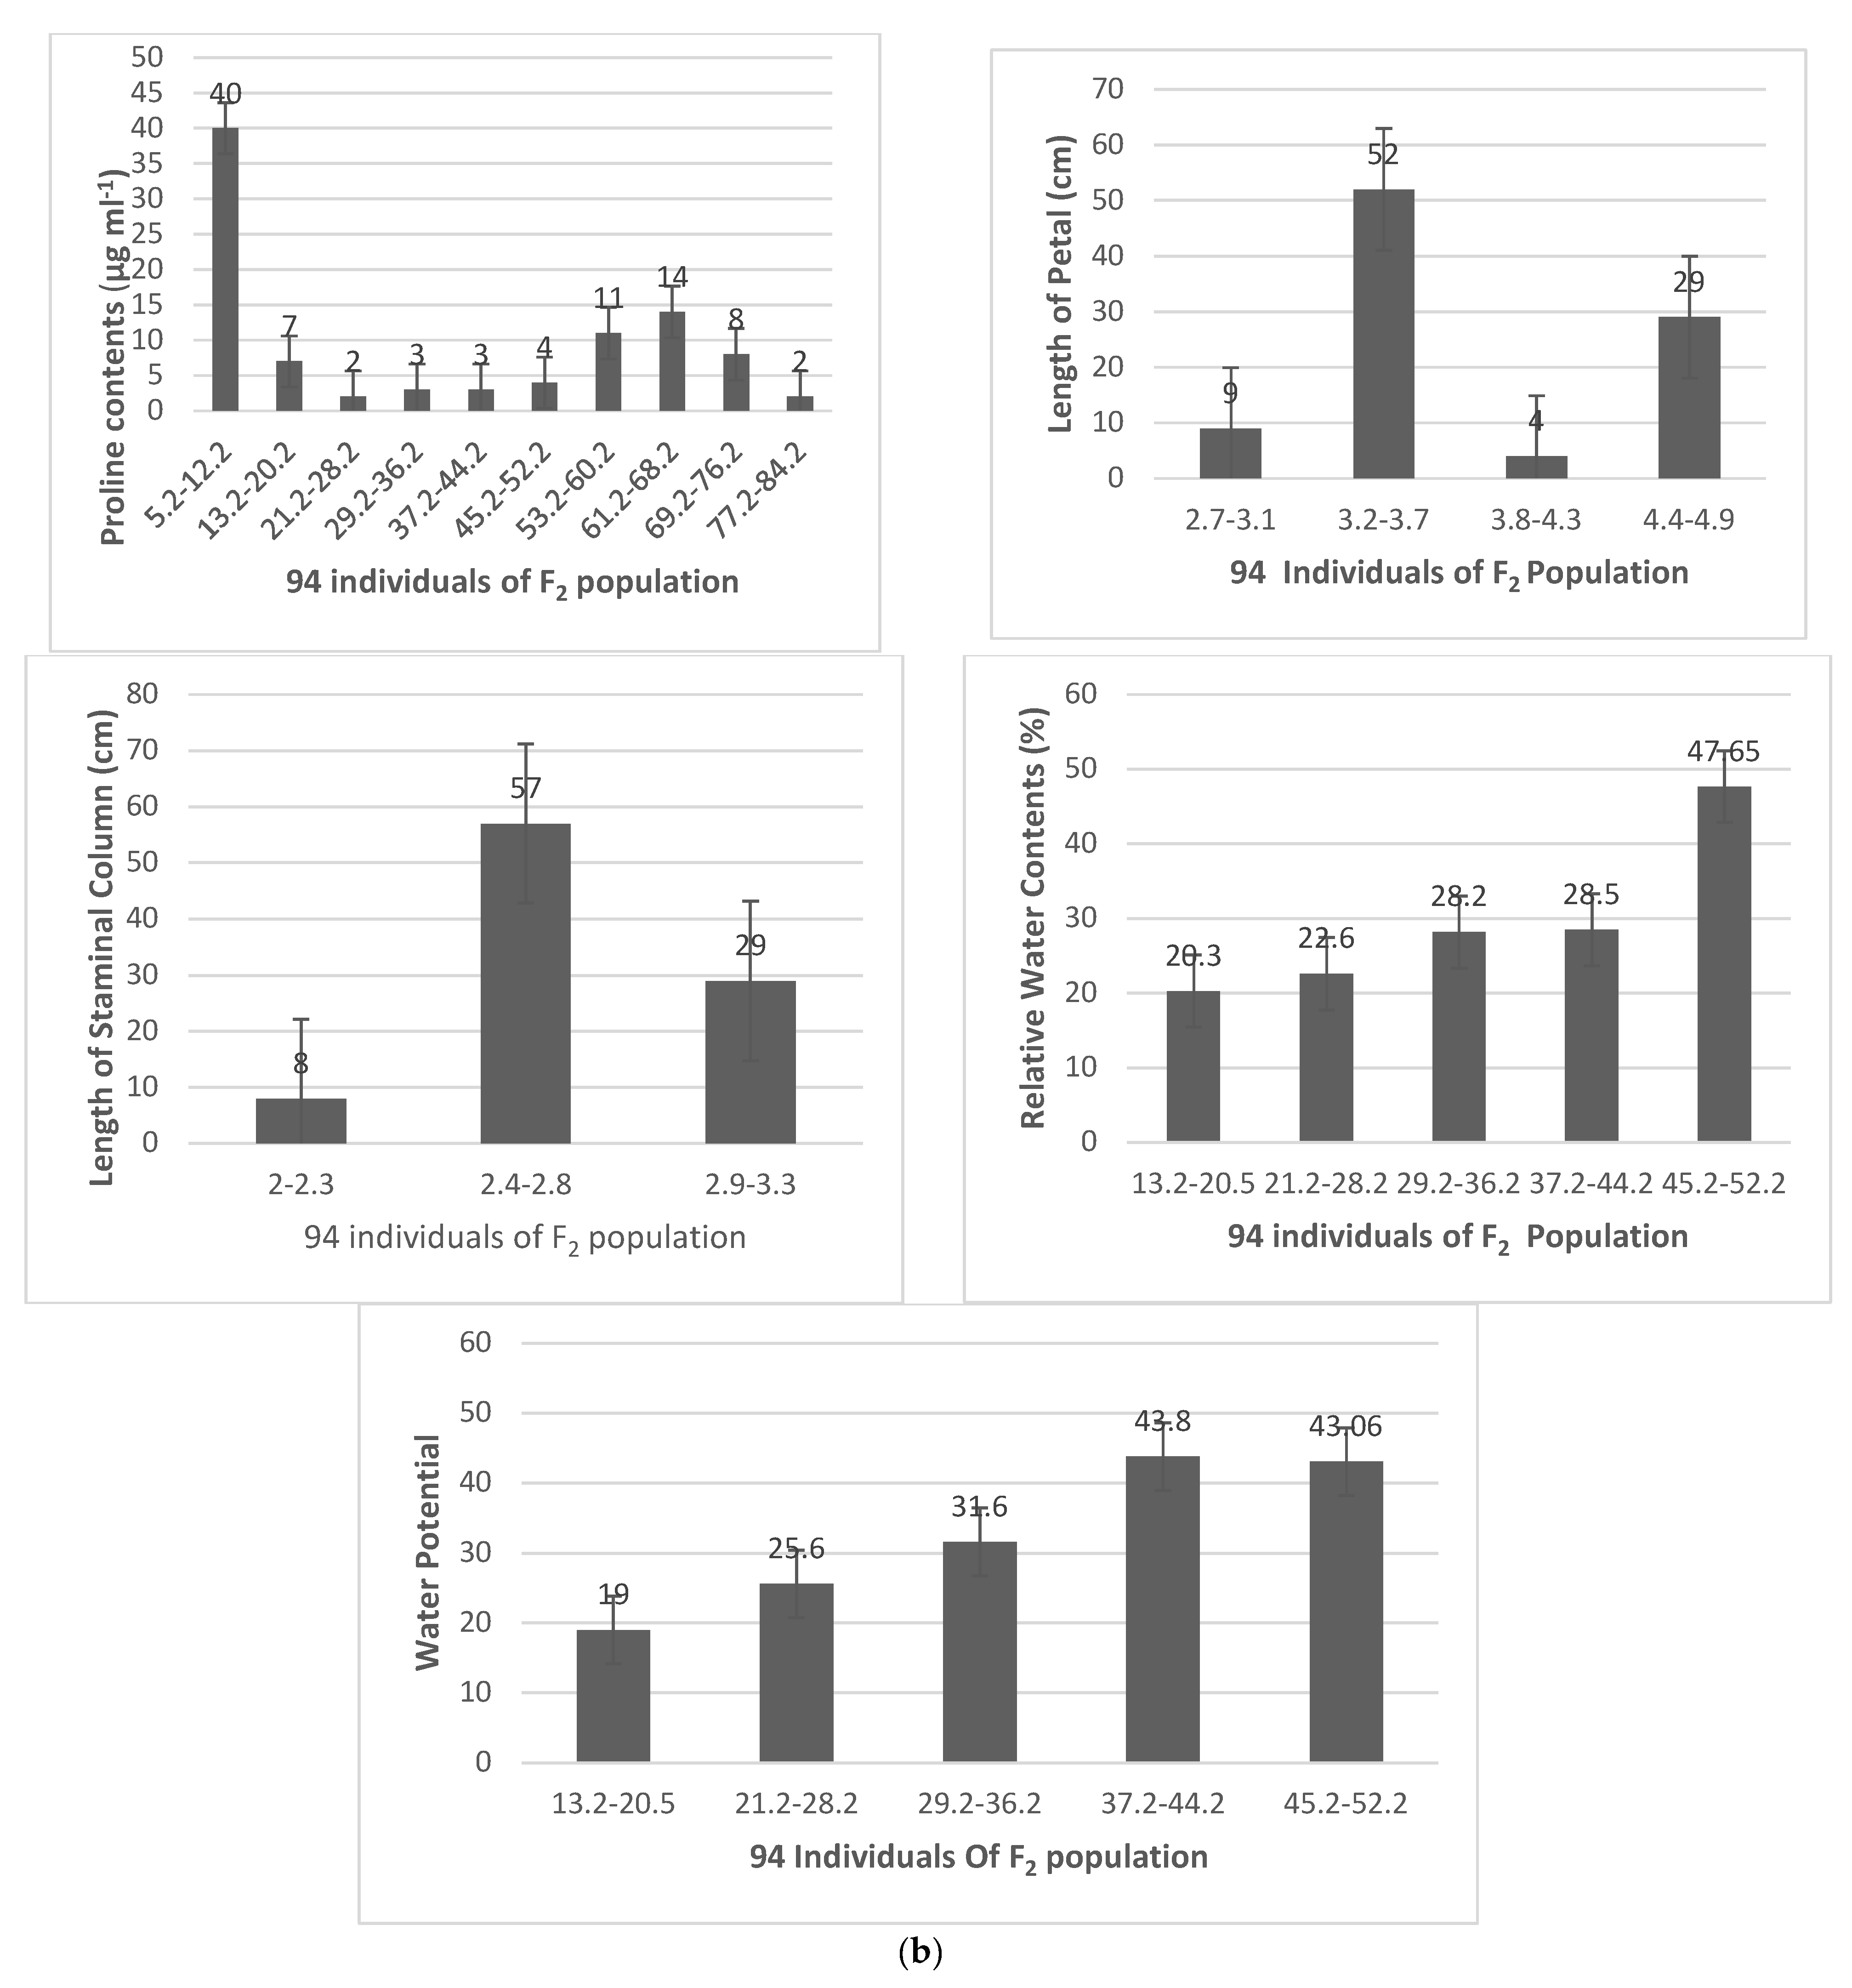
2.3. Mapping Population

Based on highly significant differences between two parental lines, the F2 population was developed by self-pollinating F1 plants from a cross between upland cotton line MNH-886 (a heat-tolerant cultivar), and MNH-814 (a heat-sensitive cultivar), and was used to map HT-QTLs during different morphological stages in cotton. Five plants were tagged at random in each line for recording physiological traits data. Ninety-four plants from the F2 population were selected to derive phenotypic and molecular data along with two parents. The experimental field area of Cotton Research Station Multan under natural conditions was selected for experiment to coincide the reproductive phase with higher temperature.

2.4. Phenotypic Data Collection Statistical Analysis

Selected parental lines and 94 F2 individuals’ phenotypic data were collected from fields at different time intervals. Arithmetic means of 3 replicates were calculated for each parent for each characteristic. The data for heat characteristics were compared. The computation of trait correlation was carried out using Minitab Inc., University Park, PA, USA.

2.5. Microsatellite Analysis

Laboratory techniques for DNA extraction were performed as described by Peterson. Amplification reactions were carried out in 15 uL reaction volumes containing 30 mg genomic DNA, 1.0 μM each of SSR primers sequences, which were drawn from the following sources: BNL primers from the Research Genetics Co. (Huntsville, AL, USA, http://www.resgen.com, accessed on 7 April 2022); JESPR primers [37]; CIR primers [37]; and NAU primers [38,39], 100 uM each of dATP, dCTP, dGTP, and dTTP, 1 unit of Taq DNA Polymerase (Fermentas), 1xTaq Polymerase Buffer, and 2.5 mM MgCl2. PCR amplifications were performed as described [40] using a Peltier Thermal Cycler (MJ Research, Waltham, MA, USA) programmed as follows: an initial denaturation of 5 min at 94°; 35 cycles of 94° for 1 min (denaturation), 55° for 1 min (annealing), and 72° for 2 min (extension). One additional cycle of 10 min at 72° was used for final extension. The amplified products were electrophoresed on a 10% non-denatured polyacrylamide gel using a DYCZ-30 electrophoresis apparatus (Beijing WoDeLife sciences instrument company, Beijing, China).

2.6. QTL Mapping

Genetic mapping and QTL analysis were performed on each population separately and combined across populations. Linkage maps were constructed using MAPMAKER/Exp Version 3.0b software [41]. QTLs were identified by composite interval mapping [42] using Windows QTLs Cartographer 2.5 [43]. A LOD threshold of 3.0 was used [44]. Marker’s order was confirmed with the “ripple” command. Recombination frequencies were converted into map distances (cm) using the Kosambi mapping function [45].
Tests for independence of QTLs were also conducted when 2 or more QTLs of a trait were located on the same chromosome [46]. QTLs were declared significant if the corresponding LR score were greater than 11.5 (equal to a LOD score of 2.5). The proportion of the phenotypic variation explained by each QTL was calculated as R2 (%) = Phenotypic variability explained by QTL/all of the variation in the population × 100. The total phenotypic variance explained together by all the putative QTLs for each trait was estimated by fitting a multiple-QTL model in the Mapmaker/QTL program.

3. Results

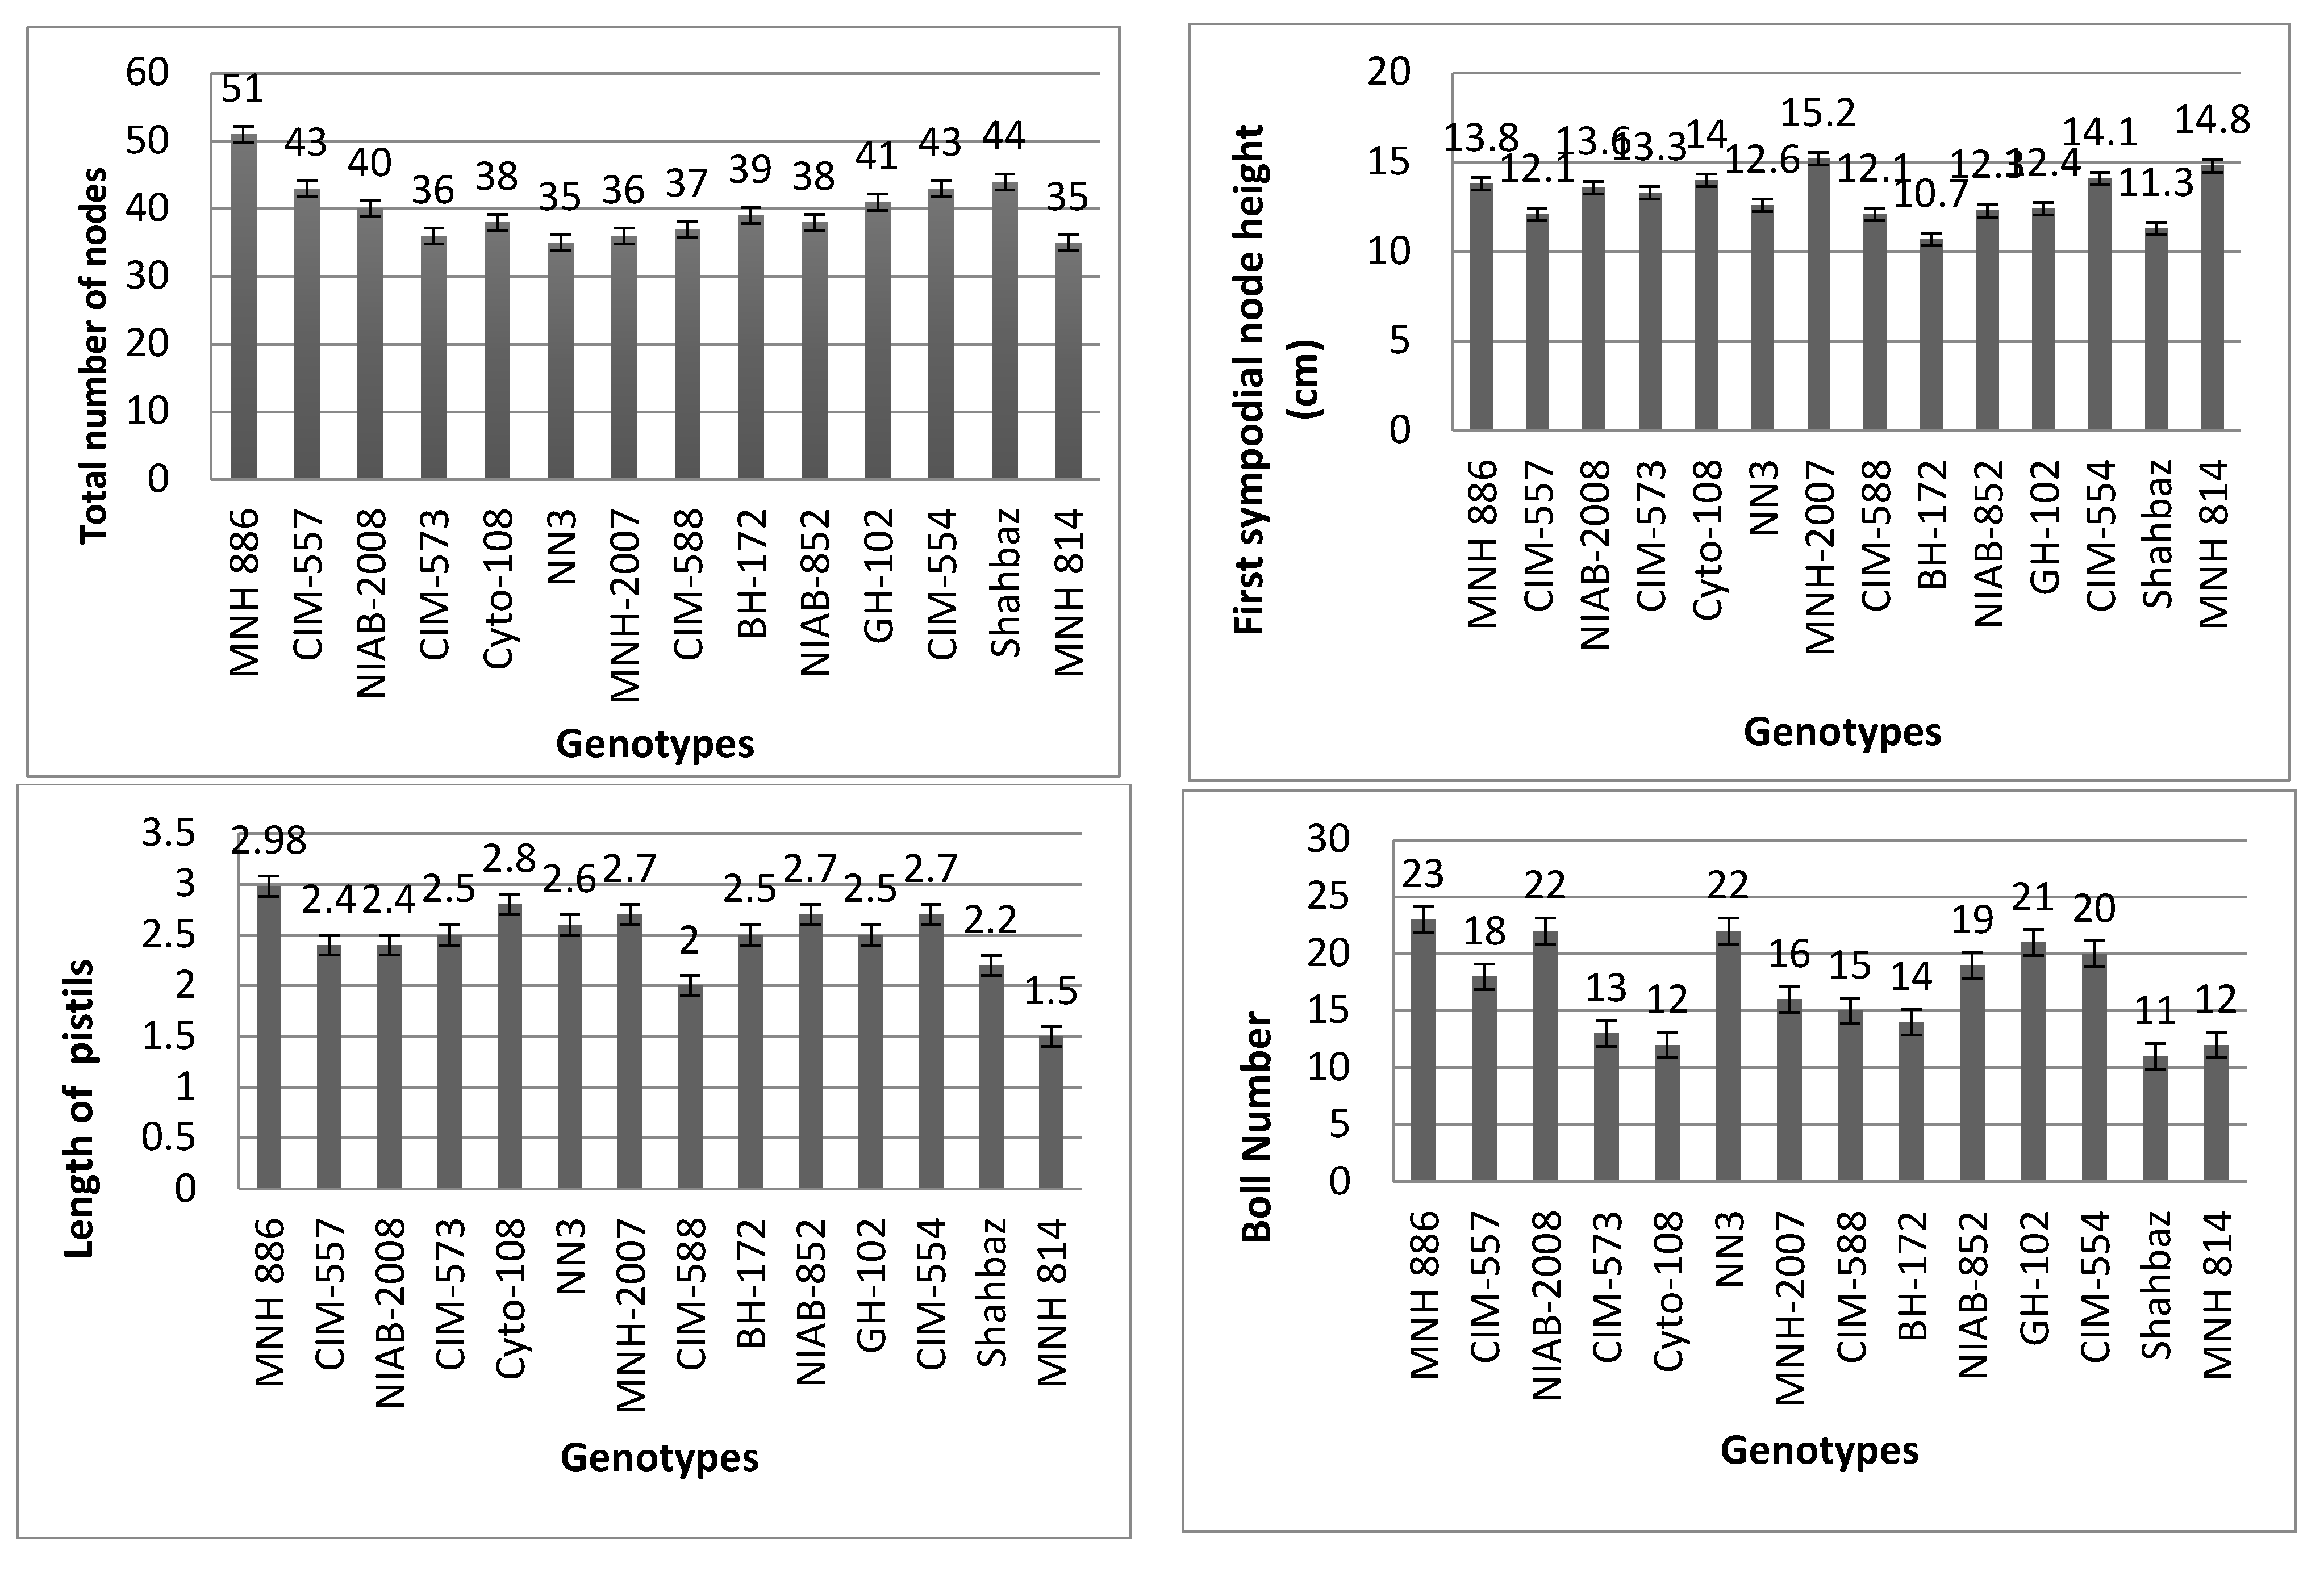
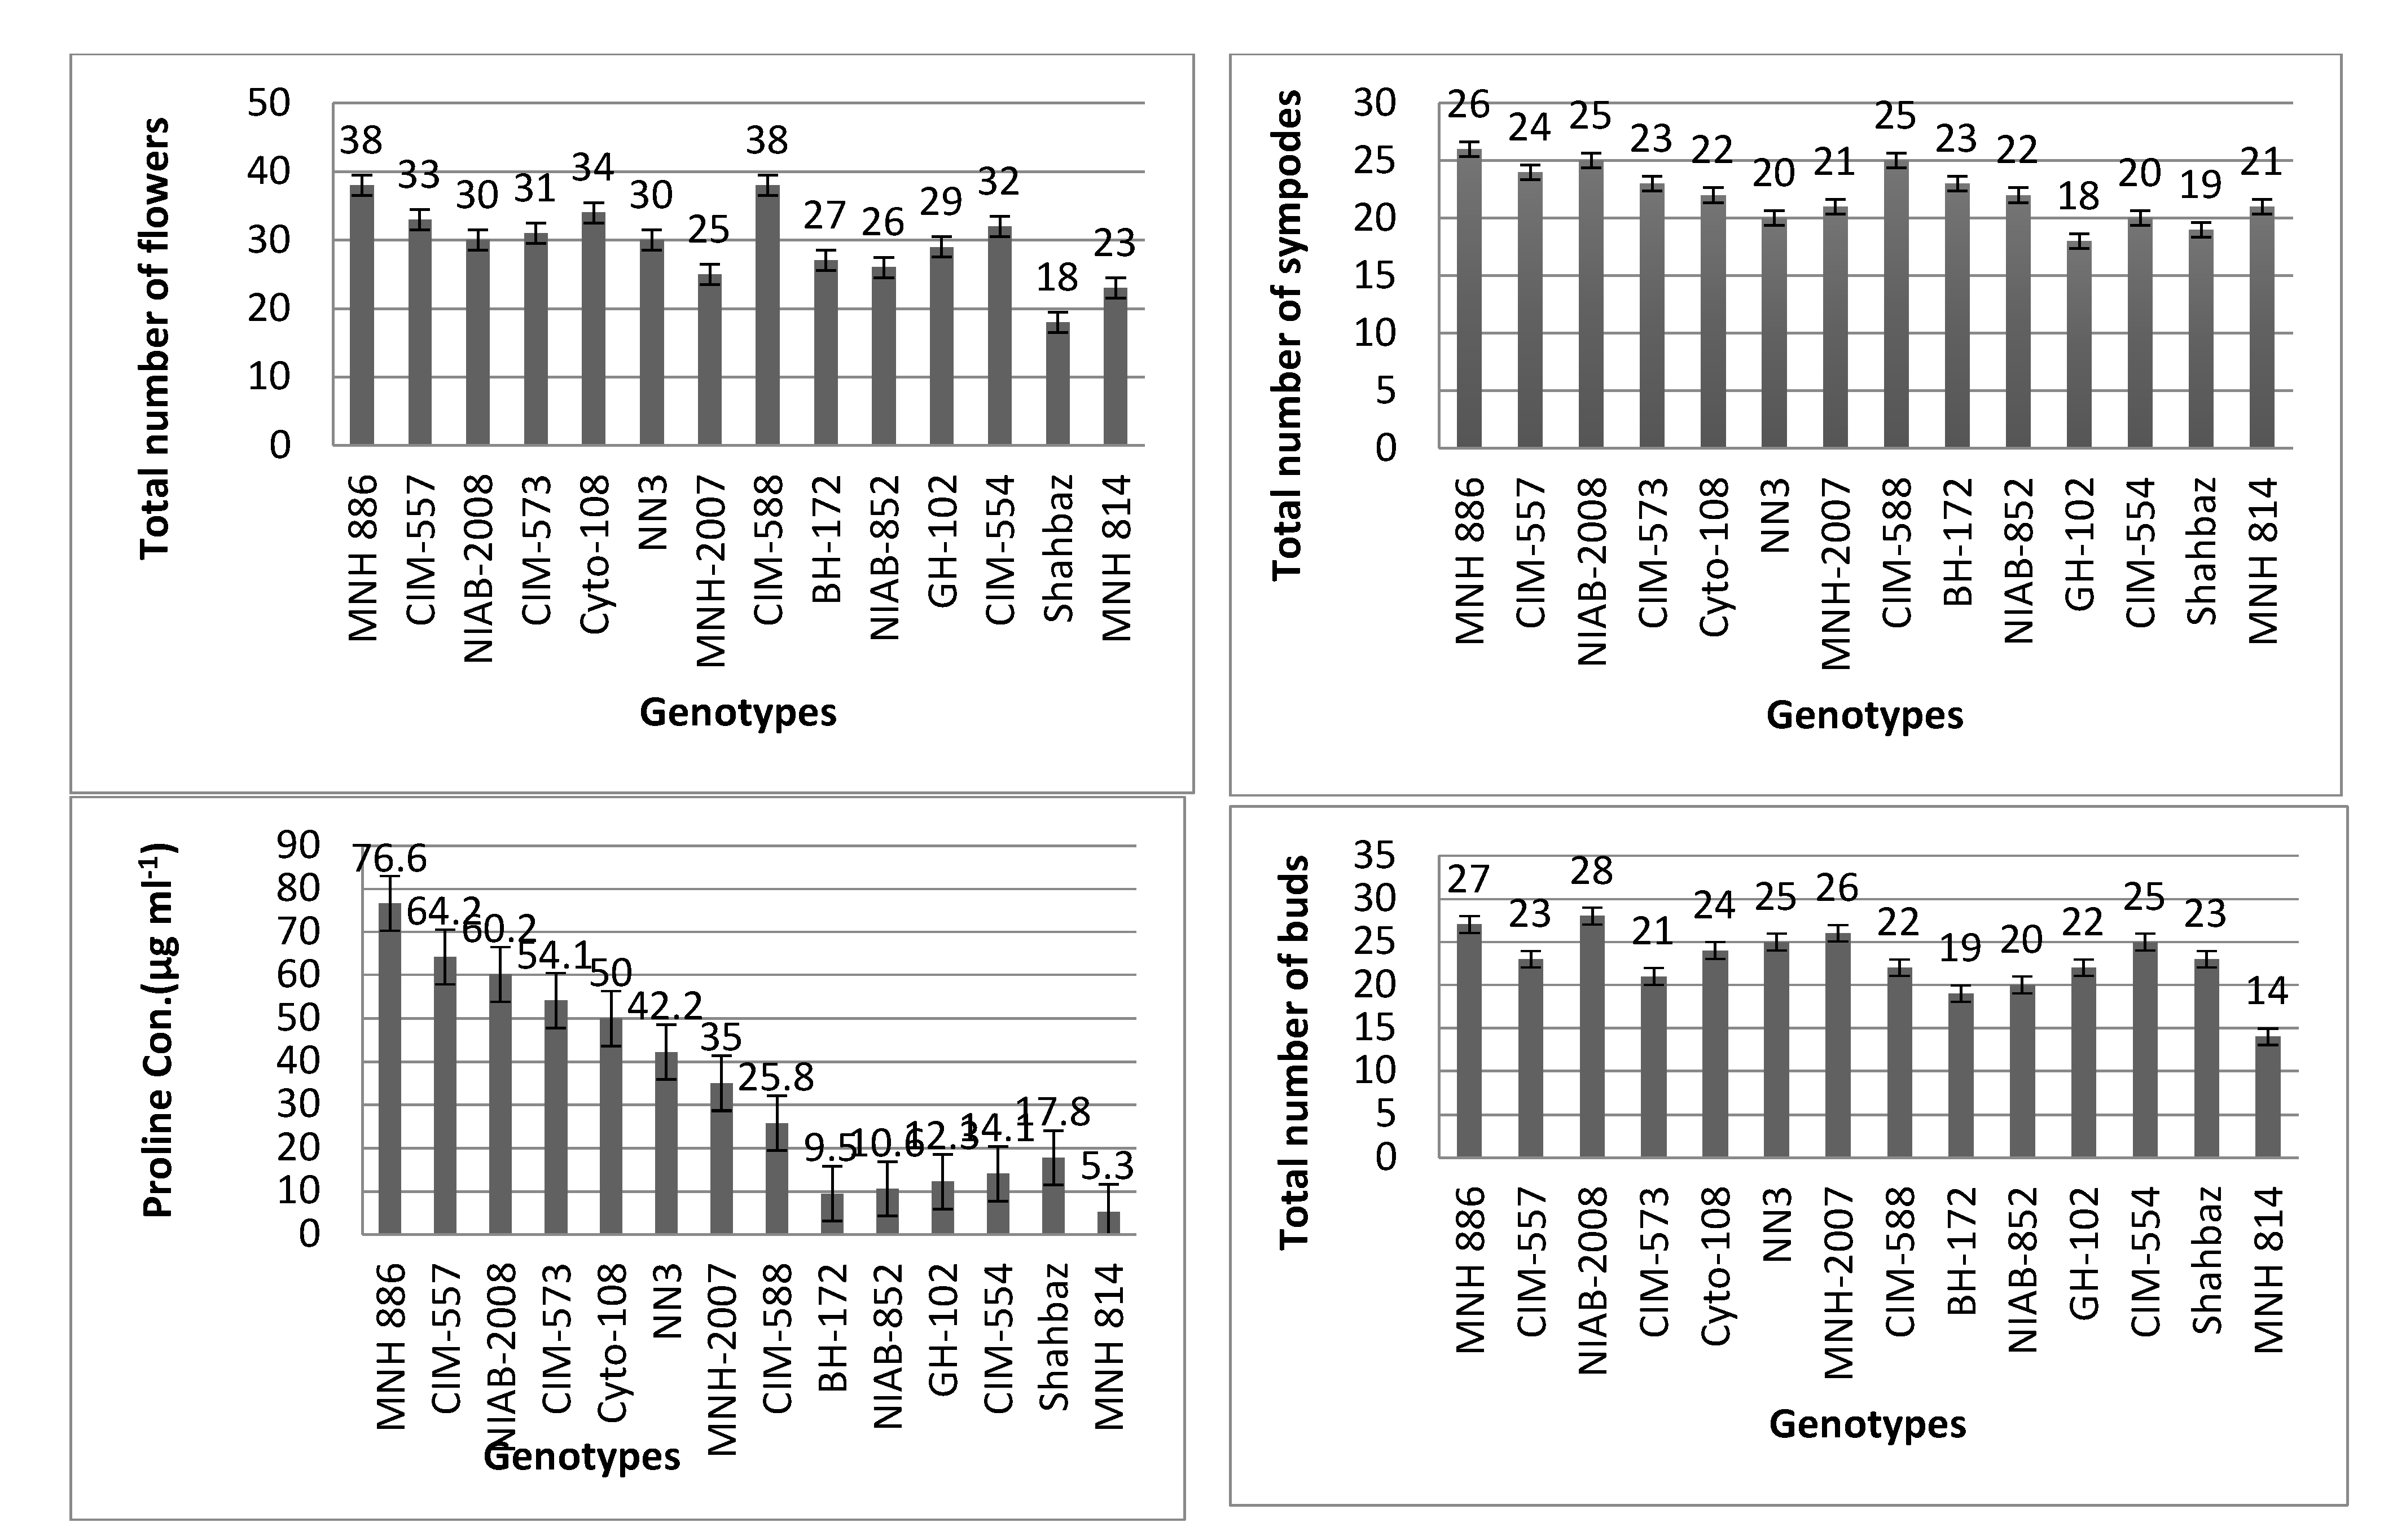
3.1. Average Performance of Cotton Varieties Based on Morpho-Physiological Traits

Based on statistically significant differences for various morpho-physiological characteristics, two cultivars, MNH-886 and MNH-814, were selected. Significant variations in heat tolerance characteristics were observed among both varieties. The mean value for fully dehiscent anthers (FDA) was 92 and 64 for MNH-886 and MNH-814 respectively. MNH-814 showed less pollen viability (66.4) than MNH886 (88.3). SNF was 34 for MNH-886 and for MNH-814 its average value was 27 (Figure 2a). The trait PBF average data of both parents were 51 and 38. MNH-886 showed less CIY while exposed to high temperatures, with an average value of 65, while MNH-814 was susceptible to extreme temperatures and the CIY was greater, with a value of 80.
Likewise, MNH 886 excelled in NOB with an average value of 23 while MNH-814 showed 12 TNN under heat-stress conditions. MNH 886 showed TNF even under heat stress with an average value of 35 while MNH 814 showed retention of a smaller number of flowers with an average value of 23. Maximum variation was observed in trait PCO; its value was 5.3 for MNH-886 and 76.6 for MNH 814. The average values of morpho-physiological traits showed that both varieties vary in most of the traits and showed that MNH-886 excelled in heat tolerance considering each trait compared with other cultivars, while MNH-814 was the most susceptible as compared with other varieties (Table 2).
Phenotypic distribution of F2 population for morpho-physiological traits is shown in Figure 2a,b. The phenotypic values of morpho-physiological traits are presented in Table 3. Twenty-one morpho-physiological traits displayed a normal distribution (skewness did not exceed 1.0), while two traits, TNF and NOB, showed a non-normal distribution. These results indicated the trend of having major QTL involvement in this population and it was thus suitable for QTL analysis.

3.2. Stress Determining Physiological Traits
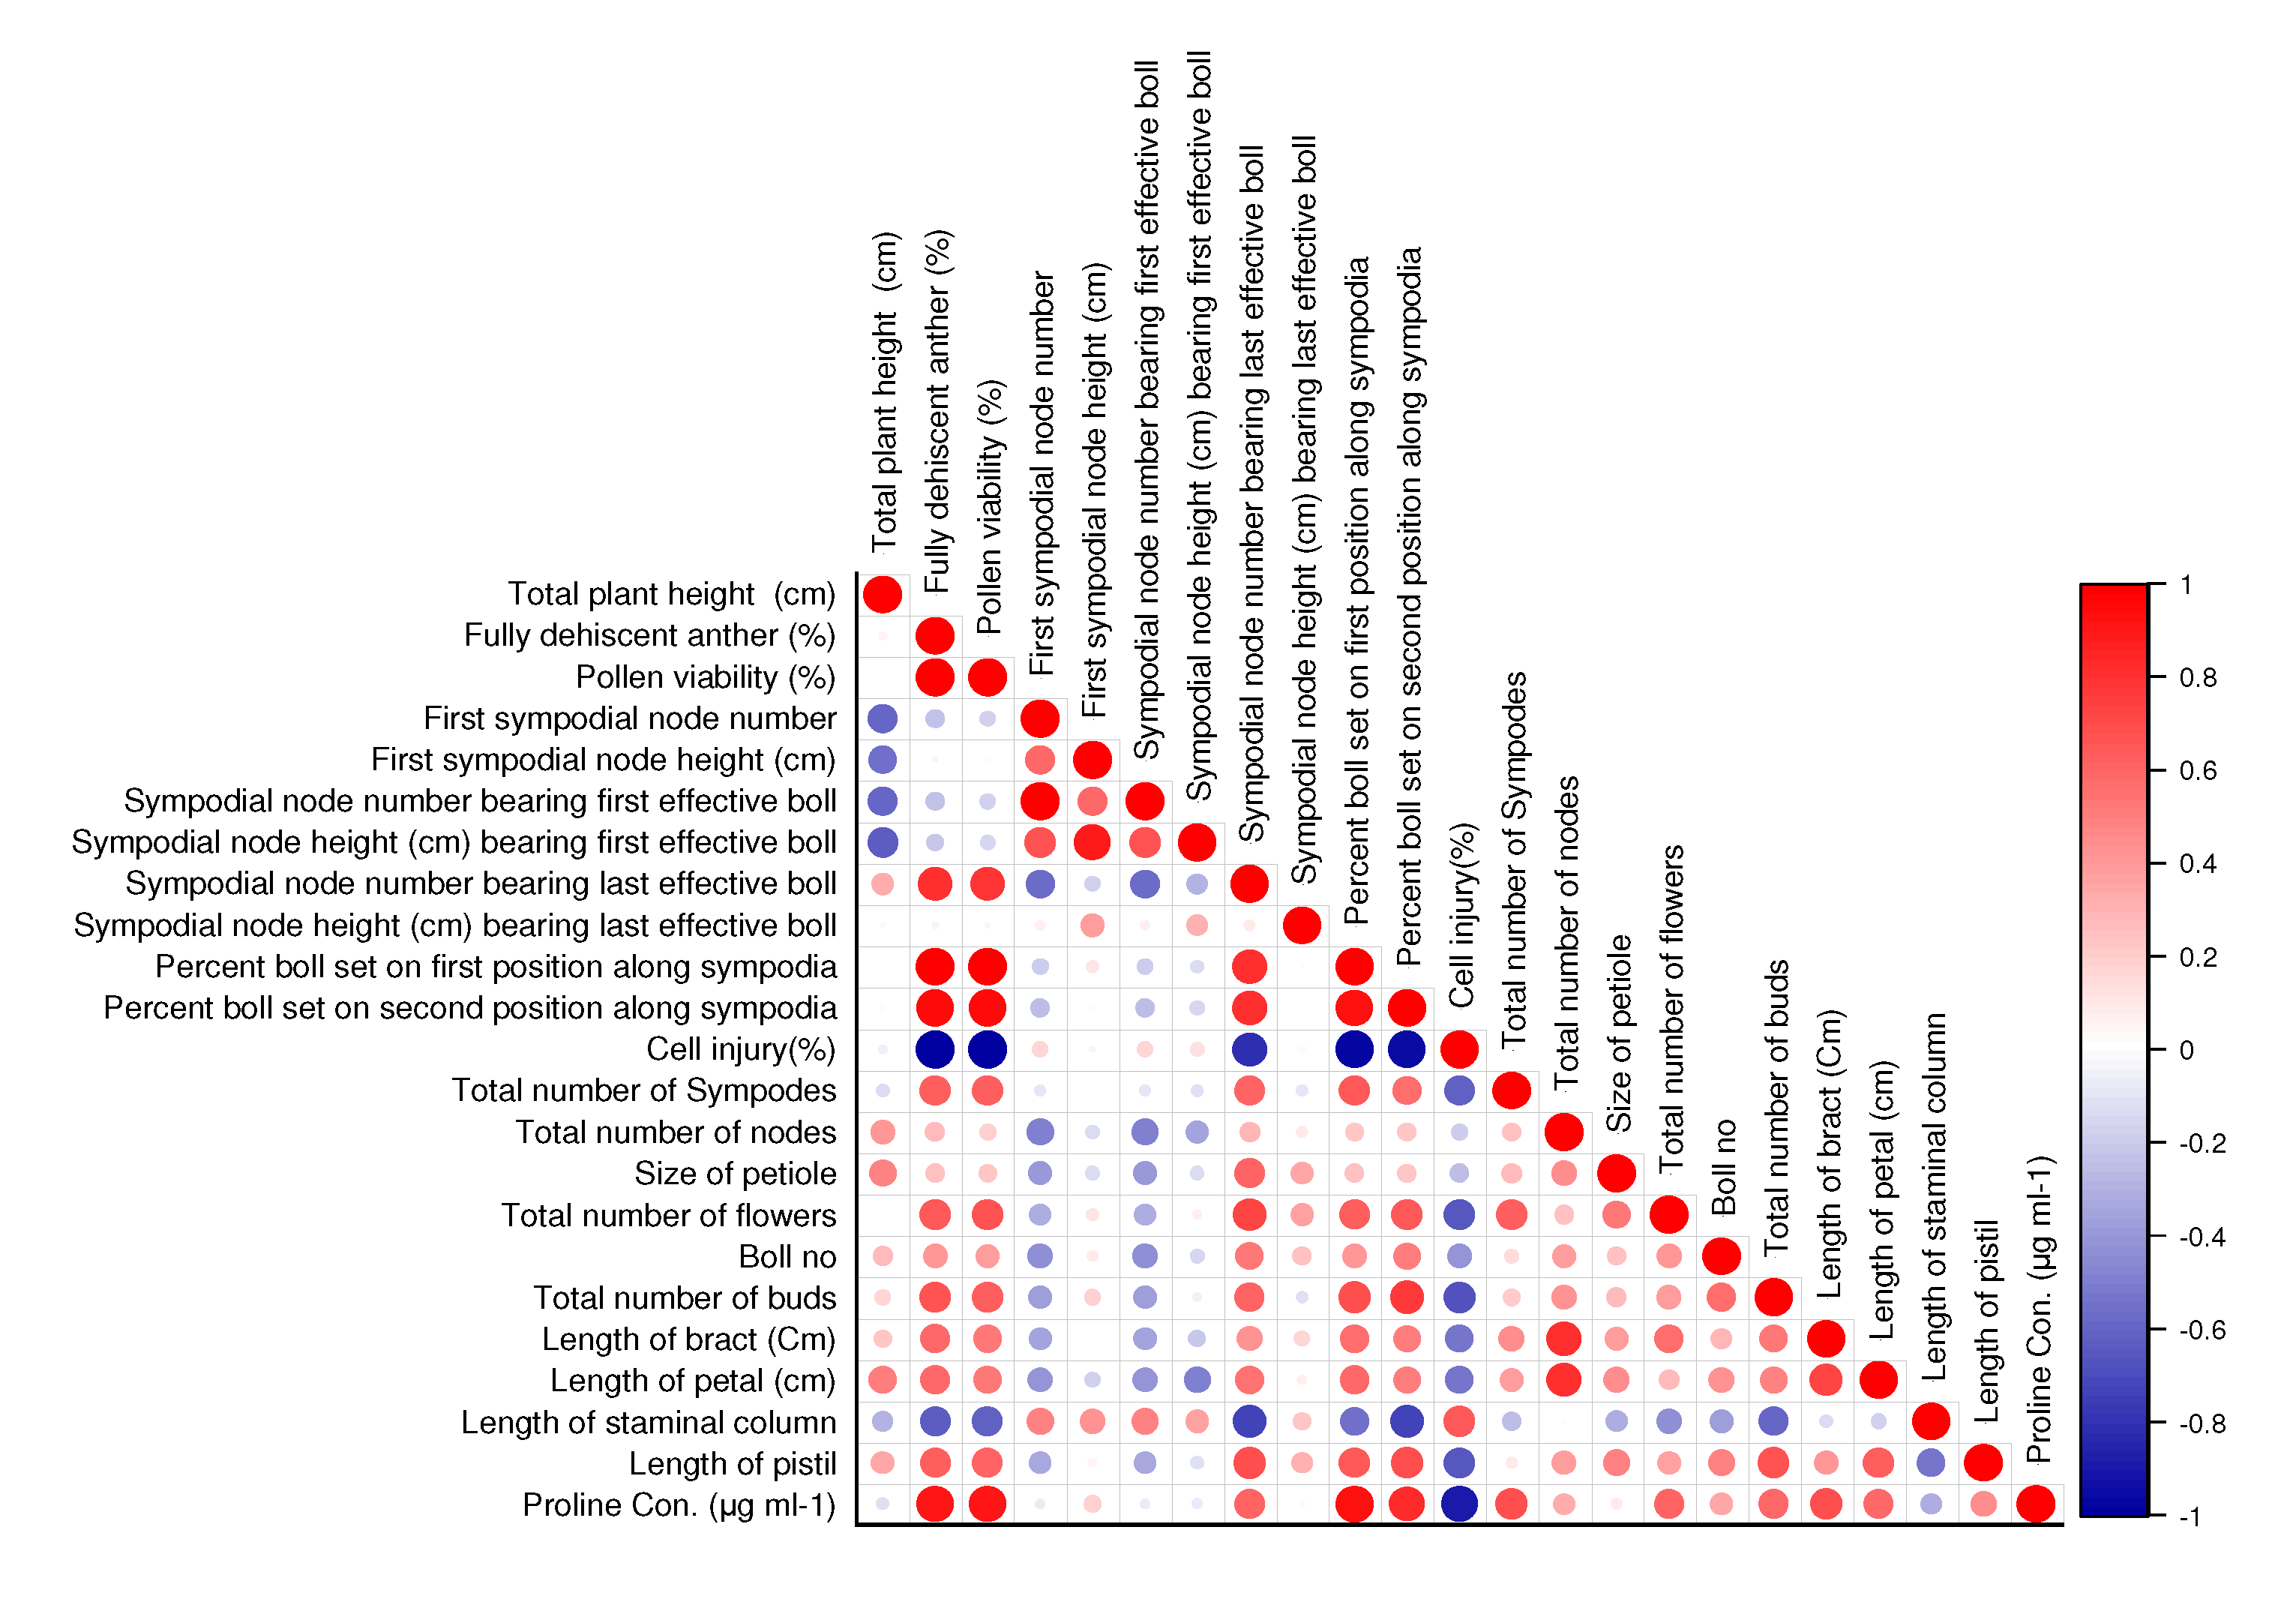
Physiological traits measure the response of plants to different phenomena taking place internally, such as cell injury and production of certain proteins, such as proline, in response to heat stress. MNH-886 showed less CIY while exposed to high temperatures, with an average value of 65, while MNH-814 was susceptible to extreme temperatures and CIY was higher with a value of 80. CIM-557 showed 64.2, while MNH-886 showed a significant value of 76.6 for proline content in heat stress. MNH-814 was found as the most susceptible among fourteen experimental cultivars and showed a proline content value of 5.3 under stress (Table 4).

3.3. Correlation

Correlation (Figure 3) was observed by OriginPro 8.5 software and it was observed that plant height showed a positive correlation with the number of fruiting branches per plant, total number of nodes, size of petiole and balls, length of bracts, length of petals, and length of pistil but it had no correlation with total number of flowers, whereas plant height was negatively correlated with total number of nodes, first sympodial node height, sympodial nose number bearing first effective boll, sympodia node height, bearing last effective boll, cell injury, total number of sympods, length of staminal column, and proline content. Fully dehiscent anther had a positive correlation with sympodial node number, percent boll set on first position, percent boll set on second position along sympodia, total number of sympods, total number of nodes, size of petiole, boll number, total number of bolls, and length of bract. Hence, the length of petiole, proline contents, sympodial node number, percent boll set on first and second position along sympodia, total number of nodes, size of petiole, branch number, total number of bolls, length of bract, and length of petiol were all positively correlated with each other and a significant effect was observed among the traits.

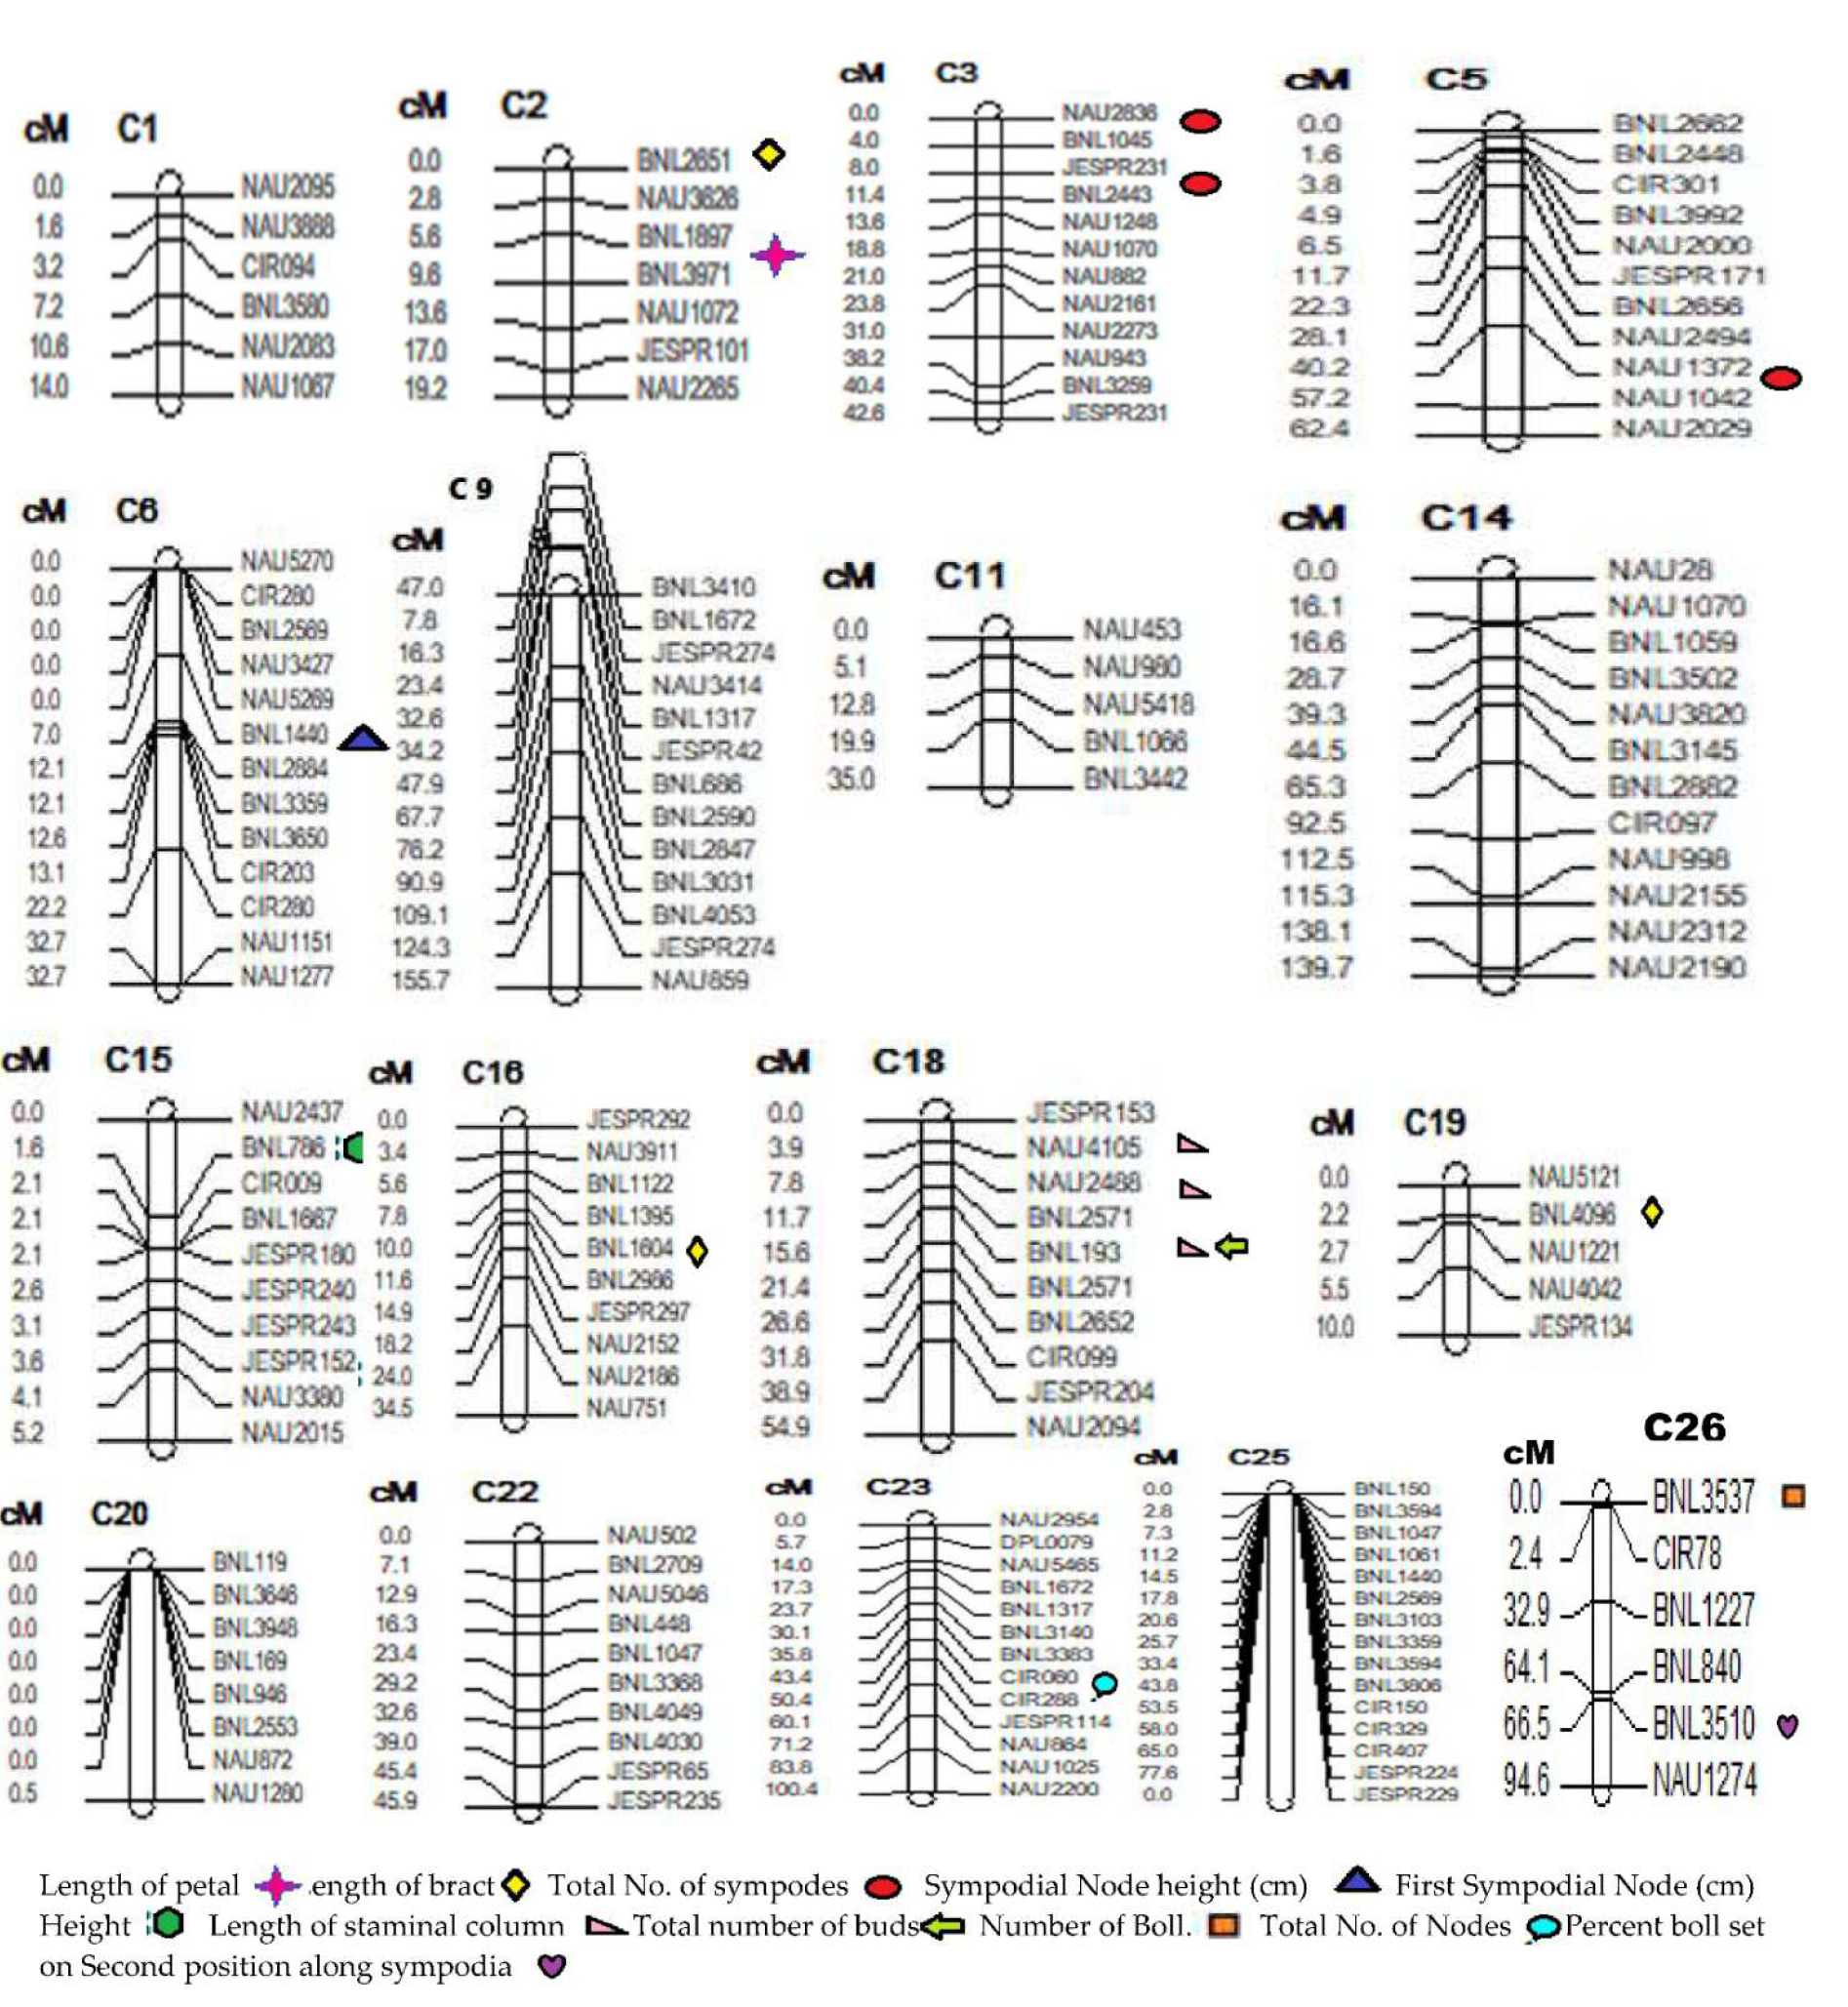
3.4. Construction and Characterization of Intra Specific Linkage Map

Among the 1450 SSR primer pairs tested on parental lines, 175 markers were found to be polymorphic. These markers were applied on population. Using a LOD score > 3.0, these markers were assigned to 26 chromosomes for population based on the information on the cotton SSR map [47]. The linkage map was constructed for the F2 population. Each linkage group was assigned to specific chromosome (Figure 4). The linkage maps covered approximately 4402.7 cm (Table 5) with an average distance of 20 cm within the markers which, according to the position of SSR markers, is common with the cotton map [48]. We estimate that we surveyed close to 70% of the cotton map, comparing the length of our map with that of the cotton map. The genetic map for the population was generated by MAPMAKER/version 3.0. Genotypic frequencies deviation from the expected segregation ratio of 1:2:1 for the co-dominant locus or 3:1 for the dominant locus was detected with the legitimacy of the additive-dominance model by means of the Chi square (χ2) method [49].

3.5. QTLs Mapping for Traits Associated with Heat Tolerance in Cotton

A summary of statistically important QTLs is shown in Table 6. All QTLs for First Sympodial node height, Sympodial node height, percent boll set along sympodia at 2nd position along sympodia, Total number of Sympodes, Total no. of nodes, number of bolls, Total no of buds, Length of bract, Length of Staminal column, and and Length of petal are shown in Figure 3. A total of 17 regions were recognized that contain the QTLs with LOD value 3.0 and above. The most noteworthy QTLs are described in Table 6.

3.5.1. QTLs for First Sympodial Node Height (FSH)

Two QTLs, qFSHa1 and qFSHa2, for first sympodial node height were detected on chromosome 15 with LOD ≥ 6.0, which explain 35% and 36% of phenotypic variance in F2 respectively. These Loci detected 35%–36% of the PV value. When two QTLs were assembled together, they explained 71% of the PV value. The additive values for both QTLs were 0.59 and 0.58 respectively (Table 6). Position of the QTLs on the linkage map is shown in Figure 4.

3.5.2. QTLs for Sympodial Node Height Bearing First Effective Boll Set (SNH)

One QTL, qSNH1, influencing Last Effective Boll Set with a LOD score of 3.42 was detected in the F2 population and it was located on chromosome 6. Putative QTL in this region accounted for 17% of phenotypic variance. So, this QTL explained 17% of the total phenotypic variance (Table 6 and Figure 4).

3.5.3. QTLs for Percent Boll Set on Second Position along Sympodia (PBS)

In the F2 population of one QTL, qPBS1, the total influencing number of nodes was identified with a LOD score of 18.21 and it was located on chromosome 26. Phenotypic variance in this region was 14.56% (Table 6). The additive value for this QTL was 0.69.

3.5.4. QTLs for Total No of Sympodes (TNS)

Two QTLs, qTNSa1 and qTNSa2, on chromosome 03 were detected for a total number of sympodes with LOD values 3.59 and 3.71 respectively. Phenotypic variance was observed between 10.05% and 10.12%, and the additive effect was 6.00 and 6.27 respectively. A total of 22% of phenotypic variance was seen when two QTL were fitted simultaneously. The third QTLqTNSa3 was detected on chromosome 05 with LOD value 3.98. The additive effect was 2.89. Phenotypic variance observed was 16.93%. (Table 6).

3.5.5. QTL for Total No of Nodes (TNN)

On chromosome 23 single QTL qTNN1was detected for total no of nodes with LOD value 4.05. Positive additive effect was seen with value 0.18. Phenotypic variance seen was 12.91% (Table 6).

3.5.6. QTLs for Number of Bolls (NOB)

In experiment, one QTL, q NOB1, for Length of bract was identified on chromosome 26 with accumulative phenotypic variance of 21.52%. The LOD value was 3.80. So, this QTL showed phenotypic variance of 22%. Additive positive effect of q NOB1 was 4.25 (Table 6).

3.5.7. QTLs for Total No of Buds (TNB)

In the F2 population, one QTL, qTNB1, influencing the Total No. of buds was identified with a LOD score of 3.79 and it was located on chromosome 18. Phenotypic variance in this region was 17.67%. Additive effect was positive with value 1.05 (Table 6).

3.5.8. QTLs for Length of Bract (LOB)

Three QTLs, qLOBa1, qLOBa2, and qLOBa3, for length of bract were detected during analysis. The first QTL was on chromosome 2 with LOD ≥ 3.24 and with a positive additive effect of 0.18. Phenotypic variance observed was 8.59%. The second QTL was detected on chromosome 16 with LOD ≥ 3.01 and a negative additive effect of 0.13 and phenotypic variance 7.76%. The third QTL was detected on chromosome 19 with a positive additive effect of 0.18 and phenotypic variance of 12.91%. When three QTLs were fitted together simultaneously the phenotypic variance was 28% (Table 6).

3.5.9. QTL for Length of Staminal Column (LOS)

Three QTL, sqLOSa1, qLOSa2, and qLOSa3, were detected on chromosome number 18 for length of staminal column. The LOD values were 3.78, 3.76, and 3.07 respectively. Results showed positive additive effects of 0.52, 0.52, and 0.30 for the three QTLs, while 16.30, 15.84, and 14.57 were the values for phenotypic variance for all QTLs. When the three QTL’s were fitted together simultaneously the phenotypic variance was 47% (Table 6).

3.5.10. QTLs for Length of Petal (LOP)

One QTL, qLOP1, was identified that influenced Length of petal trait. The QTL was located on chromosome number 2. The LOD value for QTL was 3.56. Phenotypic variance was 19.46. The QTL showed a positive additive effect of 0.45 (Table 6).

4. Discussion

The current study was carried out to identify the genetic basis responses of cotton plants under heat stress. The data collected were at the parental line and then after by F2 generation from which heat-susceptible and heat-tolerant genotypes were selected for the screening process. Initially, the emergence of the first sympodial branch at lower nodes determined the early maturity of cotton plants. Theoretically, it is implicated for the 1st sympodial branch to appear on lower nodes as it is highly correlated with earliness and heat tolerance [50,51]. The strong relationship between early maturity and lower sympodial branch node number was reported in previous studies [52]. It was reported that there was a strong association of the 1st sympodial branch node number and heat tolerance. Highly significant differences were found in analysis of variance for the 1st sympodial node number (Table 4). The data of correlation (Figure 3) showed a positive correlation of the 1st sympodial node number expressed with all the traits except sympodial node number, present boll set on first position along sympodia, cell injury, and length of pistil. Node number to set the initial fruiting sympodia is a reliable and realistic morphological trait of heat tolerance [53]. Minimum and maximum temperature significantly affected the first sympodial branch with 1st boll [54]. All genotypes under study differed significantly for this trait (Table 4). Hussain et al. (2000) revealed similar results for plant height under heat stress, presenting a familiar correlation among traits that plant height has a positive correlation with the morphological traits under study [55]. Boll development was affected by the high temperature stress as compared with vegetative phase and a similar reduction in boll weight was observed when the temperature fluctuated [56]. Morris (1964) also reported a reduction in cotton boll maturity time at high temperature stress [57]. After screening the genotypes on morphological parameters, one genotypes was selected as tolerant against heat stress and another one was selected as heat susceptible, among others, on the basis of physiological characteristics, i.e., relative water contents, water potential, osmotic potential, cell injury, and proline contents. Highly significant differences were perceived by analysis of variance for all the physiological traits among the genotypes, except photosynthesis rate, which is significant (Table 3). The membrane structure of plant cells was distorted under severe temperature stress, which caused the increased permeability of membrane. As a result, electrolyte leakage increased and eventually led to cell death [58]. Azhar et al. (2009) measured the heat tolerance in term of relative cell injury percentage in cotton and found that thermal stress-tolerant genotypes were more stable for seed cotton yield and also maintained fiber quality as compared with heat-susceptible genotypes. A significant decrease was observed in leaf relative water content % (RWC) for heat-susceptible genotypes when exposed to heat stress, and similar findings were also obtained by Rahman et al. (2000), Siddique et al. (2000), and Parida et al. (2007) under stress conditions [59,60,61]. Higher leaf relative water content (RWC) could be a criterion for selection of a parent for hybridization to develop stress-tolerant genotypes [62,63]. On the basis of grand mean attained from normal and heat-stress situations, the protein contents was variable among genotypes and Raison et al. (1982) revealed that for temperature conditions above the optimum, significant reticence of photosynthesis takes place, resulting in substantial reduction in protein formation [64].
Finally, it was observed that high heat tolerance is a multigenic trait and its expression is controlled by many QTLs. Almost all the vegetative and floral characteristics of cotton plants were affected adversely because of this stress. The identification of QTLs activated to combat heat stress allowed the estimation of genetic architecture and improvement of heat-tolerance traits by molecular marker-assisted selection (MAS). A total of 1450 markers were applied, among which 175 SSR markers were observed to be polymorphic and were found to be significant; the observations were also in accordance with some other researchers [65]. In order to dissect the genetic basis of heat tolerance, two upland cotton cultivars (MNH-886 and MNH-884) were selected as parents and an F2 population was developed. A high LOD (logarithm of odds) value provided strong evidence that the reported QTLs are actually associated with the respective traits. We only reported QTLs whose LOD score values were greater than three and which showed a significant additive or dominance genetic effect. A total of 17 QTLs with different effects on ten morphological and physiological traits such as First sympodial node height (FSH), sympodial node height (SNH), Percent boll set along sympodia on 2nd position (PBS), total no. of sympods (TNS), total no. of nodes (TNN), number of bolls (NOB), total no. of buds (TNB), length of bracts (LOB), length of staminal column (LOS), and length of petal (LOP) were detected in the present study. These QTLs were mapped on chromosome numbers 2, 3, 5, 6, 15, 16, 18, 19, 23, and 26. QTLs for length of petal and length of bracts were located on Chr. 2 while QTLs for total no. of buds and length of staminal column were located on Chr. 18 [66,67]. Likewise, QTLs for Boll no. and Percent boll set along sympodia on 2nd position were located on Chr. 26. Our findings are in accordance with work carried out by [68,69].

5. Conclusions

The purpose of cotton breeding is to boost and stabilize its yield in abiotic and biotic stress environments and to make cultivars with such physiological and architectural characteristics that can tolerate heat stress conditions. A low level of polymorphism is one of the major constraints for plant breeders and geneticists that can be attributed to the different processes like selection and domestication. It resulted in narrowing genetic shuffling in cotton. The use of an enormous number of SSRs can overcome the constraint of low polymorphism. In this study project, more than 1450 SSRs were assessed and the polymorphism rate was 12%, meaning the genetic diversity level was low owing to Intraspecific cross and segregation distortions. In spite of Intraspecific cross, 17 QTLs were detected by evaluating earlier-used and some novel traits. QTL detection can be attributed to a high rate of diversity in both parents. SSR markers were found best to deal with and easiest to assess polymorphism. The main goal of cotton breeding is to help increase and stabilize its productivity in stress environments and to develop cultivars with morphological traits which can withstand heat conditions. Our data suggest that favorable alleles for morphological traits can be combined to improve heat stress tolerance in cotton. Comparisons could be made to evaluate the consistency of QTL detection for the same trait in various backgrounds, which will help to determine the value of targeting these loci for selection in breeding programs.

6. Future Recommendation

Such coverage in the localization of QTLs controlling different quantitative traits suggested a close genotypic correlation among these traits or a pleiotropic effect of a single gene. It remains to be tested whether these common genomic regions have pleiotropic effects or there are clusters of tightly linked genes for some related traits in these regions. A more numerous mapping population and more closely spaced markers in the map are needed to determine whether the QTLs correspond to a gene with pleiotropic effects or to several separate but closely linked genes, each controlling a single character.

Author Contributions

Conceptualization, S.R., M.B. and S.A.M.; writing and draft preparation, S.R., M.B., T.N. and S.A.M.; writing, review, and editing, S.R., M.B., T.N. and S.A.M.; supervision, M.B. and S.A.M. All authors have read and agreed to the published version of the manuscript.

Funding

Authors are grateful to the Higher Education Commission (HEC) Pakistan, for providing funds under PIN 074-0747-Bm4-151, Indigenous 5000 Fellowship Program for this study.

Acknowledgments

The presented study is part of research proposal Mapping QTL’s associated with heat tolerance in cotton using microsatellite markers. Author is grateful to Allah almighty, supervisors, Peng Chee (Associate University of Georgia, USA), Edward Lubbers (Research Associate at cotton molecular breeding lab, university of Georgia, Tifton campus, USA) Bahauddin Zakariya University Multan and Higher Education Commission (HEC) Pakistan.

Conflicts of Interest

The authors declare no conflict of interest. The funders had no role in the design of the study; in the collection, analyses, or interpretation of data; in the writing of the manuscript, and in the decision to publish the results.

References

  1. IVAN Study Investigators; Chakravarthy, U.; Harding, S.P.; Rogers, C.A.; Downes, S.M.; Lotery, A.J.; Wordsworth, S.; Reeves, B.C. Ranibizumab versus bevacizumab to treat neovascular age-related macular degeneration: One-year findings from the IVAN randomized trial. Ophthalmology 2012, 119, 1399–1411. [Google Scholar] [CrossRef] [PubMed]
  2. Dabbert, T.A.; Gore, M.A. Challenges and perspectives on improving heat and drought stress resilience in cotton. J. Cotton Sci. 2014, 18, 393–409. [Google Scholar]
  3. Chapagain, A.K.; Hoekstra, A.Y.; Savenije, H.H.; Gautam, R. The water footprint of cotton consumption: An assessment of the impact of worldwide consumption of cotton products on the water resources in the cotton producing countries. Ecol. Econ. 2006, 60, 186–203. [Google Scholar] [CrossRef]
  4. Ashraf, M. Inducing drought tolerance in plants: Recent advances. Biotechnol. Adv. 2010, 28, 169–183. [Google Scholar] [CrossRef] [PubMed]
  5. Wendel, J.F.; Brubaker, C.; Alvarez, I.; Cronn, R.; Stewart, J.M. Evolution and natural history of the cotton genus. In Genetics and Genomics of Cotton; Springer: New York, NY, USA, 2009; pp. 3–22. [Google Scholar]
  6. Grover, C.E.; Zhu, X.; Grupp, K.K.; Jareczek, J.J.; Gallagher, J.P.; Szadkowski, E.; Seijo, J.G.; Wendel, J.F. Molecular confirmation of species status for the allopolyploid cotton species, Gossypium ekmanianum Wittmack. Genet. Resour. Crop Evolut. 2015, 62, 103–114. [Google Scholar] [CrossRef] [Green Version]
  7. Senchina, D.S.; Alvarez, I.; Cronn, R.C.; Liu, B.; Rong, J.; Noyes, R.D.; Wendel, J.F. Rate variation among nuclear genes and the age of polyploidy in Gossypium. Mol. Biol. Evol. 2003, 20, 633–643. [Google Scholar] [CrossRef] [PubMed]
  8. Cronn, R.; Wendel, J.F. Cryptic trysts, genomic mergers, and plant speciation. New Phytol. 2004, 161, 133–142. [Google Scholar] [CrossRef] [Green Version]
  9. Banuri, T. Pakistan: Environmental impact of cotton production and trade. Int. Inst. Sustain. Dev. 1998, 161. [Google Scholar]
  10. Janjua, P.Z.; Samad, G.; Khan, N.U.; Nasir, M. Impact of climate change on wheat production: A case study of Pakistan [with comments]. Pak. Dev. Rev. 2010, 49, 799–822. [Google Scholar] [CrossRef] [Green Version]
  11. Riaz, M.; Farooq, J.; Sakhawat, G.; Mahmood, A.; Sadiq, M.A.; Yaseen, M. Genotypic variability for root/shoot parameters under water stress in some advanced lines of cotton (Gossypium hirsutum L.). Genet. Mol. Res. 2013, 12, 552–561. [Google Scholar] [CrossRef]
  12. Farooq, J.; Anwar, M.; Rizwan, M.; Riaz, M.; Mahmood, K.; Mahpara, S. Estimation of correlation and path analysis of various yield and related parameters in cotton (Gossypium hirsutum L.). Cotton Genom. Genet. 2015, 6, 1–6. [Google Scholar]
  13. Khan, N.; Faqir, M.A.; Khan, A.A.; Rashid, A. Measurement of canopy temperature for heat tolerance in upland cotton: Variability and its genetic basis. Pak. J. Agri. Sci. 2014, 51, 359–365. [Google Scholar]
  14. Reddy, A.R.; Reddy, K.R.; Padjung, R.; Hodges, H.F. Nitrogen nutrition and photosynthesis in leaves of Pima cotton. J. Plant Nutr. 1996, 19, 755–770. [Google Scholar] [CrossRef]
  15. Rosolem, C.A.; Sarto, M.V.M.; Rocha, K.F.; Martins, J.D.L.; Alves, M.S. Does the introgression of BT gene affect physiological cotton response to water deficit? Planta Daninha 2019, 37, 1–7. [Google Scholar] [CrossRef]
  16. Jarwar, A.H.; Wang, X.; Iqbal, M.S.; Sarfraz, Z.; Wang, L.; Ma, Q.; Shuli, F. Genetic divergence on the basis of principal component, correlation and cluster analysis of yield and quality traits in cotton cultivars. Pak. J. Bot 2019, 51, 1143–1148. [Google Scholar] [CrossRef]
  17. Wang, M.; Tu, L.; Yuan, D.; Zhu, D.; Shen, C.; Li, J.; Liu, F.; Pei, L.; Wang, P.; Zhao, G.; et al. Reference genome sequences of two cultivated allotetraploid cottons, Gossypium hirsutum and Gossypium barbadense. Nat. Genet. 2019, 51, 224–229. [Google Scholar] [CrossRef] [Green Version]
  18. Tester, M.; Langridge, P. Breeding technologies to increase crop production in a changing world. Science 2010, 327, 818–822. [Google Scholar] [CrossRef]
  19. Swinnen, J.; Vandeplas, A. Rich consumers and poor producers: Quality and rent distribution in global value chains. J. Glob. Dev. 2012, 2, 1–30. [Google Scholar] [CrossRef] [Green Version]
  20. Wang, K.; Song, X.; Han, Z.; Guo, W.; John, Z.Y.; Sun, J.; Pan, J.; Kohel, R.J.; Zhang, T. Complete assignment of the chromosomes of Gossypium hirsutum L. by translocation and fluorescence in situ hybridization mapping. Theor. Appl. Genet. 2006, 113, 73–80. [Google Scholar] [CrossRef]
  21. Park, Y.-H.; Alabady, M.S.; Ulloa, M.; Sickler, B.; Wilkins, T.A.; Yu, J.; Stelly, D.; Kohel, R.J.; El-Shihy, O.M.; Cantrell, R.G. Genetic mapping of new cotton fiber loci using EST-derived microsatellites in an interspecific recombinant inbred line cotton population. Mol. Genet. Genom. 2005, 274, 428–441. [Google Scholar] [CrossRef]
  22. Li, H.; Pan, Z.; He, S.; Jia, Y.; Geng, X.; Chen, B.; Wang, L.; Pang, B.; Du, X. QTL mapping of agronomic and economic traits for four F2 populations of upland cotton. J. Cotton Res 2021, 4, 1–12. [Google Scholar] [CrossRef]
  23. Tyagi, P.; Gore, M.A.; Bowman, D.T.; Campbell, B.T.; Udall, J.A.; Kuraparthy, V. Genetic diversity and population structure in the US Upland cotton (Gossypium hirsutum L.). Theor. Appl. Genet. 2014, 127, 283–295. [Google Scholar] [CrossRef] [PubMed]
  24. Zhang, J.; Stewart, J.M. Economical and rapid method for extracting cotton genomic DNA. J. Cotton Sci. 2000, 4, 193–201. [Google Scholar]
  25. Iqbal, M.; Ul-Allah, S.; Naeem, M.; Ijaz, M.; Sattar, A.; Sher, A. Response of cotton genotypes to water and heat stress: From field to genes. Euphytica 2017, 213, 1–11. [Google Scholar] [CrossRef]
  26. Akhtar, K.P.; Ullah, R.; Khan, I.A.; Saeed, M.; Sarwar, N.; Mansoor, S. First symptomatic evidence of infection of Gossypium arboreum with Cotton leaf curl Burewala virus through grafting. Int. J. Agric. Biol. 2013, 15, 157–160. [Google Scholar]
  27. Wahid, A.; Gelani, S.; Ashraf, M.; Foolad, M.R. Heat tolerance in plants: An overview. Environ. Exp. Bot. 2007, 61, 199–223. [Google Scholar] [CrossRef]
  28. Li, F.; Fan, G.; Lu, C.; Xiao, G.; Zou, C.; Kohel, R.J. Genome sequence of cultivated Upland cotton (Gossypium hirsutum TM-1) provides insights into genome evolution. Nat. Biotechnol. 2015, 33, 524–530. [Google Scholar] [CrossRef] [Green Version]
  29. Zhang, T.; Hu, Y.; Jiang, W.; Fang, L.; Guan, X.; Chen, J.; Zhang, J.; Saski, C.A.; Scheffler, B.E.; Stelly, D.M.; et al. Sequencing of allotetraploid cotton (Gossypium hirsutum L. acc. TM-1) provides a resource for fiber improvement. Nat. Biotechnol. 2015, 33, 531–537. [Google Scholar] [CrossRef] [Green Version]
  30. Said, J.I.; Lin, Z.; Zhang, X.; Song, M.; Zhang, J. A comprehensive meta QTL analysis for fiber quality, yield, yield related and morphological traits, drought tolerance, and disease resistance in tetraploid cotton. BMC Genom. 2013, 14, 1–22. [Google Scholar] [CrossRef] [Green Version]
  31. Said, J.I.; Knapka, J.A.; Song, M.; Zhang, J. Cotton QTLdb: A cotton QTL database for QTL analysis, visualization, and comparison between Gossypium hirsutum and G. hirsutum × G. barbadense populations. Mol. Genet. Genom. 2015, 290, 1615–1625. [Google Scholar] [CrossRef]
  32. Burke, H.R.; Clark, W.E.; Cate, J.R.; Fryxell, P.A. Origin and dispersal of the boll weevil. Bull. ESA 1986, 32, 228–238. [Google Scholar] [CrossRef]
  33. Stewart, J.M.; Hsu, C.L. In-ovulo embryo culture and seedling development of cotton (Gossypium hirsutum L.). Planta 1977, 137, 113–117. [Google Scholar] [CrossRef]
  34. Barnett, N.M.; Naylor, A.W. Amino acid and protein metabolism in Bermuda grass during water stress. Plant Physiol. 1966, 41, 1222–1230. [Google Scholar] [CrossRef] [Green Version]
  35. Bates, L.S.; Waldem, R.P.; Teare, I.D. Rapid determination of free proline for water-stress studies. Plant Soil 1973, 39, 205–207. [Google Scholar] [CrossRef]
  36. Paterson, A.H.; Brubaker, C.L.; Wendel, J.F. A rapid method for extraction of cotton (Gossypium spp.) genomic DNA suitable for RFLP or PCR analysis. Plant Mol. Biol. Report. 1993, 11, 122–127. [Google Scholar] [CrossRef]
  37. Reddy, O.U.K.; Pepper, A.E.; Abdurakhmonov, I.; Saha, S.; Jenkins, J.N.; Brooks, T.; El-Zik, K.M. New Dinucleotide and Trinucleotide Microsatellite Marker Resources for Cotton Genome Research. J. Cotton Sci. 2001, 5, 103–113. [Google Scholar]
  38. Nguyen, T.-B.; Giband, M.; Brottier, P.; Risterucci, A.-M.; Lacape, J.-M. Wide coverage of the tetraploid cotton genome using newly developed microsatellite markers. Theor. Appl. Genet. 2004, 109, 167–175. [Google Scholar] [CrossRef]
  39. Han, Z.G.; Guo, W.Z.; Song, X.L.; Zhang, T.Z. Genetic mapping of EST-derived microsatellites from the diploid Gossypium arboreum in allotetraploid cotton. Mol. Genet. Genom. 2004, 272, 308–327. [Google Scholar] [CrossRef]
  40. Han, Z.; Wang, C.; Song, X.; Guo, W.; Gou, J.; Li, C. Characteristics, development and mapping of Gossypium hirsutum derived EST-SSRs in allotetraploid cotton. Theor. Appl. Genet. 2006, 112, 430–439. [Google Scholar] [CrossRef]
  41. Zhang, J.; Guo, W.; Zhang, T. Molecular linkage map of allotetraploid cotton (Gossypium hirsutum L. × Gossypium barbadense L.) with a haploid population. Theor. Appl. Genet. 2002, 105, 1166–1174. [Google Scholar]
  42. Tanksley, S.D.; Young, N.D.; Paterson, A.H.; Bonierbale, M.W. RFLP mapping in plant breeding: New tool for an old science. Biotechnology 1989, 7, 257–264. [Google Scholar] [CrossRef]
  43. Soller, M.; Brody, T.; Genizi, A. On the power of experimental designs for the detection of linkage between marker loci and quantitative loci in crosses between inbred lines. Theor. Appl. Genet. 1976, 47, 35–39. [Google Scholar] [CrossRef] [PubMed]
  44. Lander, E.S.; Botstein, D. Mapping mendelian factors underlying quantitative traits using RFLP linkage maps. Genetics 1989, 121, 185–199. [Google Scholar] [CrossRef]
  45. Knapp, T.R. Treating ordinal scales as interval scales: An attempt to resolve the controversy. Nurs. Res. 1990, 39, 121–123. [Google Scholar] [CrossRef] [PubMed] [Green Version]
  46. Haley, C.S.; Knott, S.A. A simple regression method for mapping quantitative trait loci in line crosses using flanking markers. Heredity 1992, 69, 315–324. [Google Scholar] [CrossRef] [Green Version]
  47. Song, K.; Slocum, M.; Osborn, T. Molecular marker analysis of genes controlling morphological variation in Brassica rapa (syn. campestris). Theor. Appl. Genet. 1995, 90, 1–10. [Google Scholar] [CrossRef]
  48. Kosambi, D.D. The estimation of a map distance from recombination values. Ann. Eugen. 1994, 12, 172–175. [Google Scholar] [CrossRef]
  49. Larntz, K. Small-sample comparisons of exact levels for chi-squared goodness-of-fit statistics. J. Am. Stat. Assoc. 1978, 73, 253–263. [Google Scholar] [CrossRef]
  50. Mutschler, M.A.; Doerge, R.W.; Liu, S.C.; Kuai, J.P.; Liedl, B.E.; Shapiro, J.A. QTL analysis of pest resistance in the wild tomato Lycopersicon pennellii: QTLs controlling acylsugar level and composition. Theor. Appl. Genet. 1996, 92, 709–718. [Google Scholar] [CrossRef]
  51. Baloch, M.J.; Veesar, N.F. Identification of plant traits for characterization of early maturing upland cotton varieties. Biol. Sci.-PJSIR 2007, 50, 128–132. [Google Scholar]
  52. Reddy, K.R.; Hodges, H.F.; Reddy, V.R. Temperature effects on cotton fruit retention. Agron. J. 1992, 84, 26–30. [Google Scholar] [CrossRef]
  53. Azhar, F.M.; Ali, Z.; Akhtar, M.M.; Khan, A.A.; Trethowan, R. Genetic variability of heat tolerance, and its effect on yield and fibre quality traits in upland cotton (Gossypium hirsutum L.). Plant Breed. 2009, 128, 356–362. [Google Scholar] [CrossRef]
  54. Hussain, M.; Azhar, F.M.; Khan, A.A. Genetics of inheritance and correlations of some morphological and yield contributing traits in upland cotton. Pak. J. Bot. 2009, 41, 2975–2986. [Google Scholar]
  55. Wang, D. RFLP Mapping, QTL Identification, and Cytogenetic Analysis in Sour Cherry; Michigan State University: East Lansing, MI, USA, 1998. [Google Scholar]
  56. Siddique, M.R.B.; Hamid, A.I.M.S.; Islam, M.S. Drought stress effects on water relations of wheat. Bot. Bull. Acad. Sin. 2000, 41, 35–39. [Google Scholar]
  57. Baloch, A.; Rind, A.; Jamali, K. Genetic maps and marker assisted selection for major gene traits in rice. Pak. J. Biotechnol. 2004, 1, 33–46. [Google Scholar]
  58. Parida, A.K.; Dagaonkar, V.S.; Phalak, M.S.; Umalkar, G.V.; Aurangabadkar, L.P. Alterations in photosynthetic pigments, protein and osmotic components in cotton genotypes subjected to short-term drought stress followed by recovery. Plant Biotechnol. Rep. 2007, 1, 37–48. [Google Scholar] [CrossRef]
  59. Guo, W.; Cai, C.; Wang, C.; Han, Z.; Song, X.; Wang, K.; Niu, X.; Wang, C.; Lu, K.; Shi, B.; et al. A microsatellite-based, gene-rich linkage map reveals genome structure, function and evolution in Gossypium. Genetics 2007, 176, 527–541. [Google Scholar] [CrossRef] [Green Version]
  60. Malik, R.S.; Dhankar, J.S.; Turner, N.C. Influence of soil water deficits on root growth of cotton seedlings. Plant Soil 1979, 53, 109–115. [Google Scholar] [CrossRef]
  61. Baloch, A.W.; Solangi, A.M.; Baloch, M.; Baloch, G.M.; Abro, S. Estimation of heterosis and heterobeltiosis for yield and fiber traits in F1 hybrids of upland cotton (Gossypium hirsutum L.) genotypes. Pak. J. Agri. Agril. Engg. Vet. Sci. 2015, 31, 221–228. [Google Scholar]
  62. Peng, M.W. Global Strategy. Cengage Learning; Cengage 200 Pier 4 Boulevard: Boston, MA, USA, 2021. [Google Scholar]
  63. Raison, J.K.; Berry, J.A.; Armond, P.A.; Pike, C.S. Membrane properties in relation to the adaptation of plants to temperature stress. In Adaptation of Plants to Water and High Temperature Stress; Turner, N.C., Kramer, P.J., Eds.; John Wiley and Sons: New York, NY, USA, 1980; pp. 261–273. [Google Scholar]
  64. Kushanov, F.N.; Turaev, O.S.; Ernazarova, D.K.; Gapparov, B.M.; Oripova, B.B.; Kudratova, M.K.; Abdurakhmonov, I.Y. Genetic diversity, QTL mapping and MAS technology in cotton (Gossypium spp.). Front. Plant Sci. 2021, 12, 29–71. [Google Scholar] [CrossRef]
  65. Iqbal, M.; Naeem, M.; Rizwan, M.; Nazeer, W.; Shahid, M.Q.; Aziz, U.; Aslam, T.; Ijaz, M. Studies of genetic variation for yield related traits in upland cotton. Am. Eurasian J. Agric. Environ. Sci. 2013, 13, 611–618. [Google Scholar]
  66. Gipson, J.R.; Joham, H.E. Influence of night temperature on growth and development of cotton (Gossypium hirsutum L.). III. Fiber elongation. Crop Sci. 1969, 9, 127–129. [Google Scholar] [CrossRef]
  67. Odongo, I.; Ssemambo, R.; Kungu, J.M. Prevalence of Escherichia Coli and its antimicrobial susceptibility profiles among patients with UTI at Mulago Hospital, Kampala, Uganda. Interdiscip. Perspect. Infect. Dis. 2020, 2020, 8042540. [Google Scholar] [CrossRef] [PubMed] [Green Version]
  68. Rahman, M.; Yasmin, T.; Tabassum, N.; Ullah, I.; Asif, M.; Zafar, Y. Studying the extent of genetic diversity among Gossypium arboreum L. genotypes/cultivars using DNA fingerprinting. Genet. Resour. Crop Evol. 2008, 55, 331–339. [Google Scholar] [CrossRef]
  69. Shaheen, T.; Zafar, Y.; Rahman, M.-U. QTL mapping of some productivity and fibre traits in Gossypium arboreum. Turk. J. Bot. 2013, 37, 802–810. [Google Scholar] [CrossRef]
Figure 1. Mean values of phenotypic variations of morpho-physiological traits related to the heat stress of 14 cotton genotypes.
Agronomy 12 01381 g001aAgronomy 12 01381 g001b
Figure 2. (a,b) Frequency distribution of morpho-physiological traits related to heat stress across F2 population.
Agronomy 12 01381 g002aAgronomy 12 01381 g002b
Figure 3. Pearson correlation among phenotypic traits of cotton under heat stress (= + ve = - ve).
Agronomy 12 01381 g003
Figure 4. Linkage map and QTLs for heat stress tolerance determined in an F2 population made from cross among Intraspecific MNH-886 and MNH-814 (G. hirsutum). The gap indicates that the linkage distance of the primer loci > 50 (cm) indicate significant QTLs (Kosambi).
Agronomy 12 01381 g004
Table 1. Comparative Monthly Meteorological Data Recorded at CCRI, Multan.
MonthAir Temperature (°C)Relative
Humidity
Rainfall (mm)Evapotranspiration
(cm Day)
Soil Temperature (°C)
MaxMinMaxMin5 cm10 cm
January5.319.163921.50.249.410.5
February6.920.552760.00.3912.312.7
March13.927.445650.00.6719.219.7
April20.632.8557224.70.8626.527.0
May25.739.454571.101.2231.732.0
June28.639.458640.01.2635.435.4
July28.838.1617316.91.1135.836.0
August28.035.6727616.10.8434.935.1
September25.733.18087167.00.5929.830.2
October18.931.762833.20.4824.325.1
November13.126.881870.00.2817.718.6
December7.821.980874.00.1912.813.8
Table 2. Mean values data for 23 morpho-physiological traits of fourteen cotton cultivars.
CultivarsTotal Plant Height (cm)Fully Dehiscent Anther (%)Pollen Viability (%)First Sympodial Node NumberFirst Sympodial Node Height (cm)Sympodial Node Number Bearing First Effective BollSympodial Node Height (cm) Bearing First Effective BollSympodial Node Number Bearing Last Effective BollSympodial Node Height (cm) Bearing Last Effective BollPercent Boll Set on First Position along SympodiaPercent Boll Set on Second Position along Sympodia
MNH 886909288.3713.881534114.25132
CIM-557679187.4712.1814.83293.44931
NIAB-2008558986.1713.6815.23382.55032
CIM-573548885.8813.3915.931112.34831
Cyto-108678785.1714816.333108.94930
NN3888583.5712.6814.532105.64731
MNH-2007678382.2815.2917.93187.34730
CIM-588778280.5712.1815.63392.74529
BH-172808079.3710.7813.83284.54429
NIAB-852857977.5712.3814.933113.84528
GH-102777776.3712.4815.331103.24327
CIM-554667574.1714.1816.831121.24229
Shahbaz887371.2711.3813.72981.74126
MNH 814546466.4814.8917.327106.53823
Max909288815917341215132
Min54646671081327813823
Variance21960421811.701811.523.34176146
Std. Dev.±14.79±7.80±6.53±42±1.30±42±1.23±1.82±13.2±3.75±2.50
CultivarsCell Injury
(%)
Total Number of SympodesTotal Number of NodesSize of PetioleTotal Number of FlowersNumber of BollsTotal Number of BudsLength of Bract
(cm)
Length of Petal (cm)Length of Staminal ColumnLength of PistilProline Con. (μg mL−1)
MNH-8866526519.3382327542.902.9876.7
CIM-5576624437.33318234.52.92.42.464.2
NIAB-20086725407.63022283.62.82.32.460.2
CIM-5736723368.13113213.72.62.62.554.1
Cyto-1086822388.33412243.92.72.72.850
NN36820357.53022253.42.62.12.642.2
MNH-20076821367.82516263.32.52.52.735
CIM-5887025379.03815223.72.22225.8
BH-1727123398.02714193.12.82.22.517.8
NIAB-8527222388.72619203.22.82.62.714.1
GH-1027318418.52921223.52.72.72.512.3
CIM-5547420438.33220253.82.42.52.710.6
Shahbaz7619447.91811233.92.932.29.5
MNH-8148021357231214324.51.55.3
Max8026519382328544276
Min65183571811143221.55
Variance185190.412719130.290.200.360.1356
Std. Dev.±4.25±2.40±4.41±0.64±5.2±4.4±3.6±0.54±0.45±0.60±0.37±23
Table 3. Phenotypic values for heat tolerance traits of F2 population and their parents.
Population SizeTraitsParentsF2 Population Statistical Data
94 MNH-886MNH-814MaxMinMeanSDSkew
TPH90544810574.3712.070.390
FDA92646092.75.039.980.365
POV88.366.45866678.4861.890.391
FSN78797.820.8240.328
FSH13.814.81016.1013.641.134−0.224
SNF896118.640.9120.934
SNH1517.311.1017.3014.301.5680.211
SNL3427223428.923.260.002
SNB114.2106.580.5115100.199.63−0.315
PBF5138315143.445.30−0.210
PBS322323319162.47326.150.691
CIY6580509064.6010.360.477
TNS2621133921.775.330.732
TNN455164830.937.12−0.577
SOP9.374.3012.308.691.51−0.428
TNF3523182.131.251.62
NOB231214512.108.801.26
TNB2714172.921.320.796
LOB53353.940.33−0.770
LOP422.7043.650.317−0.760
LOS2.904.52.03.102.640.261−0.434
LPI2.981.52.304.002.990.3080.240
PCO5.376.65.2076.733.4327.050.274
Table 4. Stress determining physiological traits (Relative Water Content = RWC, water potential = WP, Osmotic Potential = OP, CIY = Cell injury = CIY, proline Contents = PCO).
Population SizeTraitsParents (Means)F2 Population Statistical Data
94 MNH-886MNH-814MaxMinMeanSDSkew
RWC47.6543.0654.9140.2847.653083.8159050.321
WP20.3019.00271519.652.5110.283
OP860.76805.92975727833.3465.070.382
CIY6580509064.6010.360.477
PCO5.37.667.665.36.482.050.274
Table 5. Basic characteristics of the genetic map.
ItemField Exp. Pop
Total no. of SSR loci175
No. of mapped loci171
No. of individuals94
No. of linkage groups17
No. of unlinked loci4
Length of map (cm)4402.7
Total no. of skewed loci24
Table 6. QTLs related to heat tolerance in Intraspecific cross among MNH-886 and MNH-814. (LOD = Logarithm of odds, Additive = Additional effects, Dominance/additive = ratio between dominance and additive effects, PV% = Phenotypic variance).
QTLsChr. No.SSR MarkersLOD ValueAdditiveDominanceDominance/AdditivePV% Age
First Sympodial Node Height (cm)
qFSHa115BNL786-CIR0096.100.59−0.80−1.3636.62
qFSHa215JESPR152-NAU33806.090.58−0.81−1.3935.98
Sympodial Node Height (cm)
qSNH16BNL1440-BNL28843.420.77−0.31−0.4017.59
Percent Boll Set on Second Position Along Sympodia
qPBS126BNL3510-NAU127418.190.690.350.5014.56
Total No. of Sympodes
qTNSa103NAU2836-BNL10453.596.000.410.0710.05
qTNSa203JESPR231-BNL24433.716.270.380.0610.12
qTNSa305NAU1372-NAU10423.982.89−0.50−0.1716.93
Total No. of Nodes
qTNN123CIR080-CIR2884.050.180.030.1712.91
Number of Bolls
qNOB126BNL3537-CIR0783.804.25−3.15−0.7421.52
Total Number of Buds
qTNB118BNL193-BNL25713.791.05−0.74−0.7017.67
Length of Bract
qLOBa102BNL2651-NAU36263.240.180.040.208.59
qLOBa216BNL1604-BNL29863.01−0.13−0.030.237.76
qLOBa319NAU5121-BNL40964.050.180.030.1712.91
Length of Staminal Column
qLOSa118JESPR153-NAU41053.780.520.110.2016.30
qLOSa218NAU2488-BNL25713.760.520.110.2015.84
qLOSa318BNL193-BNL25713.070.300.110.3614.57
Length of Petal
qLOP102BNL1897-BNL39713.560.45-0.02-0.0519.46
Publisher’s Note: MDPI stays neutral with regard to jurisdictional claims in published maps and institutional affiliations.

