Article

Serine Hydroxymethyltransferase (SHMT) Gene Family in Wheat (Triticum aestivum L.): Identification, Evolution, and Expression Analysis

1
College of Agriculture, Henan University of Science and Technology, Luoyang 471000, China
2
National Key Laboratory of Wheat and Maize Crop Science, Henan Agricultural University, Zhengzhou 450046, China
3
College of Agriculture, Ludong University, Yantai 264000, China
*
Authors to whom correspondence should be addressed.
Agronomy 2022, 12(6), 1346; https://doi.org/10.3390/agronomy12061346
Submission received: 29 March 2022 / Revised: 29 May 2022 / Accepted: 30 May 2022 / Published: 31 May 2022
(This article belongs to the Topic Plant Functional Genomics and Crop Genetic Improvement)

Abstract

:
Serine hydroxymethyltransferase (SHMT) plays a vital role in one-carbon metabolic, photorespiration, and various stress responses. However, the genome-wide analysis has not been performed in wheat. In this study, a total of 12 TaSHMT genes were identified in wheat and classified into groups Ⅰa, Ⅰb, and Ⅱb. TaSHMT genes in each group shared similar conserved domain distributions. Chromosomal location, synteny, and cis-elements analysis of TaSHMTs were also analyzed. Real-time PCR results indicated that most TaSHMT genes were mainly expressed in leaves and stems during the wheat seedling stage. Most TaSHMT genes could respond to various abiotic stress. The growth of yeast cells expressing TaSHMT2.1 was inhibited under salt and dehydration stress. Moreover, the gene ontology (GO) annotation and protein interaction of TaSHMT genes were analyzed. These results increase our understanding of SHMT genes and provide robust candidate genes for further functional investigations aimed at crop improvement.

1. Introduction

Wheat (Triticum aestivum L.) is one of the most important grain crops in the world and the major calorific and protein source of food. However, abiotic stress, such as drought, salinity, cold, and heat stress, severely affect the yield of wheat during wheat growth and development periods [1]. Therefore, mining stress-resistant genes and cultivating stress-resistant varieties are the most important strategies to improve wheat quality and production.
Serine hydroxymethyltransferase (SHMT, EC 2.1.2.1), a pyridoxal phosphate-dependent enzyme, catalyzes the interconversion of serine and tetrahydrofolate to glycine and methylenetetrahydrofolate, and participates in one-carbon metabolism, methionine synthesis, and maintenance of redox homeostasis during photorespiration [2,3,4,5]. SHMT genes have been extensively identified in prokaryotes and eukaryotes, forming homodimeric structures in prokaryotes and tetramers in eukaryotes [6,7].
In plants, SHMT genes play a vital role in the photorespiratory cycle and participate in modulating the level of reactive oxygen species (ROS) to improve abiotic and biotic stress resistance [3,7,8]. The Arabidopsis (Arabidopsis thaliana L.) mutant shmt1-1 was more susceptible than wild-type plants when infected with biotrophic and necrotrophic pathogens [9]. The shmt1-1 mutants led to the reduction in mass and chlorophyll content, and greater accumulation of H2O2 compared with wild-type plants when subjected to salt and drought stress [3,9]. AtSHMT1 was also involved in regulating ABA-induced stomatal closure [3]. OsSHMT played a role in scavenging H2O2 to enhance the chilling tolerance in rice [10]. The overexpression of OsSHMT3 improved the tolerance to salinity stress in E. coli (Escherichia coli) and Arabidopsis [7]. Nevertheless, SHMT genes also play negative roles in adapting to adverse conditions, for example, SHMT gene OsCADT1 mutants enhanced cadmium tolerance compared with wild-type plants [11].
SHMT genes have been identified in diverse plants, such as Arabidopsis, rice (Oryza sativa L.), soybean (Glycine max (L.) Merr.), and tomato (Solanum lycopersicum L.) [7,8,9,12]; however, a genome-wide identification of SHMT genes in wheat has not been performed. In this study, a genome-wide analysis of SHMT genes was performed in wheat to characterize their sequences, evolutionary relationships, expression patterns, and stress tolerance in yeast cells under various abiotic stress treatments. These results will provide a valuable foundation for further functional studies of TaSHMT genes under abiotic stress.

2. Materials and Methods

2.1. Identification of the SHMT Family Genes

The genome sequence of T. aestivum (IWGSC.52) was downloaded from EnsemblPlants database (http://plants.ensembl.org/index.html) (accessed on 1 March 2022). The Hidden Markov Model (HMM) profiles (http://pfam.xfam.org) (accessed on 1 March 2022) of the SHMT domain (PF00464) obtained from the Pfam database (http://pfam.xfam.org) (accessed on 1 March 2022) was used to HMM-search against the local genome database of T. aestivum using TBtools [13]. All the identified TaSHMT candidates were verified by using Pfam (http://www.ebi.ac.uk/Tools/hmmer/) (accessed on 1 March 2022) and SMART databases (http://smart.embl.de/) (accessed on 1 March 2022); then, we retrieved 12 TaSHMT genes. The physiological and biochemical parameters of the TaSHMT proteins were analyzed by WheatOmics 1.0 (http://202.194.139.32/) (accessed on 1 March 2022) [14], and the subcellular localization of the TaSHMT proteins was predicted using Plant-mPLoc (http://www.csbio.sjtu.edu.cn/bioinf/plant-multi/) (accessed on 1 March 2022).

2.2. Phylogenetic Relationships, Gene Structures, and Domains Analysis

The phylogenetic tree was constructed by the Maximum Likelihood (ML) method with 1000 bootstrap replicates using TBtools software and Evolview online service [13,15]. The amino acid sequences of SHMT in Arabidopsis (AtSHMT), soybean (GmSHMT), and tomato (SlSHMT) were obtained from a previous report [12]. The exon–intron structures were identified by comparing CDS and genomic DNA sequences using TBtools [13]. The conserved domains and motifs were annotated using the SMART database (http://smart.embl.de/) (accessed on 1 March 2022) and MEME online server (http://meme-suite.org/index.html) (accessed on 1 March 2022).

2.3. Chromosomal Location, Synteny, and Ka/Ks Analysis

The position of TaSHMT genes on the chromosome was obtained according to wheat genome annotation data and then marked on the chromosomes by using the TBtools and circos [13,16]. Multiple collinear scanning toolkits (MCScanX) were used to detect the gene replication events [17]. TBtools was used to determine the Ka (nonsynonymous rate), Ks (synonymous rate), and Ka/Ks ratios of the syntenic gene pair with the Nei–Gojobori (NG) method [13].

2.4. GO Annotation and Protein Interactions Analysis

Gene Ontology (GO) annotation of TaSHMT proteins was analyzed using the eggNOG-mapper (http://eggnog-mapper.embl.de/) (accessed on 1 March 2022) and Pannzer2 (http://ekhidna2.biocenter.helsinki.fi/sanspanz/) (accessed on 1 March 2022), then displayed by the WEGO2.0 website (https://wego.genomics.cn/) (accessed on 1 March 2022). Protein–protein interactions (PPIs) were predicted using the STRING database (https://string-db.org/) (accessed on 1 March 2022). The combined score >0.9 in the STRING database was used to confirm the interaction network.

2.5. Cis-Element Analysis in the Promoter

The promoter sequences, 1.5 kb upstream sequences of the transcription start site (TSS) of the TaSHMT genes, were acquired from the wheat database, and the cis-elements in the promoters were analyzed using the PlantCARE database (http://bioinformatics.psb.ugent.be/webtools/plantcare/html/) (accessed on 1 March 2022) [18].

2.6. Real-Time PCR Analysis

Wheat seeds of “Chinese Spring” (Triticum aestivum L., hexaploid), which were obtained from the Northwest A&F University, were germinated on moist filter paper at 25/18 °C (day/night) with a photoperiod of 16 h light/8 h dark at Henan University of Science and Technology. Leaves, stems, and roots tissues were collected from wheat seedlings grown in a hydroponics culture (ddhH2O) for one week. For abiotic stress treatment, seedlings grown in a hydroponic culture (ddhH2O) for one week were exposed to 20% PEG6000 (w/v), high salinity (300 mM NaCl), high temperature (42 °C), and cold (4 °C) [19]. Sixty seedlings with similar growth were selected to place in the same Petri dish with moist filter paper for each stress treatment, and the leaves tissues were collected as a mixed sample from three wheat seedlings at 0 h, 1 h, and 6  h with three biological replicates, then frozen in liquid nitrogen and stored at −80 °C [19].
RNAiso Plus (Takara, Kusatsu, Japan) was used to isolate total RNA from each frozen sample, and the first-strand cDNA was synthesized from total RNA (1 μg) by using Prescript Ⅲ RT ProMix (CISTRO) according to the manufacturer’s instructions. The sequence was amplified using gene-specific primers (Table S6) with 2× Ultra SYBR Green qPCR Mix (CISTRO), and the actin gene was used as an internal control. The real-time PCR cycling parameters were 95 °C for 30 s, followed by 45 cycles at 95 °C for 5 s and 60 °C for 30 s, with a melting curve analysis. The relative expression levels were calculated based on the 2△△CT method [20]. All reactions were performed in three technical replicates and three biological replicates to ensure the reproducibility of the results.

2.7. Stress Tolerance Assay in Yeast Cells

The coding sequence (CDS) of TaSHMT genes was cloned into a pGADT7 vector using the BM seamless cloning kit (Biomed, London, UK), and then transformed into yeast cells BY4741 (Δhog1) (MATa, his3∆1, leu2∆0, met15∆0, ura3∆0, hog1::KanMX4). The primers are shown in Table S6. To analyze stress resistance, the yeast cells carrying the empty vector (pGADT7) or pGADT7-TaSHMT2.1 were cultured in YPD liquid medium (1% yeast extract, 2% peptone, 2% glucose) at 30 ℃ until the density reached an OD600 of 1.0, then serially diluted (10−1, 10−2, 10−3, 10−4, 10−5) with ddH2O. The cells were spotted onto SD/-Leu medium plates containing NaCl (0.3, 0.4, and 0.5 M) or D-Sorbitol (0.8, 1.0, and 1.2 M), and cultured at 30 °C for 3 days.

3. Results

3.1. Characteristics and Phylogenetic Analysis of TaSHMTs in T. aestivum

A total of 12 SHMT genes were identified in the wheat genome according to a Hidden Markov Model (HMM) search against the SHMT domain (PF00464). Based on the chromosome distributions and phylogenetic relationships of TaSHMT genes, we named them from TaSHMT1 to TaSHMT12 (Table 1). The length of the identified TaSHMT proteins ranged from 471 (TaSHMT4.1, TaSHMT5.1, and TaSHMT6.1) to 585 (TaSHMT7.1) amino acid residues with the putative molecular weights ranging from 51.45 to 63.64 kDa. The predicted isoelectric point (pI) value varied from 7.17 (TaSHMT7.1) to 8.50 (TaSHMT12.1), and the calculated grand average of hydrophilic index (GRAVY) was from −0.191 (TaSHMT5.1) to −0.379 (TaSHMT7.1), suggesting that all TaSHMT proteins were alkalescent (pI > 7) and highly hydrophilic proteins. In addition, the subcellular localization of the identified TaSHMT proteins was also predicted, where all TaSHMT proteins were localized in the mitochondrion.
To further investigate the phylogenetic relationships of TaSHMTs, the phylogenetic tree was constructed with the amino acid sequences of SHMT from Arabidopsis, soybean, tomato, and wheat (Figure 1 and Table S1). The SHMT genes were divided into four groups: Ⅰa, Ⅰb, Ⅱa, and Ⅱb. Groups Ⅰa, Ⅰb, and Ⅱb included six (TaSHMT1-TaSHMT6), three (TaSHMT7-TaSHMT9), and three TaSHMT genes (TaSHMT10-TaSHMT12), respectively. However, group Ⅱa members did not exist in the wheat genome (Figure 1).

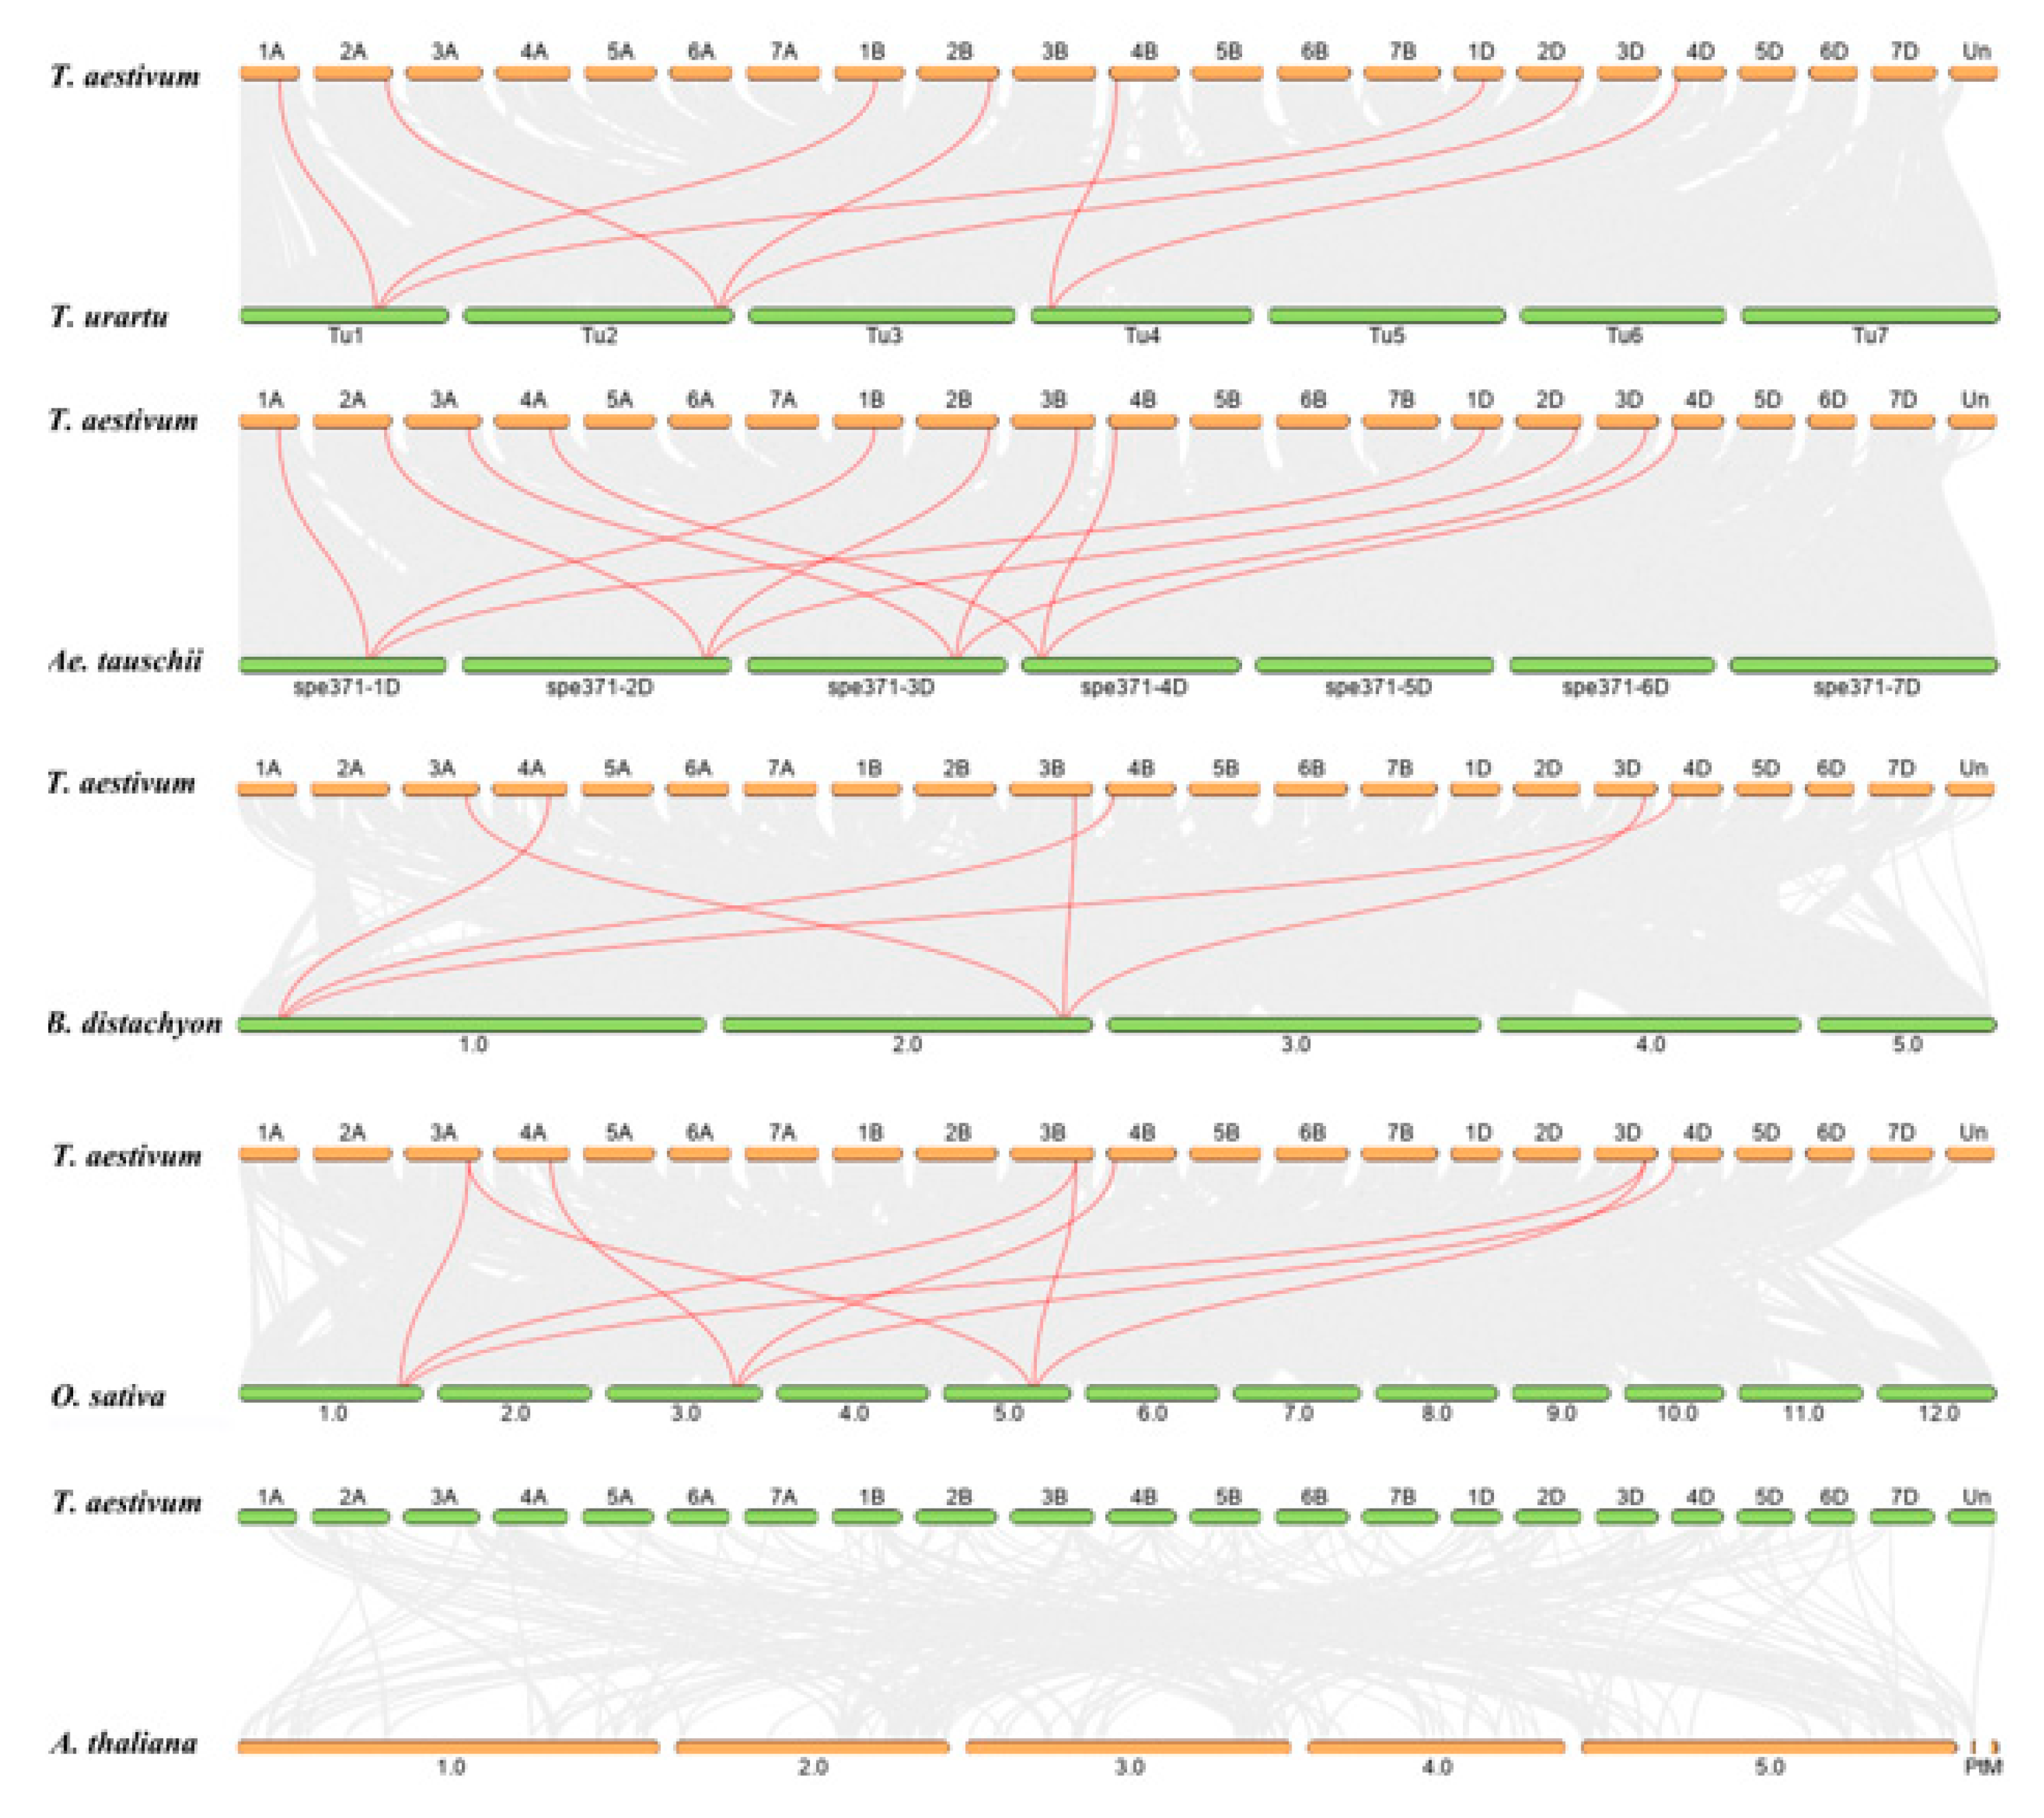
3.2. Chromosomal Distribution, Synteny, and Ka/Ks Analysis of TaSHMTs

The chromosomal distributions of the identified TaSHMT genes were visualized according to the wheat genome annotation information using the TBtools software (Figure 2 and Table 1). Twelve TaSHMT genes were evenly distributed on A, B, and D subgenomes, located on chromosomes 1, 2, 3, and 4. Chromosomes 1A, 2A, 3A, 4A, 1B, 2B, 3B, 4B, 1D, 2D, 3D, and 4D contained one TaSHMT genes, respectively. Subsequently, gene duplication events of 12 TaSHMT genes were also analyzed by MCScanX [17]. A total of 12 paralogous TaSHMT gene pairs (TaSHMT1/2/3, TaSHMT4/5/6, TaSHMT7/8/9, and TaSHMT10/11/12) were identified in the wheat genome, which all underwent WGD (whole-genome duplication) or segmental duplication events (Figure 2 and Table S2). Ka/Ks (the nonsynonymous and synonymous substitution ratio) values of paralogous gene pairs were all less than 1, indicating that TaSHMT genes were under strong purifying/negative selection to maintain the function of the TaSHMT gene family.
Furthermore, we also analyzed the collinearity relationships between TaSHMT genes and other SHMT genes from five representative species, including one dicotyledonous (A. thaliana) and four monocotyledonous (Triticum urartu Thumanjan ex Gandilyan, Aegilops tauschii Coss., Brachypodium distachyon (L.) P.Beauv., and Oryza sativa L.) plants (Figure 3 and Table S3). A total of 8, 12, 6, and 9 orthologous gene pairs of SHMT genes were detected between wheat and T. urartu, Ae. tauschii, B. distachyon, or O. sativa, respectively. However, there were no collinearity relationships between TaSHMT genes and A. thaliana SHMT genes. Moreover, wheat (AABBDD, hexaploid) A and D subgenomes originated from T. urartu (AA, diploid) and Ae. tauschii (DD, diploid), respectively. The collinearity analysis indicated that 2 orthologous gene pairs between the wheat A subgenome and T. urartu genome were located on the same chromosomes with one on chromosome 1A (TaSHMT1/TuG1812G0100002585.01), and one on chromosome 2A (TaSHMT4/TuG1812G0200005558.01). Similarly, four orthologous gene pairs between the wheat D subgenome and Ae. tauschii genome were detected, which were located on the same chromosomes with one on chromosome 1D (TaSHMT3/AET1Gv20548400), one on chromosome 2D (TaSHMT6/AET2Gv21086900), one on chromosome 3D (TaSHMT9/AET3Gv20859600), and one on chromosome 4D (TaSHMT12/AET4Gv20142100). These TaSHMT genes might be originated from orthologous genes in T. urartu and Ae. tauschii with the occurrence of natural hybridization events.

3.3. Gene Structure and Conserved Motifs and Cis-Elements Analysis of TaSHMT Genes

To better understand the structural characteristics of TaSHMT genes, the exon–intron structures and conserved motifs of TaSHMT genes were analyzed (Figure 4). A total of 12 TaSHMT genes contained exons varying from 4 to 15 exons. Group Ⅰa and Ⅰb members possessed 4 exons, except TaSHMT8 had 5 exons. All group Ⅱb members included 15 exons (Figure 4B and Table 1). The TaSHMT genes in the same groups had more similar exon-intron structures, such as in TaSHMT4/TaSHMT5/TaSHMT6 and TaSHMT10/TaSHMT11/TaSHMT12. Furthermore, conserved motifs of TaSHMTs were analyzed by the MEME online server; ten motifs (motif 1–motif 10) were identified among 12 TaSHMT genes (Figure 4C and Figure 5 and Figure S1). All TaSHMTs contained motif 1, 2, 3, 4, 5, 6, 7, and 9, which formed the typical SHMT domain. Motif 8 was present in group Ⅰa and Ⅱb members, but absent in group Ⅰb members. Motif 10 was unique to TaSHMT1, 2, and 3. The conserved motifs of TaSHMTs in the same group were more similar, indicating that the structures of TaSHMTs were highly conserved.
The specific cis-elements in the promoter can regulate the gene expression in order to perform different functions in plant growth, development, and various stress responses. To further investigate the functions of TaSHMT genes, 1.5 kb upstream sequences of each TaSHMT gene transcription start site (TSS) were extracted and then predicted the potential cis-elements associated with hormone and stress response using the PlantCARE database (Figure 4C and Table S4). Various hormone-responsive elements were identified in the promoter of the TaSHMT gene, including ABRE (abscisic acid-responsive element), CGTCA-motif (methyl jasmonate-responsive element), GARE (gibberellin-responsive element), TATC-box (gibberellin-responsive element), TCA-element (salicylic acid-responsive element), and TGA-element (auxin-responsive element). ABRE (85.7%) and CGTCA-motif (71.4%) were present in most TaSHMT gene promoters. Moreover, stress-responsive elements were also found, e.g., DRE (dehydration-responsive element), LTRE (low temperature-responsive element), MBS (MYB binding site), MYC, STRE (stress-responsive element), TC-rich repeats (stress-responsive element), and W box (WRKY transcription factor binding site). MBS, MYC, and STRE elements existed in all promoters of TaSHMT genes, and MBS elements were especially abundantly present in the promoters. These results suggested that the TaSHMT genes might respond to various hormone and stresses in wheat.

3.4. Expression Patterns of TaSHMT Genes in Different Tissues

To investigate the tissue-specific TaSHMT genes in wheat, the gene expression levels of eight selected TaSHMT genes belonging to group Ⅰa (TaSHMT1, 2, and 6), group Ⅰb (TaSHMT7 and 9), and group Ⅱb (TaSHMT10, 11, and 12) members were determined by using real-time PCR in roots, stems, and leaves tissues during the wheat seedling stage (Figure 6A). The results showed that TaSHMT genes were mainly expressed in leaves and stems. Group Ⅰa and Ⅰb members exhibited different expression profiles in the roots, stems, and leaves of wheat. TaSHMT1 and 6 were highly expressed in stems. TaSHMT2 and 7 displayed the highest expression levels in leaves. TaSHMT9 showed the highest expression levels in roots. Group Ⅱb members (TaSHMT10, 11, and 12) showed similar expression patterns, exhibiting the highest expression levels in leaves, followed by stems, and finally in roots. These results suggested that the majority of the TaSHMT genes might perform functions in leaves and stems.

3.5. Expression Patterns of TaSHMT Genes under Abiotic Stress

To further investigate the function of TaSHMT genes, real-time PCR was used to detect the expression profiles of 8 TaSHMT genes under PEG, NaCl, cold, and heat stress in leaves during the wheat seedling stage (Figure 6). The expressions of TaSHMT1, 2, 10, and 11 were obviously down-regulated after PEG, NaCl, or cold stress treatments compared with the control, whereas TaSHMT6 and 9 were up-regulated. TaSHMT7 was slightly up-regulated under PEG and cold stress, with no obvious change under NaCl stress. For heat stress, the expression levels of TaSHMT1, 7, and 9 were increased, peaking at 6, 1, and 1 h approximately 2.3-, 1.9-, and 3.9-fold compared with the control, respectively. TaSHM2, 6, 10, and 11 were down-regulated after heat stress. TaSHMT12 was initially down-regulated and then increased to a peak at 6 h under PEG stress. TaSHMT12 was gradually down-regulated under NaCl stress, increased under heat stress, and no obvious changed under cold stress. These results suggested that TaSHMT genes had a different response to different stresses and play various regulatory roles in abiotic stress resistance.

3.6. TaSHMT2.1 Negatively Regulates Dehydration and Salt Stress Tolerance in Yeast Cells

To gain insight into the function of TaSHMT genes under dehydration and salt stress, we cloned TaSHMT2.1 into the pGADT7 vector, and then transformed into the yeast cells BY4741 (Δhog1) to verify the ability in response to stress tolerance in yeast cells (Figure 7). The results suggested that the growth of the Δhog1 yeast cells containing these recombinant vector pGADT7-TaSHMT2.1 was inhibited in the SD/-Leu medium containing NaCl and D-Sorbitol compared with the control (pGADT7 empty vector), and the growth of yeast cells was inhibited more obviously with the increases in NaCl or D-Sorbitol concentration. These results revealed that TaSHMT2.1 might negatively regulate the tolerance of salt and dehydration stress in wheat.

3.7. GO Annotation and Protein–Protein Interactions of TaSHMTs

To further understand the function of TaSHMT from molecular levels, all TaSHMT proteins were annotated by gene ontology (GO) (Figure 8A). These TaSHMT proteins were assigned with 26 GO terms belonging to the cellular component, molecular function, and biological process. Under the molecular function category, all TaSHMTs were involved in serine binding (GO:0070905), pyridoxal phosphate binding (GO:0030170), catalytic activity (GO:0003824), glycine hydroxymethyltransferase activity (GO:0004372), and methyltransferase activity (GO:0008168). Under the biological process category, most were involved in the metabolic process (GO:0008152), developmental process (GO:0032502), regulation of biological process (GO:0050789), response to stimulus (GO:0050896), rhythmic process (GO:0048511), and immune system process (GO:0002376). According to protein–protein interactions (PPIs) analysis, we identified six TaSHMTs interacting with six other wheat proteins (Figure 8B). The results suggested that TaSHMT3.1, TaSHMT4.1, TaSHMT6.1, TaSHMT8.1, TaSHMT9.1, and TaSHMT12.1 could interact with each other, and they all could interact with aminomethyltransferase (Traes_2AL_2E2DFB904.1, Traes_2BL_2768AE3B1.1, and Traes_2BL_79F69A456.2) and bifunctional dihydrofolate reductase-thymidylate synthase (Traes_2AL_44B0F2E5E.1 and Traes_2BL_0021AA419.1) (Figure 8B and Table S5). These results provided a valuable foundation for future functional investigations of TaSHMT genes.

4. Discussion

SHMT genes have been identified in different species, such as Arabidopsis (7 members), rice (5 members), soybean (18 members), and tomato (7 members) [7,8,9,12,21]. However, SHMT genes have not been genome-wide-identified in the wheat genome. In this study, 12 SHMT genes were identified in the wheat genome, and they were evenly distributed on wheat A, B, and D subgenomes (Figure 1 and Table 1). Gene replication is the most common mechanism contributing to expansion of the gene family, and results in functional differentiation, which is critical for environmental adaptation and speciation [22,23]. In this study, twelve paralogous gene pairs were identified among 12 TaSHMT genes in the wheat genome, which all underwent WGD or segmental duplication events and a strong purifying selection pressure (Figure 2 and Table S2). These results indicated that WGD or segmental duplications played crucial roles in the expansion of the TaSHMT genes. Ka/Ks values of paralogous gene pairs were all less than 1, indicating that TaSHMT genes were under strong purifying/negative selection to maintain the function of the TaSHMT gene family.
Wheat (AABBDD, hexaploid) A and D subgenomes originated from T. urartu (AA, diploid) and Ae. tauschii (DD, diploid), respectively. Therefore, we analyzed the synteny relationships between TaSHMT genes in wheat and other SHMT genes in T. urartu or Ae. tauschii, respectively (Figure 3 and Table S3). TaSHMT genes, which were located on the same chromosomes between wheat A/D subgenomes and the T. urartu/Ae. tauschii genome, might have originated from orthologous genes in T. urartu/Ae. tauschii with the occurrence of natural hybridization events, such as orthologous gene TaSHMT1/TuG1812G0100002585.01 located on chromosome 1A. Phylogenetic analysis showed that SHMT genes in land plants were classified into four groups: Ⅰa, Ⅰb, Ⅱa, and Ⅱb, which is consistent with previous studies. SHMT genes were also divided into four groups in soybean and tomato [8,12]. However, group Ⅱa members were absent in monocotyledon, e.g., wheat (Figure 1 and Figure 4A), rice, and maize (Zea mays L.), whereas it existed in dicotyledon, e.g., Arabidopsis, soybean, and tomato (Table S1) [8,12], probably due to the absence of chloroplast-targeted SHMTs in monocotyledon [8,24]. The absence of chloroplast-targeted TaSHMTs in wheat might be related to differences between monocotyledonous and dicotyledonous plants [8].
SHMT genes catalyze the interconversion of serine to glycine, and participates in one-carbon metabolism and photorespiration pathways [2,3]. In Arabidopsis, AtSHMT1 was mainly expressed in leaves, stems, and flowers, and AtSHMT1 mutation induces the aberrant regulation of cell death and enhances the susceptibility to pathogens and abiotic stress [3]. Real-time PCR results indicated that TaSHMT genes were mainly expressed in leaves and stems, probably due to the SHMT genes performing important roles in photorespiration (Figure 6A) [3], while TaSHMT9 was abundantly expressed in roots, which is similar to the tissue localization of SlSHMT1 and SlSHMT7 [12]. The results suggested that TaSHMT genes might play special roles in different tissues and mainly participate in photorespiration [9].
SHMT genes also play a vital role in modulating plant abiotic and biotic stress resistance [3,7,8]. The cis-elements in the promoter region of genes might regulate the expression of these genes by interacting with specific transcription factors. Various hormone and stress-responsive elements were identified in the promoter of TaSHMT genes, and ABRE and MBS elements were especially abundantly present in the promoters, suggesting that TaSHMT genes might respond to various stresses via the ABA pathway (Figure 4D and Table S4) [12]. Real-time PCR results indicated that the response of TaSHMT genes varied under different stress conditions, including PEG, salt, cold, and heat stress (Figure 6B–E), e.g., TaSHMT1, 2, 10, and 11 were down-regulated under PEG, NaCl, or cold stress compared with the control, whereas TaSHMT6 and 9 were up-regulated, suggesting a redundant function of wheat SHMTs in resisting abiotic stress [12]. Similar results were also found in tomato and barely [12,25,26]. SlSHMTs could respond to UV, cold, heat, NaCl, H2O2, ABA, and PEG treatments and showed different expression patterns, e.g., SlSHMT1 had almost no change in expression level under heat treatment, but it was significantly up-regulated under UV, cold, NaCl, H2O2, ABA, and PEG stress; however, SlSHMT2 was down-regulated under all treatments [12]. In wild barely (Hordeum spontaneum (K. Koch) Thell.) and cultivated barley (Hordeum vulgare L.), the expression levels of SHMT genes were obviously up-regulated after salt treatments [25,26]. Most SHMT genes improved the abiotic stress tolerance, for example, AtSHMT1 was involved in modulating ABA-induced stomatal closure to improve salt and drought stress tolerance [3,9]. Overexpression of OsSHMT3 improved tolerance to salinity stress in Arabidopsis [7]. Moreover, SHMT genes were also found to play negative roles in adapting to abiotic stress, for example, the rice SHMT gene OsCADT1 mutation increases Cd tolerance [11]. The growth rate of E. coli ΔglyA carrying the SHMT gene was inhibited in sorbitol or salt-containing media [27]. In our study, the growth of yeast cells expressing TaSHMT2.1 was inhibited under salt and dehydration treatment conditions, and it is reasonable for us to speculate that TaSHMT2.1 could negatively regulate wheat drought and salt stress resistance. The TaSHMT2.1 gene might be knocked out through CRISPR technology to further obtain stress-resistant wheat [28]. In summary, a genome-wide analysis of SHMT genes was performed in wheat to characterize their sequences, evolutionary relationships, expression patterns, and stress tolerance in yeast cells under various abiotic stress treatments. These results provide useful information for further functional studies of TaSHMT genes, and lay a foundation to improve wheat quality traits in molecular breeding under abiotic stress.

Supplementary Materials

The following supporting information can be downloaded at: https://www.mdpi.com/article/10.3390/agronomy12061346/s1, Figure S1: Conserved motifs of TaSHMT proteins in wheat; Table S1: SHMT genes used in the phylogenetic tree construction; Table S2: Paralogous SHMT gene pairs among T. aestivum; Table S3. Orthologous relationships between TaSHMT genes in T. aestivum with other SHMT genes in T. urartu, Ae. tauschii, B. distachyon, and O. sativa; Table S4: The cis-elements analysis in the promoter region of TaSHMT genes; Table S5: The protein–protein interaction network between TaSHMTs and other proteins in wheat; Table S6: Specific primers used in the study.

Author Contributions

Conceptualization, H.L. and N.L.; methodology, H.L.; software, H.L.; validation, H.L.; investigation, H.L.; resources, H.L., G.-Z.K., Y.-H.Z. and H.-W.X.; writing—original draft preparation, H.L., Y.-H.Z. and H.-W.X.; writing—review and editing, H.L., Y.-H.Z. and H.-W.X.; funding acquisition, H.L., Y.Z., Y.-H.Z. and H.-W.X. All authors have read and agreed to the published version of the manuscript.

Funding

This research was funded by the PhD Research Startup Foundation of Henan University of Science and Technology (13480106), Research Fund of National Key Laboratory of Wheat and Maize Crop Science (SKL2021KF03), and Natural Science Foundation of Henan Province of China (202300410137).

Institutional Review Board Statement

Not applicable.

Informed Consent Statement

Not applicable.

Data Availability Statement

The data and materials presented in this study are mentioned in the main text as well as in the Supplementary Files; further data will be provided on request from the corresponding author.

Acknowledgments

We thank Li-Lin Zhang from Tianjin University for providing the yeast cells. We also thank the help of Shu-Yan Yin from Henan University of Science and Technology.

Conflicts of Interest

The authors declare no conflict of interest.

References

  1. Gupta, P.K.; Balyan, H.S.; Sharma, S.; Kumar, R. Genetics of yield, abiotic stress tolerance and biofortification in wheat (Triticum aestivum L.). Theor. Appl. Genet. 2020, 133, 1569–1602. [Google Scholar] [CrossRef]
  2. Zhang, Y.; Sun, K.; Sandoval, F.J.; Santiago, K.; Roje, S. One-carbon metabolism in plants: Characterization of a plastid serine hydroxymethyltransferase. Biochem. J. 2010, 430, 97–105. [Google Scholar] [CrossRef] [PubMed] [Green Version]
  3. Liu, Y.; Mauve, C.; Lamothe Sibold, M.; Guérard, F.; Glab, N.; Hodges, M.; Jossier, M. Photorespiratory serine hydroxymethyltransferase 1 activity impacts abiotic stress tolerance and stomatal closure. Plant Cell Environ. 2019, 42, 2567–2583. [Google Scholar] [CrossRef] [PubMed]
  4. Bhuiyan, N.H.; Liu, W.; Liu, G.; Selvaraj, G.; Wei, Y.; King, J. Transcriptional regulation of genes involved in the pathways of biosynthesis and supply of methyl units in response to powdery mildew attack and abiotic stresses in wheat. Plant Mol. Biol. 2007, 64, 305–318. [Google Scholar] [CrossRef] [PubMed]
  5. Mcintyre, C.L.; Casu, R.E.; Rattey, A.; Dreccer, M.F.; Kam, J.W.; van Herwaarden, A.F.; Shorter, R.; Xue, G.P. Linked gene networks involved in nitrogen and carbon metabolism and levels of water-soluble carbohydrate accumulation in wheat stems. Funct. Integr. Genom. 2011, 11, 585–597. [Google Scholar] [CrossRef]
  6. Angelucci, F.; Morea, V.; Angelaccio, S.; Saccoccia, F.; Contestabile, R.; Ilari, A. The crystal structure of archaeal serine hydroxymethyltransferase reveals idiosyncratic features likely required to withstand high temperatures. Proteins Struct. Funct. Bioinform. 2014, 82, 3437–3449. [Google Scholar] [CrossRef]
  7. Mishra, P.; Jain, A.; Takabe, T.; Tanaka, Y.; Negi, M.; Singh, N.; Jain, N.; Mishra, V.; Maniraj, R.; Krishnamurthy, S.L.; et al. Heterologous expression of serine hydroxymethyltransferase-3 from rice confers tolerance to salinity stress in E. coli and arabidopsis. Front. Plant Sci. 2019, 10, 217. [Google Scholar] [CrossRef]
  8. Lakhssassi, N.; Patil, G.; Piya, S.; Zhou, Z.; Baharlouei, A.; Kassem, M.A.; Lightfoot, D.A.; Hewezi, T.; Barakat, A.; Nguyen, H.T.; et al. Genome reorganization of the GmSHMT gene family in soybean showed a lack of functional redundancy in resistance to soybean cyst nematode. Sci. Rep. 2019, 9, 1506. [Google Scholar] [CrossRef] [Green Version]
  9. Moreno, J.I.; Martin, R.; Castresana, C. Arabidopsis SHMT1, a serine hydroxymethyltransferase that functions in the photorespiratory pathway influences resistance to biotic and abiotic stress. Plant J. 2005, 41, 451–463. [Google Scholar] [CrossRef]
  10. Fang, C.; Zhang, P.; Li, L.; Yang, L.; Mu, D.; Yan, X.; Li, Z.; Lin, W. Serine hydroxymethyltransferase localised in the endoplasmic reticulum plays a role in scavenging H2O2 to enhance rice chilling tolerance. BMC Plant Biol. 2020, 20, 236. [Google Scholar] [CrossRef]
  11. Chen, J.; Huang, X.Y.; Salt, D.E.; Zhao, F.J. Mutation in OsCADT1 enhances cadmium tolerance and enriches selenium in rice grain. New Phytol. 2020, 226, 838–850. [Google Scholar] [CrossRef] [PubMed]
  12. Liu, Z.; Pan, X.; Wang, C.; Yun, F.; Huang, D.; Yao, Y.; Gao, R.; Ye, F.; Liu, X.; Liao, W. Genome-wide identification and expression analysis of serine hydroxymethyltransferase (SHMT) gene family in tomato (Solanum lycopersicum). PeerJ 2022, 10, e12943. [Google Scholar] [CrossRef] [PubMed]
  13. Chen, C.; Chen, H.; Zhang, Y.; Thomas, H.R.; Frank, M.H.; He, Y.; Xia, R. TBtools: An integrative toolkit developed for interactive analyses of big biological data. Mol. Plant 2020, 13, 1194–1202. [Google Scholar] [CrossRef]
  14. Ma, S.; Wang, M.; Wu, J.; Guo, W.; Chen, Y.; Li, G.; Wang, Y.; Shi, W.; Xia, G.; Fu, D.; et al. WheatOmics: A platform combining multiple omics data to accelerate functional genomics studies in wheat. Mol. Plant 2021, 14, 1965–1968. [Google Scholar] [CrossRef] [PubMed]
  15. Subramanian, B.; Gao, S.; Lercher, M.J.; Hu, S.; Chen, W.H. Evolview v3: A webserver for visualization, annotation, and management of phylogenetic trees. Nucleic Acids Res. 2019, 47, W270–W275. [Google Scholar] [CrossRef]
  16. Krzywinski, M.; Schein, J.; Birol, I.; Connors, J.; Gascoyne, R.; Horsman, D.; Jones, S.J.; Marra, M.A. Circos: An information aesthetic for comparative genomics. Genome Res. 2009, 19, 1639–1645. [Google Scholar] [CrossRef] [Green Version]
  17. Wang, Y.; Tang, H.; Debarry, J.D.; Tan, X.; Li, J.; Wang, X.; Lee, T.H.; Jin, H.; Marler, B.; Guo, H.; et al. MCScanX: A toolkit for detection and evolutionary analysis of gene synteny and collinearity. Nucleic Acids Res. 2012, 40, e49. [Google Scholar] [CrossRef] [Green Version]
  18. Lescot, M.; Dehais, P.; Thijs, G.; Marchal, K.; Moreau, Y.; Van de Peer, Y.; Rouze, P.; Rombauts, S. PlantCARE, a database of plant cis-acting regulatory elements and a portal to tools for in silico analysis of promoter sequences. Nucleic Acids Res. 2002, 30, 325–327. [Google Scholar] [CrossRef]
  19. Liu, H.; Yang, Y.; Zhang, L. Zinc finger-Homeodomain transcriptional factors (ZF-HDs) in wheat (Triticum aestivum L.): Identification, evolution, expression analysis and response to abiotic stresses. Plants 2021, 10, 593. [Google Scholar] [CrossRef]
  20. Livak, K.J.; Schmittgen, T.D. Analysis of relative gene expression data using real-time quantitative PCR and the 2△△CT method. Methods 2001, 25, 402–408. [Google Scholar] [CrossRef]
  21. Ohyanagi, H.; Tanaka, T.; Sakai, H.; Shigemoto, Y.; Yamaguchi, K.; Habara, T.; Fujii, Y.; Antonio, B.A.; Nagamura, Y.; Imanishi, T.; et al. The Rice Annotation Project Database (RAP-DB): Hub for Oryza sativa ssp. Japonica genome information. Nucleic Acids Res. 2006, 34, D741–D744. [Google Scholar] [CrossRef] [PubMed] [Green Version]
  22. Moore, R.C.; Purugganan, M.D. The early stages of duplicate gene evolution. Proc. Natl. Acad. Sci. USA 2003, 100, 15682–15687. [Google Scholar] [CrossRef] [PubMed] [Green Version]
  23. Lawton-Rauh, A. Evolutionary dynamics of duplicated genes in plants. Mol. Phylogenet. Evol. 2003, 29, 396–409. [Google Scholar] [CrossRef] [PubMed]
  24. Gardestroem, P.; Henricson, D.; Ericson, I.U.U.S.; Edwards, G.E. The localization of serine hydroxymethyltransferase in leaves of C3 and C4 species. Physiol. Plant. 1985, 64, 29–33. [Google Scholar] [CrossRef]
  25. Khalil, S.R.M.; Ashoub, A.; Hussein, B.A.; Brüggemann, W.; Hussein, E.H.A.; Tawfik, M.S. Physiological and molecular evaluation of ten Egyptian barley cultivars under salt stress conditions. J. Crop Sci. Biotechnol. 2022, 25, 91–101. [Google Scholar] [CrossRef]
  26. Khalil, S.R.M.; Ashoub, A.; Hussein, B.A.; Brüggemann, W.; Hussein, E.H.A.; Tawfik, M.S. Physiological and molecular studies on wild barley (hordeum spontaneum) under salt stress. Plant Arch. 2020, 20, 9669–9681. [Google Scholar]
  27. Nambiar, D.; Berhane, T.K.; Shew, R.; Schwarz, B.; Duff, M.J.; Howell, E.E. In vivo titration of folate pathway enzymes. Appl. Environ. Microbiol. 2018, 84, e01139-18. [Google Scholar] [CrossRef] [Green Version]
  28. Zhang, S.; Zhang, R.; Gao, J.; Song, G.; Li, J.; Li, W.; Qi, Y.; Li, Y.; Li, G. CRISPR/Cas9-mediated genome editing for wheat grain quality improvement. Plant Biotechnol. J. 2021, 19, 1684–1686. [Google Scholar] [CrossRef]
Figure 1. The Maximum Likelihood (ML) phylogenetic tree of SHMT proteins. The tree was constructed with amino acid sequences of identified SHMT proteins in A. thaliana (At), G. max (Gm), S. lycopersicum (Sl), and T. aestivum (Ta) with bootstrap values of 1000 replicates. Different groups of SHMT proteins are distinguished by different colors.
Agronomy 12 01346 g001
Figure 2. Chromosomal localizations and syntenic relationships among TaSHMT genes in wheat. Red lines indicate the syntenic TaSHMT gene pairs.
Agronomy 12 01346 g002
Figure 3. Syntenic relationships between TaSHMT genes in T. aestivum with other SHMT genes in five other representative plant species. Gray lines in the background indicate the collinear blocks within T. aestivum and other plant genomes. Red lines indicate the syntenic SHMT gene pairs.
Agronomy 12 01346 g003
Figure 4. Phylogenetic classification (A), exon–intron structures (B), conserved domains (C), and cis-elements (D) analysis of TaSHMT genes. (B) Green boxes, yellow boxes, and black lines indicated UTR, exons, and introns, respectively. (C) Conserved domain compositions of TaSHMT proteins in wheat. Motif 1 to motif 10 are shown in the different colors. (D) Hormone and stress-responsive elements are shown by different colors.
Agronomy 12 01346 g004
Figure 5. Multiple sequence alignment of the conserved domains of TaSHMT gene family in wheat. SHMT domain and moitf1-10 are marked.
Agronomy 12 01346 g005
Figure 6. Expression patterns of TaSHMT genes in different tissues and in response to abiotic stress in wheat. (A) Expression levels of TaSHMT genes in the roots, stems, and leaves during wheat seedlings stage. (BE) Expression patterns of TaSHMT genes in response to PEG (polyethylene glycol) (B), NaCl (C), cold (D), and heat (D) treatments determined by real-time PCR. The expression level of the wheat actin gene was used as the internal control to standardize the RNA samples for each reaction. The values are the mean ± SE (control as 1). Asterisk indicates significant differences compared with control based on Student’s t-test (* p < 0.05 and ** p < 0.01).
Agronomy 12 01346 g006
Figure 7. The ability of the tolerance in response to salt and dehydration stress in recombinant yeast cells. The yeast cells BY4741(Δhog1) carrying the empty vector (pGADT7, negative control) and pGADT7−TaSHMT2.1 were spotted onto SD/-Leu medium plates containing NaCl (0.3, 0.4, and 0.5 M) or D−Sorbitol (0.8, 1.0, and 1.2 M), and cultured at 30 °C for 3 days.
Agronomy 12 01346 g007
Figure 8. Gene ontology (GO) annotation (A) and protein–protein interactions (B) analysis of TaSHMT genes. (A) The GO terms are shown on the X axis, and the number of genes are shown on the Y axis.
Agronomy 12 01346 g008
Table 1. The characteristics of SHMT genes in wheat.
Gene NameTranscript NameTranscript IDGenomic PositionExon NumberORF (bp)Protein Length (aa)Molecular Weight (kDa)Isoelectric Point (pI)GRAVYSubcellular LocalizationGroup
TaSHMT1TaSHMT1.1TraesCS1A02G218700.11A:387359860:387363581:14160853558.248.13−0.22MitochondrionIa
TaSHMT1TaSHMT1.2TraesCS1A02G218700.21A:387359860:387363581:14160553458.118.32−0.214MitochondrionIa
TaSHMT2TaSHMT2.1TraesCS1B02G232200.11B:417264786:417268575:14159953258.058.12−0.253MitochondrionIa
TaSHMT2TaSHMT2.2TraesCS1B02G232200.21B:417264786:417268575:14160253358.187.89−0.259MitochondrionIa
TaSHMT3TaSHMT3.1TraesCS1D02G220400.11D:308179375:308183217:14160253358.037.9−0.241MitochondrionIa
TaSHMT4TaSHMT4.1TraesCS2A02G493700.12A:726022665:726026360:14141647151.467.27−0.206MitochondrionIa
TaSHMT5TaSHMT5.1TraesCS2B02G521700.12B:716779117:716782669:14141647151.457.27−0.191MitochondrionIa
TaSHMT6TaSHMT6.1TraesCS2D02G493600.12D:591019752:591023458:14141647151.467.27−0.206MitochondrionIa
TaSHMT7TaSHMT7.1TraesCS3A02G385600.13A:635148224:635152237:14175858563.647.3−0.379MitochondrionIb
TaSHMT8TaSHMT8.1TraesCS3B02G417800.13B:654648169:654651767:15154851556.628.22−0.335MitochondrionIb
TaSHMT9TaSHMT9.1TraesCS3D02G378700.13D:495915950:495920036:14175258363.377.17−0.362MitochondrionIb
TaSHMT10TaSHMT10.1TraesCS4A02G246100.14A:556751829:556756496:−115153351056.138.5−0.275MitochondrionIIb
TaSHMT11TaSHMT11.1TraesCS4B02G069300.14B:62967286:62972392:115153351056.138.5−0.275MitochondrionIIb
TaSHMT12TaSHMT12.1TraesCS4D02G068100.14D:43300118:43305497:115153351056.138.5−0.275MitochondrionIIb
Publisher’s Note: MDPI stays neutral with regard to jurisdictional claims in published maps and institutional affiliations.

