
The More Fractal the Architecture the More Intensive the Color of Flower: A Superpixel-Wise Analysis towards High-Throughput Phenotyping

 ,
,  ,
, 
Abstract
:
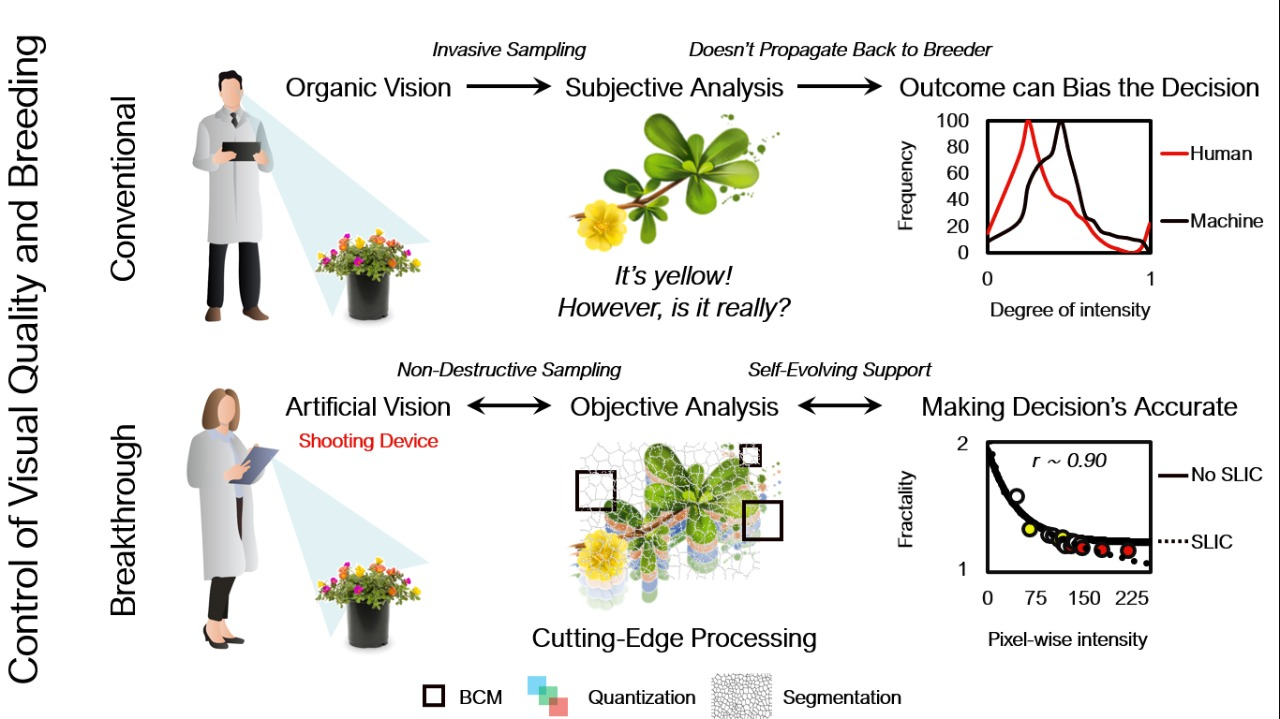
1. Introduction
2. Materials and Methods
2.1. Acquisition of Imagery Data
2.2. Processing of Imagery Data
2.3. Data Analytics
3. Results
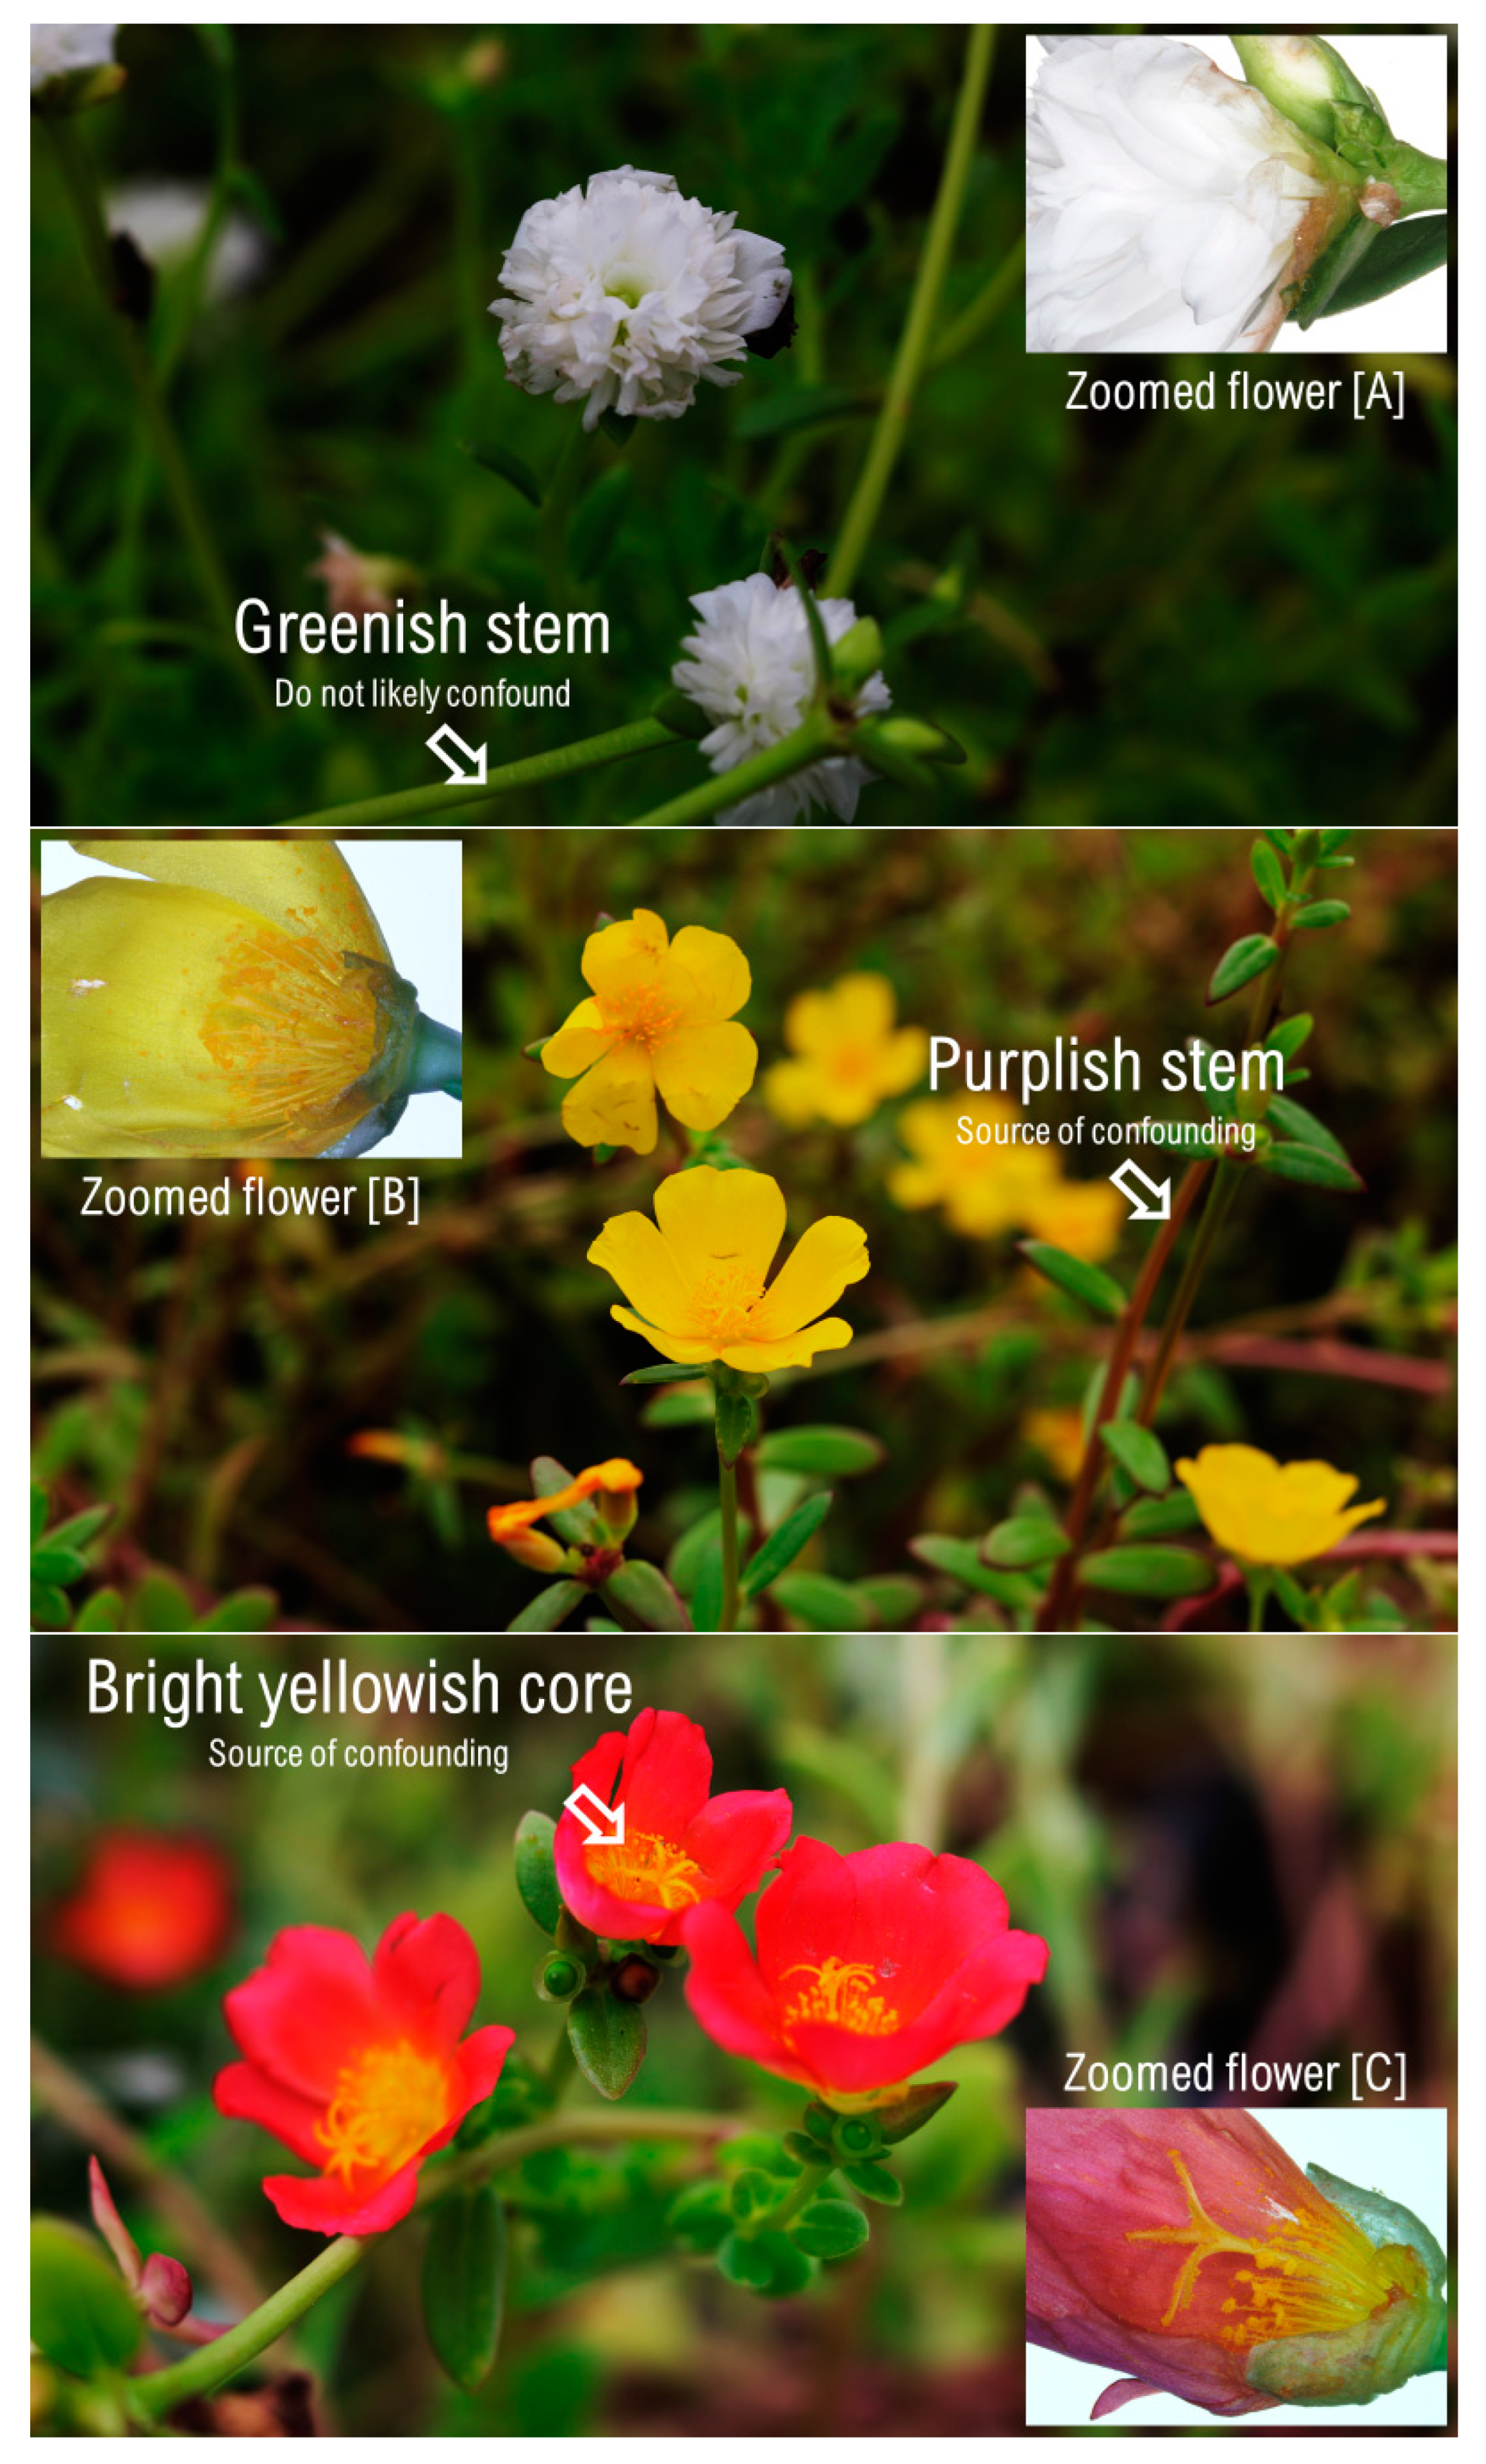
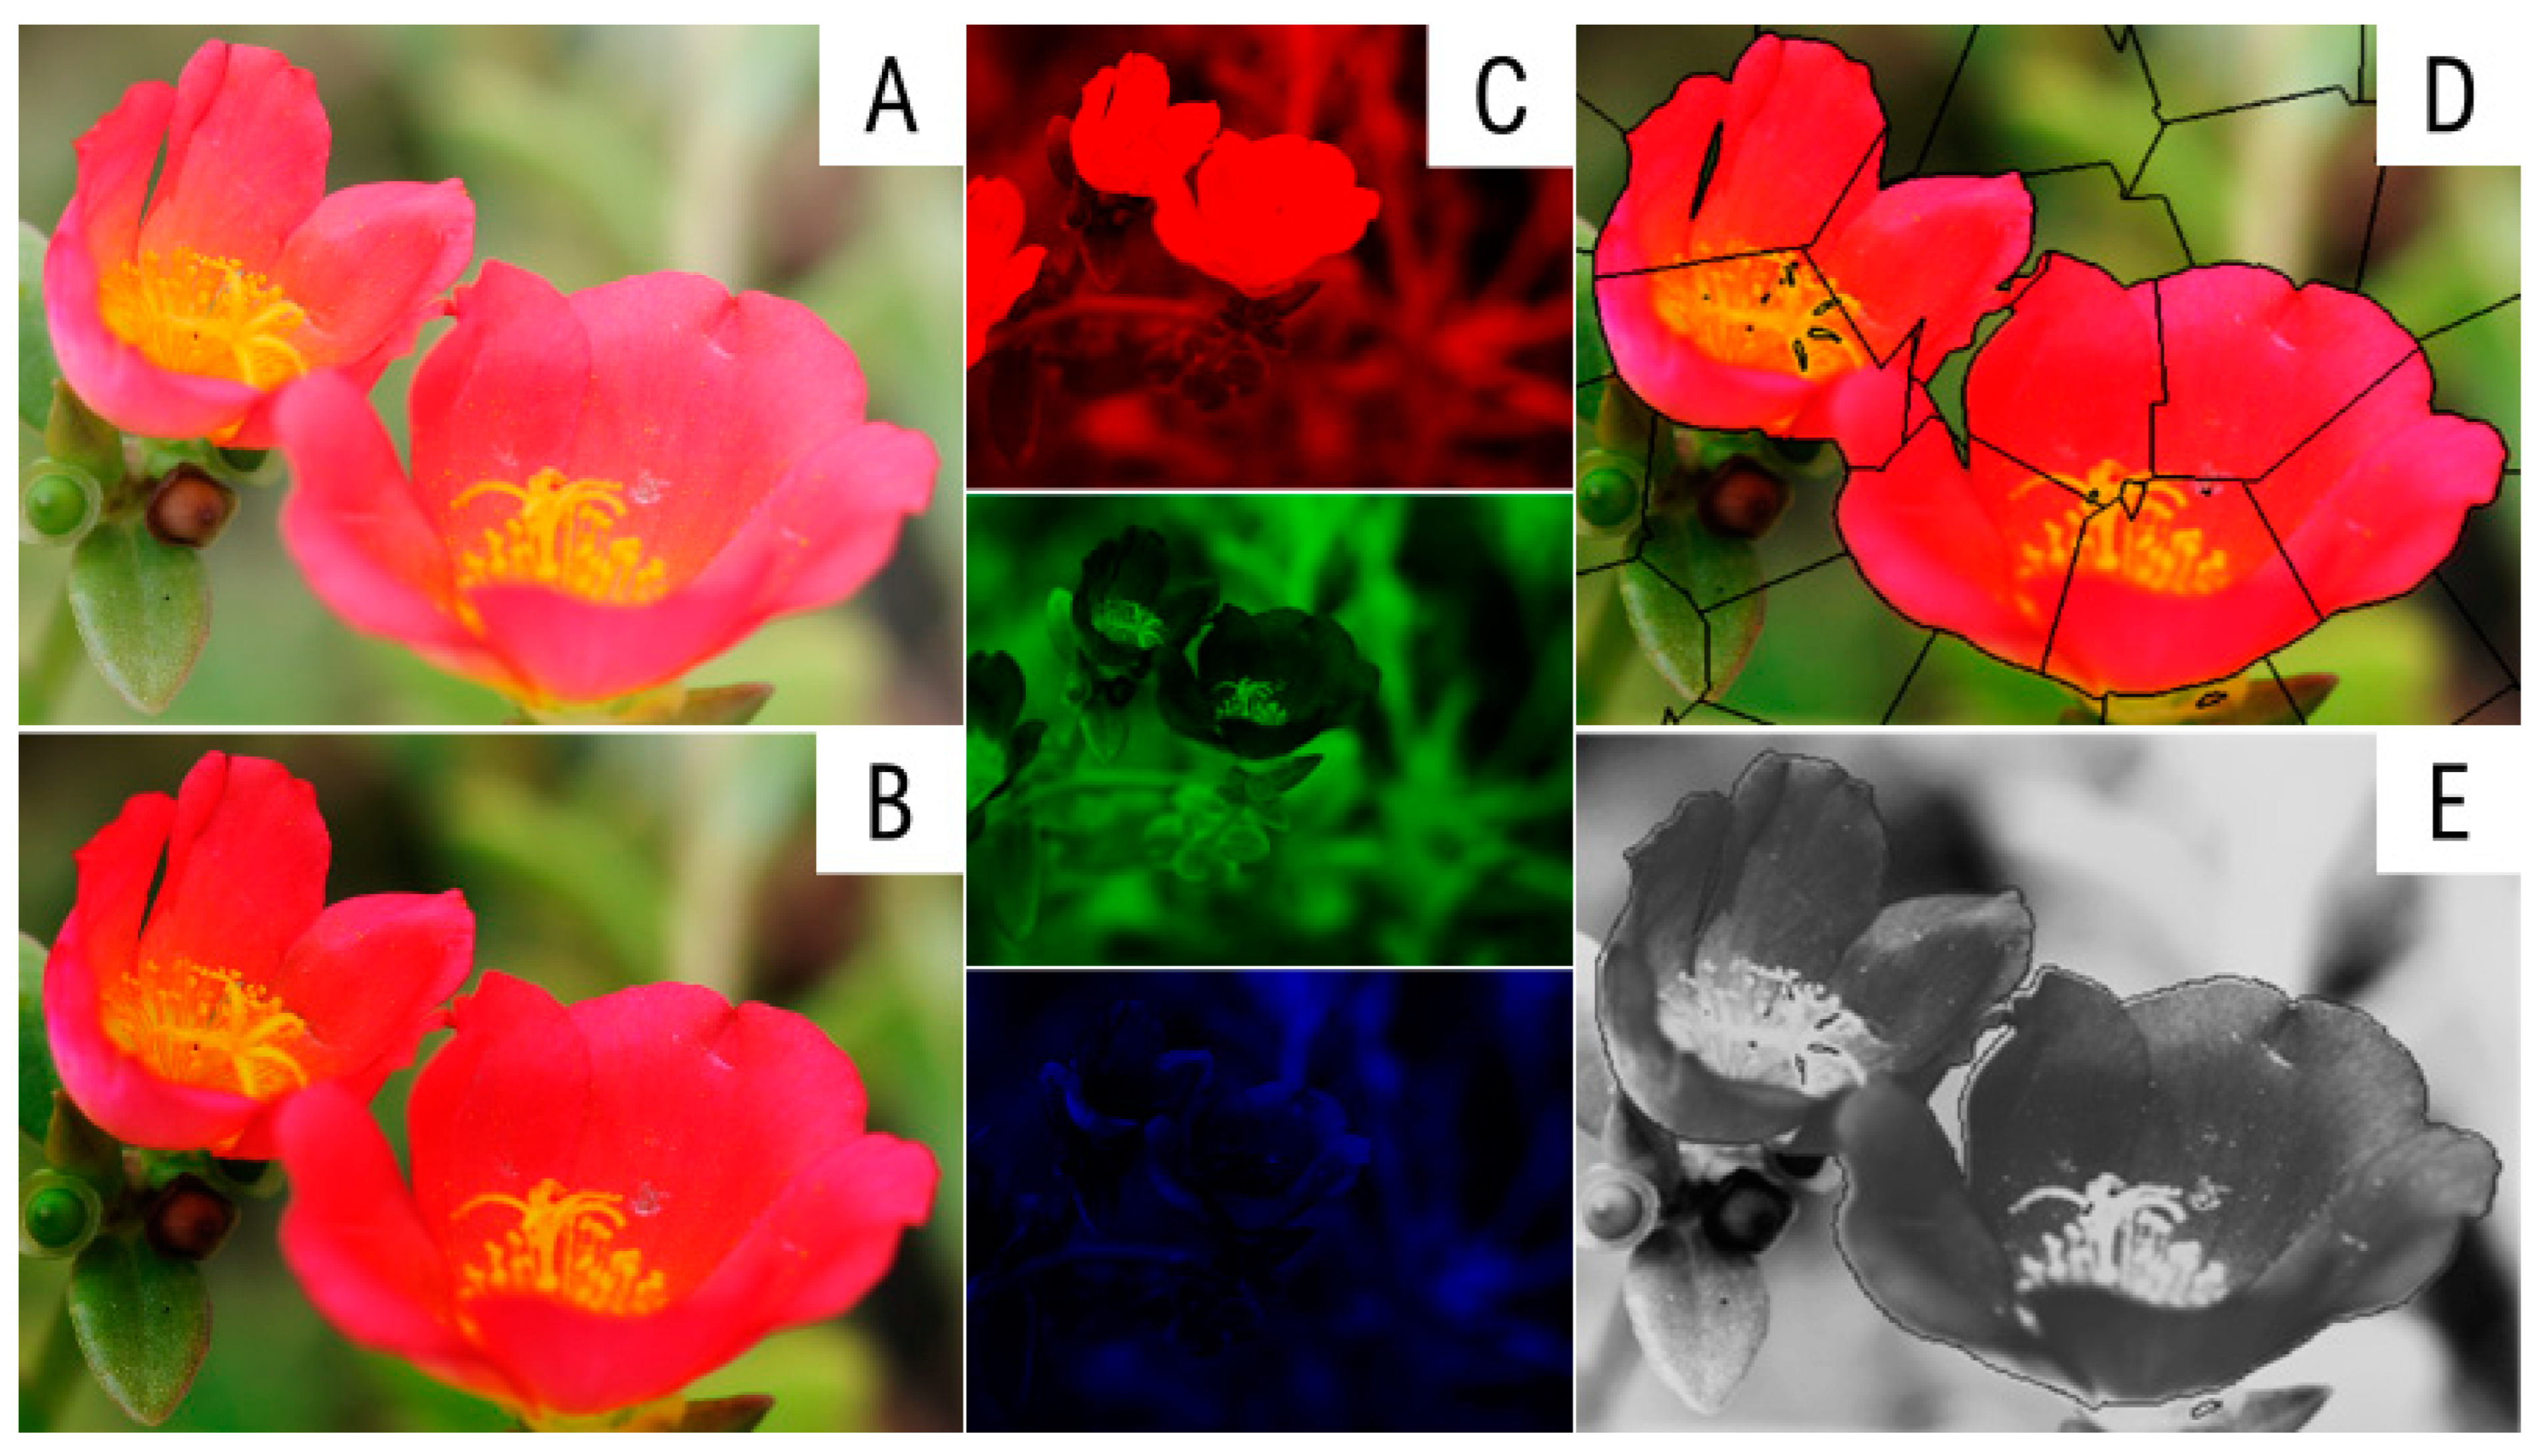
3.1. The Anatomy of Flower and Architecture of P. umbraticola
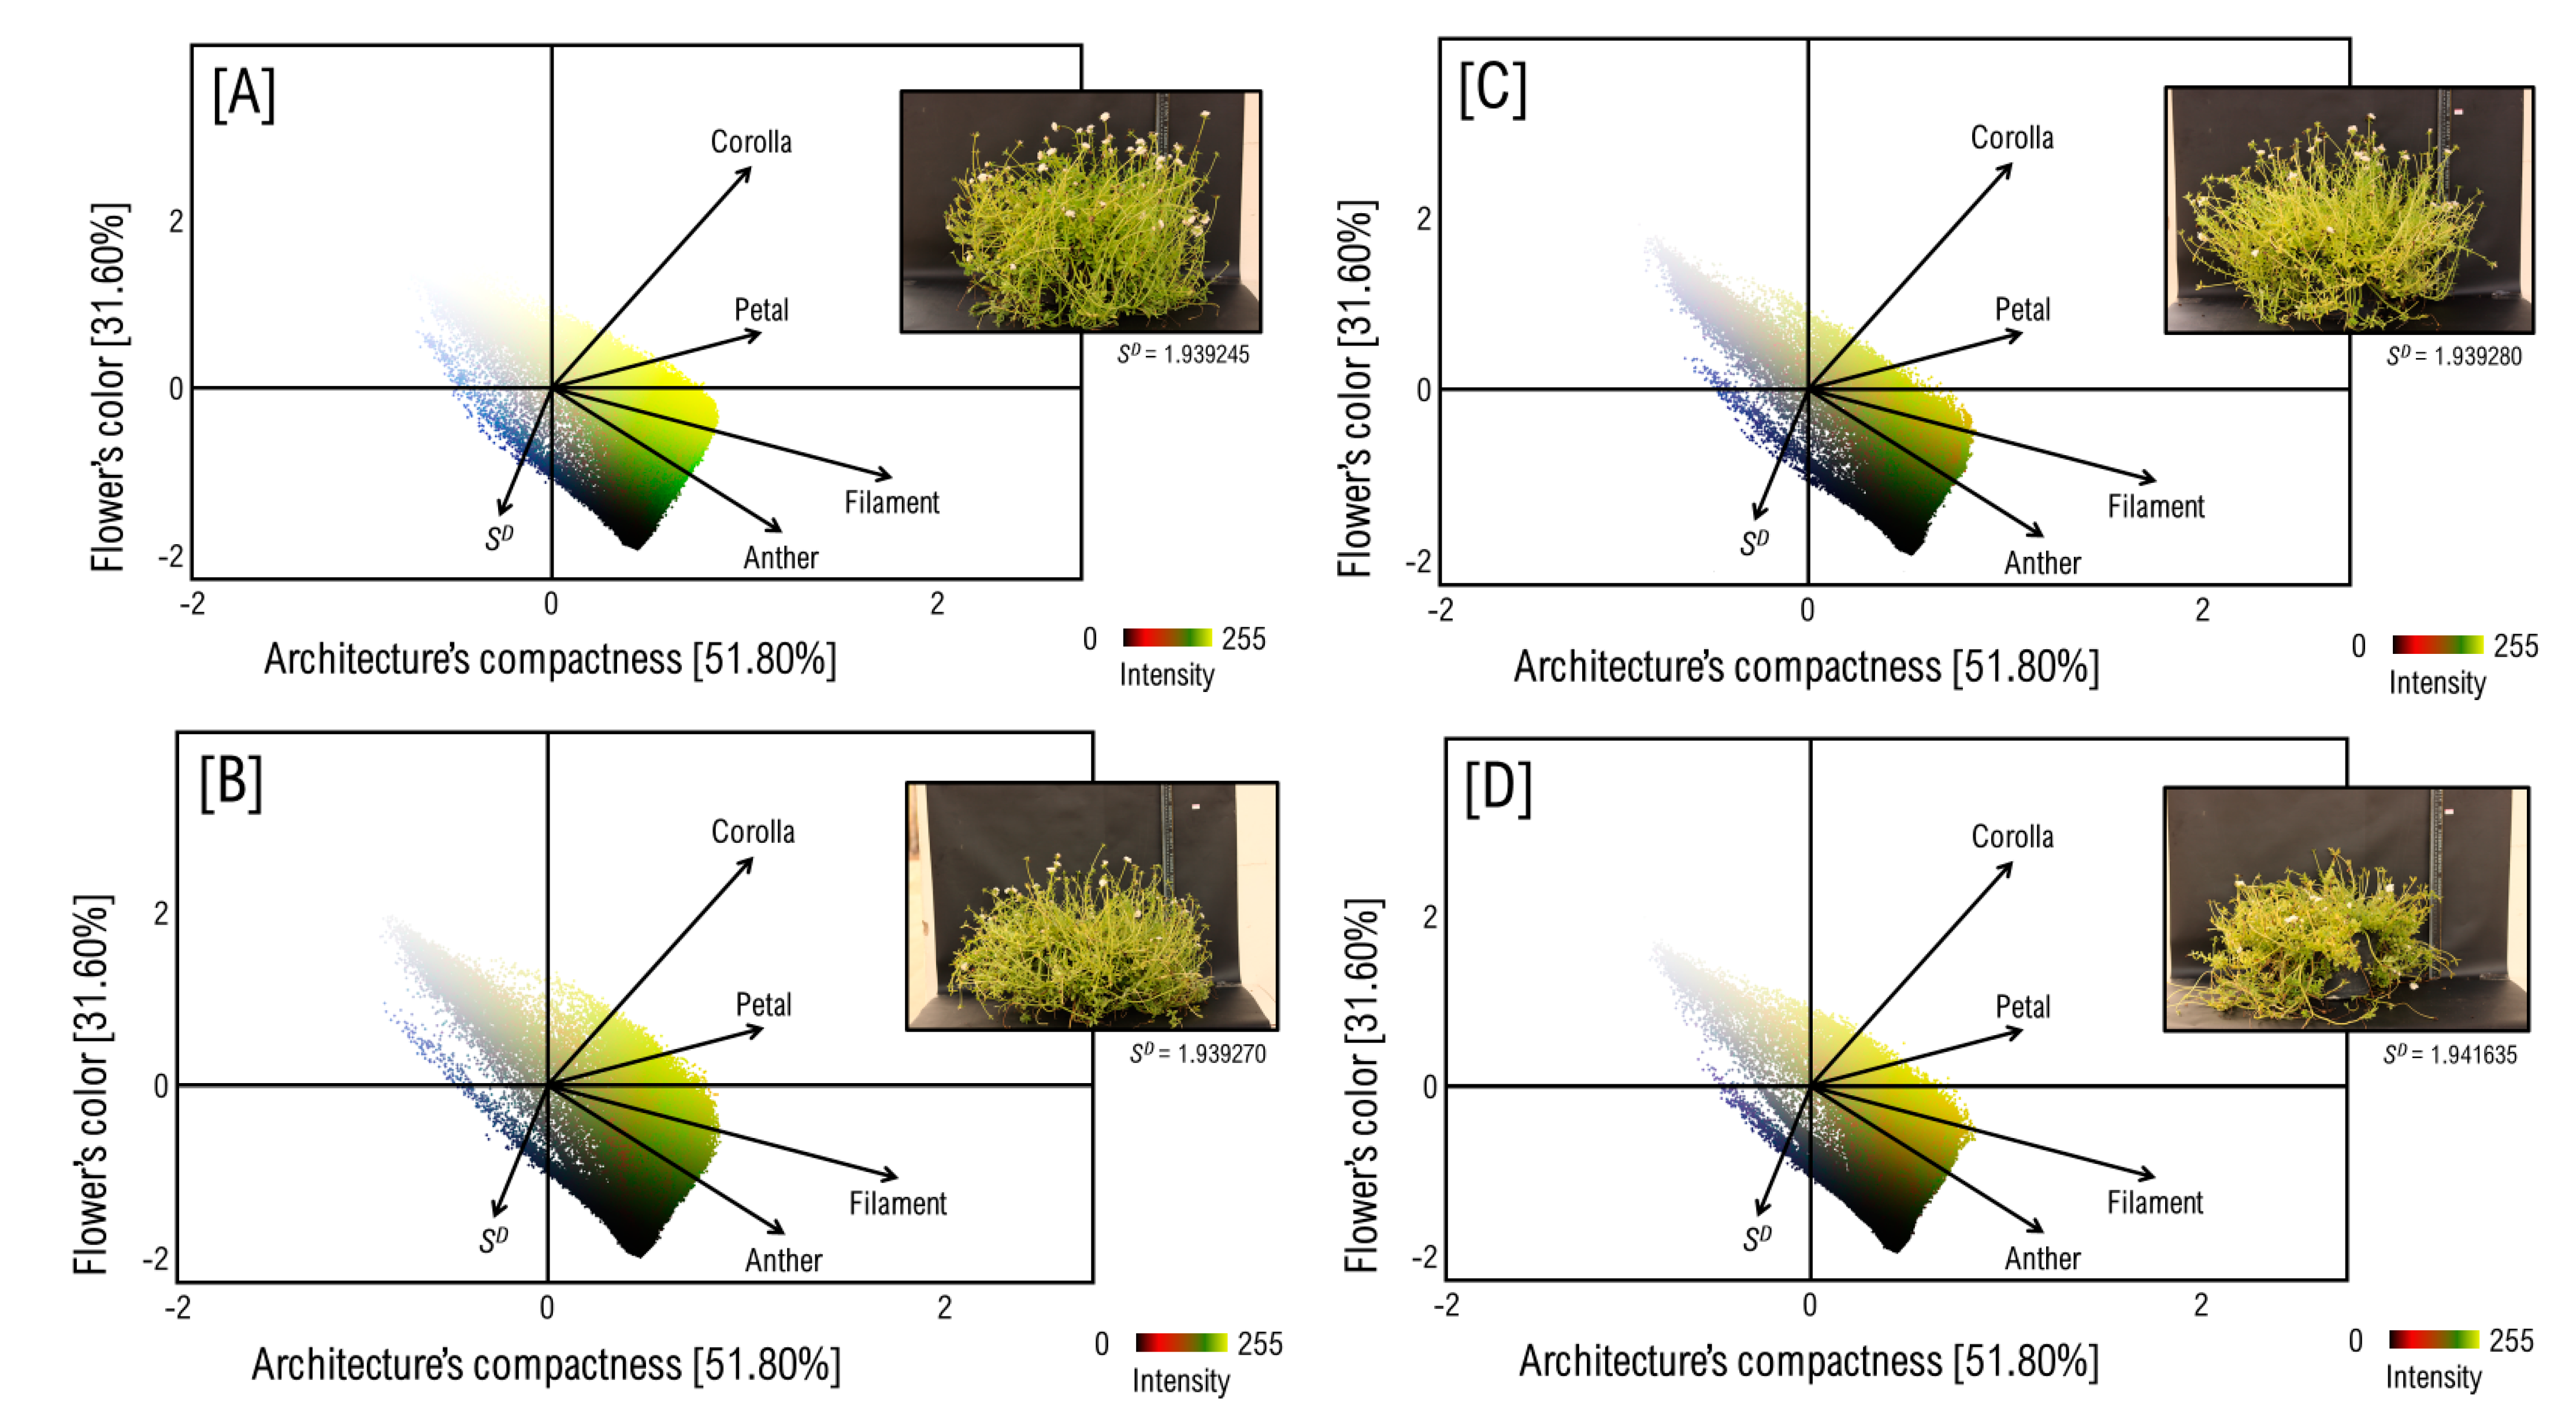
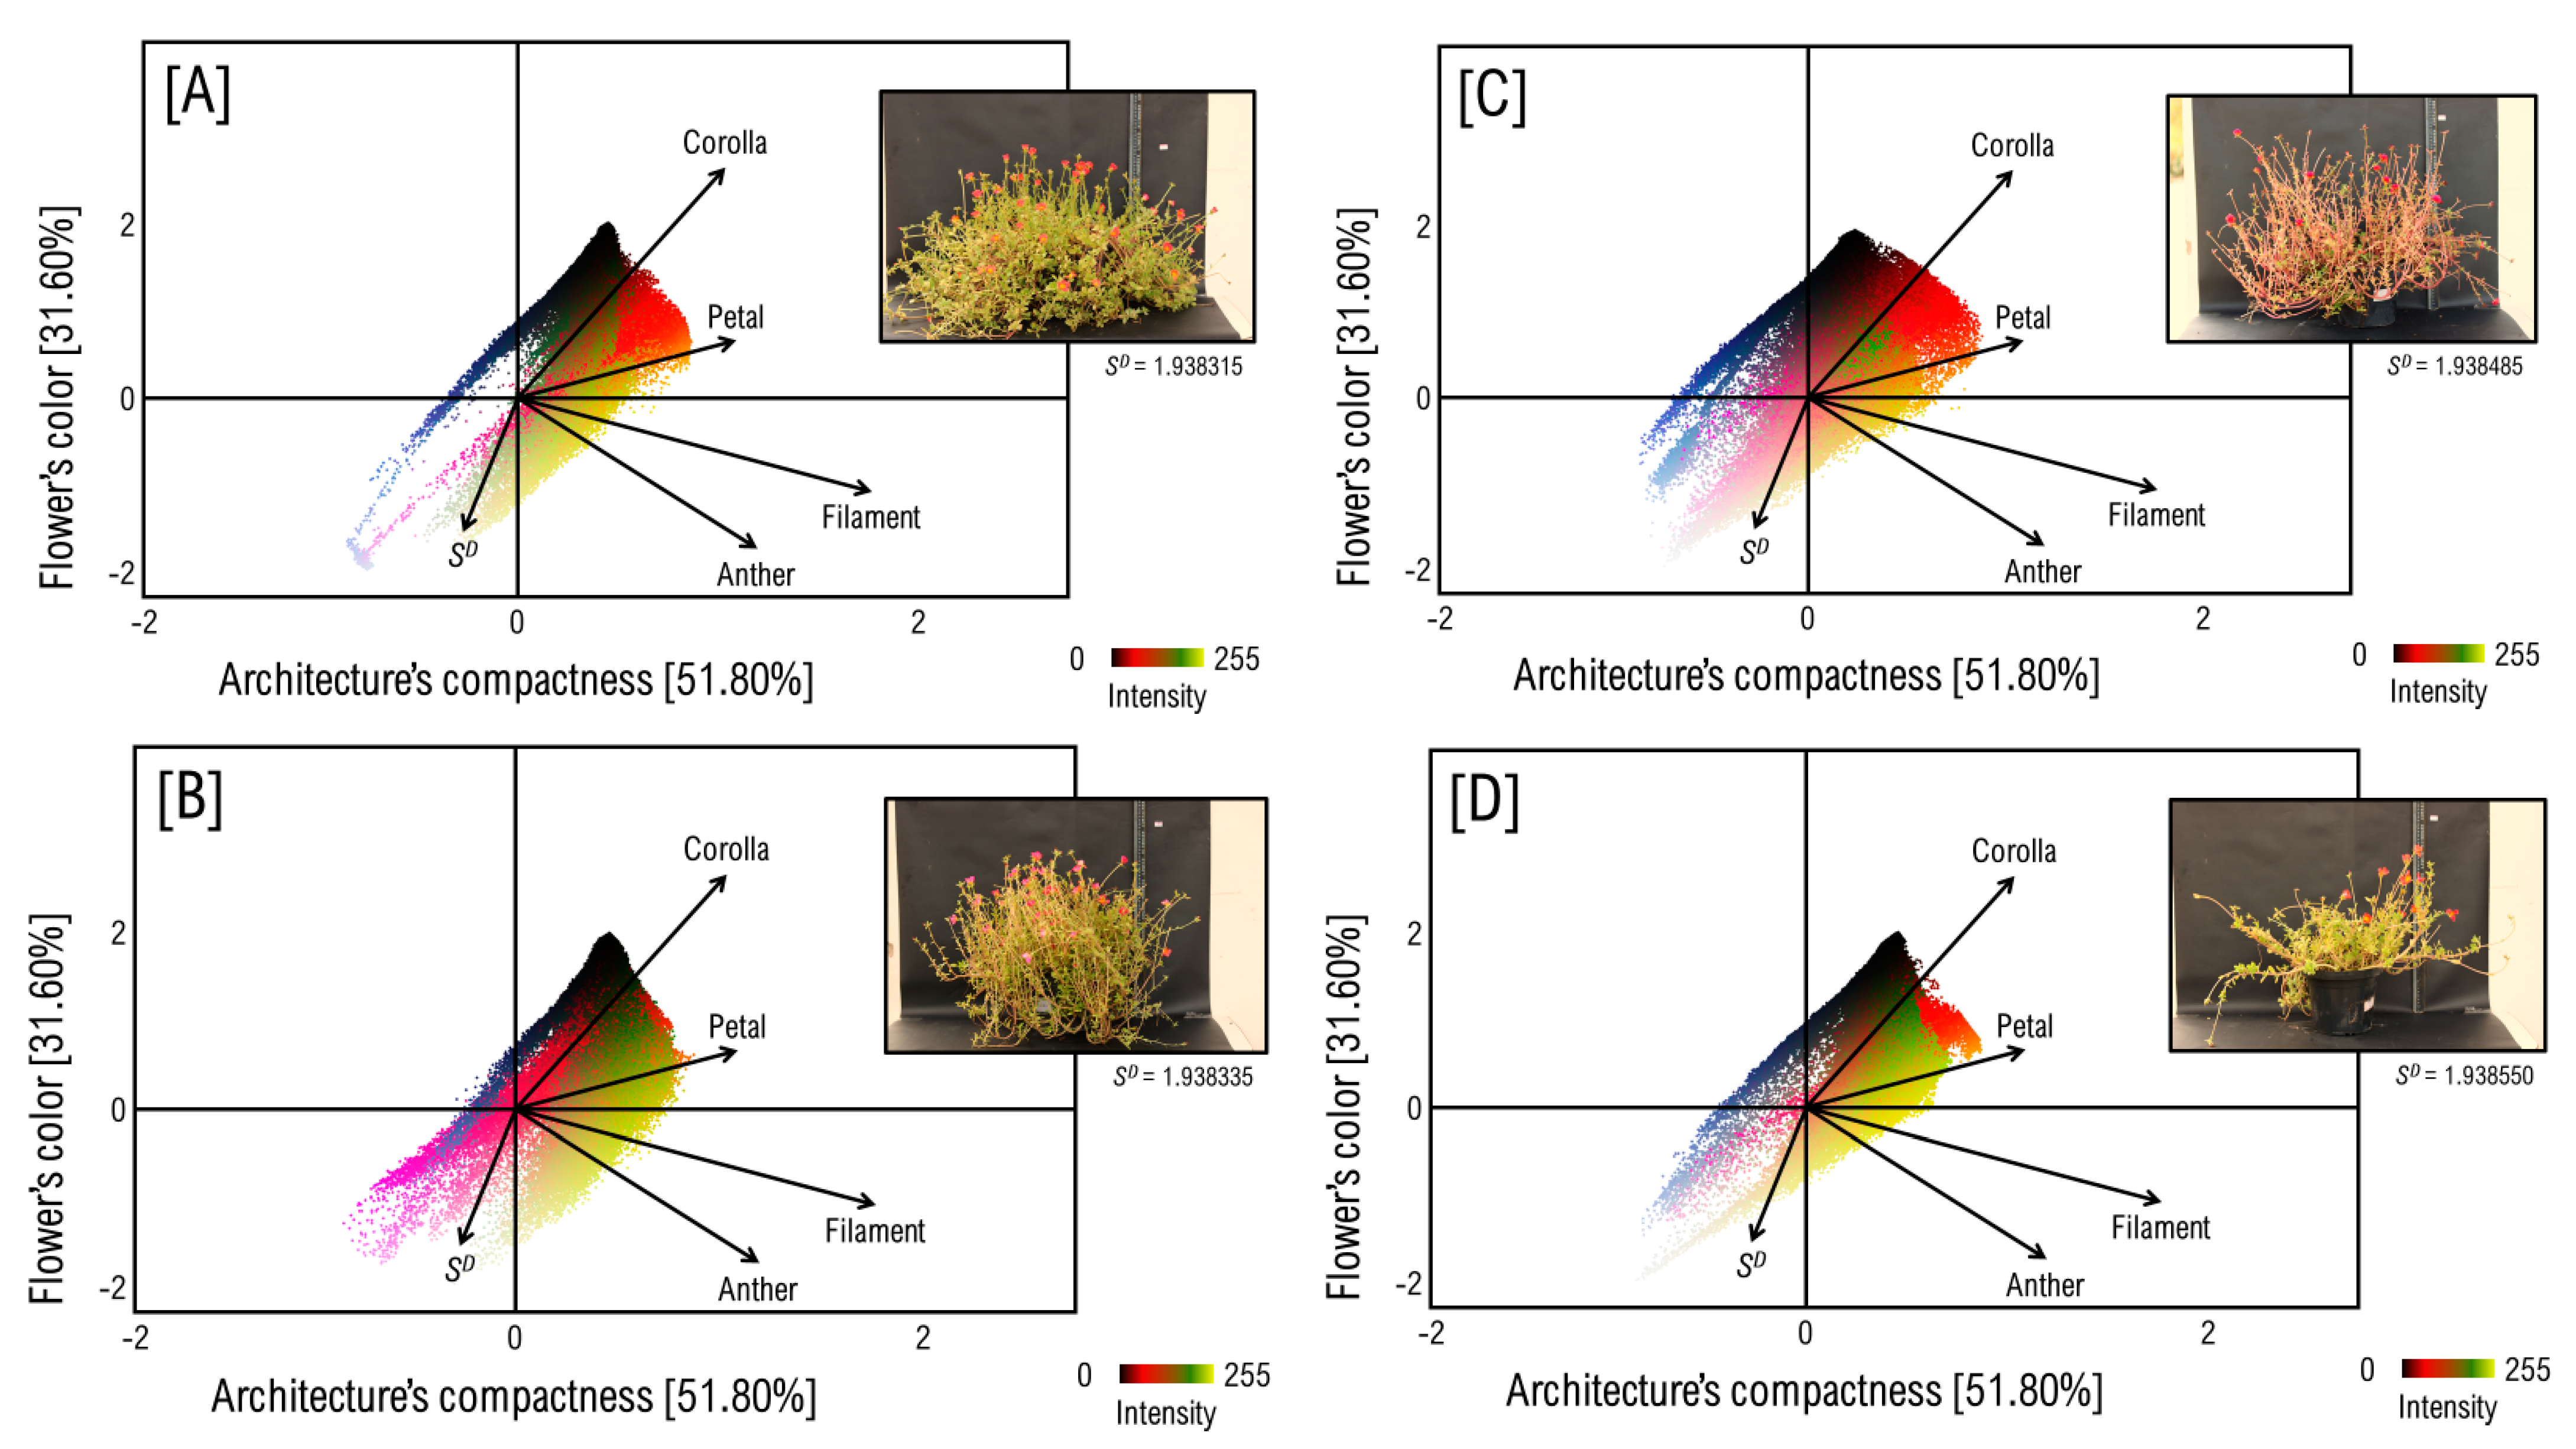
3.2. Mapping the Flower’s Color to Canopy’s Architecture over a Pixel-Wise Intensity-Fractality Nexus
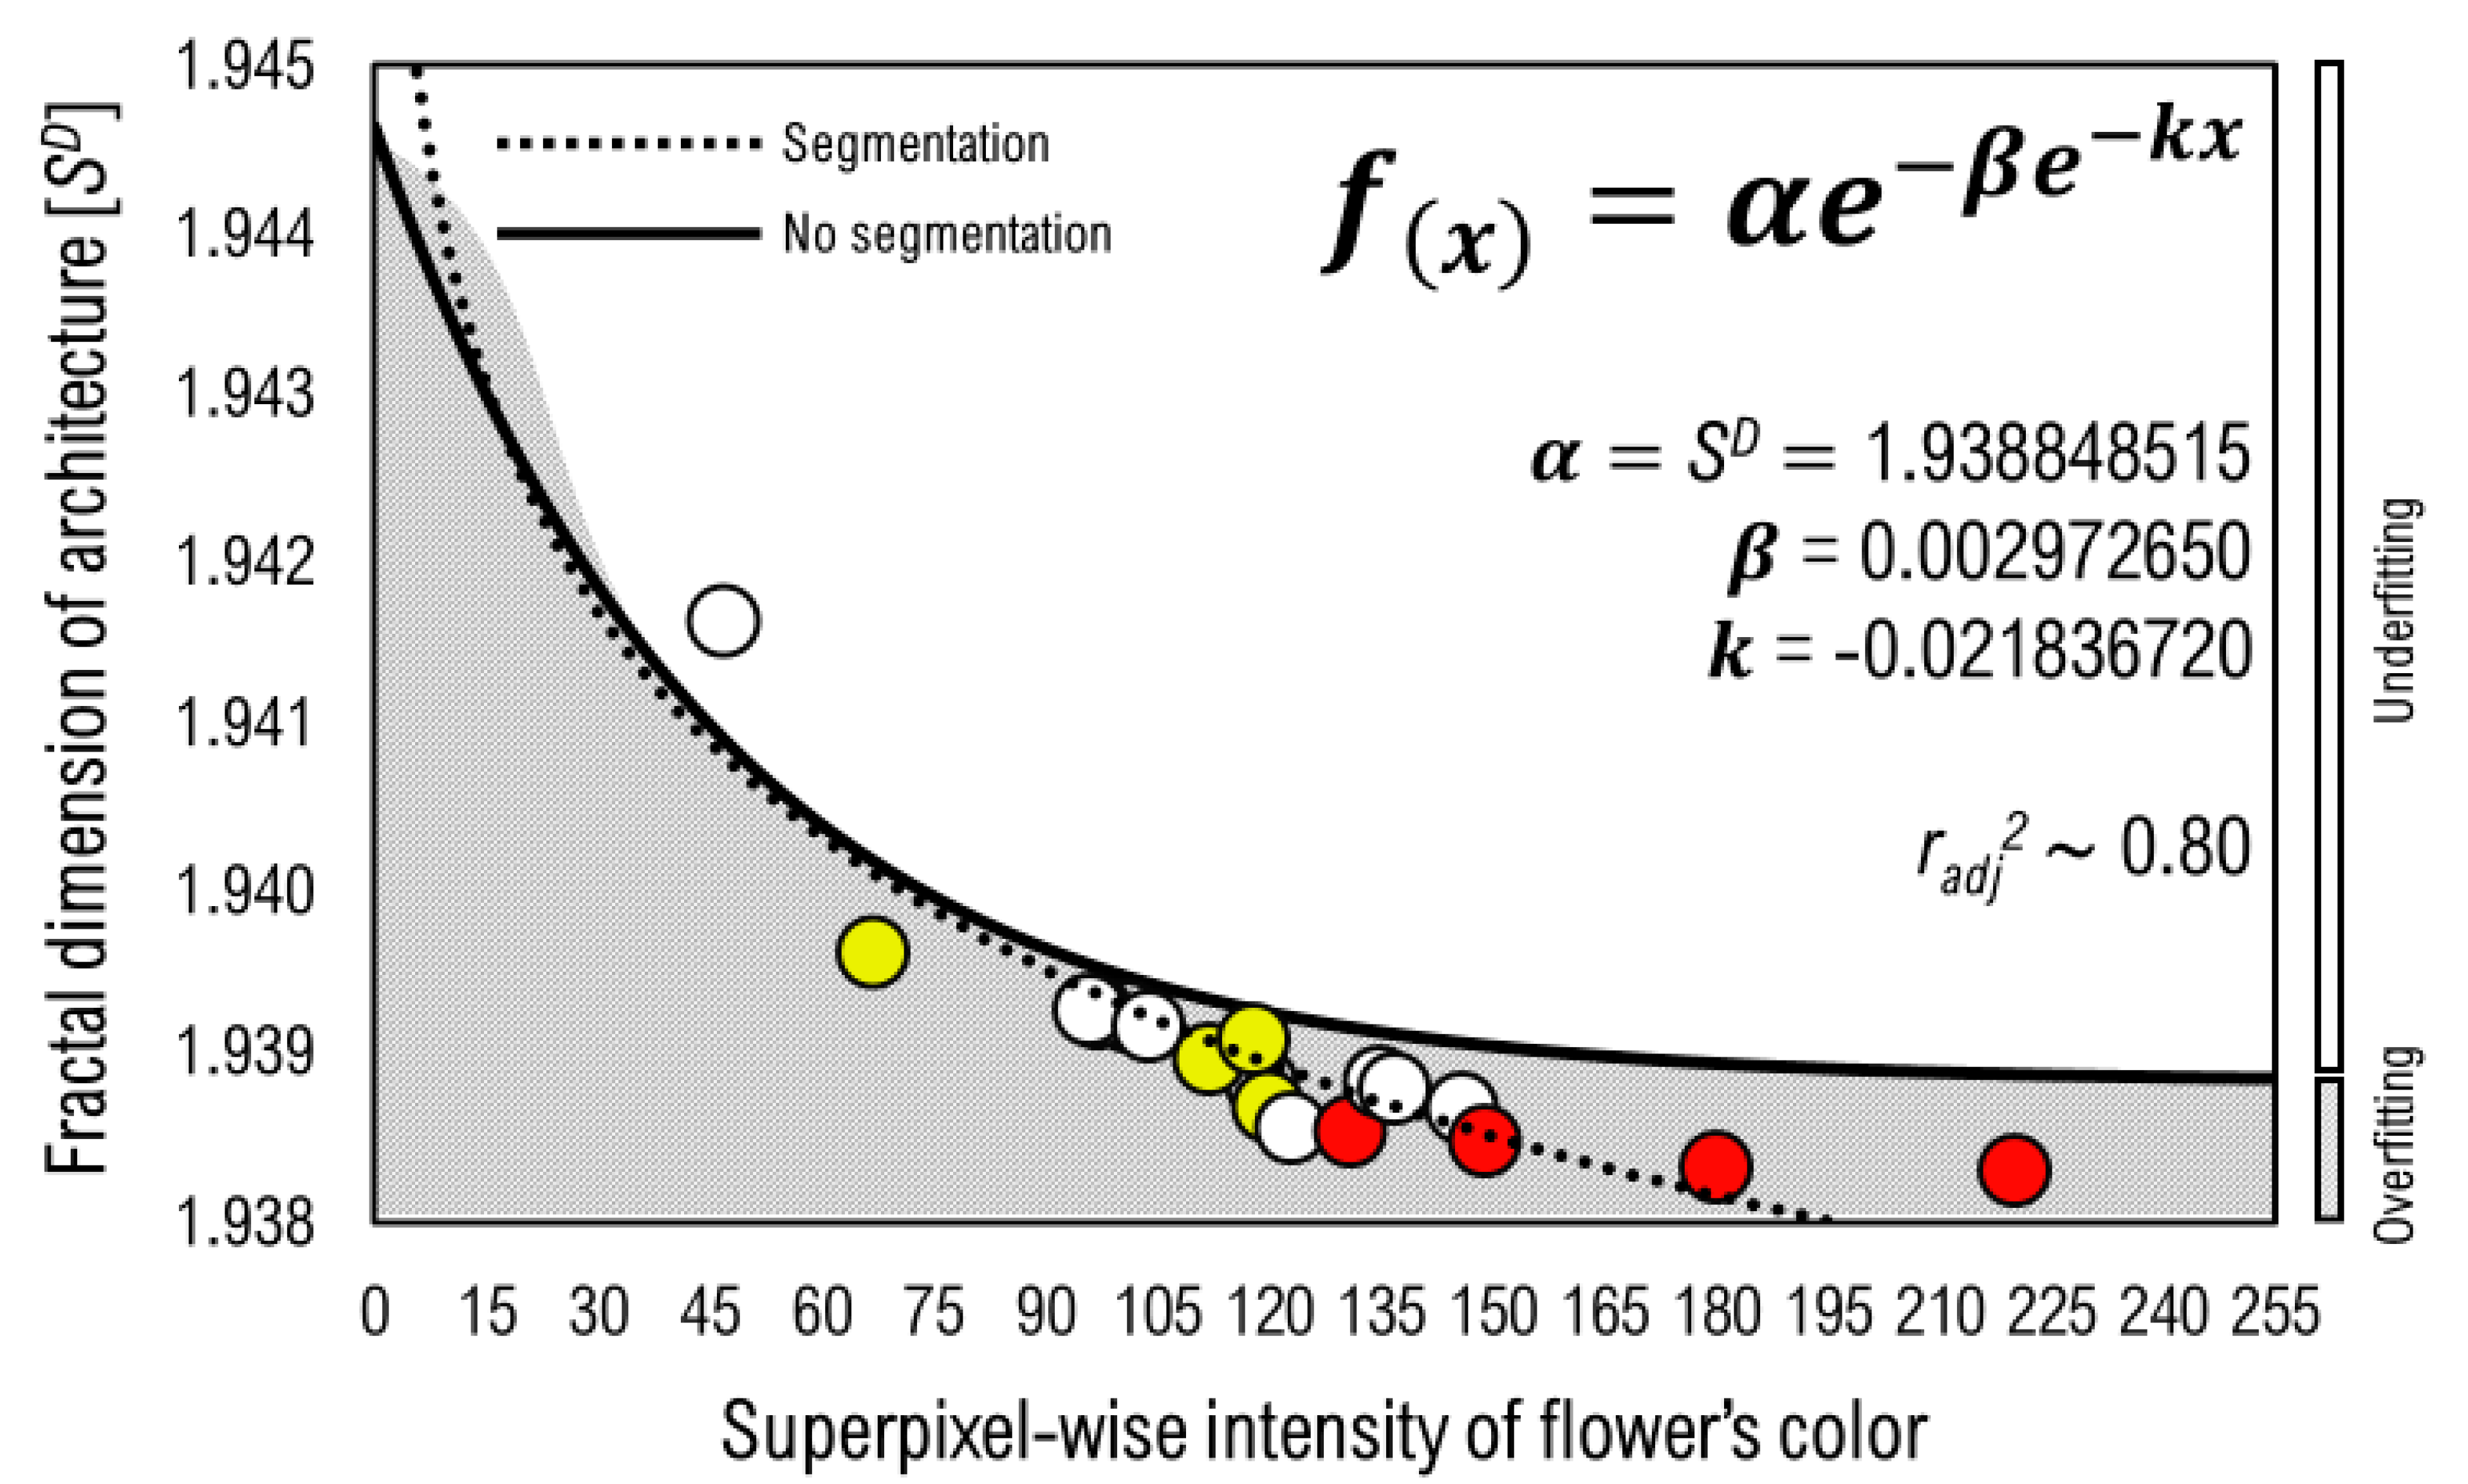
3.3. Predicting in the Gompertz Model for the Superpixel-Wise Intensity of Flower’s Color upon the Fractal Dimension of Architecture
4. Discussion
4.1. Insights into Biophysical Modeling
4.2. The Value of This Study to Develop High-Throughput Phenotyping and the Ways Forward
5. Conclusions
Supplementary Materials
Author Contributions
Funding
Informed Consent Statement
Data Availability Statement
Acknowledgments
Conflicts of Interest
References
- Giraldo, J.P.; Wu, H.; Newkirk, G.M.; Kruss, S. Nanobiotechnology Approaches for Engineering Smart Plant Sensors. Nat. Nanotechnol. 2019, 14, 541–553. [Google Scholar] [CrossRef] [PubMed]
- Lowry, G.V.; Avellan, A.; Gilbertson, L.M. Opportunities and Challenges for Nanotechnology in the Agri-Tech Revolution. Nat. Nanotechnol. 2019, 14, 517–522. [Google Scholar] [CrossRef] [PubMed]
- Afshin, A.; Sur, P.J.; Fay, K.A.; Cornaby, L.; Ferrara, G.; Salama, J.S.; Mullany, E.C.; Abate, K.H.; Abbafati, C.; Abebe, Z.; et al. Health Effects of Dietary Risks in 195 Countries, 1990–2017: A Systematic Analysis for the Global Burden of Disease Study 2017. Lancet 2019, 393, 1958–1972. [Google Scholar] [CrossRef] [Green Version]
- Nordhagen, S.; Lambertini, E.; DeWaal, C.S.; McClafferty, B.; Neufeld, L.M. Integrating Nutrition and Food Safety in Food Systems Policy and Programming. Glob. Food Secur. 2022, 32, 100593. [Google Scholar] [CrossRef]
- Shahzad, A.N.; Qureshi, M.K.; Wakeel, A.; Misselbrook, T. Crop Production in Pakistan and Low Nitrogen Use Efficiencies. Nat. Sustain. 2019, 2, 1106–1114. [Google Scholar] [CrossRef]
- Spanaki, K.; Karafili, E.; Sivarajah, U.; Despoudi, S.; Irani, Z. Artificial Intelligence and Food Security: Swarm Intelligence of AgriTech Drones for Smart AgriFood Operations. Prod. Plan. Control. 2021, 18, 1–19. [Google Scholar] [CrossRef]
- Zhang, R.; Wu, J.; Zhao, Y.; He, X.; Wang, R. Numerical Simulation of the Feasibility of Supercritical CO2 Storage and Enhanced Shale Gas Recovery Considering Complex Fracture Networks. J. Pet. Sci. Eng. 2021, 204, 108671. [Google Scholar] [CrossRef]
- Deléglise, H.; Interdonato, R.; Bégué, A.; Maître d’Hôtel, E.; Teisseire, M.; Roche, M. Food Security Prediction from Heterogeneous Data Combining Machine and Deep Learning Methods. Expert Syst. Appl. 2022, 190, 116189. [Google Scholar] [CrossRef]
- Valoppi, F.; Agustin, M.; Abik, F.; Morais de Carvalho, D.; Sithole, J.; Bhattarai, M.; Varis, J.J.; Arzami, A.N.A.B.; Pulkkinen, E.; Mikkonen, K.S. Insight on Current Advances in Food Science and Technology for Feeding the World Population. Front. Sustain. Food Syst. 2021, 5, 385. [Google Scholar] [CrossRef]
- Vinuesa, R.; Azizpour, H.; Leite, I.; Balaam, M.; Dignum, V.; Domisch, S.; Felländer, A.; Langhans, S.D.; Tegmark, M.; Fuso Nerini, F. The Role of Artificial Intelligence in Achieving the Sustainable Development Goals. Nat. Commun. 2020, 11, 233. [Google Scholar] [CrossRef] [Green Version]
- Gardiner, L.-J.; Krishna, R. Bluster or Lustre: Can AI Improve Crops and Plant Health? Plants 2021, 10, 2707. [Google Scholar] [CrossRef] [PubMed]
- Fahlgren, N.; Gehan, M.A.; Baxter, I. Lights, Camera, Action: High-Throughput Plant Phenotyping Is Ready for a Close-Up. Curr. Opin. Plant. Biol. 2015, 24, 93–99. [Google Scholar] [CrossRef] [PubMed] [Green Version]
- Chacón, B.; Ballester, R.; Birlanga, V.; Rolland-Lagan, A.-G.; Pérez-Pérez, J.M. A Quantitative Framework for Flower Phenotyping in Cultivated Carnation (Dianthus caryophyllus L.). PLoS ONE 2013, 8, e82165. [Google Scholar] [CrossRef] [PubMed]
- Xiong, J.; Yu, D.; Liu, S.; Shu, L.; Wang, X.; Liu, Z. A Review of Plant Phenotypic Image Recognition Technology Based on Deep Learning. Electronics 2021, 10, 81. [Google Scholar] [CrossRef]
- Danin, A.; Buldrini, F.; Bandini Mazzanti, M.; Bosi, G.; Caria, M.C.; Dandria, D.; Lanfranco, E.; Mifsud, S.; Bagella, S. Diversification of Portulaca oleracea L. Complex in the Italian Peninsula and Adjacent Islands. Bot. Lett. 2016, 163, 261–272. [Google Scholar] [CrossRef]
- Nybom, H.; Lācis, G. Recent Large-Scale Genotyping and Phenotyping of Plant Genetic Resources of Vegetatively Propagated Crops. Plants 2021, 10, 415. [Google Scholar] [CrossRef]
- Chéné, Y.; Rousseau, D.; Lucidarme, P.; Bertheloot, J.; Caffier, V.; Morel, P.; Belin, É.; Chapeau-Blondeau, F. On the Use of Depth Camera for 3D Phenotyping of Entire Plants. Comput. Electron. Agric. 2012, 82, 122–127. [Google Scholar] [CrossRef]
- Tu, S.; Xue, Y.; Zheng, C.; Qi, Y.; Wan, H.; Mao, L. Detection of Passion Fruits and Maturity Classification Using Red-Green-Blue Depth Images. Biosyst. Eng. 2018, 175, 156–167. [Google Scholar] [CrossRef]
- Zhu, H.; Chu, B.; Fan, Y.; Tao, X.; Yin, W.; He, Y. Hyperspectral Imaging for Predicting the Internal Quality of Kiwifruits Based on Variable Selection Algorithms and Chemometric Models. Sci. Rep. 2017, 7, 7845. [Google Scholar] [CrossRef] [Green Version]
- Boumaza, R.; Huché-Thélier, L.; Demotes-Mainard, S.; Coz, E.L.; Leduc, N.; Pelleschi-Travier, S.; Qannari, E.M.; Sakr, S.; Santagostini, P.; Symoneaux, R.; et al. Sensory Profiles and Preference Analysis in Ornamental Horticulture: The Case of the Rosebush. Food Qual. Prefer. 2010, 21, 987–997. [Google Scholar] [CrossRef]
- Evers, J.B.; van der Krol, A.R.; Vos, J.; Struik, P.C. Understanding Shoot Branching by Modelling Form and Function. Trends Plant Sci. 2011, 16, 464–467. [Google Scholar] [CrossRef] [PubMed]
- Dornbusch, T.; Wernecke, P.; Diepenbrock, W. Description and Visualization of Graminaceous Plants with an Organ-Based 3D Architectural Model, Exemplified for Spring Barley (Hordeum vulgare L.). Vis. Comput. 2007, 23, 569–581. [Google Scholar] [CrossRef]
- Vos, J.; Evers, J.B.; Buck-Sorlin, G.H.; Andrieu, B.; Chelle, M.; de Visser, P.H.B. Functional–Structural Plant Modelling: A New Versatile Tool in Crop Science. J. Exp. Bot. 2010, 61, 2101–2115. [Google Scholar] [CrossRef]
- Bertheloot, J.; Wu, Q.; Cournède, P.-H.; Andrieu, B. NEMA, a Functional–Structural Model of Nitrogen Economy within Wheat Culms after Flowering. II. Evaluation and Sensitivity Analysis. Ann. Bot. 2011, 108, 1097–1109. [Google Scholar] [CrossRef] [PubMed] [Green Version]
- de Jesus, O.N.; Lima, L.K.S.; Soares, T.L.; da Silva, L.N.; dos Santos, I.S.; Sampaio, S.R.; de Oliveira, E.J. Phenotypic Diversity and Alternative Methods for Characterization and Prediction of Pulp Yield in Passion Fruit (Passiflora Spp.) Germplasm. Sci. Hortic. 2022, 292, 110573. [Google Scholar] [CrossRef]
- Zhang, C.; Serra, S.; Quirós-Vargas, J.; Sangjan, W.; Musacchi, S.; Sankaran, S. Non-Invasive Sensing Techniques to Phenotype Multiple Apple Tree Architectures. Inf. Processing Agric. 2021. [Google Scholar] [CrossRef]
- Hu, Y.; Shen, J.; Qi, Y. Estimation of Rice Biomass at Different Growth Stages by Using Fractal Dimension in Image Processing. Appl. Sci. 2021, 11, 7151. [Google Scholar] [CrossRef]
- Ramos, G.Q.; Matos, R.S.; Filho, H.D.d.F. Advanced Microtexture Study of Anacardium occidentale L. Leaf Surface From the Amazon by Fractal Theory. Microsc. Microanal. 2020, 26, 989–996. [Google Scholar] [CrossRef]
- Dhal, K.G.; Das, A.; Ray, S.; Gálvez, J.; Das, S. Histogram Equalization Variants as Optimization Problems: A Review. Arch. Comput. Methods Eng. 2021, 28, 1471–1496. [Google Scholar] [CrossRef]
- Pérez-Delgado, M.-L. Color Image Quantization Using the Shuffled-Frog Leaping Algorithm. Eng. Appl. Artif. Intell. 2019, 79, 142–158. [Google Scholar] [CrossRef]
- He, F.; Parvez Mahmud, M.A.; Kouzani, A.Z.; Anwar, A.; Jiang, F.; Ling, S.H. An Improved SLIC Algorithm for Segmentation of Microscopic Cell Images. Biomed. Signal. Processing Control 2022, 73, 103464. [Google Scholar] [CrossRef]
- Khairnar, S.; Thepade, S.D.; Gite, S. Effect of Image Binarization Thresholds on Breast Cancer Identification in Mammography Images Using OTSU, Niblack, Burnsen, Thepade’s SBTC. Intell. Syst. Appl. 2021, 10–11, 200046. [Google Scholar] [CrossRef]
- Panigrahy, C.; Seal, A.; Mahato, N.K.; Bhattacharjee, D. Differential Box Counting Methods for Estimating Fractal Dimension of Gray-Scale Images: A Survey. Chaos Solitons Fractals 2019, 126, 178–202. [Google Scholar] [CrossRef]
- Russ, J.C. The Image Processing Handbook, 5th ed.; CRC Press: Boca Raton, FL, USA, 2006; ISBN 978-0-429-20692-4. [Google Scholar]
- Zheng, C.; Sun, D.-W. 2—Image Segmentation Techniques. In Computer Vision Technology for Food Quality Evaluation; Sun, D.-W., Ed.; Food Science and Technology; Academic Press: Amsterdam, The Netherlands, 2008; pp. 37–56. ISBN 978-0-12-373642-0. [Google Scholar]
- R: The R Project for Statistical Computing. Available online: https://www.r-project.org/ (accessed on 27 April 2020).
- Tjørve, K.M.C.; Tjørve, E. The Use of Gompertz Models in Growth Analyses, and New Gompertz-Model Approach: An Addition to the Unified-Richards Family. PLoS ONE 2017, 12, e0178691. [Google Scholar] [CrossRef] [PubMed]
- LeCun, Y.; Bengio, Y.; Hinton, G. Deep Learning. Nature 2015, 521, 436–444. [Google Scholar] [CrossRef]


| Parameter | No Segmentation | Segmentation |
| α | 1.923799685 * | 1.937848515 ** |
| β | 0.002972565 * | 0.002972670 * |
| k | −0.220573050 ** | −0.228367205 ** |
| radj2 | 0.725 | 0.80 |
Publisher’s Note: MDPI stays neutral with regard to jurisdictional claims in published maps and institutional affiliations. |
© 2022 by the authors. Licensee MDPI, Basel, Switzerland. This article is an open access article distributed under the terms and conditions of the Creative Commons Attribution (CC BY) license (https://creativecommons.org/licenses/by/4.0/).
Share and Cite
Souza, J.d.S.; Pedrosa, L.M.; Moreira, B.R.d.A.; Rêgo, E.R.d.; Unêda-Trevisoli, S.H. The More Fractal the Architecture the More Intensive the Color of Flower: A Superpixel-Wise Analysis towards High-Throughput Phenotyping. Agronomy 2022, 12, 1342. https://doi.org/10.3390/agronomy12061342
Souza JdS, Pedrosa LM, Moreira BRdA, Rêgo ERd, Unêda-Trevisoli SH. The More Fractal the Architecture the More Intensive the Color of Flower: A Superpixel-Wise Analysis towards High-Throughput Phenotyping. Agronomy. 2022; 12(6):1342. https://doi.org/10.3390/agronomy12061342
Chicago/Turabian StyleSouza, Jardel da Silva, Laura Monteiro Pedrosa, Bruno Rafael de Almeida Moreira, Elizanilda Ramalho do Rêgo, and Sandra Helena Unêda-Trevisoli. 2022. "The More Fractal the Architecture the More Intensive the Color of Flower: A Superpixel-Wise Analysis towards High-Throughput Phenotyping" Agronomy 12, no. 6: 1342. https://doi.org/10.3390/agronomy12061342