Article

Adaptation to Climate Change Effects by Cultivar and Sowing Date Selection for Maize in the Northeast China Plain

1
Agronomy College, Jilin Agricultural University, Changchun 130118, China
2
Institute of Agricultural Resources and Environment, Jilin Academy of Agricultural Sciences, Changchun 130033, China
*
Author to whom correspondence should be addressed.
Agronomy 2022, 12(5), 984; https://doi.org/10.3390/agronomy12050984
Submission received: 1 March 2022 / Revised: 12 April 2022 / Accepted: 14 April 2022 / Published: 19 April 2022

Abstract

:
Cultivar and sowing date selection are major factors in determining the yield potential of any crop and in any region. To explore how climate change affects these choices, this study performed a regional scale analysis using the well-validated APSIM-maize model for the Northeast China Plain (NEC) which is the leading maize (Zea mays L.) producing area in China. Results indicated that high temperature had a significantly negative effect on grain yield, while effective accumulated temperature and solar radiation had significant positive effects on grain yield and kernel number. Cloudy and rainy weather in flowering stage had significant negative effects on kernel number. Delayed sowing led to less cloudy and rainy weather during flowering and reduced the negative effect on kernel number. Higher diurnal thermal range and less precipitation during the grain-filling stage also increased the 1000-kernel weight. Delayed sowing, however, also significantly increased the risk of early senescence and frost (>80%) in middle and high latitude areas. In the middle and high latitude areas of the NEC, the grain yield of a long-season cultivar (LS) under early sowing (I) (6.2–19.9%) was significantly higher than under medium sowing (II) or late sowing (III), and higher than that of an early sown (I) short-season (SS) and medium-season cultivar (MS). In the low latitude area of the NEC, the grain yield of MS under medium sowing date (II) was higher than that under I and III, meanwhile, this was also higher than that of SS and LS. Therefore, under climate warming, LS sown earlier in high and medium latitudes and MS sown medium in low latitude were the appropriate cultivar and sowing date choices, which could mitigate the stress of high temperatures and reduce the risk of early senescence and frost. Cultivar and sowing date selection are effective measures to alleviate negative effects of climate change on maize production in the NEC, and provides valuable advice for breeders on cultivar selection, and the choice of varieties and sowing dates for farmers in actual production.

1. Introduction

Climate change is one of the major challenges of the 21st century. A rapid, 3 °C increase in the global average surface temperature is expected by the end of this century, due to huge emissions of greenhouse gases since the 1970s [1], extensively affecting the agriculture sector [2,3,4]. Higher temperatures may benefit increasing some crops, but are disadvantageous to maize production [5]. Therefore, the impact of climate change on maize cultivar selection and sowing date adjustment across temporal and spatial scales in this area has been an important focus of research.
Maize is one of the three major food crops, while China’s annual maize yield is second in the world [6], and the Northeast China Plain (NEC) is an important maize production and processing base in China and one of the three “golden maize belts” in the world [3]. The NEC accounts for 31.5% of the total maize sown and 32.8% of the total maize production in 2020 [7]. Since the 1960s, maize yields in the NEC have increased continuously, but this increase has slowed down, and maize yield has been fluctuating greatly in recent years [8]. Under the current management practices (water management, fertilizer, planting density, etc.), it is enough to meet the demand of maize growth and development, so the uncertainty of weather factors (high temperature, drought, etc.) has been the main reason for the yield variations. However, inadequate temperature accumulation from April to October is one of the main reasons for spring maize production decreasing in the NEC [9,10]. With the impact of global climate change, the effective cumulative temperature during the crop growing season has increased significantly, and the effective cumulative temperature (≥10 °C) increased by 200–400 °C d in most areas of the NEC since the 1970s [2,4]. The increase in the effective cumulative temperature has shifted the medium-season and long-season maize cultivars’ planting boundaries northward and expanded the plantable area [11]. However, climate change will not be advantageous to the development of maize production in low latitude areas. High temperatures, and especially extreme temperatures, before and during the flowering period, can seriously affect pollen germination and pollination, and can lead to the grain-filling time shortening and the yield decline [12]. Moreover, other studies showed that while higher average temperatures during sowing and maturity are beneficial for maize yields, excessive rainfall or prolonged cloudy and rainy weather, especially during sowing and flowering, is harmful [10,13]. Therefore, the interaction of rising temperatures, cloudy and rainy weather during flowering, and the amount of temperature accumulation needed by various maize cultivars in the NEC needs to be urgently addressed.
Though global change is happening—agriculture scientists are developing ways to tackle it. Planting measures, such as adjusting sowing dates and planting patterns, and adopting heat-tolerant/drought-tolerant cultivars, have been adopted to adapt to climate change and reduce crop yield losses [14]. Maize production depends heavily on local climate conditions, as temperature, rainfall, and solar radiation are important factors affecting maize yields [15]. The climatic conditions at each growth stage of maize also changed with the change of cultivar and sowing date, which affected its growth and yield formation, leading to the change of spring maize yield with the change of cultivar selection and sowing date [16,17]. Previous studies have shown that early sowing is more productive than late sowing [13], while late sowing effectively mitigates heat stress [17]. Meanwhile, heat-tolerant cultivars that can mitigate the effects of high temperature on leaf area, photosynthetic rate, and growth and development, to some extent can be used to reduce yield losses. This approach will help reduce yield losses under high-temperature conditions due to reduced kernel number [18].
Therefore, the present study focused on maize cultivar selection and sowing adjustment to adapt to the growth conditions, promote plant growth and development, and achieve stable and high yields. The objectives were (1) to evaluate the effects of climate factors on the kernel number, 1000-kernel weight and grain yield, and analyze the risks of high temperature, low radiation interception due to cloudy weather, and harvest losses caused by early senescence and frost and (2) to evaluate the effects of cultivar and sowing date selection on grain yield in the NEC using the APSIM model.

2. Materials and Methods
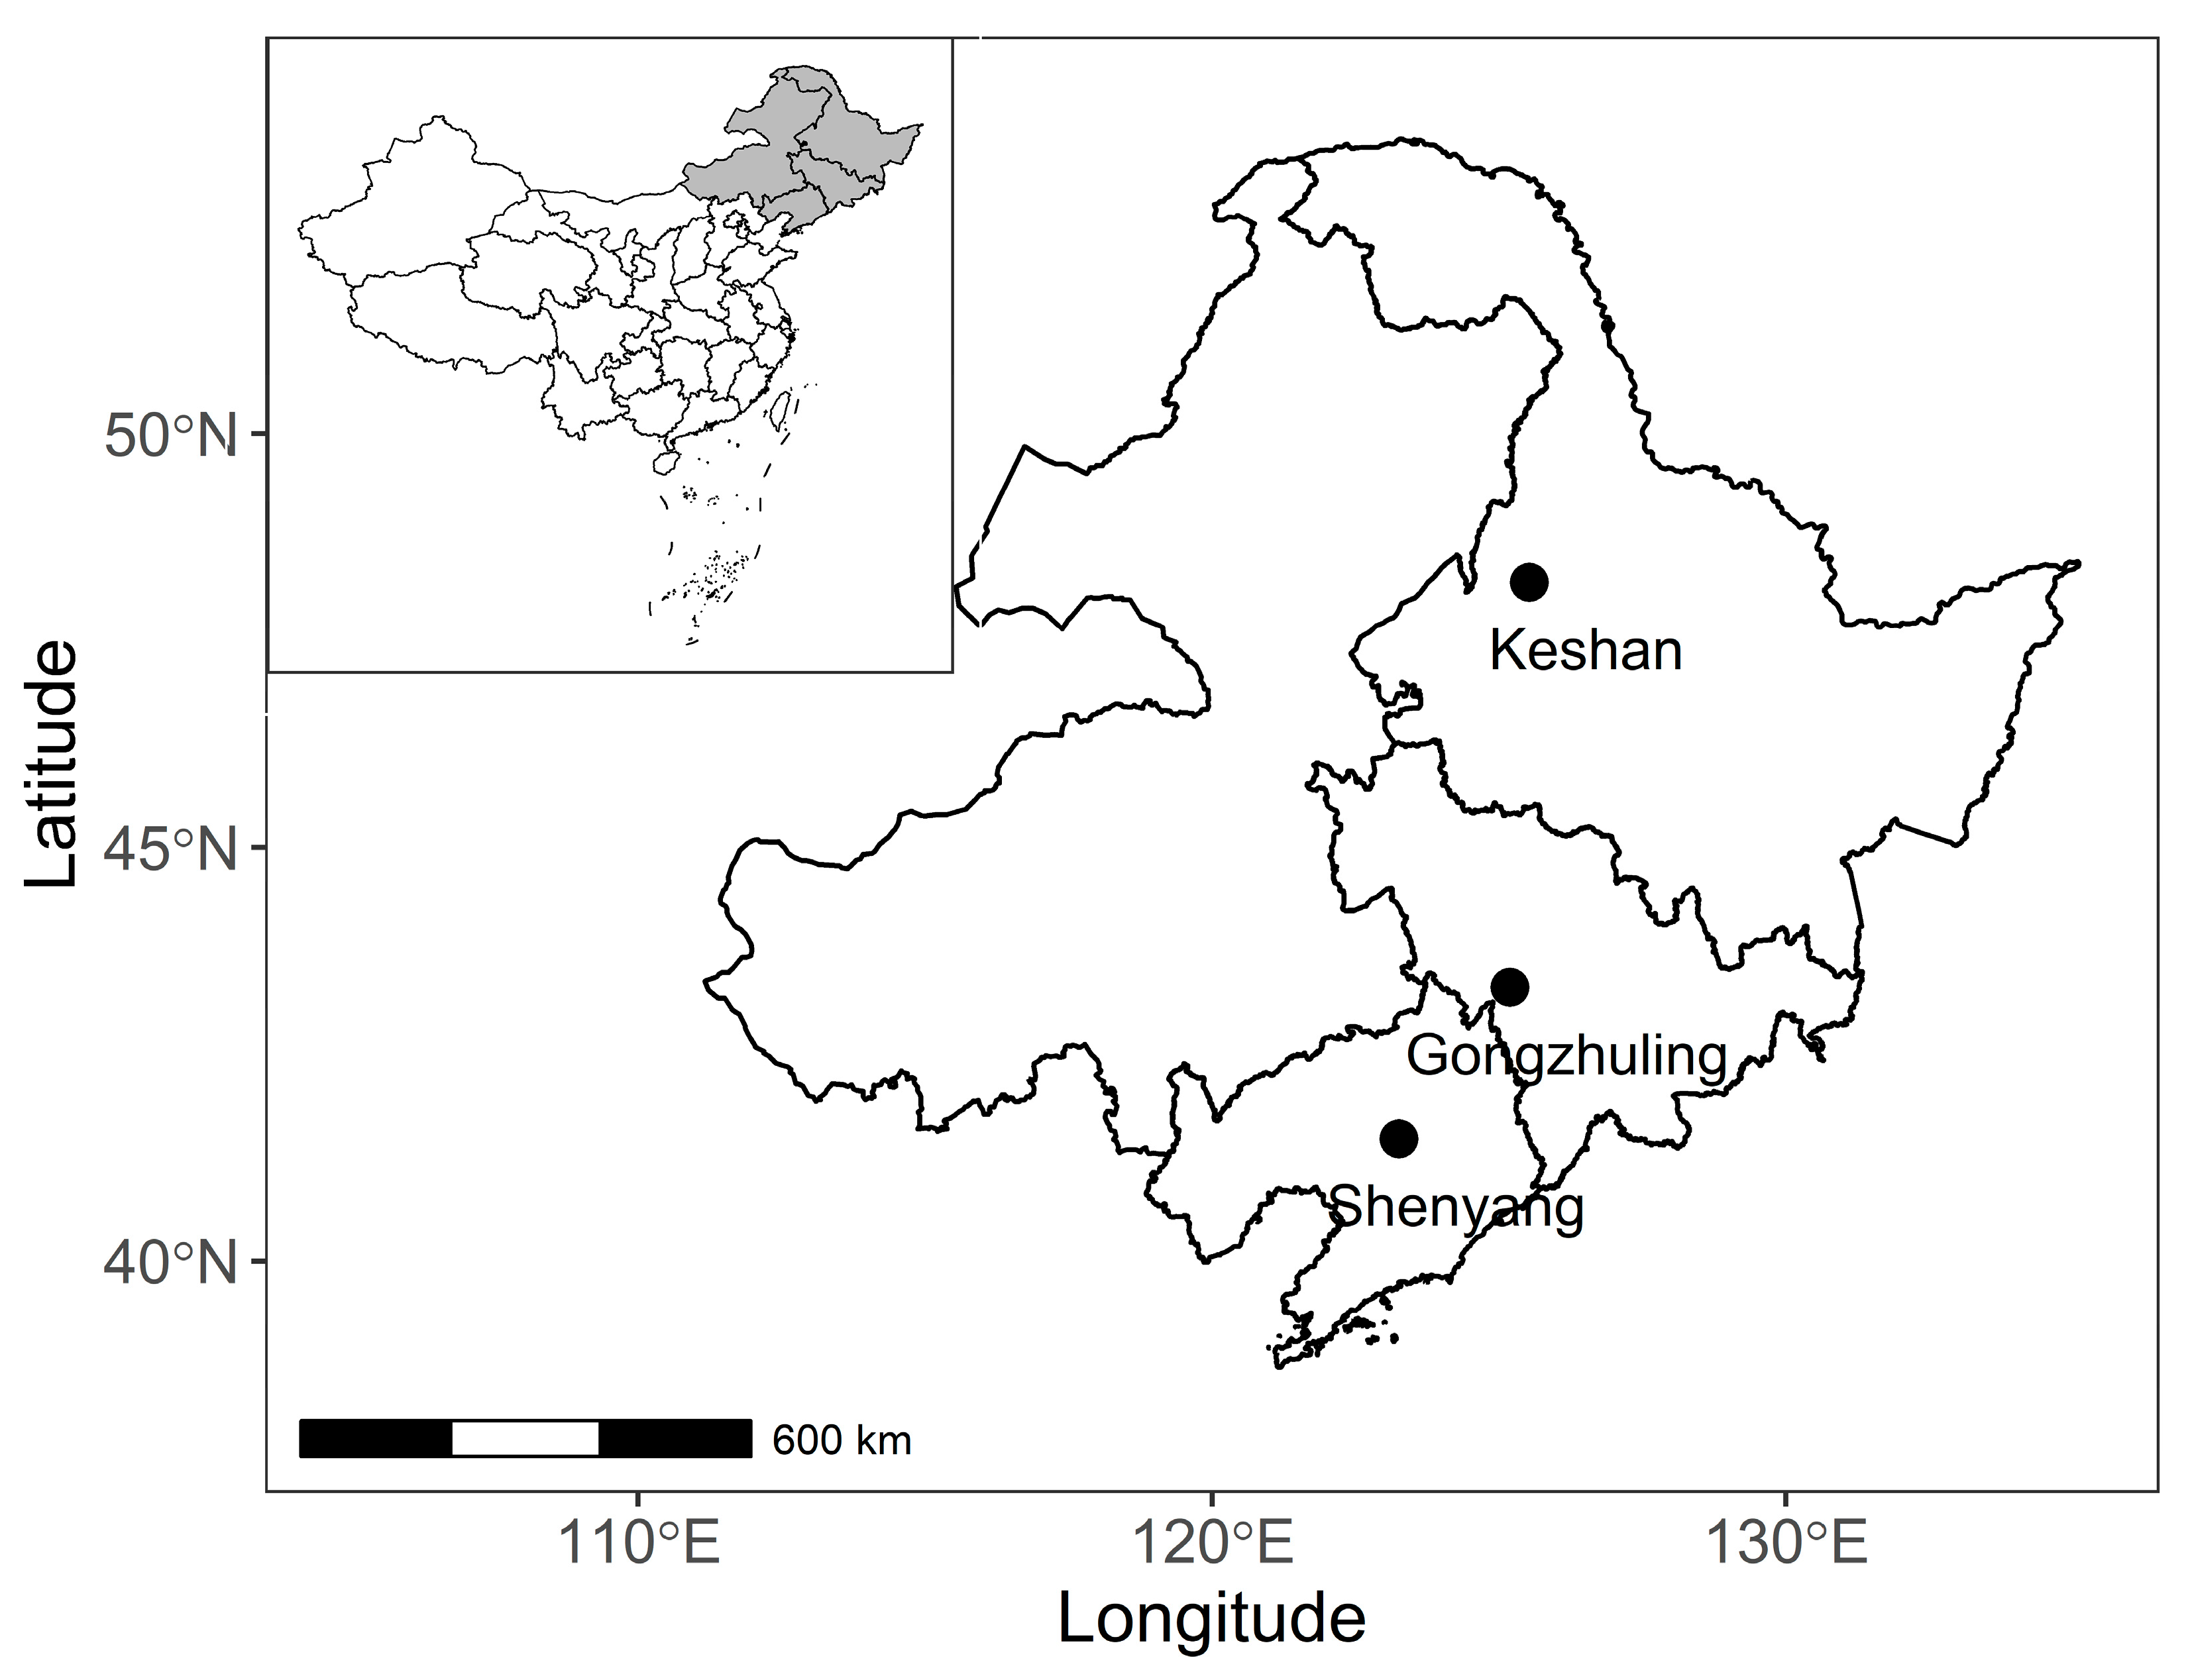
2.1. Study Site

The study area lies in the Northeast China Plain (NEC) and the field experiment was conducted at the three experimental stations (Figure 1). The soil parameters (0–40 cm) of the three stations are shown in Table 1. The mean temperature of frost-free stage in the region is 17.4 ± 1.7 °C (Figure A1), and the mean precipitation is 411.1 ± 150.1 mm (Figure A3).

2.2. Experimental Design
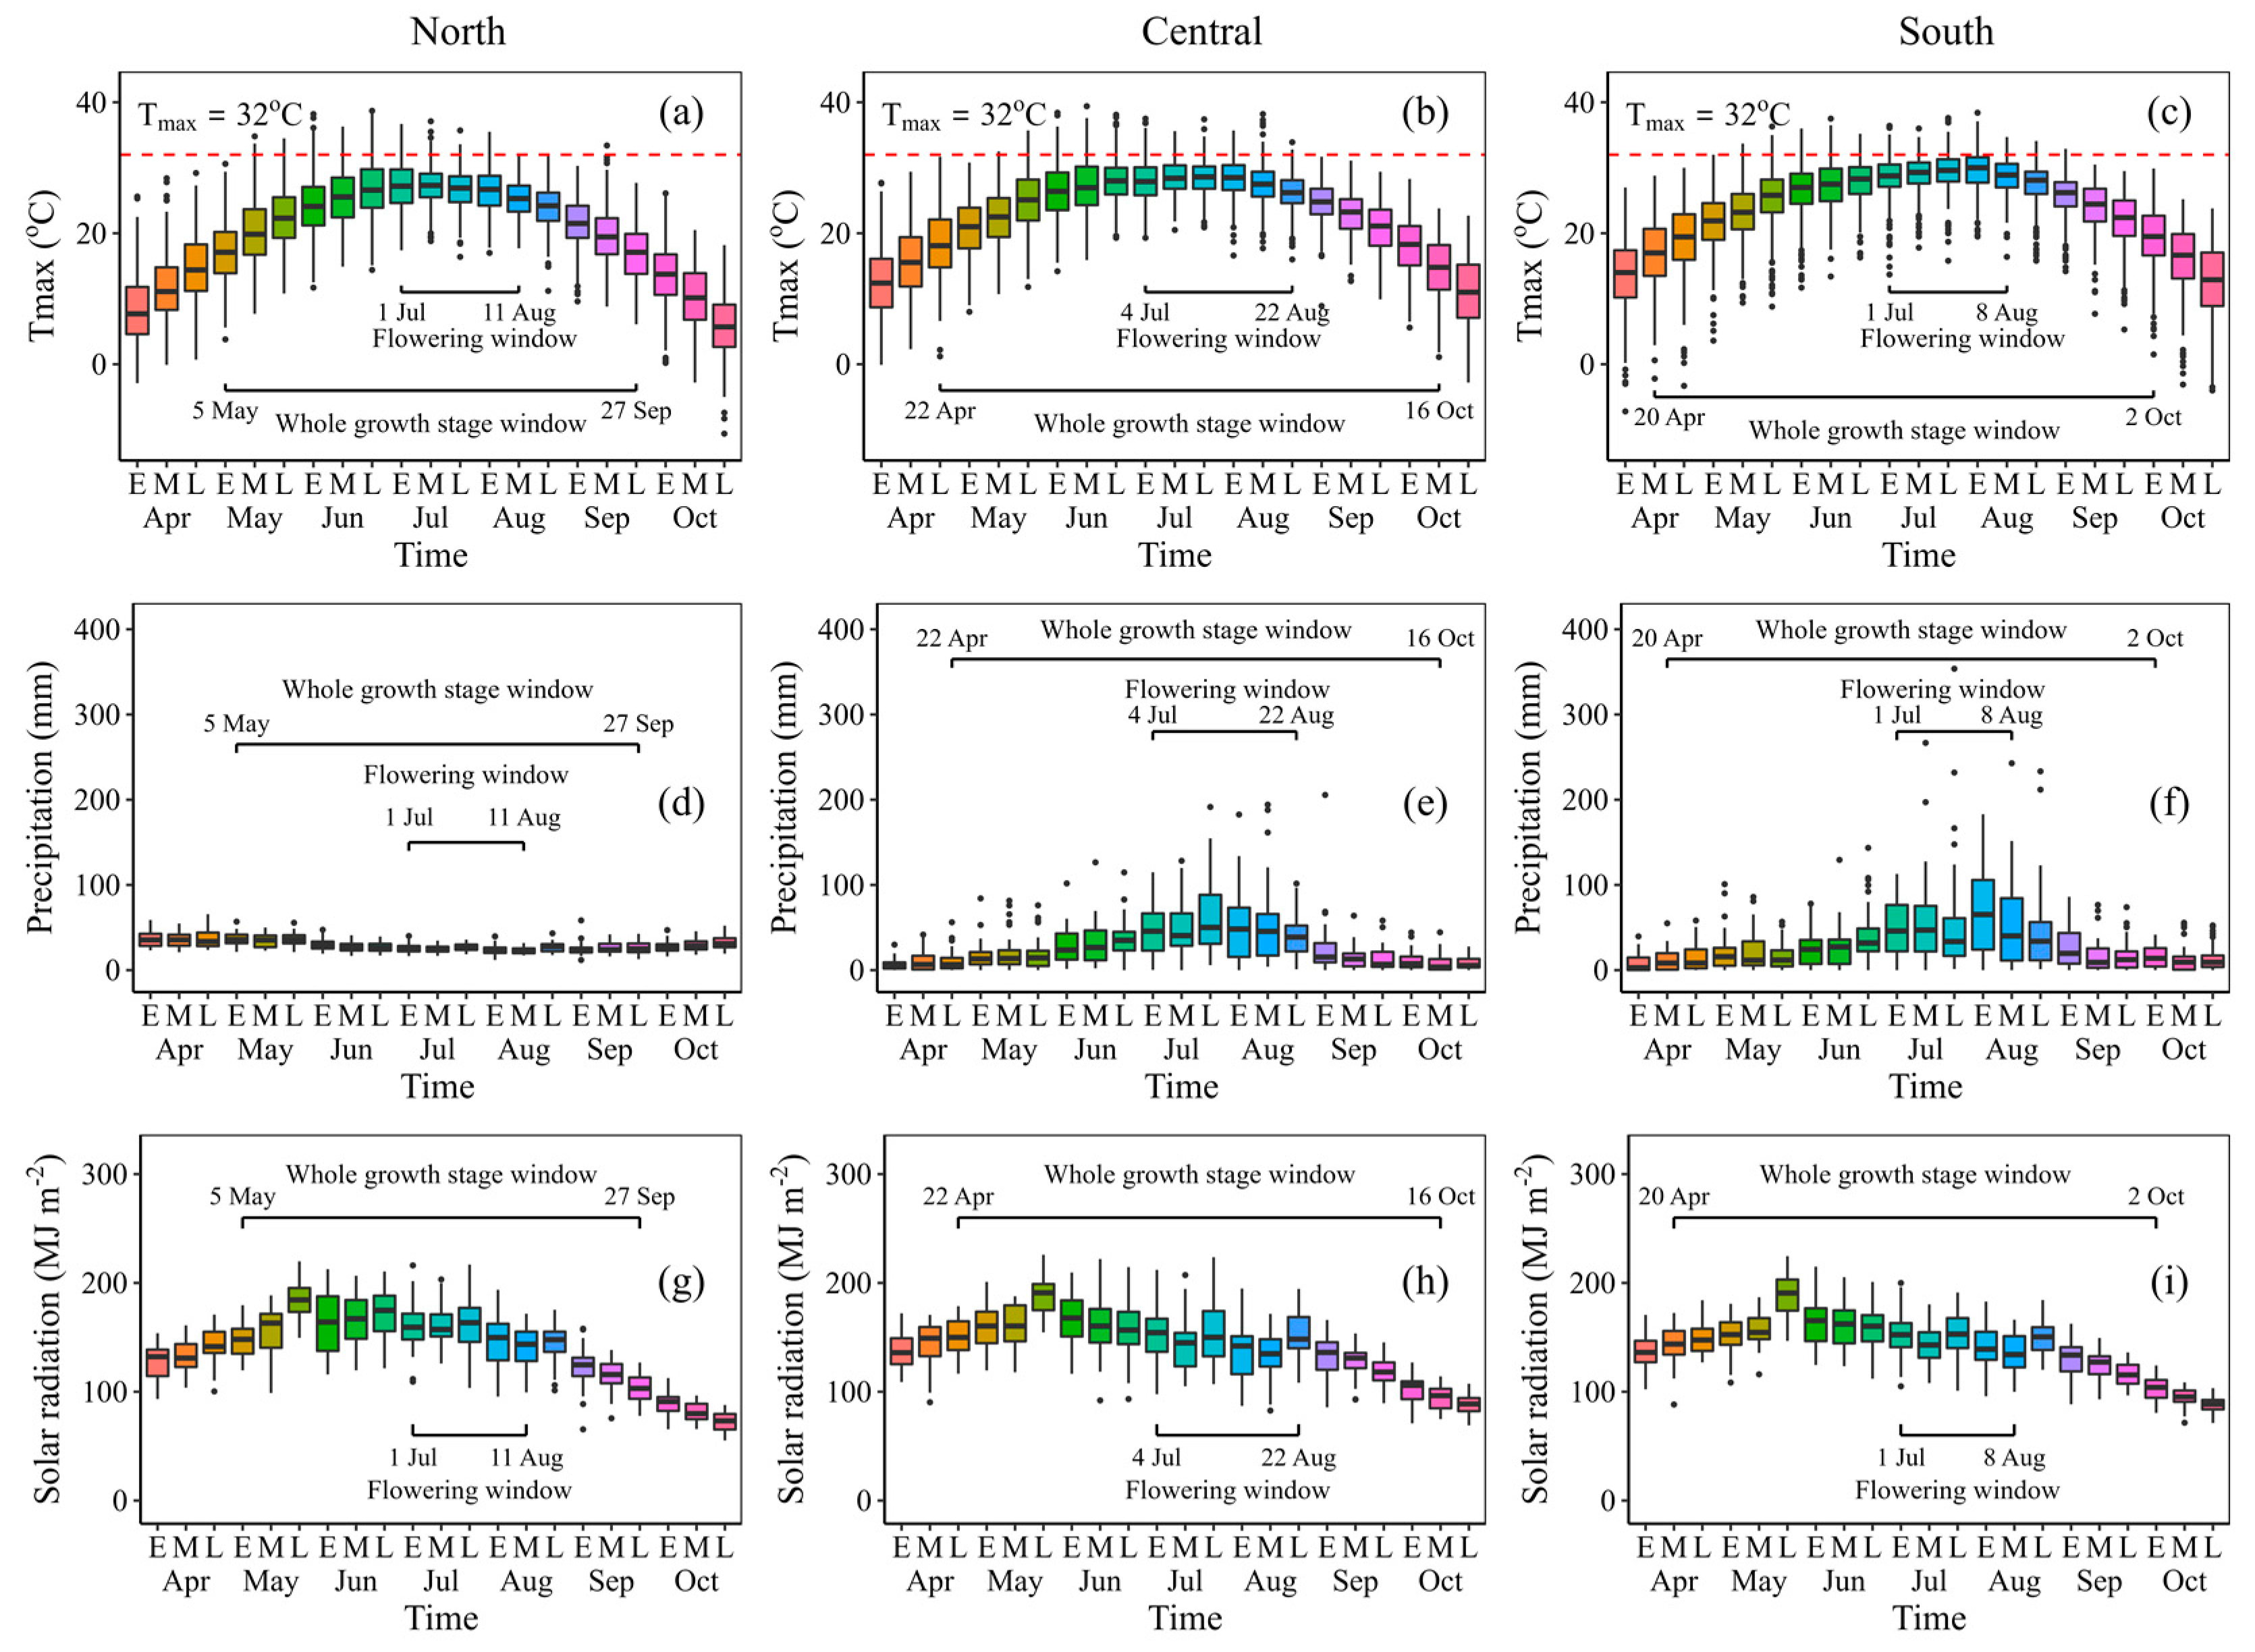
The field experiment was conducted in 2017–2019. Cultivars and sowing dates were set for each experimental station, using the maize cultivars widely grown in the area where each station is located. To explore the impact of cultivars on maize yields for each experimental station, we grouped the maize cultivars by the growing degree days (GDD) from sowing to physiological maturity (PM) for each station: relative short-season (SS), medium-season (MS), and long-season (LS). The planting density was the local conventional planting density (Table 2). The field experiment was conducted in a completely randomized block design with three replicates. The area of each plot was 195 m2. Basal fertilizers were applied at 225 kg N ha−1, 90 kg P ha−1, and 120 kg K ha−1 as urea (46% N), calcium superphosphate (12% P2O5), and muriate of potash (60% K2O) before sowing. Then, tillage was carried out to a depth of 15 cm using a rotary tiller, and seeds were sown in conventional ridges (ridge width 45 cm, ridge height 15 cm). The time of flowering (VT) and physiological maturity (PM) were recorded, as well as the grain yield (14% water content), kernel number, and 1000-kernel weight (14% water content) at PM.

2.3. Weather Data

Weather data, including daily maximum temperature (Tmax), minimum temperature (Tmin), sunshine hours, and precipitation between 2017 and 2019 were collected from the automatic meteorological station at the experimental site. The historical weather data of the NEC were downloaded from State Meteorological Administration of China (http://data.cma.cn/, accessed on 3 September 2020), including Tmax, Tmin, sunshine hours, and precipitation. The Penman–Monteith formula was used to convert sunshine duration into solar radiation [19].

2.4. APSIM Model Calibration, Validation, and Simulation Scenarios

The Agricultural Production Systems sIMulator, APSIM, version 7.10 (build number r4219), is an open source, field scale simulator of farming systems that includes many crops, soil, and environmental models. APSIM was used to simulate days from sowing to flowering, days from sowing to maturity, and grain yield of maize crop at the study site [20,21]. In APSIM, phenological development of maize from emergence to maturity is driven by the accumulation of thermal time, with photoperiod before floral initiation regulating the accumulation rate. However, the model does not consider the impact of biotic constraints, such as insects and diseases.
The 2017–2018 field experiment data were used to calibrate the APSIM model for simulating maize growth and yield based on the measured phenology and grain yield. First, the genetic coefficients were derived using a trial-and-error method to match the simulated crop anthesis and maturity dates with the observed data. Then, the model was run with the derived crop parameters, and the performance was evaluated based on the grain yield. After calibration, the model was validated against the 2019 experimental data.
To further investigate the impact of management practices (sowing date and maize cultivar) and weather factors on maize yield, the calibrated APSIM model was used to simulate the following scenarios in 1980–2019: three different maize cultivars (SS, MS, and LS maize cultivar) and three sowing dates, for each station, same as the field experiments (Table 2). Irrigation was not performed for any of the simulations, fertilizer and rotary tillage were applied at sowing, same as the field experiments. Lastly, we considered the effect of elevated CO2 on maize yields to be negligible for this analysis, even though CO2 concentration increased from 1980 (350 pm) to 2019 (410 pm), as maize is a C4 crop [22].

2.5. Statistical Analysis and Calculations

Statistical analyses were performed with the R platform (v4.0.5, https://www.r-project.org/, accessed on 5 April 2021). Significant differences were performed to identify the difference among treatments in grain yield using a significance threshold of p < 0.05. Linear correlation analyses were applied to characterize the relationship between various parameters, and Pearson’s correlation coefficients were determined at p < 0.05. All figures were created using ggplot2 package with the R platform.
The growing degree days (GDD) was estimated with the Equation (1) [23,24].
GDD = i = 0 n D i ,   D i = 0 , T i < T b a s e T i T b a s e , T b a s e T i T o p t T o p t T b a s e , T i > T o p t ,
where n is the number of days, T i is the daily average temperature, T o p t is the optimum temperature for maize growth and development, and T b a s e is the lower limits. T b a s e and T o p t were set at 10 °C and 32 °C, respectively [12].
We used the Standard Score Normalization method to transform the data [25]. In standard score normalization, also called z-normalization, each value was replaced by its z-score and estimated with the Equation (2).
x i = x i μ ^ σ ^ ,
where μ ^ is the sample mean and σ ^ 2 is the sample variance of X.
Linear regression analysis was used to detect the trend in the observed data. The linear regression coefficient (α), the nodal increment (β), the relative root mean square error (RMSE%), the index of agreement (D), and the coefficient of determination (R2) were used to evaluate the accuracy of the simulation against the field observations using the Equations (3)–(5).
R M S E % = i = 1 n ( o b s i s i m i ) 2 n o b s ¯ × 100 %
D = 1 i = 1 n ( o b s i s i m i ) 2 i = 1 n ( | o b s i s i m ¯ | + | s i m i o b s ¯ | ) 2
R 2 = ( i = 1 n ( o b s i o b s ¯ ) ( s i m i s i m ¯ ) i = 1 n ( o b s i o b s ¯ ) 2 i = 1 n ( s i m i s i m ¯ ) 2 ) 2
where s i m i is the ith simulated value, o b s i is the ith observed value, n is the number of data pairs, o b s ¯ is the average of all observed data, and s i m ¯ is the average of all simulated data. Model simulations with RMSE% < 10%, D > 0.7, and R2 > 0.70 were considered acceptable [26].

3. Results

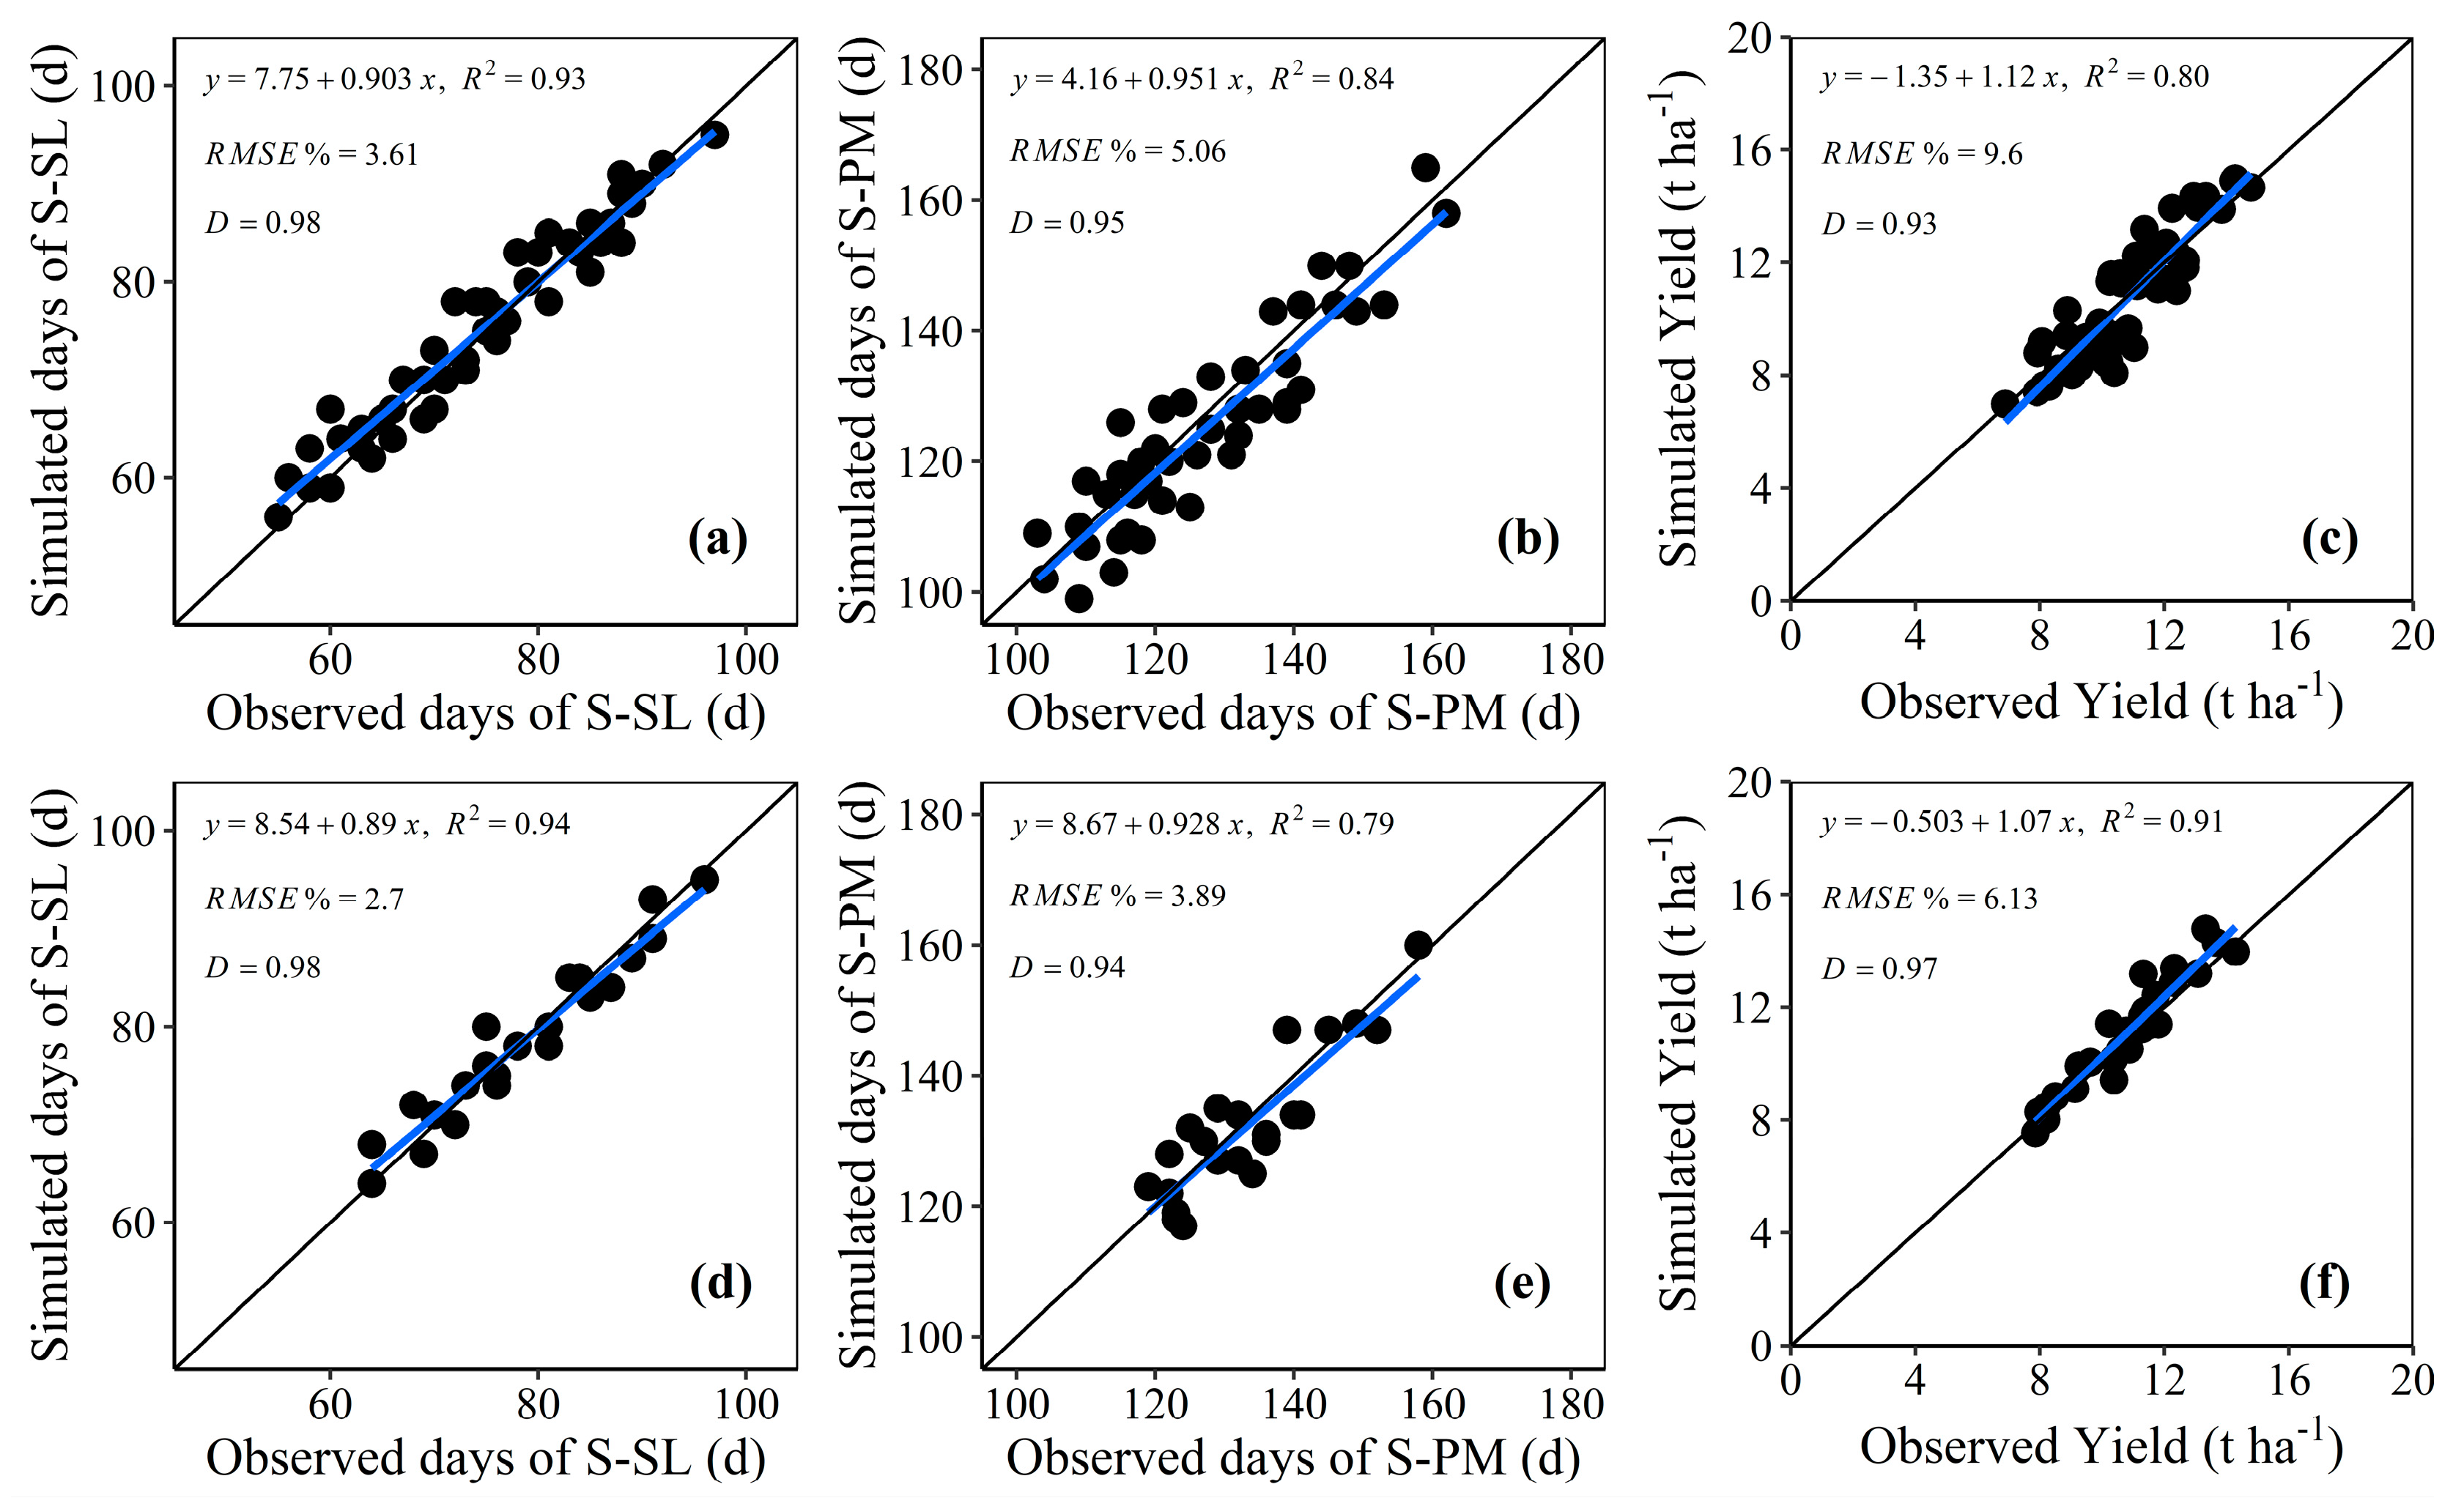
3.1. APSIM Calibration and Validation

The slopes (α) of the regression lines for all parameters for the APSIM model calibration were close to 1.0 (Figure 2), indicating no significant overestimation or underestimation. The comparison between the simulated and observed values showed that the model explained 87% of the variation in yield. Overall, the model-simulated phenological dates (flowering date and maturity date) and grain yield agreed with the observed data of 2017–2019. During validation, the APSIM model predicted the flowering date, maturity date, and grain yield with R2 of 0.94, 0.79, and 0.91; D values of 0.98, 0.94, and 0.97, and RMSE% values of 2.70, 3.89, and 6.13, respectively (Figure 2). These calibration and validation results indicate the ability of the APSIM model to capture the interannual variations in phenology and yield of maize cultivars with variations in weather conditions and sowing dates in the NEC.

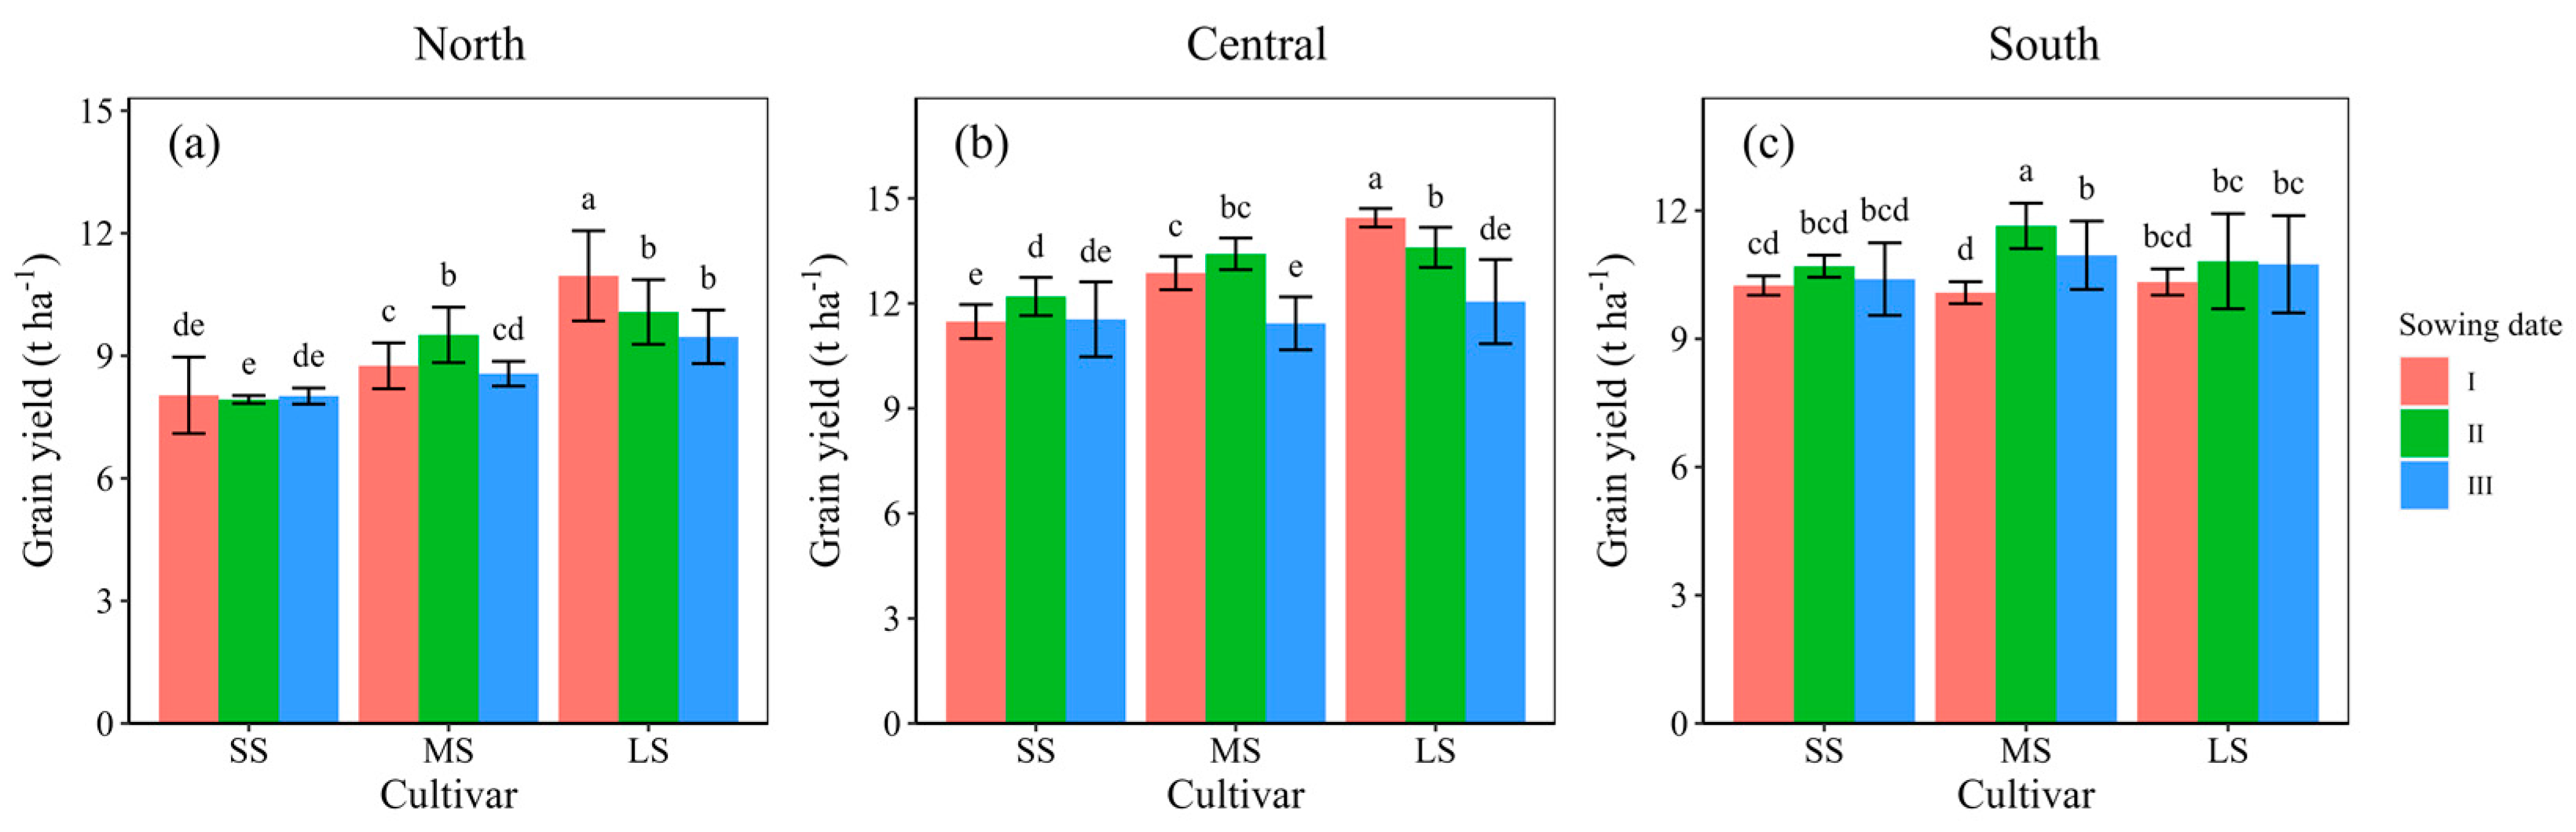
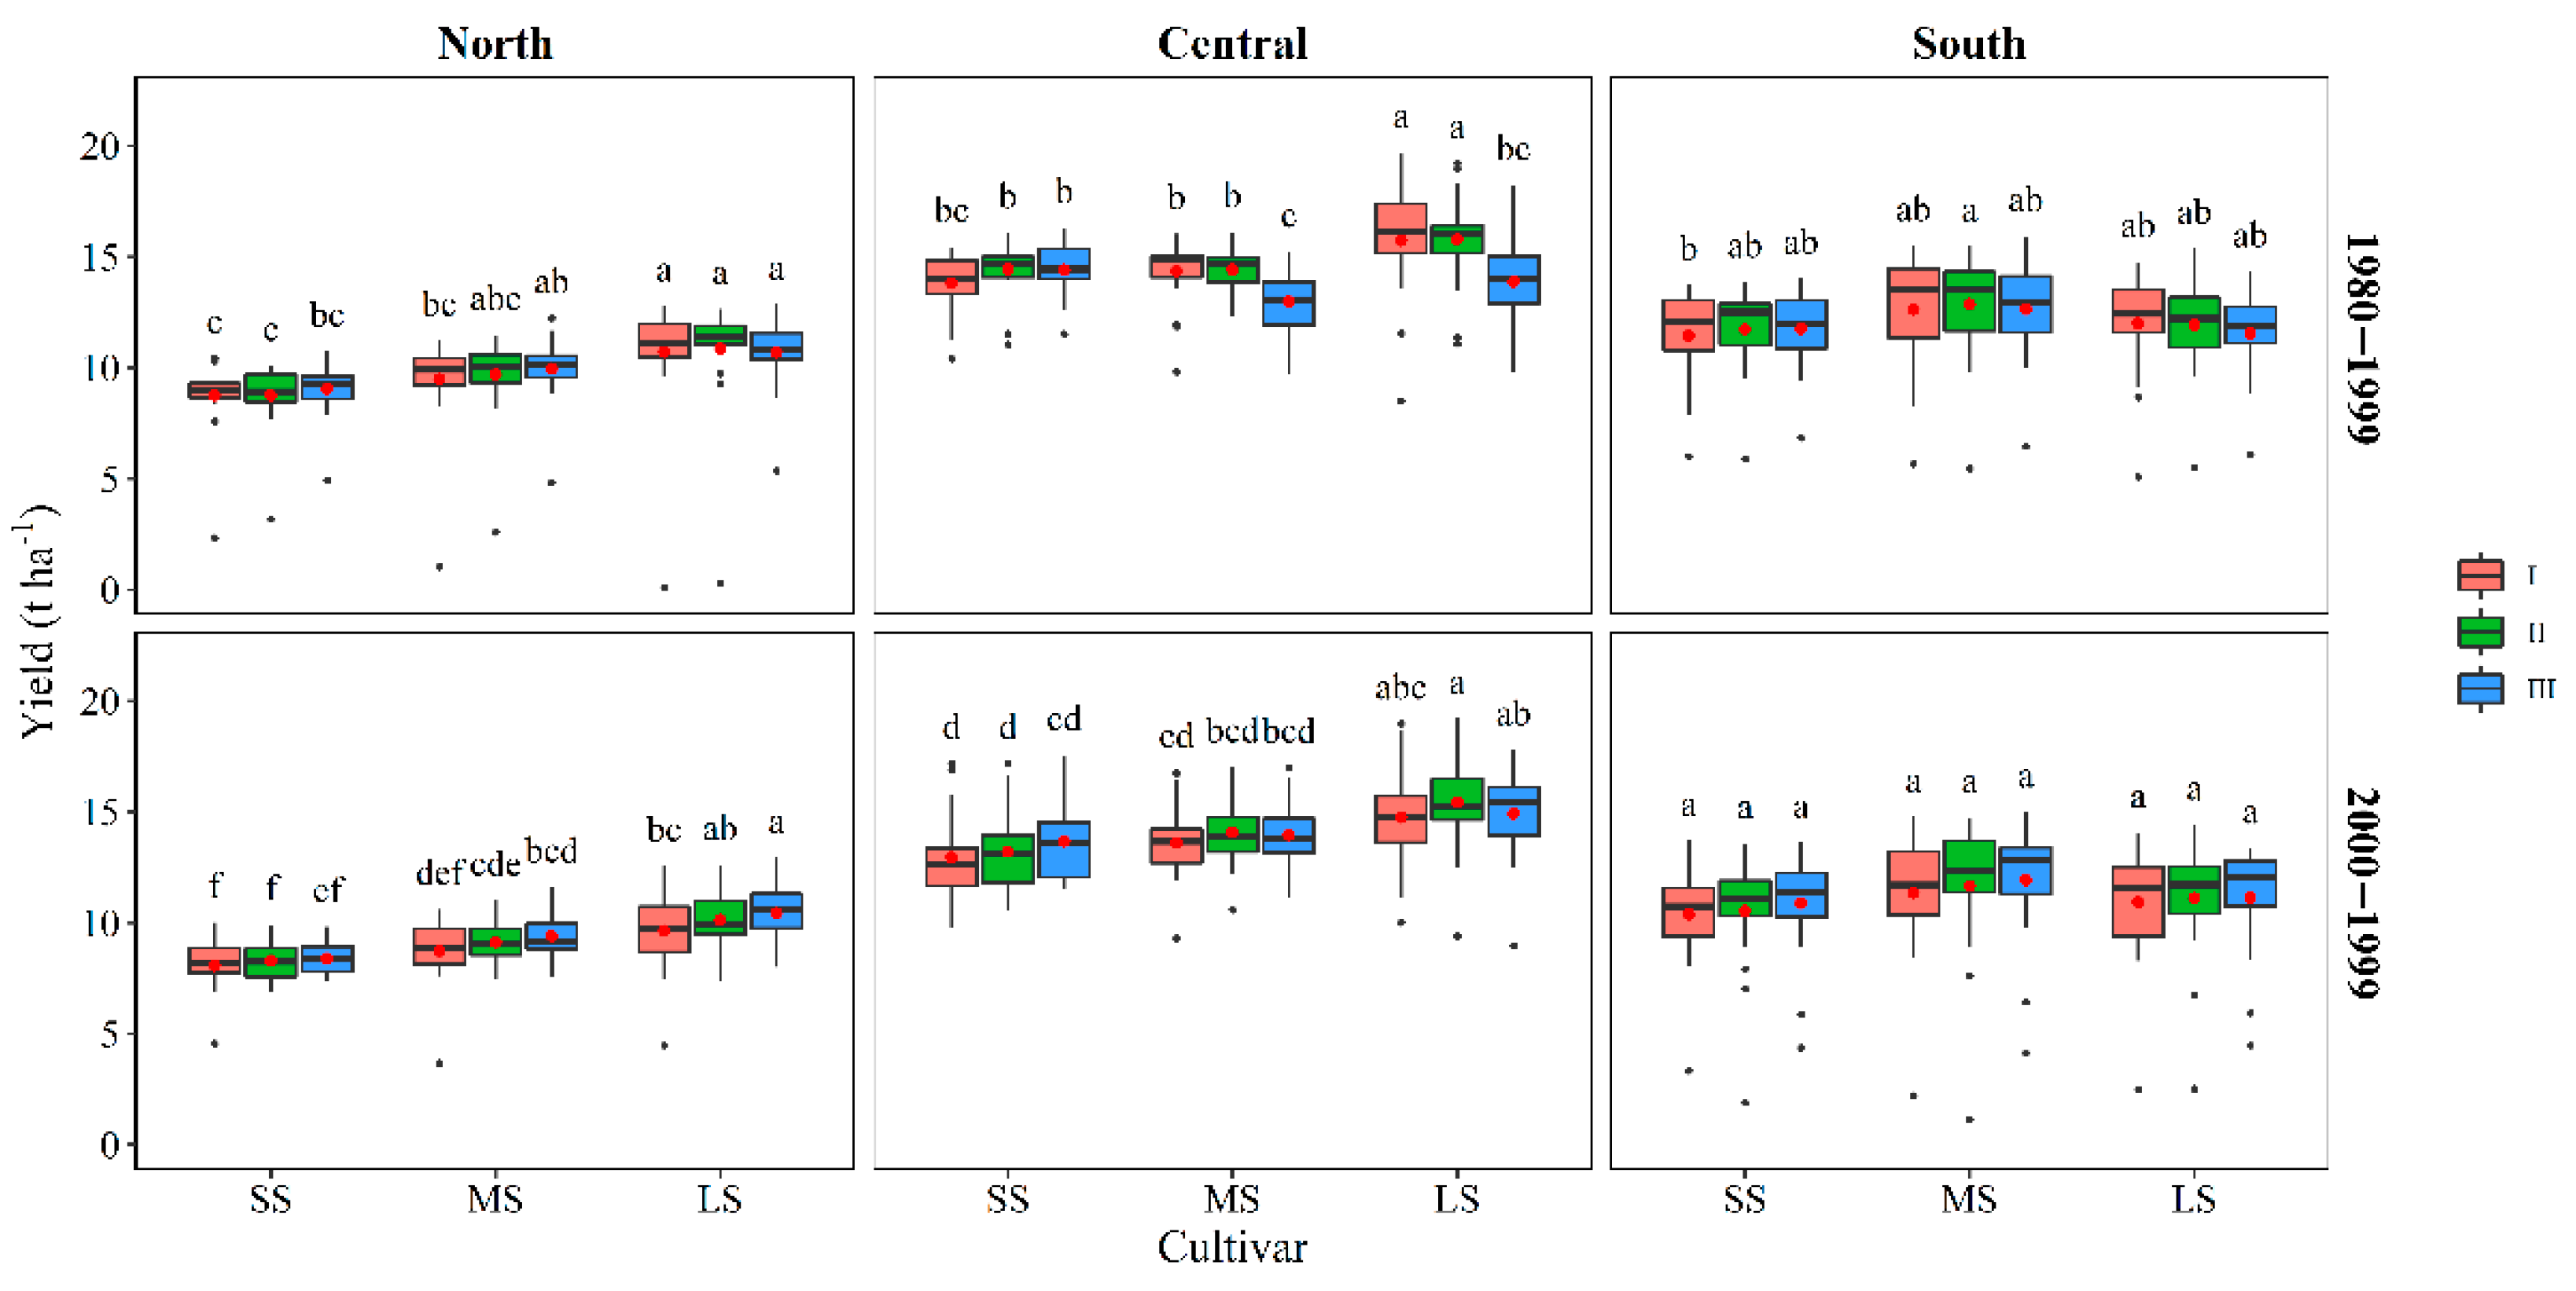
3.2. Effects of Cultivar and Sowing Date on Grain Yield

In the central NEC, medium sowing (II) of SS resulted in higher grain yields than early sowing (I, 5.9%) and late sowing (III, 5.3%), but there was no significant difference in SS yields among sowing dates in the north and south of the NEC (Figure 3). The grain yield of MS II was higher than MS I and MS III for all study locations. In the northern and central NEC, the grain yield of LS I was highest (11.0 and 14.4 t ha−1, respectively), but yields significantly decreased with delayed sowing dates (8.1–13.6% and 5.9–16.6% for II and III respectively). Sowing date did not, however, significantly affect LS yields in the southern NEC.

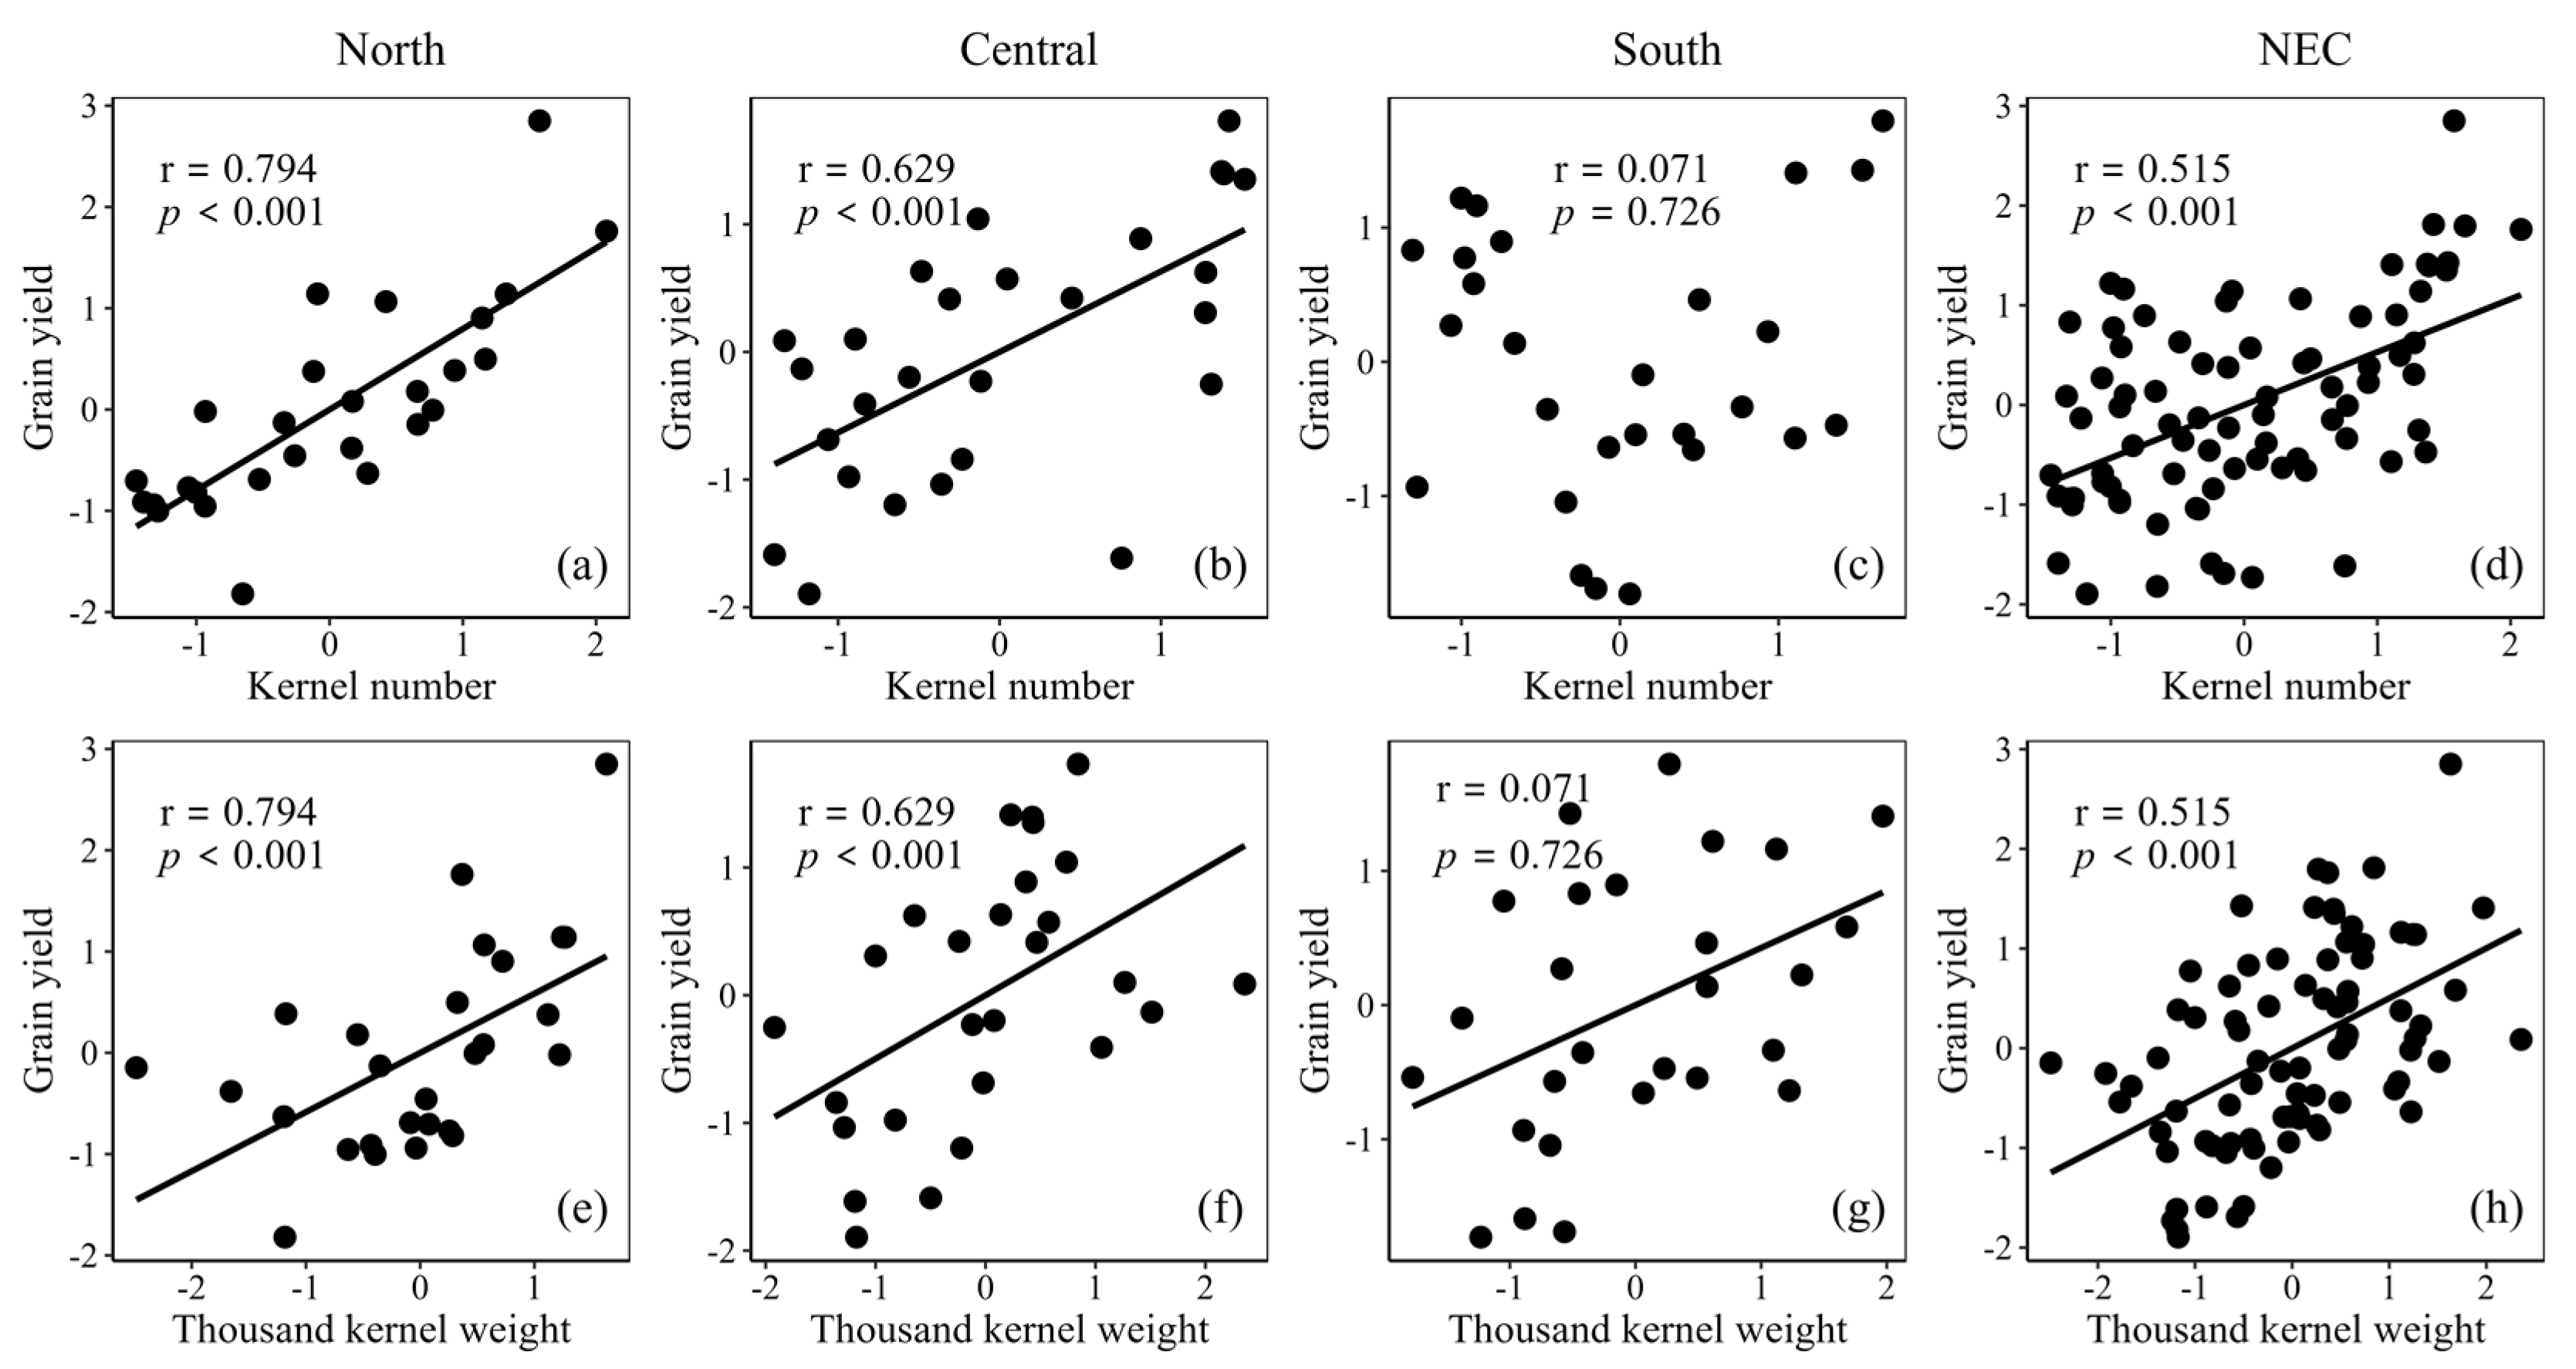
3.3. Relationship between Grain Yield and Its Composition and Climate Factors

Grain yield was positively correlated with 1000-kernel weight and kernel number (p < 0.05, Figure 4) for all study locations. However, it was not correlated with kernel number (p > 0.05, Figure 4) in the southern NEC. As Table 3 shows, during morphogenesis stage, the Tmin was negatively correlated with grain yield (p < 0.05), while the diurnal thermal range (∆T), rainy days (RD), precipitation, solar radiation (SRAD), and growing degree days (GDD) were positively correlated with grain yield (p < 0.05). Meanwhile, the Tmin was negatively correlated with kernel number (p < 0.05), while ∆T, RD, SRAD, and GDD were positively correlated with kernel number (p < 0.05). Positive correlations were observed between 1000-kernel weight and ∆T, RD, and SRAD of morphogenesis stage (p < 0.05). Negative correlations were observed between 1000-kernel weight and Tmax, Tmin, and GDD (p < 0.05). For flowering stage, the heat stress days (HSD), ∆T, and SRAD were negatively correlated with grain yield (p < 0.05), while precipitation was positively correlated with grain yield (p < 0.05). Precipitation had a negative correlation with kernel number (p < 0.05). A positive correlation between 1000-kernel weight and precipitation was observed for flowering stage (p < 0.05), while 1000-kernel weight was negatively correlated with RD and ∆T (p < 0.05). At grain-filling stage, ∆T, RD, precipitation, and SRAD had a positive effect on grain yield (p < 0.05), but HSD and Tmin were opposite. Meanwhile, 1000-kernel weight was positively correlated with Tmax, ∆T, HSD and SRAD, and 1000-kernel weight negatively correlated with RD (p < 0.05). Kernel number was positively correlated with ∆T, RD and SRAD. For the whole growth stage, grain yield had a positive correlation with ∆T, RD, precipitation, SRAD and GDD, and a negative correlation with Tmin and HSD. Increasing ∆T, RD, SRAD and GDD positively influenced kernel number, and Tmax and Tmin negatively influenced it (p < 0.05). Additionally, increasing Tmax and SRAD had a positive effect on 1000-kernel weight (p < 0.05).

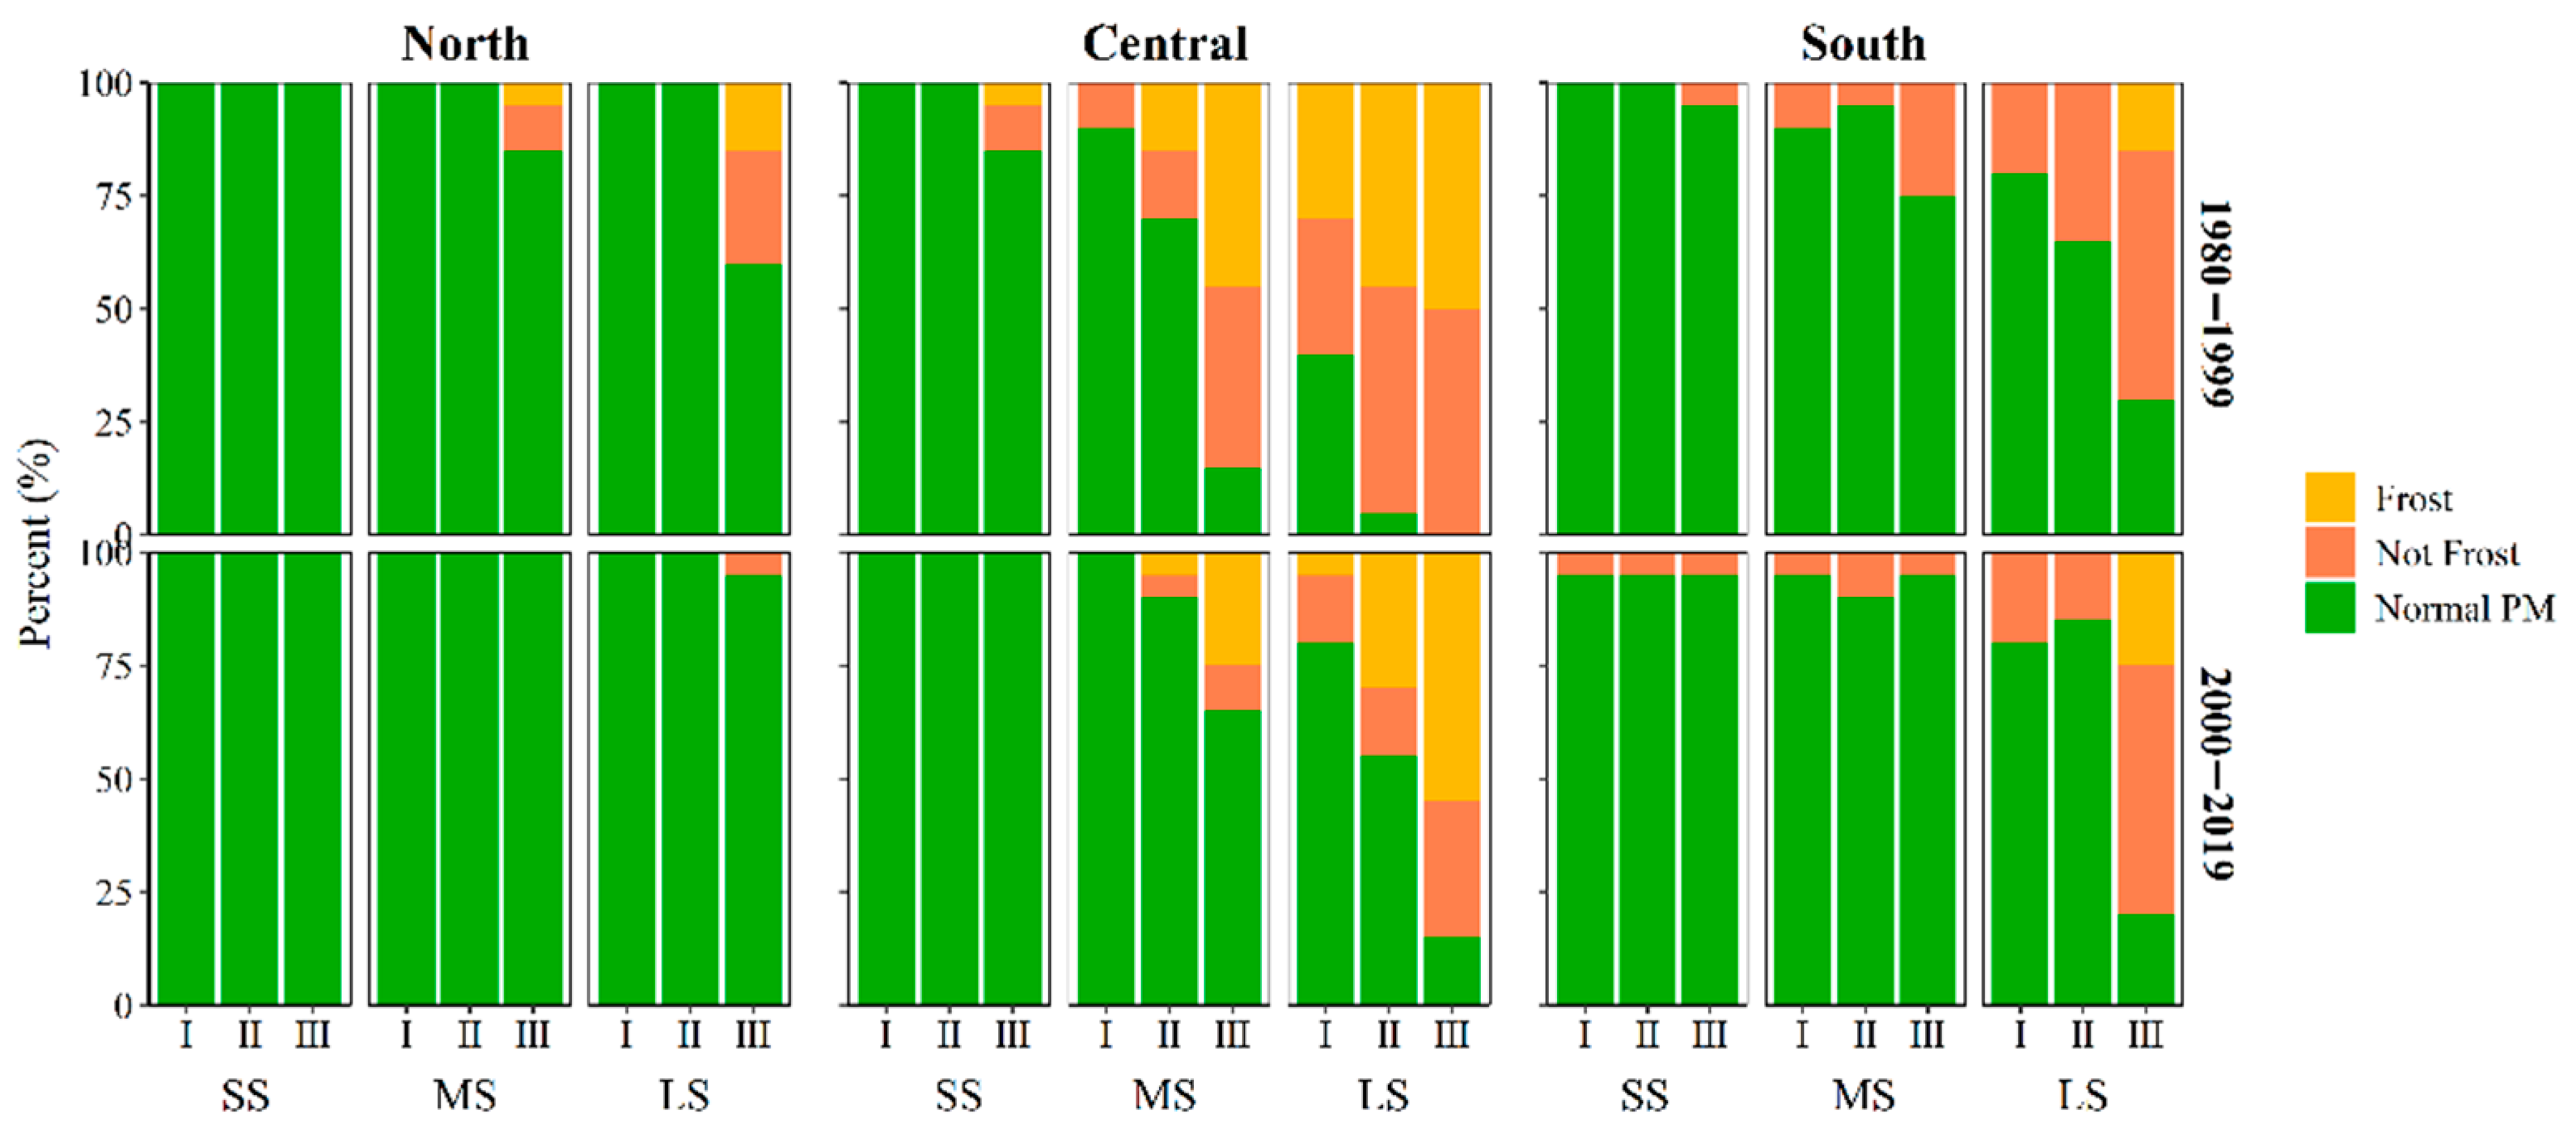
3.4. Yield Simulation and Risk Assessment

For all study locations, the heat stress (T > 32 °C) was inevitable for maize from sowing to physiological maturity; the frequency of heat stress was 5.2–14.3%, which occurred much of the early to mid-season, but temperatures were consistently below 32 °C for the later season (Figure 5). During the whole growth stage of maize, the fluctuation of the precipitation in the northern NEC was lower than that in the central and south of the NEC. In the central and south of the NEC, the precipitation was extremely uneven, with less in the early and later stage (even 0 mm per ten-day) and more in the flowering stage (even more than 200 mm per ten-day). The mean precipitation of the flowering stage in the northern NEC (25.2 ± 5.1 mm per ten-day) was lower than that in the central and south of the NEC (50.7 ± 37.5 and 54.8 ± 52.9 mm per ten-day, respectively) (Figure 5). After September, the precipitation began to decrease (Figure 5). Meanwhile, precipitation during grain-filling stage decreased with delaying of sowing date (Figure 6b). The trend of solar radiation was consistent among all study locations, the mean solar radiation was 137.8 ± 35.2, 140.9 ± 31.1 and 140.0 ± 29.0 MJ m2 (10 d)1, respectively, during the whole growth stage (Figure 5). The accumulated solar radiation at grain-filling stage increased with delayed sowing date, while in the central NEC, the solar radiation decreased with delayed sowing date (Figure 6c). Similarly, the diurnal thermal range (∆T) increased with delayed sowing date, and the ∆T of LS cultivar was the highest, followed by MS and SS cultivars (Figure 6a).
Compared with 1980–1999, the grain yields of 2000–2019 decreased for all study locations, the sowing date for maximum grain yield was delayed, and yield fluctuation increased (Figure 7), but the frost risk decreased (Figure 8). In the northern NEC, the grain yield of LS was the highest, which was 9.6–10.8 t ha−1 in 1980–2019, followed by MS and SS. There was no significant difference among sowing dates for three cultivars. In the central NEC, the grain yield of MS and LS cultivars was higher than that of SS cultivars, and from 2000 to 2019, the grain yield of LS cultivars was the highest in early sowing (14.7–15.4 t ha−1), and the risk of frost was the lowest (≤20%), but the sowing date had no significant difference in the grain yield. In the southern NEC, the grain yield of MS was the highest, which was 11.4–12.9 t ha−1 in 1980–2019. Delayed sowing caused a significant increase (up to 80%) in early senescence and frost risk.

4. Discussion

Extreme temperatures, especially during the flowering stage, severely restrict maize growth and development. Persistent extreme-temperature conditions will decrease the setting rate, or even cause extinction lasting for several days with heat stress [27,28,29]. Meanwhile, reduction of solar radiation and frequent rainy and overcast weather at flowering (July and August) lowered the seed setting rate and grain yield in maize [28]. In this study, although the frequency of high temperatures in the NEC is low (Figure 5), the high-temperature weather still negatively affected yield formation. However, with the intensification of global change, the frequency of extremely high temperatures is expected to increase, and maize production will face serious challenges [30]. Besides, the heat stress risk (Tmax > 33 °C) around flowering for all cultivars and sowing dates was 23–36%, and adjusting the sowing date alone will not avoid the impact of high stress on maize production [16]. In this study, we obtained similar results and found that the negative effects of heat stress and cloudy and rainy weather on maize grain yield could be reduced by delaying sowing date to increase the rainfall during morphogenesis stage, and reduce the days of heat stress and cloudy and rainy weather during flowering stage and grain-filling stage. Under the climate change, grain yield would be reduced drastically without changing the field management practices and breeding the new cultivars [31,32]. Therefore, changing the sowing date needs to be coupled with the choice of cultivars (e.g., heat-tolerant cultivars) and improvement in management measures (e.g., fertilization, irrigation) to reduce yield losses.
Weather conditions such as temperature, solar radiation, and precipitation influence maize growth and development, grain formation, and dry matter accumulation. Among these factors, temperature and solar radiation have the most significant influence on maize growth [33]. Each growth stage (seedling, flowering, and grain filling) has specific temperature requirements, and the grain-filling stage is the most critical in grain formation. The 1000-kernel weight and grain yield were positively correlated with ∆T, and negatively correlated with Tmin (Table 3), while the negative effect of increasing Tmin on grain yield was higher than the positive effect of ∆T (Figure A2a), indicating that climate change had a negative effect on maize yield in the NEC. In addition, higher temperatures and lower yields, due to the effects of global change, are closely related to the shortened maize reproductive period. In general, high solar radiation in the plains leads to high temperatures and low solar radiation leads to low temperatures [34]. Solar radiation is the direct source of energy acquisition for crops. A decrease in solar radiation (shading) subsequently leads to a decline in biomass and yield [27,35,36,37]. In the present study, grain yield was closely related to solar radiation; grain yield was positively correlated with solar radiation at the grain-filling stage (Table 3). This correlation indicates that grain yield will increase as light interception increases under suitable temperature and water conditions. Therefore, it is essential to consider solar radiation when determining the optimal sowing date for different cultivars. The study’s results also indicate that maize breeders should develop cultivars that efficiently use climatic resources, such as temperature, solar radiation, and precipitation.
However, with the intensification of global change, the frequency and intensity of extreme events are expected to increase, seriously threatening the development of agricultural production [38]. At the mid and high latitudes, high temperatures will increase GDD, making the area suitable for longer season cultivars (Figure 7), which will extend the grain-filling period and benefit yield formation [39]. In the low latitudes, it is necessary to plant the relatively medium-season cultivars taking into account the effects of heat and drought on maize. The yield decline due to climate change is mainly because of accelerated crop growth and development, shortening crop reproductive period with higher temperature stress (Figure 5, Figure A2b), and increased crop evapotranspiration reducing photosynthetic rate and water availability [40,41]. The slight yield decrease (Figure 7, Table 3) with the 0.91 °C lower maximum and 0.46 °C higher minimum temperature during the frost-free period (Figure A1) was due to (i) decreased precipitation by 34.23 mm on average (Figure A3), (ii) decreased heat stress days by 2.81 days on average (Figure A2b), and (iii) increased water stress due to higher evapotranspiration demand, as increasing temperature corresponds to a higher vapor pressure deficit and thus, higher water stress [42]. However, in this study, we did not consider advances in cultivar genetics over time, which may further increase yields under climate change [43].
While most research focused on yield projections for different climate scenarios [44,45,46], we focused on management decisions because these decisions are also affected by climate change, but the previous studies were not given that. In the future, the current analysis can be expanded to the entire Chinese Maize Belt or even to a global scale, and incorporate predictions from more crop models and/or projected weather scenarios using a variety of global climate models. In this way, uncertainties in predictions with regards to model structure, soil inputs, and weather inputs can decrease, producing an actionable solution to decision-makers to assess the relative risks and cost of mitigating climate change [39,43].

5. Conclusions

In this study, maize grain yield in the NEC showed large inter-annual differences in the past 40 years, mainly as a consequence of different sowing dates, cultivars, and weather factors. The calibrated APSIM-maize model could simulate well the yield and phenological development under the changing conditions of those factors. The decreased rainy days, and the increased diurnal thermal range during the grain-filling stage were conducive to increasing 1000-kernel weight and promoting grain yield, under delayed sowing. Under climate change conditions, long-season cultivars should be sown early in high and medium latitudes and medium-season cultivars sown medium in low latitude, which were the appropriate cultivar and sowing date choices, thus, mitigating the stress of high temperatures, and reducing the risk of premature harvest caused by early senescence and frost. Therefore, our study provides valuable advice for breeders on cultivar selection, and the choice of varieties and sowing dates in actual production.

Author Contributions

Conceptualization, Y.W. and L.W.; methodology, X.S., Y.C., Y.W. and X.H.; software, X.H.; validation, L.D. and X.H.; formal analysis, X.S., Y.W. and L.W.; investigation, X.H. and L.D.; resources, Y.L., Y.W. and L.W.; data curation, X.H.; writing—original draft preparation, X.H.; writing—review and editing, Y.C., Y.W. and L.D.; visualization, X.H.; supervision, Y.W.; project administration, Y.L., Y.W. and L.W.; funding acquisition, Y.L., Y.W. and L.W. All authors have read and agreed to the published version of the manuscript.

Funding

This research was supported by the National Key Research and Development Program of China (2017YFD0300303) and the Agricultural Science and Technology Innovation Project of Jilin (CXGC2017JQ006).

Institutional Review Board Statement

Not applicable.

Informed Consent Statement

Not applicable.

Data Availability Statement

Not applicable.

Acknowledgments

The authors extend their appreciation to the National Key Research and Development Program of China and the Agricultural Science and Technology Innovation Project of Jilin.

Conflicts of Interest

The authors declare no conflict of interest.

Appendix A

Figure A1. Change of maximum temperature (Tmax, (a)) and minimum temperature (Tmin, (b)) during frost-free stage in the Northeast China Plain from 1980 to 2019.
Agronomy 12 00984 g0a1
Figure A2. Change of diurnal thermal range (∆T, (a)) and heat stress days (b) during frost-free stage in the Northeast China Plain from 1980 to 2019.
Agronomy 12 00984 g0a2
Figure A3. Change of precipitation during frost-free stage in the Northeast China Plain from 1980 to 2019.
Agronomy 12 00984 g0a3

References

  1. Lee, J.Y.; Marotzke, J.; Bala, G.; Cao, L.; Corti, S.; Dunne, J.P.; Engelbrecht, F.; Fischer, E.; Fyfe, J.C.; Jones, C.; et al. Future global climate: Scenario based projections and near-term information. In Climate Change 2021: The Physical Science Basis; Masson-Delmotte, V., Zhai, P., Pirani, A., Connors, S.L., Péan, C., Berger, S., Caud, N., Chen, Y., Goldfarb, L., Gomis, M.I., et al., Eds.; Cambridge University Press: Cambridge, UK, 2021. [Google Scholar]
  2. Gong, D.P.; Gong, W.L. Impacts of Climate Change on Maize Production in Northeast China and Countermeasures. J. Agric. 2020, 10, 35–38. [Google Scholar] [CrossRef]
  3. Ji, R.P.; Zhang, Y.S.; Jiang, L.X.; Zhang, S.J.; Feng, R.; Chen, P.S.; Wu, J.W.; Mi, N. Effect of climate change on maize production in Northeast China. Geogr. Res. 2012, 31, 290–298. [Google Scholar] [CrossRef]
  4. Zhao, X.L. Influence of climate change on agriculture in Northeast China in recent 50 years. J. Northeast Agric. Univ. 2010, 41, 144–149. [Google Scholar] [CrossRef]
  5. Lobell, D.B.; Burke, M.B.; Tebaldi, C.; Mastrandrea, M.D.; Falcon, W.P.; Naylor, R.L. Prioritizing climate change adaptation needs for food security in 2030. Science 2008, 319, 607–610. [Google Scholar] [CrossRef] [PubMed]
  6. Liu, J.; Hou, L.; Yang, Y. Analysis on the balance between supply and demand of corn market in China and the availability of international market. Chin. J. Agric. Resour. Reg. Plan. 2021, 42, 126–133. [Google Scholar] [CrossRef]
  7. National Bureau of Statistics of China. China Statistical Yearbook; China Statistics Press: Beijing, China, 2020. [Google Scholar]
  8. Meng, Q.; Hou, P.; Wu, L.; Chen, X.; Cui, Z.; Zhang, F. Understanding production potentials and yield gaps in intensive maize production in China. Field Crops Res. 2013, 143, 91–97. [Google Scholar] [CrossRef] [Green Version]
  9. Fang, S.; Han, G.; Zhang, X.; Zhou, G. Climate Change Affects Crop Production and Its Adaptation. Adv. Meteorol. Sci. Technol. 2011, 1, 15–19. [Google Scholar]
  10. Yin, X.G.; Jabloun, M.; Olesen, J.E.; Öztürk, I.; Wang, M.; Chen, F. Effects of climatic factors, drought risk and irrigation requirement on maize yield in the Northeast Farming Region of China. J. Agric. Sci 2016, 154, 1171–1189. [Google Scholar] [CrossRef]
  11. Liu, Z.J.; Yang, X.G.; Chen, F.; Wang, E.L. The effects of past climate change on the northern limits of maize planting in Northeast China. Clim. Chang. 2012, 117, 891–902. [Google Scholar] [CrossRef]
  12. Sanchez, B.; Rasmussen, A.; Porter, J.R. Temperatures and the growth and development of maize and rice: A review. Glob. Chang. Biol. 2014, 20, 408–417. [Google Scholar] [CrossRef]
  13. Gao, Z.; Feng, H.Y.; Liang, X.G.; Zhang, L.; Lin, S.; Zhao, X.; Shen, S.; Zhou, L.L.; Zhou, S.L. Limits to maize productivity in the North China Plain: A comparison analysis for spring and summer maize. Field Crops Res. 2018, 228, 39–47. [Google Scholar] [CrossRef]
  14. Chen, C.Q.; Qian, C.R.; Deng, A.X.; Zhang, W.J. Progressive and active adaptations of cropping system to climate change in Northeast China. Eur. J. Agron. 2012, 38, 94–103. [Google Scholar] [CrossRef]
  15. Liu, Z.; Yang, X.; Xie, R.; Lin, X.; Li, T.; Batchelor, W.D.; Zhao, J.; Zhang, Z.; Sun, S.; Zhang, F.; et al. Prolongation of the grain filling period and change in radiation simultaneously increased maize yields in China. Agric. For. Meteorol. 2021, 308–309, 108573. [Google Scholar] [CrossRef]
  16. Gao, Z.; Feng, H.-Y.; Liang, X.-G.; Lin, S.; Zhao, X.; Shen, S.; Du, X.; Cui, Y.-H.; Zhou, S.-L. Adjusting the sowing date of spring maize did not mitigate against heat stress in the North China Plain. Agric. For. Meteorol. 2021, 298–299, 108274. [Google Scholar] [CrossRef]
  17. Yan, P.; Tao, Z.Q.; Chen, Y.Q.; Zhang, X.P.; Sui, P. Spring Maize Kernel Number and Assimilate Supply Responses to High-Temperature Stress under Field Conditions. Agron. J. 2017, 109, 1433–1442. [Google Scholar] [CrossRef]
  18. Li, Y.T.; Xu, W.W.; Ren, B.Z.; Zhao, B.; Zhang, J.W.; Liu, P.; Zhang, Z.S. High temperature reduces photosynthesis in maize leaves by damaging chloroplast ultrastructure and photosystem II. J. Agron. Crop. Sci. 2020, 206, 548–564. [Google Scholar] [CrossRef]
  19. Allan, R.G.; Pereira, L.S.; Raes, D.; Smith, M. Crop Evapotranspiration-Guidelines for Computing Crop Water Requirements—FAO Irrigation and Drainage Paper 56; FAO: Rome, Italy, 1998. [Google Scholar]
  20. Holzworth, D.; Huth, N.I.; Fainges, J.; Brown, H.; Zurcher, E.; Cichota, R.; Verrall, S.; Herrmann, N.I.; Zheng, B.; Snow, V. APSIM Next Generation: Overcoming challenges in modernising a farming systems model. Environ. Model. Softw. 2018, 103, 43–51. [Google Scholar] [CrossRef]
  21. Holzworth, D.P.; Huth, N.I.; de Voil, P.G.; Zurcher, E.J.; Herrmann, N.I.; McLean, G.; Chenu, K.; van Oosterom, E.J.; Snow, V.; Murphy, C.; et al. APSIM—Evolution towards a new generation of agricultural systems simulation. Environ. Model. Softw. 2014, 62, 327–350. [Google Scholar] [CrossRef]
  22. Twine, T.E.; Bryant, J.J.; Richter, K.T.; Bernacchi, C.J.; McConnaughay, K.D.; Morris, S.J.; Leakey, A.D. Impacts of elevated CO2 concentration on the productivity and surface energy budget of the soybean and maize agroecosystem in the Midwest USA. Glob. Chang. Biol. 2013, 19, 2838–2852. [Google Scholar] [CrossRef] [PubMed] [Green Version]
  23. Meng, Q.F.; Wang, H.F.; Yan, P.; Pan, J.X.; Lu, D.J.; Cui, Z.L.; Zhang, F.S.; Chen, X.P. Designing a new cropping system for high productivity and sustainable water usage under climate change. Sci. Rep. 2017, 7, 41587. [Google Scholar] [CrossRef]
  24. Yang, H.S.; Dobermann, A.; Lindquist, J.L.; Walters, D.T.; Arkebauer, T.J.; Cassman, K.G. Hybrid-maize—A maize simulation model that combines two crop modeling approaches. Field Crops Res. 2004, 87, 131–154. [Google Scholar] [CrossRef] [Green Version]
  25. Mohammed, J.Z.; Wagner, M.J. Data Mining and Machine Learning: Fundamental Concepts and Algorithms; Cambridge University: Cambridge, UK, 2020. [Google Scholar]
  26. Ma, L.; Ahuja, L.R.; Saseendran, S.A.; Malone, R.W.; Green, T.R.; Nolan, B.T.; Bartling, P.N.S.; Flerchinger, G.N.; Boote, K.J.; Hoogenboom, G. A Protocol for Parameterization and Calibration of RZWQM2 in Field Research. In Methods of Introducing System Models into Agricultural Research; Advances in Agricultural Systems Modeling Series; American Society of Agronomy, Inc.: Madison, WI, USA, 2011. [Google Scholar]
  27. Gao, J.; Liu, Z.; Zhao, B.; Dong, S.T.; Liu, P.; Zhang, J.W. Shade stress decreased maize grain yield, dry matter, and nitrogen accumulation. Agron. J. 2020, 112, 2768–2776. [Google Scholar] [CrossRef]
  28. Gao, Z.; Sun, L.; Ren, J.H.; Liang, X.G.; Shen, S.; Lin, S.; Zhao, X.; Chen, X.M.; Wu, G.; Zhou, S.L. Detasseling increases kernel number in maize under shade stress. Agric. For. Meteorol. 2020, 280, 107811. [Google Scholar] [CrossRef]
  29. Wang, J.; Shi, K.; Lu, W.P.; Lu, D.L. Effects of Post-silking Shading Stress on Enzymatic Activities and Phytohormone Contents During Grain Development in Spring Maize. J. Plant Growth Regul. 2020, 40, 1060–1073. [Google Scholar] [CrossRef]
  30. Li, L.C.; Yao, N.; Li, Y.; Liu, D.L.; Wang, B.; Ayantobo, O.O. Future projections of extreme temperature events in different sub-regions of China. Atmos. Res. 2019, 217, 150–164. [Google Scholar] [CrossRef]
  31. Lin, Y.; Feng, Z.; Wu, W.; Yang, Y.; Zhou, Y.; Xu, C. Potential Impacts of Climate Change and Adaptation on Maize in Northeast China. Agron. J. 2017, 109, 1476–1490. [Google Scholar] [CrossRef] [Green Version]
  32. Zhang, L.; Zhang, Z.; Luo, Y.; Cao, J.; Li, Z. Optimizing genotype-environment-management interactions for maize farmers to adapt to climate change in different agro-ecological zones across China. Sci. Total Environ. 2020, 728, 138614. [Google Scholar] [CrossRef]
  33. Zhang, T.Y.; Huang, Y. Estimating the impacts of warming trends on wheat and maize in China from 1980 to 2008 based on county level data. Int. J. Clim. 2013, 33, 699–708. [Google Scholar] [CrossRef]
  34. Bristow, K.L.; Campbell, G.S. On the relationship between incoming solar radiation and daily maximum and minimum temperature. Agric. For. Meteorol. 1984, 31, 159–166. [Google Scholar] [CrossRef]
  35. Fang, X.; Cheng, Z.; Jiang, H.; Chen, Z.; Qiu, D.; Luo, X. Effects of reduced solar radiation on photosynthetic physiological characteristics and accumulation of secondary and micro elements in paddy rice. Chin. J. Appl. Ecol. 2021, 32, 1345–1351. [Google Scholar] [CrossRef]
  36. Muchow, R.C.; Sinclair, T.R.; Bennett, J.M. Temperature and Solar Radiation Effects on Potential Maize Yield across Locations. Agron. J. 1990, 82, 338–343. [Google Scholar] [CrossRef]
  37. Yang, Y.S.; Xu, W.J.; Hou, P.; Liu, G.Z.; Liu, W.M.; Wang, Y.H.; Zhao, R.L.; Ming, B.; Xie, R.Z.; Wang, K.R.; et al. Improving maize grain yield by matching maize growth and solar radiation. Sci. Rep. 2019, 9, 3635. [Google Scholar] [CrossRef] [PubMed] [Green Version]
  38. Sun, Q.; Miao, C.; Hanel, M.; Borthwick, A.G.L.; Duan, Q.; Ji, D.; Li, H. Global heat stress on health, wildfires, and agricultural crops under different levels of climate warming. Environ. Int. 2019, 128, 125–136. [Google Scholar] [CrossRef] [PubMed]
  39. Baum, M.E.; Licht, M.A.; Huber, I.; Archontoulis, S.V. Impacts of climate change on the optimum planting date of different maize cultivars in the central US Corn Belt. Eur. J. Agron. 2020, 119, 126101. [Google Scholar] [CrossRef]
  40. Zhu, P.; Zhuang, Q.; Archontoulis, S.V.; Bernacchi, C.; Muller, C. Dissecting the nonlinear response of maize yield to high temperature stress with model-data integration. Glob. Chang. Biol. 2019, 25, 2470–2484. [Google Scholar] [CrossRef] [PubMed]
  41. Schauberger, B.; Archontoulis, S.; Arneth, A.; Balkovic, J.; Ciais, P.; Deryng, D.; Elliott, J.; Folberth, C.; Khabarov, N.; Muller, C.; et al. Consistent negative response of US crops to high temperatures in observations and crop models. Nat. Commun. 2017, 8, 13931. [Google Scholar] [CrossRef] [PubMed] [Green Version]
  42. Zhang, X.; Cai, X. Climate change impacts on global agricultural water deficit. Geophys. Res. Lett. 2013, 40, 1111–1117. [Google Scholar] [CrossRef]
  43. Burchfield, E.; Matthews-Pennanen, N.; Schoof, J.; Lant, C. Changing yields in the Central United States under climate and technological change. Clim. Chang. 2019, 159, 329–346. [Google Scholar] [CrossRef]
  44. Choudhury, A.K.; Molla, M.S.H.; Zahan, T.; Sen, R.; Biswas, J.C.; Akhter, S.; Ishtiaque, S.; Ahmed, F.; Maniruzaman, M.; Hossain, M.B.; et al. Optimum Sowing Window and Yield Forecasting for Maize in Northern and Western Bangladesh Using CERES Maize Model. Agronomy 2021, 11, 635. [Google Scholar] [CrossRef]
  45. Sun, H.; Zhang, X.; Wang, E.; Chen, S.; Shao, L.; Qin, W. Assessing the contribution of weather and management to the annual yield variation of summer maize using APSIM in the North China Plain. Field Crops Res. 2016, 194, 94–102. [Google Scholar] [CrossRef]
  46. Zhao, J.F.; Li, N.; Hou, Y.Y.; Zhang, Y.; Xu, J.W.; Pu, F.Y.; Pan, Z.H.; Guo, J.P. Evaluation of Response of Spring Maize Production to Climate Change in the Eight Provinces of Northern China Based on APSIM Model. Chin. J. Agrometeorol. 2018, 39, 108–118. [Google Scholar] [CrossRef]
Figure 1. Distribution of experimental stations selected for this study.
Agronomy 12 00984 g001
Figure 2. Comparison of measured and simulated values for grain yield, days from sowing to flowering, and days from sowing to physiological maturity: (ac) calibration; (df) validation. RMSE%: rel-ative root mean square error; D: index of agreement; R2: the coefficient of determination.
Agronomy 12 00984 g002
Figure 3. Grain yields of different cultivars and sowing dates in the Northeast China Plain: (a) North, Keshan station; (b) Central, Gongzhuling station; (c) South, Shenyang station. SS: short-season cultivars; MS: medium-season cultivars; LS: long-season cultivars; I: early sowing date; II: medium sowing date (traditional sowing date); III: late sowing date. Different letters above the error bars are significantly different at the 0.05 probability level. Bars represent the standard errors.
Agronomy 12 00984 g003
Figure 4. Relationship between grain yield and kernel number (ad) and 1000-kernel weight (eh). North: Keshan station; Central: Gongzhuling station; South: Shenyang station; NEC: Northeast China Plain; r: correlation coefficient.
Agronomy 12 00984 g004
Figure 5. Distribution of maximum temperature (Tmax), precipitation and solar radiation in April–October (1980–2019) for the NEC: North, Keshan station (a,d,g); Central, Gongzhuling station (b,e,h); South, Shenyang station (c,f,i). E: the first ten days of a month; M: the middle ten days of a month; L: the last ten days of a month.
Agronomy 12 00984 g005
Figure 6. The diurnal thermal range (∆T, (a)); precipitation (b), and solar radiation (SRAD, (c)) of grain-filling stage at different maize cultivars and sowing dates from 1980 to 2019. North: Keshan station; Central: Gongzhuling station; South: Shenyang station; SS: short-season cultivars; MS: medium-season cultivars; LS: long-season cultivars; I: early sowing date; II: medium sowing date (traditional sowing date); III: late sowing date.
Agronomy 12 00984 g006
Figure 7. Simulated grain yield based on APSIM for different sowing dates and cultivars. The red dots represent the average yield, the black line shows the median yield. North: Keshan station; Central: Gongzhuling station; South: Shenyang station; SS: short-season cultivars; MS: medium-season cultivars; LS: long-season cultivars; I: early sowing date; II: medium sowing date (traditional sowing date); III: late sowing date. Different letters above the boxes are significantly different at the 0.05 probability level.
Agronomy 12 00984 g007
Figure 8. Risk of not becoming physiologically mature for spring maize. North: Keshan station; Central: Gongzhuling station; South: Shenyang station; SS: short-season cultivars; MS: medium-season cultivars; LS: long-season cultivars; I: early sowing date; II: medium sowing date (traditional sowing date); III: late sowing date; Frost: frost before harvest; Not Frost: harvest caused by early senescence; Normal PM: normal physiological maturity.
Agronomy 12 00984 g008
Table 1. Soil parameters (0–40 cm) of the three stations in Northeast China Plain.
SiteBD 1 (g cm−3)TN (%)TP (%)TK (%)TOC (%)pH
Keshan, North1.01–1.170.10–0.210.11–0.172.76–2.882.11–4.116.90–7.00
Gongzhuling, Central1.26–1.380.06–0.120.04–0.082.31–2.371.21–2.396.82–7.04
Shenyang, South1.34–1.350.06–0.100.02–0.041.53–1.860.75–1.526.70–6.90
1 BD: bulk density, TN: total N, TP: total phosphorus, TK: total potassium, TOC: total organic carbon.
Table 2. Details of field experiments at each experimental station.
StationLatitudeLongitudePlant Density (Plants m−2)Cultivar 1Sowing Date 2
Keshan,
North
48°2′ N125°52′ E7.5SS: Keyu17 (1111 °C d)I: May 5
MS: Keyu18 (1131 °C d)II: May 15
LS: Keyu19 (1153 °C d)III: May 25
Gongzhuling,
Central
43°31′ N125°18′ E7.5SS: Xinxin1 (1559 °C d)I: Apr. 22
MS: Fuin985 (1653 °C d)II: May 4
LS: Shenyu21 (1743 °C d)III: May 16
Shenyang,
South
41°48′ N123°25′ E6.0SS: Zhengdan958 (1607 °C d)I: Apr. 20
MS: Xianyu335 (1678 °C d)II: May 5
LS: Shenyu21 (1743 °C d)III: May 20
1 SS: relative short-season cultivar, MS: relative medium-season cultivar, LS: relative long-season cultivar; the growing degree days (GDD) was calculated from sowing to physiological maturity. 2 I: early sowing date, II: medium sowing date (traditional sowing date), III: late sowing date.
Table 3. Relationships between maize yield attributes (grain yield, yield components) and meteorological conditions during morphogenesis stage, flowering stage, grain-filling stage, and the whole growth stage.
Climate
Variable 1
Morphogenesis Stage 2Flowering StageGrain-Filling StageWhole Growth Stage
Grain YieldKernel Number1000-Kernel WeightGrain YieldKernel Number1000-Kernel WeightGrain YieldKernel Number1000-Kernel WeightGrain YieldKernel Number1000-Kernel Weight
Tmax−0.02 ns−0.06 ns−0.13 *−0.06 ns0.00 ns0.00 ns−0.03 ns−0.06 ns0.24 ***−0.02 ns−0.19 **0.21 **
Tmin−0.14 *−0.14 *−0.21 **0.04 ns−0.02 ns0.12 ns−0.14 *−0.12 ns0.09 ns−0.26 ***−0.35 ***−0.05 ns
HSD−0.02 ns0.05 ns−0.05 ns−0.26 ***0.03 ns−0.11 ns−0.15 *0.01 ns0.19 *−0.24 ***0.07 ns0.01 ns
∆T0.25 ***0.20 **0.14 *−0.19 **0.02 ns−0.17 **0.26 ***0.15 *0.17 **0.27 ***0.28 ***0.11 ns
RD0.22 ***0.31 ***0.13 *0.07 ns−0.06 ns−0.23 **0.21 **0.13 *−0.21 **0.32 ***0.23 ***−0.11 ns
Precipitation0.26 ***0.04 ns0.02 ns0.13 *−0.19 **0.16 *0.19 **0.01 ns−0.07 ns0.29 ***0.06 ns−0.02 ns
SRAD0.30 ***0.46 ***0.20 **−0.13 *−0.00 ns0.09 ns0.38 ***0.24 ***0.18 **0.41 ***0.50 ***0.25 ***
GDD0.25 ***0.44 ***−0.15 *−0.03 ns−0.01 ns0.04 ns0.12 ns0.07 ns0.11 ns0.31 ***0.45 ***−0.02 ns
1 Tmax: maximum temperature; Tmin: minimum temperature; HSD: heat stress days; ∆T: diurnal thermal range; RD: rainy days; SRAD: solar radiation; GDD: growing degree days. 2 Morphogenesis stage: from sowing to 10 days before flowering; flowering stage: from 10 days before flowering to 10 days after flowering; grain-filling stage: from 10 days after flowering to physiological maturity; whole growth stage: from sowing to physiological maturity; ns: no significant; *, **, and ***: significant at the 0.05, 0.01, and 0.001 probability level, respectively.
Publisher’s Note: MDPI stays neutral with regard to jurisdictional claims in published maps and institutional affiliations.

