Article

Nitrogen Use Efficiency of Quality Protein Maize (Zea mays L.) Genotypes

by
Olusola Oluyinka Adeoluwa
,
Charles Shelton Mutengwa
*,
Cornelius Chiduza
and
Ngoune Liliane Tandzi
Department of Agronomy, Faculty of Science and Agriculture, University of Fort Hare, Alice Campus, P/Bag X1314, Alice 5700, South Africa
*
Author to whom correspondence should be addressed.
Agronomy 2022, 12(5), 1118; https://doi.org/10.3390/agronomy12051118
Submission received: 1 March 2022 / Revised: 21 April 2022 / Accepted: 25 April 2022 / Published: 5 May 2022
(This article belongs to the Topic Plant-Soil Interactions)

Abstract

:
Use of more nutrient-use efficient Quality Protein Maize (QPM) varieties will likely play a pivotal role in maintaining or increasing crop yields and nutritional values in fields where soils are degraded. This study aimed to: (i) assess the nitrogen use efficiency (NUE) of different QPM inbred lines at various levels of nitrogen (N) fertilizer application; (ii) determine the relationships among NUE indices and yield; and (iii) determine the appropriate rate of fertilizer application for QPM genotypes under conditions of this study. Thirty-two QPM inbred lines were evaluated at 0, 30, 60, 90 and 120 kg N ha−1 N fertilizer application in a split-plot randomized complete block design with two replicates at the University of Fort Hare Crop Research farm, South Africa. Results revealed highly significant differences (p ≤ 0.001) for total nitrogen in biomass (Bio Total N), total nitrogen in grain (G Total N), grain yield, NUE and almost all the indices estimated across N levels. The top three genotypes which showed high-yielding potential at 30 kg N ha−1 include L2 (6.24 t/ha), L3 (6.47 t/ha) and L4 (6.34 t/ha), and were considered the most N-efficient genotypes under low N soils. The highest grain yields (6.74 t/ha) and highest NUtE (Nitrogen Utilization Efficiency) (1.93 kg grain/total N) were obtained at 90 kg N ha−1. Highly significant and positive correlation coefficients were found between NUE and yield (+0.9), NUE and NUtE (+0.9), NUE and HI (Harvest Index) (+0.5), NUtE and yield (+0.99), HI and yield (+0.5) and NUtE and HI (+0.5). Highest nitrogen uptake efficiency (NUpE) was obtained from the lowest fertilizer rate, which was 30 kg N ha−1.

1. Introduction

Maize (Zea mays L.) is one of the staple food crops used for both man and livestock consumption, and extensive industrial applications in South Africa (SA) [1]. It is one of the most important food crops in Sub-Saharan Africa [2], with an average of 13% of all cropped land sown under maize [3]. However, quality protein maize (QPM) is considered to be of higher nutritional quality and can be used like the conventional maize [4] as its endosperm maize protein is found to have higher lysine and tryptophan content compared to that found in the conventional maize. Lysine and tryptophan are essential amino acids for the human body and higher quantities in a staple like maize is beneficial and of more importance [4,5].
Evaluation of QPM in feeding trials has proved its nutritional superiority over the non-QPM varieties for human and livestock consumption [6]. However, despite the importance of maize, its yields in different maize production areas are low and far below the agro-ecological potential of such areas. According to FAOSTAT [7,8,9], average maize yields between 2003 and 2007 were 1.58 t/ha in West Africa, 1.33 t/ha in East Africa and 2.98 t/ha in Southern Africa. As of 2011, an increase in regional average maize yields of 1.7 t/ha in West Africa, 1.5 t/ha in East Africa, but a decline to <1.8 t/ha in Southern Africa was recorded [8], which is far below the ~5 t/ha global average maize yield [8]. However, in South Africa, an annual average maize yield of 5.09 t/ha in 2017/18 was considered the second highest on record following 2016/17 year’s record of 5.86 t/ha. In the Eastern Cape, the average white maize yield was 4.12 and 11.02 t/ha during the 2017/18 season under dryland and irrigation conditions [10]. This was possible due to the abundant rainfall during the pollination and grain filling stages as well as use of improved varieties that performed well under drier conditions and high plant population density [9]. The highest 5-year average yield of 6.40 t/ha was recorded in the country for Kwazulu-Natal Province, SA [9]. About 5 t/ha was considered as a national average yield, however, maize yields in the smallholder farming sector are around 1 t/ha, or up to 1.5 t/ha. This is due to low N stress in the smallholder farming sector and particularly in the Eastern Cape Province of South Africa, where resource-poor farmers often cannot afford to purchase N fertilizers.
Maize varieties perform poorly under low soil nitrogen stress conditions. However, the crop responds well to fertilizer application [11]. Nitrogen is required by crops for active growth and photosynthetic machinery throughout the crop cycle [12]. Among cereals, maize is more demanding in its soil N requirements since it removes huge amounts of N and water from the soil. The rate of maize yield improvement has accelerated partly due to extensive use of fertilizers. Among these fertilizers, nitrogen (N) constitutes a major factor in agricultural production and can be supplied through chemical synthesis [13]. The extensive use of inorganic N fertilizers caused major detrimental impacts on the diversity and functioning of non-agricultural bacterial, animal and plant ecosystems [14,15]. In addition, it has been demonstrated that fertilizer-derived nitrous oxide emissions into the atmosphere could contribute to depletion of the ozone layer, while volatilized ammonia returned as wet or dry deposition causes acidification and eutrophication [16,17].
There are large differences in the ability of crops to grow and perform well on soils with poor mineral nutrients depending on both N-uptake efficiency and N-utilization efficiency [18]. Intensive agriculture led to a continuous decrease in soil micronutrient content. Additionally, unfavorable soil and climate change conditions caused less availability of nutrients to plant roots [19]. Nitrogen fertilizer is a limiting factor for maize production in marginal areas and in developing countries. Excessive input of N fertilizers in intensive agricultural areas is causing serious environmental problems especially where there is heavy rainfall during the maize growing season [20].
In modern agricultural production, N fertilizer application is necessary to ensure high and stable crop yields [12]. Nitrogen use efficiency (NUE) in cereals has been placed in three categories as follows: (i) agronomic nitrogen use efficiency, which is also called economic efficiency, defined as crop yield increase per kg fertilizer N applied [21]; (ii) nitrogen use recovery, which is based on the amount of nutrients absorbed per unit of food ingredient which estimates nitrogen uptake under a given effect of climatic conditions; and (iii) physiological nitrogen use efficiency, which shows the crop’s ability to generate economic yield [22]. The improvement of NUE has become an effective strategy for promoting sustainable agriculture in maize production [12,20,23,24,25]. To reduce the N losses and crop N requirements, it is suggested that the utilization efficiency of applied fertilizer be increased by selection of traits that will give higher yields with less inputs [26]. The rational use of fertilizers with correct doses at the appropriate time, as well as integrated agronomic management options (crop rotation with legumes and cover crops) will maximize nitrogen use-efficiency under high-planting density and ensure sustainable maize production as well as restoring soil fertility naturally [12]. Thus, the development of N-efficient maize genotypes that are tolerant to low soil N could be the most appropriate and environmentally friendly method. Additionally, identification of low soil N tolerant QPM inbred lines is an approach utilized towards the development of QPM varieties with high NUE capability as a relevant response to climate change, varying soil degradation and limiting N environments.
Therefore, the overall objectives of the present study were to determine the response of QPM genotypes at different levels of nitrogen fertilization in the Eastern Cape province of South Africa. Specifically, the study sought to: (i) assess the nitrogen use efficiency of different QPM inbred lines at various levels of N fertilizer applications; (ii) determine the relationships among NUE indices and yield; and (iii) recommend the appropriate rate of fertilizer that could be efficiently used for QPM production under conditions of this study.

2. Materials and Methods

Thirty-two white QPM inbred lines obtained from CIMMYT-Zimbabwe and Quality Seeds (PTY) LTD, South Africa, were assessed for nitrogen use efficiency at five nitrogen levels (0, 30, 60, 90 and 120 kg N ha−1). The list of inbred lines used in the study is presented in Table 1a,b. The soil nutrient status of the experimental site is shown in the Supplementary Material Table S1.

2.1. Site Preparation, Treatments and Experimental Design

The experiment was established at the Crop Research Farm, University of Fort Hare (UFH), Alice, South Africa during the 2017/2018 summer season. The UFH Research farm (32°47′51″ S and 27°50′55″ E) is at an altitude of 508 m above sea level. The farm has a semi-arid climate; an average annual rainfall of 525 mm and an annual mean temperature of 18.1 °C. The experimental plot was densely sown to unfertilized oats (Avena sativa L.) for six (6) months during two successive winter seasons to mop up the soil of nutrients prior to establishment of the trial. The harvested oat crop was entirely removed in each winter season, and the crop residues were not incorporated back into the soil. The experimental design for this study was a split plot randomized complete block design (RCBD) with two replications. Main-plots were allotted to nitrogen levels (0, 30, 60, 90 and 120 kg N ha−1) and sub-plots to QPM inbred lines. Each sub-plot had an inbred line planted in a single 5 m long row, with inter- and intra-row spacing of 0.75 and 0.25 m, respectively. Two seeds were sown per hill at a depth of 3–5 cm, and they were later thinned to one seedling at 2 weeks after sowing (WAS). The fertilized plots received basal compound fertilizer (N:p:K ratio 2:3:4 (30)) application at planting at a rate of 20 kg N ha−1. Top dressing was achieved using lime ammonium nitrate (LAN) fertilizer (46% N), which was applied three times for all the three N treatments (60, 90 and 120 kg N ha−1 respectively, that is, 1/3 at 4 WAS (3 leaf stage, V3 stage), 1/3 at 6 WAS (growing point stage, V6) and 1/3 at 8 WAS (rapid top growth stage, V9)). At harvest, the entire row of each inbred line per nitrogen level was harvested separately excluding the border plants at both ends of the row.

2.2. Trial Management

Alachlor 384 EC was applied at the recommended rate of 4 L/ha at planting as a pre-emergent herbicide. The herbicides atrazine 500 SC (active ingredient atrazine 500 g/L) and Basagran (active ingredient bendioxide 480 g/L) were applied every two weeks at a recommended rate of 2 L/ha starting from two weeks after seed emergence till tasseling for the control of nutsedge grass in the experimental plots. Grass weeds were also removed by hand hoeing at 5 and 10 weeks after sowing (WAS). Grasshoppers and leaf hoppers were controlled using Dursban (Chloropyrifos 480 EC) applied at 1.5 L/ha (75 mL/20 Lt water). Cylam 50 EC (active ingredient Lambda-cyhalothrin) (pyrethroid) was applied at a rate of 75 mL/ha for the control of cutworms (Agrotis segetum) at 7 days after emergence and 14 days after first application. Cypermethrin 200 EC was applied at a recommended rate of 120 mL/ha for maize stalk borer (Buseola fusca) control when signs of insect damage were noticed. The trials were largely rain-fed, though irrigation was applied to facilitate early and uniform crop establishment.

2.3. Data Collection

Grain yield was estimated on whole plot basis and adjusted to 12.5% moisture content and converted to tonnes per hectare.
The following parameters were determined according to Rochiman et al. [27]:
Total N content determination: Three plants per plot per inbred line per N treatment were harvested at physiological maturity and were separated into leaves, stem and cob, dried at 70 °C for 48 h to constant weight in an oven and then analyzed for total N content using the Kjeldahl method.
The grains were separated and a sample of 1000 g per inbred line per N treatment was dried at 70 °C in an oven to constant weight, and then analyzed for total N content using the Kjeldahl method.
Nitrogen Use Efficiency: Nitrogen use efficiency (NUE) was determined as described by Moll et al. [28] as follows: weight of the grains divided by the amount of N applied to soil, that is, kg grain/kg N-fertilizer.
Nitrogen use efficiency is made up of two primary components known as N uptake efficiency (NUpE) and N utilization efficiency (NUtE).
* NUpE (N uptake efficiency) is the total amount of N in the mature plant, divided by the amount of N applied to soil, that is, total N in dry matter above ground of a mature plant/kg N-fertilizer applied (kg·ha−1).
* NUtE (N utilization efficiency) is obtained as the ratio between grain weight and the total amount of N in the mature plant, that is, kg grain/total N in dry matter of above ground of a mature plant.
From these two primary components, NUE can be obtained. That is,
* NUE = NUpE × NUtE.
The following were computed in order to estimate Nitrogen Use Efficiency based on agronomic study [29]:
* Crop recovery efficiency of applied N (REN) = (UN − U0)/FN (kg N-uptake/kg N-fertilizer).
* Physiological efficiency of applied N (PEN) = (YN − Y0)/(UN − U0) (kg grain/kg N-uptake).
* Agronomic efficiency (AE) = (YN − Y0)/FN (kg grain/kg N-fertilizer).
* Nitrogen use efficiency (NUE) = YN/FN (kg grain/kg N-fertilizer); [28,29].
Where:
FN: amount of N fertilizer applied (kg·ha−1).
YN: crop yield with applied N fertilizer (kg·ha−1).
Y0: crop yield in a control treatment with no N fertilizer (kg·ha−1).
UN: total plant N uptake in aboveground biomass at maturity in a plot that received N fertilizer (kg.ha−1).
U0: the total N uptake in above ground biomass at maturity in a plot that received no N fertilizer.
The selection indices utilized include harvest index (HI); total N in biomass (Bio Total N) and total N in grain (G Total N); they were determined as described above. HI was computed as.
HI = dry weight of grain yield/dry weight of above ground biomass yield (straw weight + grain weight) × 100% [30]. The dry weight of above ground biomass yield is also known as the biological yield.

2.4. Data Analysis

Analysis of variance and estimation of correlation coefficients between variables collected were computed using SAS package version 9.2. The Tukey’s test was performed to separate significantly different means of genotypes and nitrogen levels for a given trait.

3. Results

3.1. Variation between Estimated Parameters

The mean squares of N levels were highly significant (p ≤ 0.001) for total nitrogen in maize biomass (Bio Total N), total nitrogen in grain (G Total N), grain yield (Yield), and Nitrogen Utilization Efficiency (NUtE) (Table 2a). There were also highly significant (p ≤ 0.001) differences for crop recovery efficiency of applied N (REN), physiological efficiency of applied N (PEN), agronomic efficiency (AE), nitrogen use efficiency (NUE) and nitrogen uptake efficiency (NUpE) (Table 2b). Inbred lines expressed highly significant differences (p ≤ 0.01) for yield, NUtE (Table 2b), REN, AE and NUE (Table 2b). In addition, inbred lines showed significant differences (p ≤ 0.05) for harvest index (HI). The mean squares of the interaction between N level × inbred lines was highly significant only for grain yield at various levels of nitrogen application (Table 2a). Therefore, inbred lines should be selected for grain yield at different levels of nitrogen application.

3.2. Performance of Variables Evaluated at Different Levels of N Application

High total nitrogen values were observed in total biomass and in kernels (1.79% and 1.89%, respectively) at an application rate of 120 kg N ha−1, while the lowest values were found at 30 kg N ha−1 (1.46% and 1.57%, respectively). Mean values of 1.61 for total N in biomass and 1.73% for total N in grain were observed across the N levels (Table 3a). The highest grain yield (6.74 t/ha) was obtained at an application rate of 90 kg N ha−1, and the lowest (4.07 t/ha) was observed at 0 kg N ha−1, with a mean value of 5.68 t/ha across the N levels. The highest NUtE (1.93 kg grain/total N) was found at a fertilizer application rate of 90 kg N ha−1 whereas the lowest value (1.30 kg grain/ total N) was found at 0 kg N ha−1 with a mean value of 1.70 kg grain/total N across the N levels. The mean values for harvest index were not significant among the different N levels.
At an application rate of 30 kg N ha−1, negative values of REN were obtained (−0.003 kg N-uptake/kg N-fertilizer) while the highest value was observed at 120 kg N ha−1 for REN (0.003 kg N-uptake/kg N-fertilizer) though it was not significantly different from the values obtained at 60 and 90 kg N ha−1 (Table 3b). The highest performance for AE was found at a fertilizer application rate of 0 kg N ha−1 (44.4 kg grain/kg N-fertilizer) whereas the lowest was found at an application rate of 120 kg N ha−1 (15.1 kg grain/kg N-fertilizer). The highest values for NUE and NUpE were found at an application rate of 30 kg N ha−1 (0.2 kg grain/kg N-fertilizer and 0.1 N plant/kg N, respectively) while the lowest were observed at 120 kg N ha−1 (0.05 kg grain/kg N-fertilizer and 0.03 N plant/kg N, respectively). The mean values of NUE and NUpE across N levels were 0.11 kg grain/kg N-fertilizer and 0.06 N plant/kg N, respectively. Maize inbred lines expressed the best nitrogen use efficiency at an N-fertilizer application rate of 30 kg N ha−1.

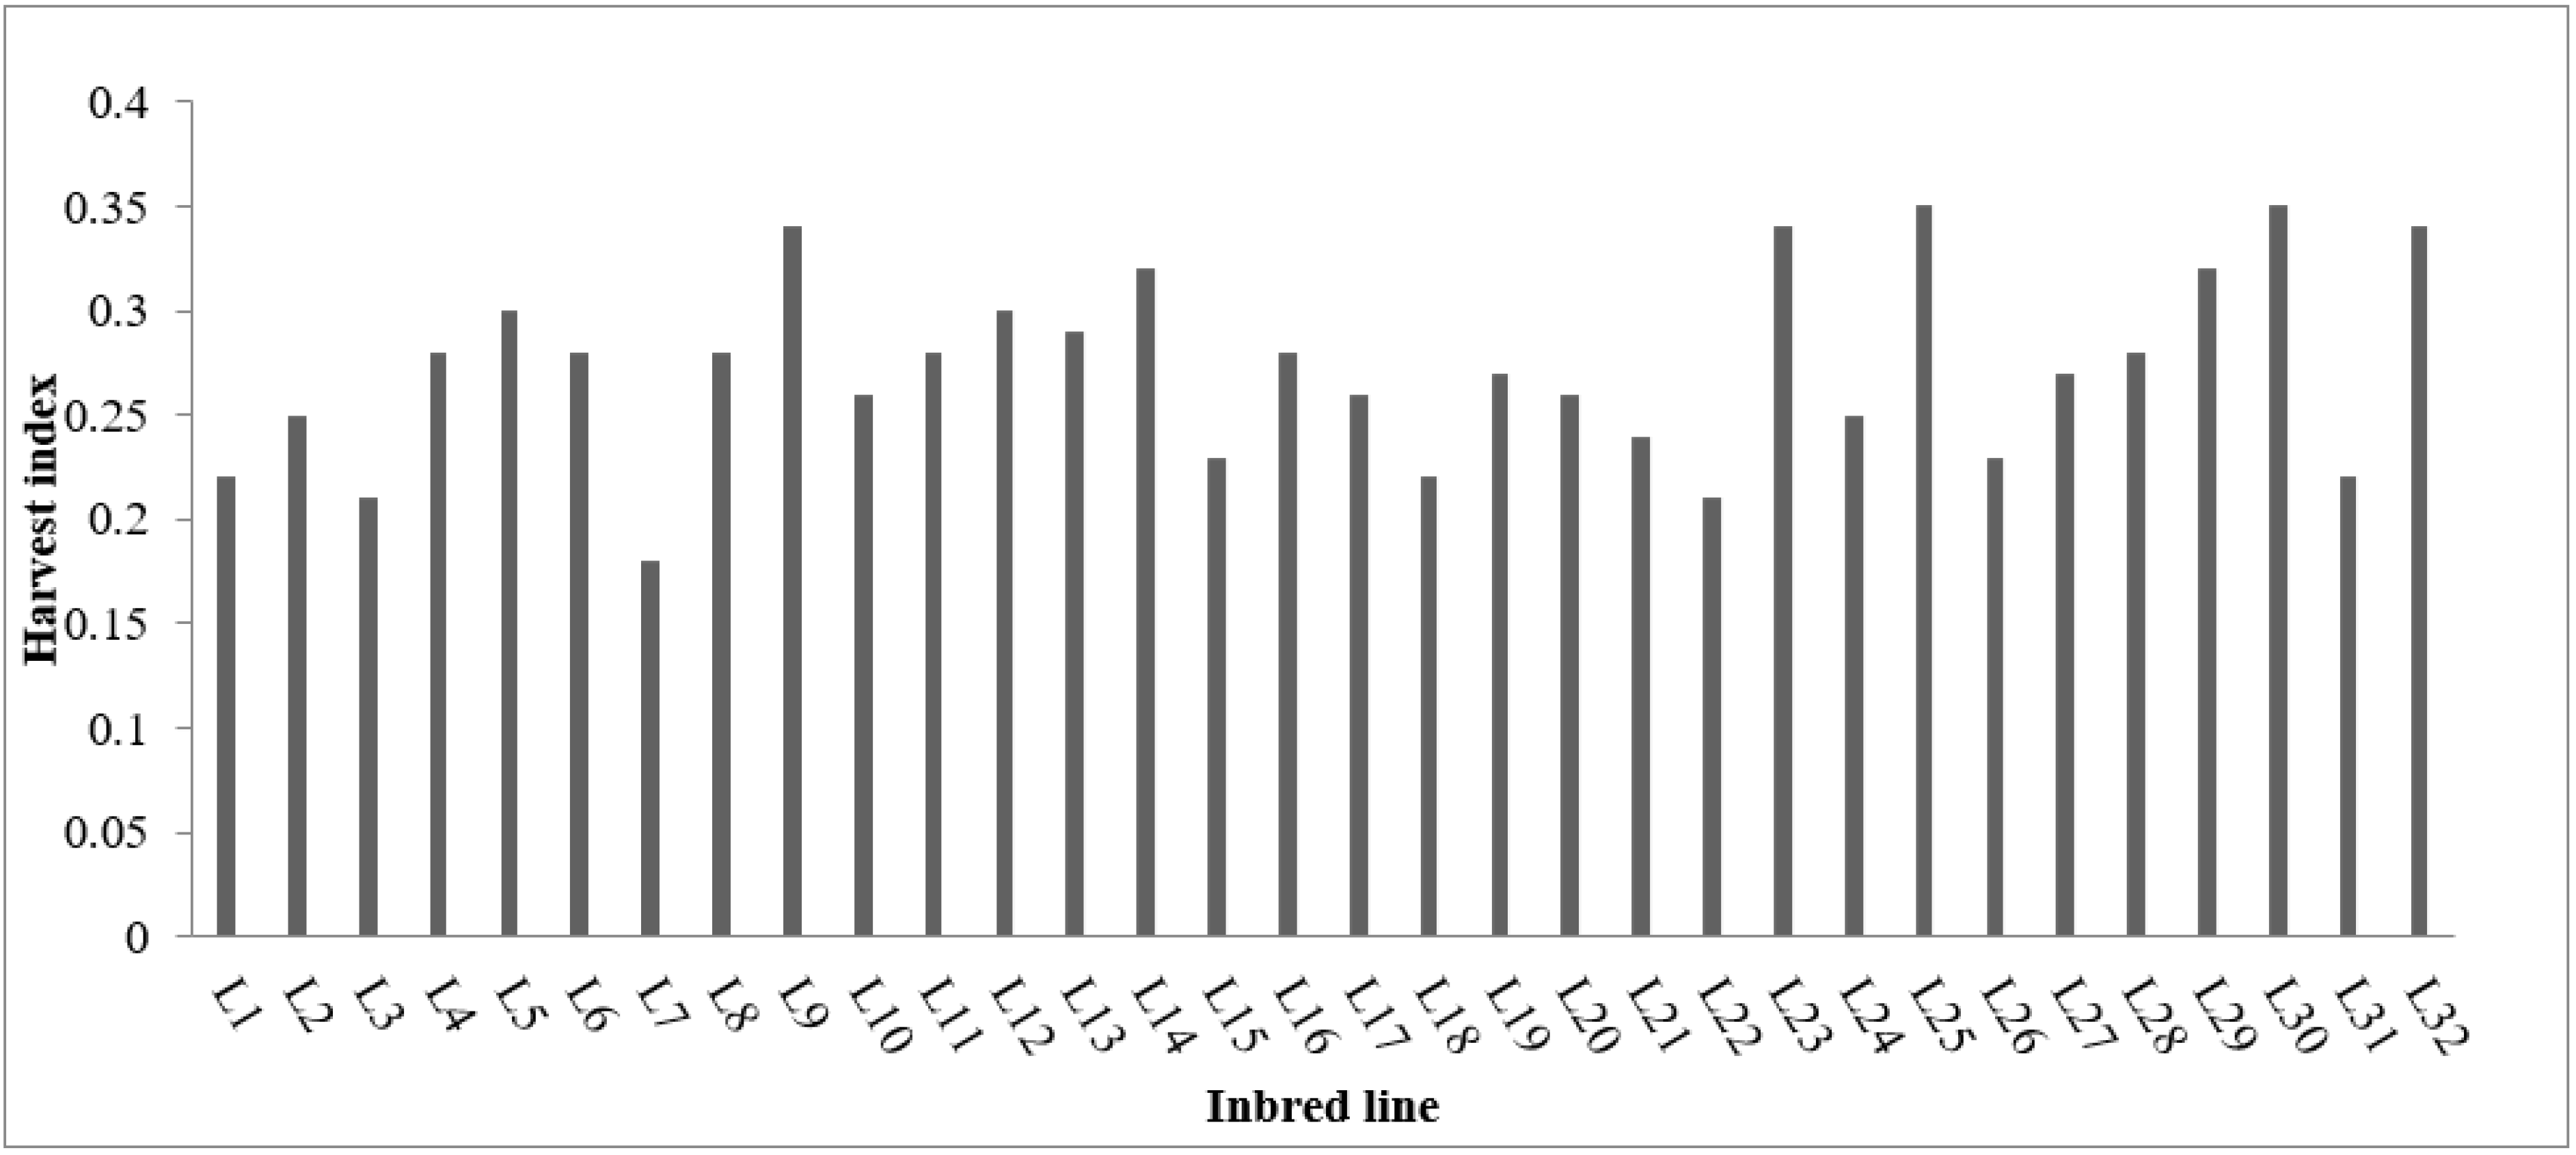
3.3. Performance of Inbred Lines for Estimated Traits and Indices across N Levels

From the 32 inbred lines evaluated, the top 10 QPM inbred lines with high harvest indices (HI) across N levels were L25, L30, L9, L23, L32, L14, L29, L5, L12 and L13 (Figure 1). However, performance of these inbred lines varied across N levels considering the indices REN, AE, NUE and NUtE. Genotype L25 ranked 1st for HI but ranked 14th for REN, 26th for AE while 4th and 5th for NUE and NUtE, respectively. It ranked 4th for yield. On the other hand, L30 ranked 2nd for HI but ranked 29th, 4th, 18th and 22nd for REN, AE, NUE and NUtE, respectively. L9 performed quite well as it ranked 3rd, 2nd, 13th, 8th and 3rd in estimation of HI, REN, AE, NUE and NUtE, respectively. It ranked 5th for yield. Genotype L9 had 0.11 kg grain/ kg N-fertilizer of NUE, 0.005 kg N-uptake/kg N-fertilizer of REN, 37.32 kg grain/kg N-fertilizer of AE, 2.02 kg grain/ total N of NUtE and 6.57 t/ha across N levels (see the Supplementary Material Table S2). L14 ranked 6th for HI but ranked 7th, 23rd, 21st and 7th for REN, AE, NUE and NUtE, respectively. However, L29 ranked 7th, 31st, 22nd, 6th and 4th in estimation of HI, REN, AE, NUE and NUtE, respectively. It ranked 3rd for yield with 6.72 t/ha of yield across N levels (see the Supplementary Material Table S2). These inbred lines were top performing across the different N application rates.

3.4. Grain Yield Performance of Inbred Lines at Various Levels of Nitrogen Application

At 0 kg N ha−1 application rate, the grain yield varied from 2.86 t/ha (L1) to 5.84 t/ha (L23) with a mean yield of 4.07 t/ha. At 30 kg N ha−1 application rate, the yield ranged from 3.99 t/ha (L1) to 6.47 t/ha (L3) with a mean value of 5.41 t/ha (see the Supplementary Material Table S3 and Figure 2). At 60 kg N ha−1 application rate, the yield varied from 4.11 t/ha (L27) to 8.48 t/ha (L29) with a mean performance of 6.31 t/ha. At 90 kg N ha−1 application rate, the yield ranged from 3.36 t/ha (L7) to 8.55 t/ha (L22) with a mean value of 6.74 t/ha. At 120 kg N ha−1 application rate, the yield varied from 3.36 t/ha (L1) to 8.19 t/ha (L32) and 8.18 t/ha (L2) with a mean yield of 5.88 t/ha. The top 15 maize inbred lines observed at 30 kg N ha−1 were L3, L4, L2, L28, L20, L13, L29, L17, L26, L30, L22, L12, L11, L5 and L32 (see the Supplementary Material Table S3). These genotypes gave different ranks at 0, 30, 60, 90 and 120 kg N ha−1. Six inbred lines occupied relatively good positions at various levels of N. These were L4 (8th, 2nd, 16th, 13th and 8th), L2 (11th, 3rd, 3rd, 1st and 2nd), L3 (10th, 1st, 13th, 5th and 22nd), L28 (3rd, 5th, 5th, 15th and 12th), L29 (6th, 7th, 1st, 6th and 19th) and L32 (7th, 15th, 18th, 23rd and 1st). These inbred lines gave various NUE and NUE index values at 30, 60, 90 and 120 kg N ha−1 application levels (see the Supplementary Material Tables S4 and S5).

3.5. Correlation Coefficients between Variables Estimated across N Levels

A highly significant and negative relationship (p ≤ 0.001) was observed between total nitrogen in biomass (Bio Total N) and crop recovery efficiency of applied N (REN) (−0.6) (Table 4). Highly significant and positive correlation coefficients (p ≤ 0.001) were found between NUE and yield (+0.9), NUE and NUtE (+0.9), NUE and HI (+0.5), NUtE and yield (+0.99), HI and yield (+0.5) and NUtE and HI (+0.5).

4. Discussion

The variability observed from the current study on Bio Total N, G Total N, grain yield, NUtE, REN, PEN, AE, NUE and NUpE showed that different application rates of nitrogen fertilizers significantly influenced maize nitrogen uptake, growth and yield. The yield variability observed in the interaction between N level × inbred lines suggested that the genotypes responded differently at different levels of N application. This is in line with the findings of Eivazi and Habibi [22] in which highly significant differences between different levels of nitrogen fertilizer application and the genotypes studied in traits such as ear diameter, number of rows per ear, grain yield, total dry matter and harvest index were observed. These differences observed could be due to the inbred lines responses to variation in their immediate N-environment/soil conditions as well as weather factors such as rainfall indicating an interaction between genotypes and their environment. It was reported in earlier studies on maize that variations are observed in N efficiency response to changes in weather and soil conditions [31].
In the current study, N fertilizer showed no significant variation for mean harvest index (HI) and physiological efficiency of applied N (PEN) at various levels of N application. A similar result was found in a study on maize in which increase in N rate had no significant effect on HI [32]. These results were different from the findings of Mastrodomenico et al. [33] who stated that N fertilizer significantly increased the mean harvest index (HI). However, significant differences were observed for REN, AE, NUpE, NUtE, Bio Total N, G Total N and yield at different levels of N application. This is supported by the findings of Presterl et al. [34] and Haegele et al. [35], which stated that the genetic variation of NUE in maize was attributed to genotypes expressing NUpE and NUtE at different levels. Maize genotypes with high NUtE will show more ability to utilize N for starch production. Furthermore, the response of traits to N results in differences in contribution to NUE due to the differences in germplasm utilized [36] as well as the N status of the soil [37,38]. Lines L2, L3, L4, L25, L28, L29, L8, L9, L10, L11, L12, L13, L16, L17, L20, L22, L26, L30, L32, L5, L14, L19, L23 and L24 were the top 24 inbred lines with high NUE values across the N levels. Furthermore, L4, L8, L12, L14 and L16 are CIMMYT’s lines considered to be drought tolerant, thereby making them important for further studies.
Over-use of N fertilizers leads to severe pollution of the environment, especially in aquatic ecosystems. Therefore, growing of N-efficient cultivars is an important prerequisite for integrated nutrient management strategies in both low and high input agriculture [20]. From this study, the highest NUtE (1.93 kg grain/total N) was found at 90 kg N ha−1 application rate while lowest NUtE value (1.30 kg grain/total N) was obtained at 0 kg N ha−1 application rate with a mean yield value of 1.70 t/ha at this application rate. Additionally, the highest NUE and NUpE records were found at 30 kg N ha−1 application rate (0.2 and 0.1, respectively) while the lowest were observed at 120 kg N ha−1 (0.05 and 0.03, respectively). These results confirmed the findings of Mi et al. [20] who stated that NUE tends to increase with decreasing N fertilizer input. Therefore, N-efficient genotypes may produce higher yields in low soil N conditions compared to inefficient genotypes. Additionally, maize genotypes with high NUpE will most likely have greater root development and N uptake [33]. In future, it may, therefore, be important to study the root phenotypes of inbred lines that were found to have high values for NUpE.
In this study, the grain yields obtained at 120 and at 90 kg N ha−1 application rates were not statistically significantly different from the yields obtained at 60 kg N ha−1 application rate. However, grain yields at 30 kg N ha−1, which was the lowest fertilizer application rate in this study, was significantly different from that of yields obtained under the control (0 kg N ha−1) and the other fertilizer application rates. The REN observed in the current study was relatively low compared to other NUE indices as predicted by Dobermann [29].
The six inbred lines that expressed relatively high harvest indices (HIs) across N levels were L9, L14, L23, L25, L29 and L32. These genotypes yielded 6.65, 4.78, 5.42, 5.76, 6.03 and 5.77 t/ha, respectively, at 30 kg N ha−1 application rate. Harvest index shows the physiological capacity of a genotype to generate and partition N to the grain. Therefore, when the harvest index (HI) is high, then a cultivar has high capacity to accumulate N at low N levels; thus, increasing its adaptability to low soil N [20]. Therefore, the six inbred lines expressing high HI could have good adaptability under low soil N and could utilize N efficiently considering that there were significant differences observed for HI among the inbred lines but not among the N levels. The non-significance of N level on HI suggests that all the lines utilized in this study have the capacity to adapt to low soil N.
The top-yielding 15 maize inbred lines observed at 30 kg N ha−1 fertilizer application rate were L3, L4, L2, L28, L20, L13, L29, L17, L26, L30, L22, L12, L11, L5 and L32. These inbred lines gave yield ranges from 5.77 (L15) to 6.47 t/ha (L3). These genotypes attained higher yield at relatively low N inputs and could therefore be referred to as being N-use efficient genotypes as defined by Mi et al. [20]. These results are different from the findings of Onasanya et al. [39] who stated that the application of 60 kgN/ha + 40 kgP/ha brought increased maize grain yields that would be of great benefit for farmers. In addition, Rehman et al. [40] found that the highest nitrogen uptake efficiency was with the medium fertilizer dose and proved to be a good indicator of grain yield. In the current study, the highest nitrogen uptake efficiency was obtained from the lowest fertilizer dose, which was 30 kg N ha−1.
Uptake and N utilization in crops are two major components of the N cycle. In this study, the top 24 inbred lines which expressed high NUE across the N levels were L2, L3, L4, L25, L28, L29, L8, L9, L10, L11, L12, L13, L16, L17, L20, L22, L26, L30, L32, L5, L14, L19, L23 and L24. Eivazi and Habibi [22] stated that NUE is governed by the interactions between N levels, N availability due to microbial activity in the rhizosphere and the ability of the maize plant to assimilate and use acquired N for growth. Dobermann [29] stated that improvements in fertilizer NUE in agricultural systems will produce less N fertilizer per unit food produced. Therefore, genotypes expressing high NUE with acceptable yield under low N soils will be economically appropriate for farmers and are environmentally friendly. Hence, utilization of NUE as an agronomic index for selection among the inbred lines with high NUE values will assist in the determination of N efficient inbred lines. The top four genotypes which expressed high physiological efficiency of applied N were L18 (29.55), L11 (20.55), L3 (19.8) and L14 (13.3). These four inbred lines yielded 5.02, 5.79, 6.47 and 4.78 t/ha, respectively, at 30 kg N ha−1 fertilizer application rate. Their NUE values ranged from 10 to 13%.
The top 10 high-yielding maize genotypes obtained at 30 kg N ha−1 were L2 (6.24 t/ha), L3 (6.47 t/ha), L4 (6.34 t/ha), L13 (6.08 t/ha), L17 (5.93 t/ha), L20 (6.17 t/ha), L26 (5.91 t/ha), L28 (6.17 t/ha), L29 (6.03 t/ha) and L30 (5.89 t/ha). These genotypes showed NUE values of 21, 22, 21, 20, 20, 21, 20, 21, 21 and 20%, respectively. They also expressed agronomic efficiency of 46, 53, 42, 135, 116, 59, 8, 17, 15 and 111, respectively. Selection for N-agronomic efficiency may not necessarily lead to varieties with higher NUE [41]. Therefore, from the formula of nitrogen agronomic efficiency (NAE), the genotypes that perform more poorly under unfertilized conditions may be preferentially selected since the low performance at low N will increase the final yield. This statement was also verified in the current study. According to Wu et al. [41], low nitrogen agronomic efficiency (LNAE) meets the breeding goals of selecting varieties capable of maintaining high productivity at low N availability. Therefore, they can be used to select genotypes expressing high yields under low soil nitrogen conditions. The top 10 yielding inbred lines identified under 30 kg N ha−1 fertilizer application rate could be considered as the most N-use efficient genotypes that are tolerant to low soil N. These inbred lines also expressed desirable NUE performance since they were in the top 20 for this trait. These inbred lines can, therefore, be used as parental lines for hybrids that can be expected to have superior performance under low soil N conditions.
The significant and positive correlation coefficients between NUE and yield (+0.9), NUE and NUtE (+0.9), NUE and HI (+0.5), NUtE and yield (+0.99), HI and yield (+0.5) and NUtE and HI (+0.5) indicated the utilization efficiency of applied N fertilizer as reflected by the grain yield of each of the N levels. This implied NUE, HI and NUtE as good predictors of yield potential under low soil N conditions. In this study, a significant correlation coefficient was observed between HI and yield (+0.5). Similarly, Li et al. [25] reported significant correlation coefficients for maize yield under N-deficient conditions and plant dry matter amounts at the stages of post-silking and maturity although yield was poorly correlated with the dry matter content.

5. Conclusions

The highest NUE and NUpE values (0.2 kg grain/kg N-fertilizer and 0.1 N plant/kg N respectively) of maize inbred lines were found at 30 kg N ha−1 application rate, while the lowest were observed at 120 kg N ha−1 (0.05 kg grain/kg N-fertilizer and 0.03 N plant/kg N, respectively). Twenty-four inbred lines had high NUE values across N levels with L2, L3, L4, L25, L28, L29 being the top six. Furthermore, the highest performance of Agronomic Efficiency (AE) was found at 0 kg N ha−1 application rate (44.4 kg grain/kg N-fertilizer) whereas the lowest was found at 120 kg N ha−1 application rate (15.1 kg grain/kg N-fertilizer). This implied that an increase in quantity of fertilizer applied in maize production may not necessarily be agronomically efficient.
It was found out that NUE indices with significantly high and positive correlation coefficients with yield were NUtE (+0.99) and HI (+0.5). Additionally, highly significant and positive correlation coefficients were found between NUE and yield (+0.9), with NUtE (+0.9), and with HI (+0.5); NUtE with HI (+0.5)). NUE, HI and NUtE could be good predictors of yield potential under low soil N conditions. In addition, the highest NUpE was obtained from the lowest fertilizer rate applied which was 30 kg N ha−1.
Ten genotypes expressed high-yielding potential at 30 kg N ha−1 application rate. These were L2 (6.24 t/ha), L3 (6.47 t/ha), L4 (6.34 t/ha), L13 (6.08 t/ha), L17 (5.93 t/ha), L20 (6.17 t/ha), L26 (5.91 t/ha), L28 (6.17 t/ha), L29 (6.03 t/ha) and L30 (5.89 t/ha)) and were among the top 24 inbred lines with high NUE values across the N levels. This suggested that 30 kg N ha−1 fertilization rate, combined with the use of N-efficient QPM maize genotypes, could be beneficial in optimizing available fertilizer. This application rate is also economically manageable for the farmer while environmentally sustainable. Furthermore, L4, L8, L12, L14 and L16 are CIMMYT’s lines considered to be drought tolerant, thereby making them important for further studies.

Supplementary Materials

The following supporting information can be downloaded at: https://www.mdpi.com/article/10.3390/agronomy12051118/s1, Table S1: Soil nutrient status at the University of Fort Hare Crop Research Farm at initiation of trial, Table S2: Performance of inbred lines for the estimated traits and indices across N levels, Table S3: Yield performance and ranking of QPM genotypes at different levels of nitrogen application, Table S4: NUE and NUE indices of inbred lines at 90 kg N ha−1 and 120 kg N ha−1, Table S5: NUE and NUE indices of inbred lines at 30 kg N ha−1 and 60 kg N ha−1.

Author Contributions

Conceptualization, O.O.A. and C.S.M.; methodology, O.O.A. and C.S.M., software, N.L.T.; validation, O.O.A., C.S.M. and N.L.T.; formal analysis, O.O.A. and N.L.T.; investigation, O.O.A.; resources, O.O.A. and C.S.M.; data curation, O.O.A.; writing—original draft preparation, O.O.A.; writing—review and editing, C.S.M., C.C. and N.L.T.; visualization, O.O.A. and C.S.M.; supervision, C.S.M.; project administration, O.O.A.; funding acquisition, O.O.A. and C.S.M. All authors have read and agreed to the published version of the manuscript.

Funding

This research received funding from the West Africa Agricultural Productivity Programme (WAAPP-NIGERIA). Additionally, funding support from the National Research Foundation (NRF) (Grant No: 116256; Ref: CSRU180504326029), South Africa is greatly appreciated. The Govan Mbeki Research and Development Centre (GMRDC) is acknowledged for the postdoctoral funding of N.L.T.

Data Availability Statement

The data presented in this study are available on request from the corresponding author. The data are not publicly available for ethical reasons.

Conflicts of Interest

The authors declare no conflict of interest. The sponsors had no role in the design, execution, interpretation, or writing of the study.

References

  1. Macauley, H.; Ramadjita, T. Cereal Crops: Rice, Maize, Millet, Sorghum, Wheat. In Proceedings of the Feeding Africa, Dakar, Senegal, 21–23 October 2015. [Google Scholar]
  2. Adejuwon, J.O. Assessment of the changing pattern in maize cultivation in Sokoto-Rima River Basin, Nigeria. J. Appl. Sci. Environ. Manag. 2018, 22, 1433–1437. [Google Scholar] [CrossRef] [Green Version]
  3. FAO. World Soil Resources: An Explanatory Note on the FAO World Soil Resources Map at 1:25,000,000 Scale; Food and Agriculture Organisation of the United Nations: Rome, Italy, 1991. [Google Scholar]
  4. Prasanna, B.M.; Vasal, S.K.; Kassahun, B.; Singh, N.N. Quality protein maize. Curr. Sci. 2001, 81, 1308–1319. [Google Scholar]
  5. Bhatia, C.R.; Rabson, R. Relationship of grain yield and nutritional quality. In Nutritional Quality of Cereal Grains: Genetic and Agronomic Improvement; Olson, R.A., Frey, K.J., Eds.; Agronomy Monograph No. 28; ASA, CSSA, and SSSA: Madison, WI, USA, 1987; pp. 11–43. [Google Scholar]
  6. Tandzi, L.N.; Mutengwa, C.S.; Ngonkeu, E.L.M.; Woïn, N. Breeding for quality protein maize (QPM) varieties: A review. Agronomy 2017, 7, 80. [Google Scholar] [CrossRef] [Green Version]
  7. FAOSTAT. Statistical Database of the Food and Agriculture Organization of the United Nations. 2003. Available online: http://www.fao.org/waicent/portal/statistics_en.aspFAOSTAT (accessed on 20 August 2019).
  8. FAOSTAT. Crop Production, Food and Agriculture Organization, Statistics Section. 2015. Available online: http://faostat3.fao.org/browse/O/*/E (accessed on 17 April 2021).
  9. FAS, USDA; Foreign Agricultural Service, United States Department of Agriculture. Commodity Intelligence Report. Office of Global Analysis (OGA), International Production Assessment Division (IPAD). 2 July 2018. Available online: www.ipad.fas.usda.gov (accessed on 17 April 2021).
  10. South African Maize Crop Quality Report 2017/2018 Season. The South African Grain Laboratory NPC-SAGL Maize Reports. 124p. Available online: https://sagl.co.za/maize/reports/#sagl (accessed on 12 March 2020).
  11. Wallace, M.B.; Knausenberger, W.I. Inorganic Fertilizer Use in Africa: Environmental and Economic Dimensions; Winrock International Environmental Alliance: Arlington, VA, USA, 1997. [Google Scholar]
  12. Noor, M. Nitrogen management and regulation for optimum NUE in maize—A mini review. Cogent Food Agric. 2017, 3, 1348214. [Google Scholar] [CrossRef]
  13. Andrews, M.; Raven, J.A.; Ea, P.J. Do plants need nitrate? The mechanisms by which nitrogen form affects plants. Ann. Appl. Biol. 2013, 163, 174–199. [Google Scholar] [CrossRef]
  14. Erisman, J.W.; Galloway, J.N.; Seitzinger, S.; Bleeker, A.; Dise, N.B.; Petrescu, A.M.R.; Leach, A.M.; de Vries, W. Consequences of human modification of the global nitrogen cycle. Philos. Trans. R. Soc. B Biol. Sci. 2013, 368, 116. [Google Scholar] [CrossRef] [Green Version]
  15. Galloway, J.N.; Leach, A.M.; Bleeker, A.; Erisman, J.W. A chronology of human understanding of the nitrogen cycle. Philos. Trans. R. Soc. B Biol. Sci. 2013, 368, 120. [Google Scholar] [CrossRef] [Green Version]
  16. Cameron, K.C.; Di, H.J.; Moir, J.L. Nitrogen losses from the soil/plant system: A review. Ann. Appl. Biol. 2013, 162, 145–173. [Google Scholar] [CrossRef]
  17. Fowler, D.; Coyle, M.; Skiba, U.; Sutton, M.A.; Cape, J.N.; Reis, S.; Sheppard, L.J.; Jenkins, A.; Grizzetti, B.; Galloway, J.N.; et al. The global nitrogen cycle in the twenty-first century. Philos. Trans. R. Soc. B Biol. Sci. 2013, 368, 164. [Google Scholar]
  18. Hirel, B.; Gallais, A. Nitrogen use efficiency—Physiological, molecular and genetic investigations towards crop improvement. In Advances in Maize: 3. Essential Reviews in Experimental Biology; Prioul, J.L., Thévenot, C., Molnar, T., Eds.; Society for Experimental Biology: London, UK, 2011; pp. 285–310. [Google Scholar]
  19. Hirschi, K. Nutritional improvements in plants: Time to bite on biofortified foods. Trends Plant Sci. 2009, 13, 459–462. [Google Scholar] [CrossRef]
  20. Mi, G.; Chen, F.; Hang, F. Physiological and genetic mechanisms for nitrogen-use efficiency in Maize. J. Crop Sci. Biotech. 2007, 10, 57–63. [Google Scholar]
  21. Vanlauwe, B.; Kihara, J.; Chivenge, P.; Pypers, P.; Coe, R.; Six, J. Agronomic use efficiency of N fertilizer in maize-based systems in sub-Saharan Africa within the context of integrated soil fertility management. Plant Soil 2011, 339, 35–50. [Google Scholar] [CrossRef]
  22. Eivazi, A.; Habibi, F. Evaluation of nitrogen use efficiency in corn (Zea mays L.) varieties. World Appl. Sci. J. 2013, 21, 63–68. [Google Scholar]
  23. Granato, I.S.C.; Bermudez, F.P.; Dos Reis, G.G.; Dovale, J.C.; Miranda, G.V.; Fritsche-Neto, R. Index selection of tropical maize genotypes for nitrogen use efficiency. Bragantio Camp. 2014, 73, 153–159. [Google Scholar] [CrossRef] [Green Version]
  24. Weih, M.; Hamnér, K.; Pourazari, F. Analysing plant nutrient uptake andutilization efficiencies: Comparison between crops and approaches. Plant Soil 2018, 430, 7–21. [Google Scholar] [CrossRef] [Green Version]
  25. Li, X.-L.; Guo, L.-G.; Zhou, B.-Y.; Tang, X.-M.; Chen, C.-C.; Zhang, L.; Zhang, S.-Y.; Li, C.-F.; Xiao, K.; Dong, W.-X.; et al. Characterization of low-N responses in maize (Zea mays L.) cultivars with contrasting nitrogen use efficiency in the North China Plain. J. Integr. Agric. 2019, 18, 2141–2152. [Google Scholar] [CrossRef]
  26. Hawkesford, M.J. Reducing the reliance on nitrogen fertilizer for wheat production. J. Cereal Sci. 2014, 59, 276–283. [Google Scholar] [CrossRef] [Green Version]
  27. Rochiman, K.; Purnobasuki, H. Effect of Nitrogen Supply and Genotypic Variation for Nitrogen Use Efficiency in Maize. Am. J. Exp. Agric. 2013, 3, 182–199. [Google Scholar]
  28. Moll, R.H.; Kamprath, E.J.; Jackson, W.A. Analysis and interpretation of factors which contribute to efficiency of nitrogen utilization. Agron. J. 1982, 74, 562–564. [Google Scholar] [CrossRef]
  29. Dobermann, A.R. Nitrogen Use Efficiency—State of the Art. Agronomy—Faculty Publications. Agronomy and Horticulture Department of Nebraska—Lincoln. 2005. Available online: www.digitalcommons.unl.edu/agronomyfacpub/316 (accessed on 18 July 2015).
  30. Ismail, A.M.A. A Critical analysis of Harvest Index. Qatar Univ. Sci. J. 1993, 13, 253–263. [Google Scholar]
  31. Muchow, R.C. Nitrogen utilization efficiency in maize and grain sorghum. Field Crop Res. 1998, 56, 209–216. [Google Scholar] [CrossRef]
  32. Shapiro, C.A.; Wortmann, C.S. Corn response to N rate, row spacing and plant density in Eastern Nebraska. Agron. J. 2006, 98, 529–535. [Google Scholar] [CrossRef] [Green Version]
  33. Mastrodomenico, A.T.; Hendrix, C.C.; Below, F.E. Nitrogen Use efficiency and the genetic variation of maize expired plant variety protection germplasm. Agriculture 2018, 8, 3. [Google Scholar] [CrossRef] [Green Version]
  34. Presterl, T.; Groh, S.; Landbeck, M.; Seitz, G.; Schmidt, W.; Geiger, H.H. Nitrogen uptake and utilization efficiency of European maize hybrids developed under conditions of low and high nitrogen input. Plant Breed. 2002, 121, 480–486. [Google Scholar] [CrossRef]
  35. Haegele, J.W.; Cook, K.A.; Nichols, D.M.; Below, F.E. Changes in nitrogen use traits associated with genetic improvement for grain yield of maize hybrids released in different decades. Crop Sci. 2013, 53, 1256–1268. [Google Scholar] [CrossRef] [Green Version]
  36. Gallais, A.; Oque, M. Genetic variation and selection for nitrogen use efficiency in maize: A synthesis. Maydica 2005, 50, 531–537. [Google Scholar]
  37. Raun, W.R.; Johnson, G.V. Improving nitrogen use efficiency for cereal production. Agron. J. 1999, 91, 357–363. [Google Scholar] [CrossRef] [Green Version]
  38. Moose, S.P.; Below, F.E. Biotechnology approaches to improving maize nitrogen use efficiency. In Molecular Genetic Approaches to Maize Improvement. Biotechnology in Agriculture and Forestry Series; Kriz, A.L., Larkins, B.A., Eds.; Springer: Berlin/Heidelberg, Germany, 2009; Volume 63, pp. 65–77. ISBN 978-3-540-68919-5. [Google Scholar]
  39. Onasanya, R.O.; Aiyelari, O.P.; Oikeh, S.; Nwilene, F.E.; Oyelakin, O.O. Growth and yield response of maize (Zea mays L.) to different rates of nitrogen and phosphorus fertilizers in Southern Nigeria. World J. Agric. Sci. 2009, 5, 400–407. [Google Scholar]
  40. Rehman, A.; Saleem, M.F.; Safdar, M.E.; Hussain, S.; Akhtar, N. Grain quality, nutrient use efficiency, and bioeconomics of maize under different sowing methods and NPK levels. Chil. J. Agric. Res. 2011, 71, 586–593. [Google Scholar] [CrossRef] [Green Version]
  41. Wu, Y.; Liu, W.; Li, X.; Li, M.; Zhang, D.; Hao, Z.; Weng, J.; Xu, Y.; Bai, L.; Zhang, S.; et al. Low-nitrogen stress tolerance and nitrogen agronomic efficiency among maize inbred: Comparison of multiple indices and evaluation of genetic variation. Euphytica 2011, 180, 281–290. [Google Scholar] [CrossRef]
Figure 1. Harvest index of inbred lines across different levels of nitrogen application.
Agronomy 12 01118 g001
Figure 2. Yield performance of QPM inbred lines at different levels of nitrogen application.
Agronomy 12 01118 g002
Table 1. List of parental inbred lines that were screened for low nitrogen stress tolerance.
Quality Seeds Germplasm (a)
Inbred No.Source of MaterialGenotypeInbred No.Source of MaterialGenotype
L1SO181WQSW2L22HM238WQSW16
L3SO507WQSW3L23HM267WQSW17
L5V0548WQSW4L24HM267WQSW18
L7V0298WQSW5L25HM284WQSW20
L9B0388WQSW6L26HM1472WQSW21
L11EM362WQSW7L27JM2261WQSW22
L13EM583WQSW8L28JM2341WQSW23
L15E625WQSW10L29JM2561WQSW25
L17GM15WQSW12L30JM2641WQSW28
L19GM44WQSW13L31E5QSW29
L20HM18WQSW14L32E27QSW32
L21HM233WQSW15
CIMMYT Germplasm (b)
Inbred No.GenotypePedigree
L2IBL1[CLQRCW Q50/CML 312 SR]-2-2-1-B-B-1-B-B
L4IBL2[CML 202/CML 144] F2-1-1-3-B-1 B*6[GQL5/[GQL5/[MSR × POOL 9] C1F2-205-1
(OSU23i)-5-3-X-X-1-BB[F2-4sx]-11-3-1-1-B*4]-B*5-1-B
L6IBL6[CML150/CML 373]-B-2-2-B*4-4-B-B
L8IBL7[CML159/[CML159/[MSRXPOOL9]C1F2-205-1(OSU23i)-5-3-X-X-1-BB]F2-3sx]-8-1-1-BBB-4-B-B
L10IBL15CLQRCWQ50-BB-1-2-B-B
L12IBL17CML181-B-1-5-B-B7
L14IBL18CML182-BB-B
L16IBL21CML492-BB-2-1-B-B
L18IBL22WW01408-1-1-2-B*4-#B-B-B
Table 2. Mean squares of parameters collected at various levels of nitrogen application.
Source (a)DFBio Total NG Total NYieldNUtE
N Level41.07 ***1.2 ***67.4 ***4.3 ***
Inbred310.03 ns0.03 ns8.8 ***8.09 ***
Replication10.0002 ns0.2 *97.1 ***108.6 ***
N Level*Inbred1240.03 ns0.03 ns2.3 ***0.2 ***
Error1590.030.030.80.09
Source (b)DFRENPENAENUENUpEHI
N Level30.0005 ***1009 **10118 ***0.2 ***0.06 ***0.009 ns
Inbred310.0001 ***1079 ns3896 ***0.002 ***51 × 106 ns0.02 *
Replication10.00 ns459 ns685 ns0.02 ***1 × 10⁵ ns0.1 ns
Error2200.000037156820.00022 × 1050.01
* p ≤ 0.05; **: p ≤ 0.01; ***: p ≤ 0.001; ns: non-significant; REN: crop recovery efficiency of applied N (kg N-uptake/kg N-fertilizer); PEN: physiological efficiency of applied N (kg grain/kg N-uptake); AE: agronomic efficiency (kg grain/kg N-fertilizer); NUE: nitrogen use efficiency (kg grain/kg N-fertilizer); NUpE: total amount of N in the mature plant divided by the amount of N applied to soil (kg·ha−1); NUtE: ratio between grain weight and the total amount of N in the mature plant, i.e., kg grain/total N in dry matter of above ground mature plant; HI: harvest index (%); Bio Total N: total nitrogen in biomass; G Total N: total nitrogen in grain.
Table 3. Mean values of all the variables estimated at different levels of nitrogen application.
N Level (a)Bio Total NG Total NYieldNUtEHI
0 kg N ha−11.55 c1.61 c4.07 d1.30 d0.26 a
30 kg N ha−11.46 d1.57 c5.41 c1.79 b0.27 a
60 kg N ha−11.59 c1.76 b6.31 ab1.90 ab0.29 a
90 kg N ha−11.68 b1.82 ab6.74 a1.93 a0.26 a
120 kg N ha−11.79 a1.89 a5.88 b1.60 c0.28 a
Mean1.611.735.681.700.27
N Level (b)RENPENAENUENUpE
30 kg N ha−1−0.003 b−3.43 a44.4 a0.2 a0.10 a
60 kg N ha−10.001 a3.10 a37.3 ab0.11 b0.06 b
90 kg N ha−10.001 a6.06 a29.6 b0.07 c0.04 c
120 kg N ha−10.003 a2.31 a15.1 c0.05 d0.03 d
Mean0.00052.0131.60.110.06
Means followed by different letters are significantly different. REN: crop recovery efficiency of applied N (kg N-uptake/kg N-fertilizer); PEN: physiological efficiency of applied N (kg grain/kg N-uptake); AE: agronomic efficiency (kg grain/kg N-fertilizer); NUE: nitrogen use efficiency (kg grain/kg N-fertilizer); NUpE: total amount of N in the mature plant divided by the amount of N applied to soil (kg.ha−1); NUtE: ratio between grain weight and the total amount of N in the mature plant, i.e., kg grain/total N in dry matter of above ground mature plant; HI: harvest index (%); Bio Total N: total nitrogen in biomass; G Total N: total nitrogen in grain.
Table 4. Correlation coefficients between variables estimated across different nitrogen application levels.
RENPENAENUENUpEBio
Total N
G
Total N
YieldNUtEHI
REN1
PENns1
AEnsns1
NUEns0.4 *0.4 *1
NUpEnsnsnsns1
Bio Total N−0.6 ***nsnsnsns1
G Total Nnsnsnsnsnsns1
Yieldns0.4 *ns0.9 ***nsnsns1
NUtEns0.4 *ns0.9 ***nsnsns0.99 ***1
HInsnsns0.5 **nsnsns0.5 **0.5 **1
* p ≤ 0.05; **: p ≤ 0.01; ***: p ≤ 0.001; REN: crop recovery efficiency of applied N; PEN: physiological efficiency of applied N; AE: agronomic efficiency; NUE: nitrogen use efficiency; NUpE: total amount of N in the mature plant, divided by the amount of N applied to soil; NUtE: ratio between grain weight and the total amount of N in the mature plant, i.e., kg grain/total N in dry matter of above ground mature plant; HI: harvest index; Bio Total N: total nitrogen in biomass; G Total N: total nitrogen in grain. ns: not significant.
Publisher’s Note: MDPI stays neutral with regard to jurisdictional claims in published maps and institutional affiliations.

