Article

Prospective Practice for Compound Stress Tolerance in Thyme Plants Using Nanoparticles and Biochar for Photosynthesis and Biochemical Ingredient Stability

by
Abdel Wahab M. Mahmoud
1,*,
Sanaa E. A. Esmail
2,
Asmaa B. El-Attar
2,
Eman Z. Othman
2 and
Reham M. El-Bahbohy
1
1
Department of Agricultural Botany, Plant Physiology Division, Faculty of Agriculture, Cairo University, Giza 12613, Egypt
2
Department of Ornamental Horticulture, Faculty of Agriculture, Cairo University, Giza 12613, Egypt
*
Author to whom correspondence should be addressed.
Agronomy 2022, 12(5), 1069; https://doi.org/10.3390/agronomy12051069
Submission received: 26 March 2022 / Revised: 21 April 2022 / Accepted: 25 April 2022 / Published: 28 April 2022

Abstract

:
Global climatic change leads to many detrimental effects on all life forms. Outstanding case, salinity, and drought are considered multidimensional stress that severely affect plant growth and sustainable agriculture. Thymus vulgaris is a medicinal plant that has phytochemical constituents, and it is threatened by several abiotic stresses caused by climate change. Therefore, the present study aims to evaluate the physiological response and thyme tolerance grown on a newlyreclaimed saline sandy soil under drought conditions and treated by biochar-loaded biofertilizers, nano-zeolite, and nano-silicon through two consecutive seasons. The nanoparticles enhanced plant growth and alleviated the adverse effect of drought. Additionally, a synergistic effect was noticed when combining nanoparticles and biofertilizers. The quadruple combined treatment of nano-zeolite, nano-silicon, biochar, and organic matter (T7) significantly increased thyme morphological traits, photosynthetic parameters, oil, and yield compared to control treatment. Additionally, T7 increased the concentration of endogenous nutrients (N, P, K, Na, Ca, Mg, Zn, Fe, Mn), proline, total phenols, and total flavonoids, in addition to indoleacetic acid, gibberellic acid, and antioxidant enzymes in thyme compared to other treatments. T7 showed the lowest concentration of soluble sugars, abscisic acid, and transpiration rate. Interestingly, T7 increased the medicinal benefits of thyme by increasing its vital hydrocarbons, and oxygenated compounds. These findings introduce a dual benefit of nano-fertilizers in combination with biochar and organic matter in ameliorating soil salinity and drought along with increasing thymegrowth, productivity, and therapeutic value.

1. Introduction

Medicinal plants with valuable phytochemical constituents that are important for healing and curing human diseases have attracted global attention in recent years. Thyme (Thymus sp.), as an aromatic perennial evergreen herb of the mint family Lamiaceae, has high medicinal and nutritional value. Commercially, thyme is grown for its dried leaves, extracts and oleoresins, and essential oil. The main countries that produce thyme include Spain, France, Portugal, Italy, Germany, Canada, the United States, as well as North Africa [1]. Thyme species have medicinal, ornamental, and culinary uses. They are widely used as carminative, food digestive, antispasmodic, antitussive, expectorant, and food flavors. Additionally, the essential oil of thyme has high pharmaceutical and industrial value [2].
The stability of food supplies, fiber, and other crops isthreatened by pests, diseases, climate change, and other ever-changing stresses. Environmental stress factors such as drought, heat, salinity, cold, or pathogen infection can cause demoralizing consequences on plant development and production of yield under field conditions. Drought and salinity are the most dangerous abiotic stresses for plants in general and thyme in particular. They negatively affected both plant growth and productivity leading to a 50% reduction in its worldwide yield [3]. For instance, salt stress causes ion toxicity to plant cells due to excessive ion entry. Consequently, it alters growth metabolism and hinders celldivision whichdelays seedling emergence [4]. Besides ionic stress and Na+ toxicity, salinity causes apparent water inadequacy [5], which induces cellular damages resulting in the disruption of plant cell osmosis [6].
Drought stress reduces leaf area, plant height, and dry matter accumulation in many species of medicinal and ornamental plants [7]. Physiologically, drought causes stomatal closure, which diminishes stomatal conductance to avoid water loss from the plant [8]. In this case, stomata gas exchange isreduced resulting in retard photosynthesis and transpiration rates [9], which consequently reduce plant biomass and yield. At the cellular level, drought leads to enzyme and protein destruction along with altered protein synthesis and reduced chlorophyll content as well [10]. Mahmoud et al. [11] found that drought and salinity stresses cause alteration in plants at the molecular, physiological, and morphological levels. There are many ways to manage or alleviate abiotic stresses to plants. These practices include traditional methods (applying soil amendments and cultivating tolerant plant species) and novel methods (such as the use of genetically modified plants resistant to stress and nano-fertilization).
Nano-metric scaled particles are a nutrient encapsulation, which can steadily release micro and macronutrients for plant uptake [12]. Compared to traditional or chemical fertilizers, nano-fertilizers have the advantage of increasing fertilizer use efficiency which, in turn, increases nutrient soil retention capacity [13]. Moreover, nano-fertilizers have a protective role for environmental conditions due to the tiny amount used during applications [14]. This also results in a reduction in nutrient leaching, runoff, and gas emissions to the atmosphere [15]. Furthermore, nano-fertilizers alone or in conjunction with beneficial microorganisms (biofertilizers) can alleviate the abiotic stress that in turn provides great additional benefits to the ecosystem [16]. For example, nano-silicon has a significant effect in mitigating different abiotic stresses [17]. So, these effects make plants more resistant to drought, elevated temperature, and humidity [18]. Additionally, during drought stress, water molecules retained in the porous structure of nano-zeolite guarantee a continuous water supply to plant roots along with increasing soil water holding capacity [19]. Due to its superior properties, nano-zeolite can reduce Na+ in saline soil by ion exchange, adsorption, and salt retention [13,20].
Despite the benefits of nano-fertilizers, to our knowledge, studies regarding the effects of nano-fertilizers on thyme are lacking. The current study attempts to shed light on themany benefits of using nano-fertilizers on the physiology and productivity of thyme plants subjected to drought and salinity stress.

2. Materials and Methods

2.1. Experimental Location

An open field was the locationof the present research, which was carried out at a private newly reclaimed salt-affected farm (>3 ds/m) of Wadi El-Notron, Beheira Governorate, Egypt (Longitude 28°54′ E, Latitude 28°20′ N and Altitude 130 m). At the Soil, Water and Environment Research Institute, Agriculture Research Centre (A.R.C), mechanical and chemical analyses of the reclaimed soil and organic matter (compost) were performed according to [21,22], the properties of which are shown in Table 1 and Table 2.

2.2. Irrigation System

Irrigation water was supplied through a drip irrigation network using 4.0 L hr−1 drippers [23]. Thefield capacity was calculated under dripping irrigation when zones of water overlap each other on the line. The farm irrigation was practiced at 7-day intervals.

2.3. Plant Material, Transplant, and Harvest Dates

Thymus vulgaris, L seeds were planted in the nursery under shaded conditions forgermination on 15 December 2020 and 2021. The seedlings were transplanted to moist soil after 60 days from sowing and planted 30 cm apart on each ridge. The plants were harvested twice: at the beginning of both June and September. Ten plants from each plot were chosen randomly and were left on shelvesfor two weeks in a drying yard for complete dryness. The mean value of the ten dry-weightplants represented the plot value. A composite sample from the ten dried plants was taken to determine the essential oil content (in duplicate). Samples were hydro-distilled in a Clevenger’s-type apparatus for three and half hours. The oil was collected and dried, and the oil content was calculated based on the dry weight.

2.4. Essential Oil Analysis

The essential oil obtained from the different treatments was determined after hydro-distillation of the dry herbs of the June cut only. Twenty μL of each oil was diluted to 1 mL with diethyl ether then 2 μL of the diluted solution was injected into Perkin Elmer XL gas chromatographequipped with a flame ionization detector (FID) at a split ratio of 1:10. A 60 m × 0.32 mmID fused-silica capillary column coated with DB-5 (5% phenyl, 95% methyl-polysiloxane) was used to separate the different volatile components. The oven temperature was programmed from 50 °C to 220 °C at a rate of 3 °C/min. The injector and detector temperatures were 230 and 250 °C, respectively. Helium was used as a carrier gas at a flow rate of 1.0 mL/min. The recorded values were the mean of three analyses. Gas chromatography-mass spectrometry (GC-MS) analysis was conducted on Hewlett-Packard 5985 instrument coupled with HP MS system. The ionization voltage was 70 eV and the ion source temperature was 200 °C. The components of essential oil were identified using the (NBS) MS library or other published mass spectra [24], thentheir retention indices were compared with published data [25], and the retention indices of the volatile components were calculated using a hydrocarbon kit (C8-C18; Aldrich Chemical Co., St. Louis, MI, USA).

2.5. Biochar Preparation

Biochar was prepared from rice husk using the method described by [13]. The huskwas collected after harvesting season from El-Sharkya province, Egypt, then cut into small fragments (4–5 mm) and pyrolyzed in an oven at 350 °C for 24 h to produce (derive) biochar. The chemical compositions of rice husk-derived biochar (BC) are presented in Table 3. The contents of ash, carbon, nitrogen, and hydrogen were determined according to [26]. The pH in BC weight—water volume (1:1) was determined in water suspension using a pH meter, and the EC value was measured by EC-meter. The BC contents of Si, Ca, K, Mg, and S were measured by an atomic absorption spectrophotometer with air-acetylene fuel (Pye Unicam, model SP-1900, Ventura, CA, USA). The C:N ratios after soaking in ammonium sulfate and after inoculation by microorganisms (Azotobacter chrococcum and Bacillus subtilis) were calculated as mentioned by [27]. Zeta potential (ZP) was measured for Biochar by Zeta-Meter 3.0+ system (Zeta Meter Inc., Harrisonburg, VA, USA) at the National Research Center, Giza, Egypt. The biochar was incorporated into the soil at a dose of 825 kg/ha one week before planting.

2.6. Chemical Fertilizers

Two days before planting, chemical fertilization of calcium superphosphate (15% P2O5), and potassium sulfate (48% K2O) at the rate of 200 and 50 kg/Fadden, respectively, was cooperated into the soil atarate recommended by the Agriculture Ministry of Egypt. Nitrogen fertilization (ammonium HAT, 20.5%) was added at a rate of 100 kg/Fadden and it split up in two equal doses, the first one 20 days after cultivation and the second one after the first cut directly throughout both seasons, except those which applied with different treatments.

2.7. Nano-Zeolite Preparation

Nano-zeolite was prepared according to [28] then was loaded with nitrogen (Table 4 and Figure 1) according to [29]. Transmission electronic microscope (TEM) examination and imaging were performed at the Research Park, Faculty of Agriculture, Cairo University (FA-CURP). The total N content was analyzed using the Kjeldahl digestion method [30]. Nano-zeolite was added at a rate of 1.3 L ha−1 through the irrigation network 10 days before planting and 20, 35, 45, and 70 days after planting.

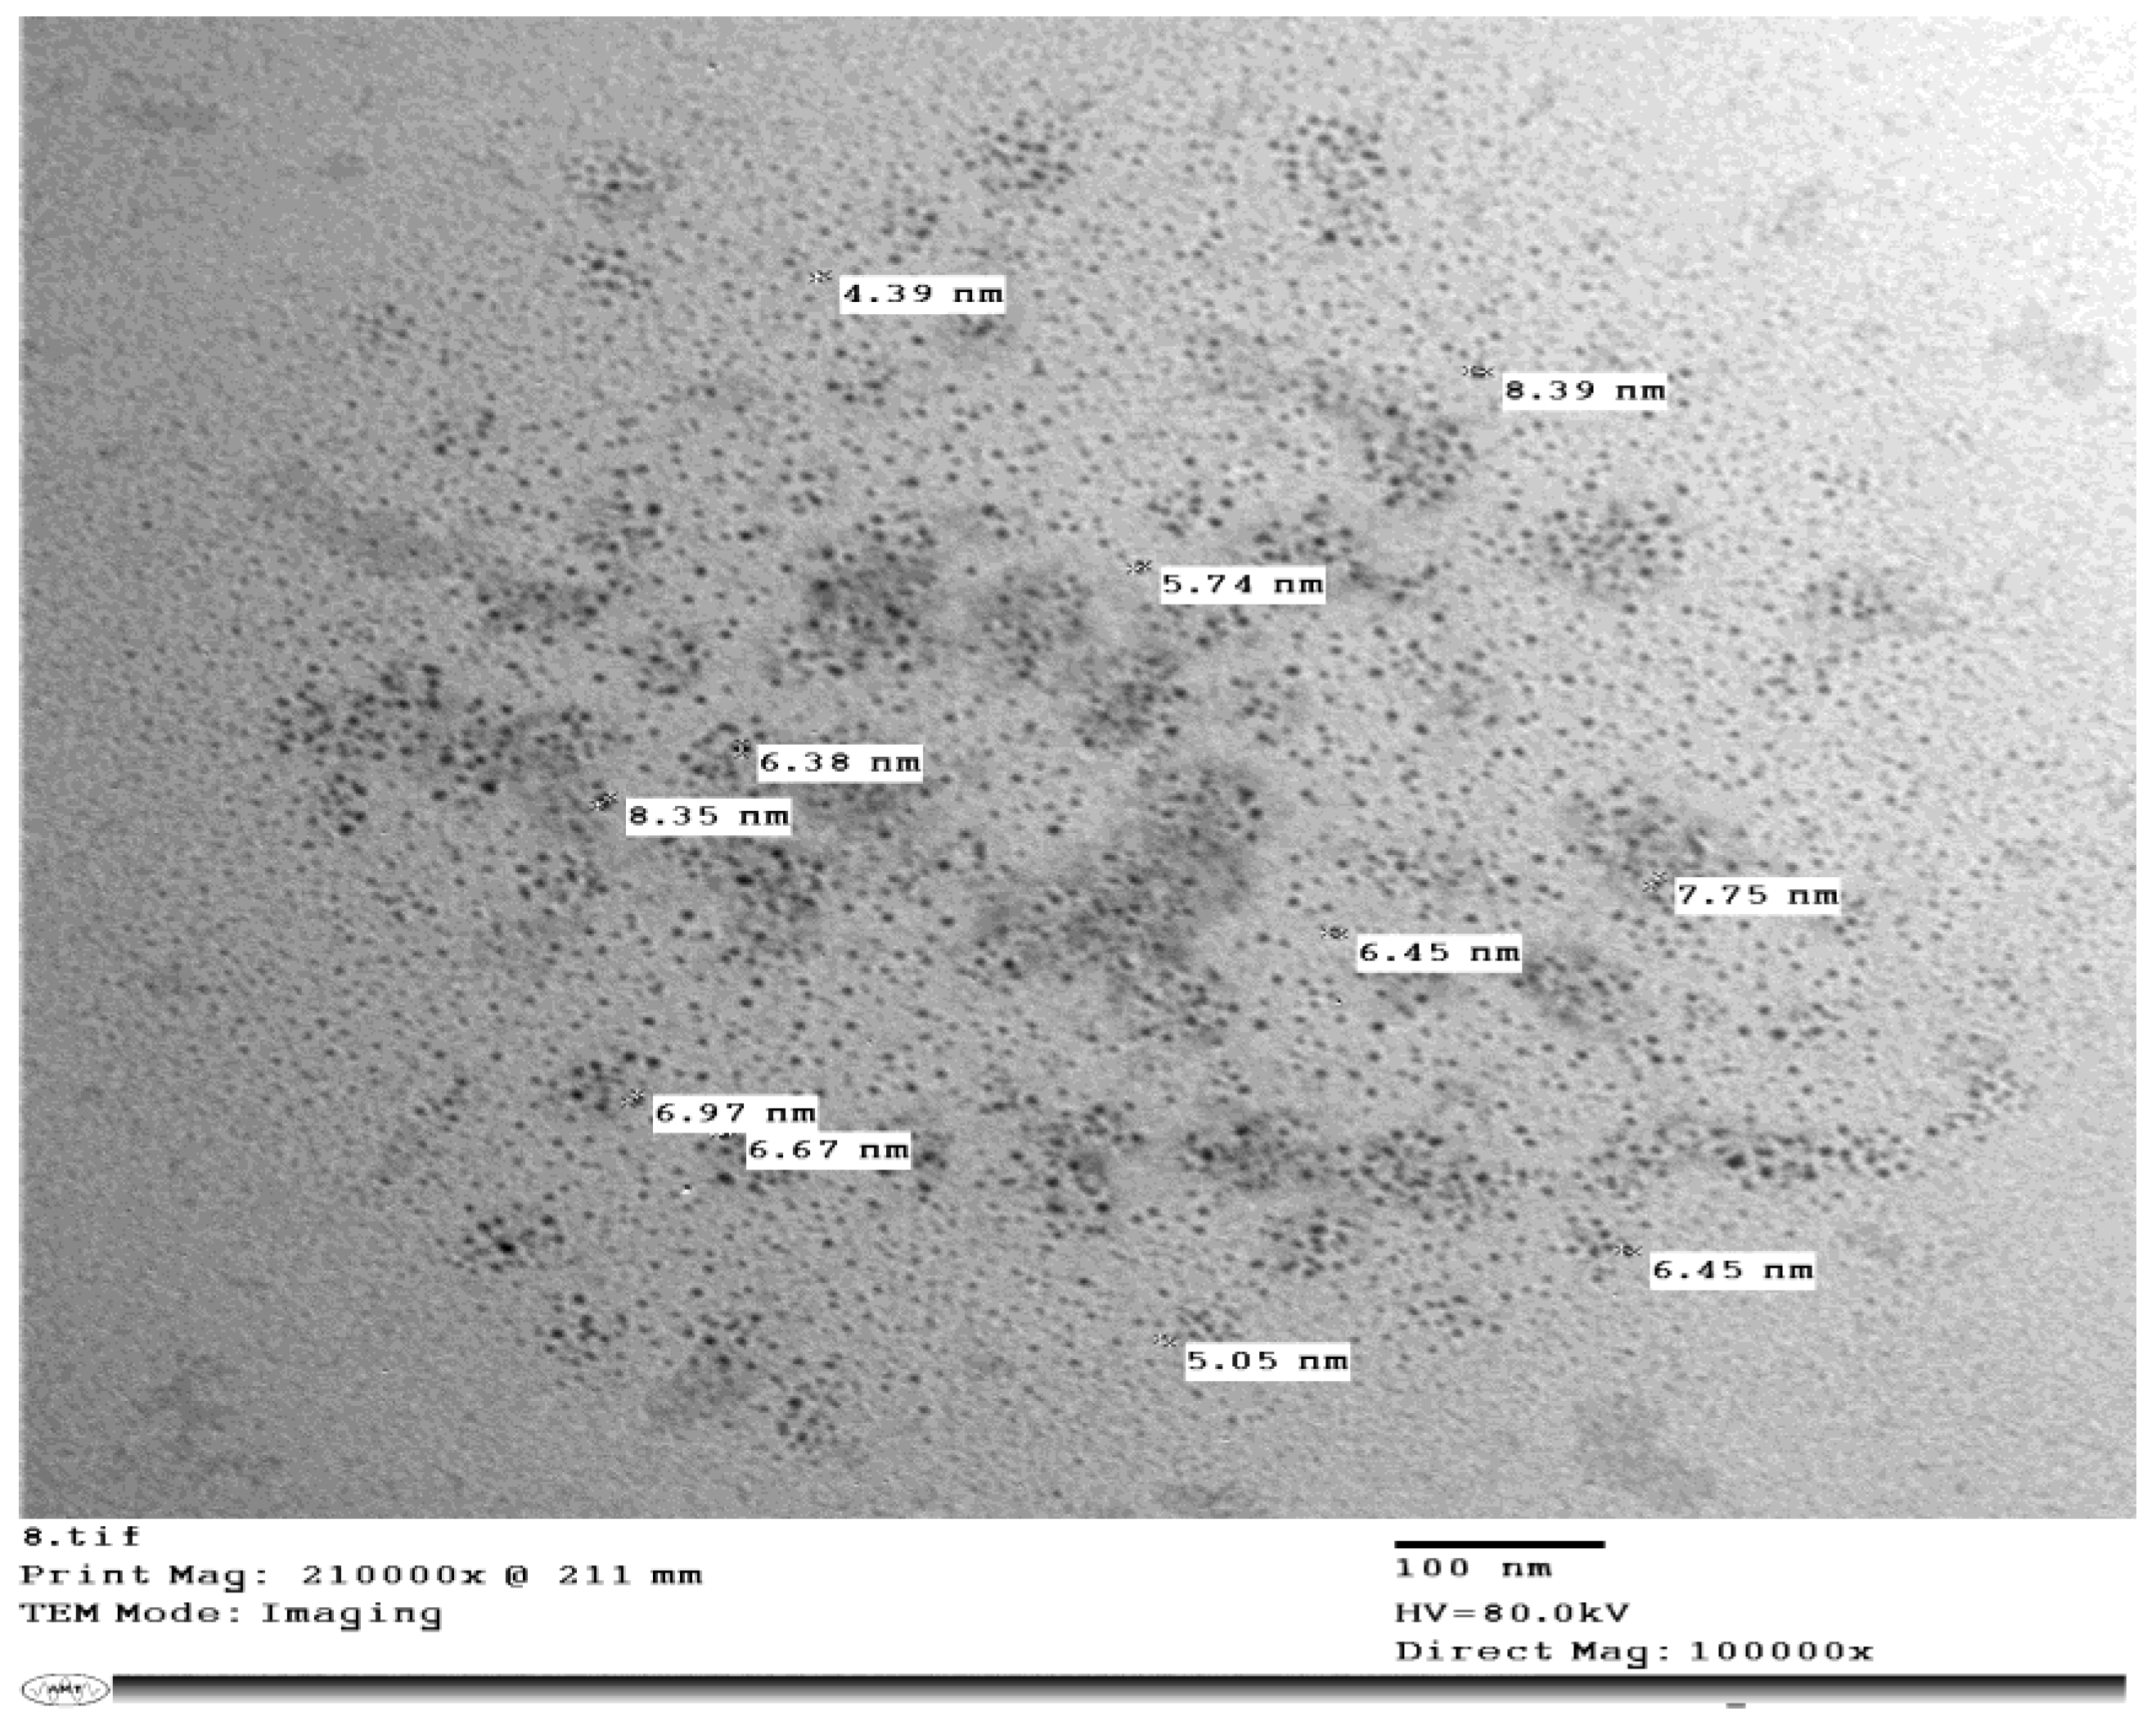
2.8. Synthesis of Silicon Nanoparticles

Silicon nanoparticleswere prepared and synthesized from their precursors, silicon tetrachloride (SiCl4). All used precursors (SiCl4 and reagents were purchased from Sigma and Aldrich Chemical Co. (St. Louis, MO, USA). Nano-silicon (Figure 2) was synthesized using the method described by [31] and published elsewhere [32]. The morphology and size of the nanoparticles were investigated using a JEOL 1010 transmission electron microscope at 80 kV (JEOL, Tokyo, Japan). One drop of the nanoparticle solution was spread onto a carbon-coated copper grid then dried at room temperature for 24 h for transmission electron microscopy (TEM) inspection. Silicon nanoparticles were added to the soil (20 ppm concentration) at 20, 35, 45, and 70 days after planting.
During the two successive seasons, the treatments were as follows:
-
NPK + Organic matter (O) as a control T1
-
NPK + Nano Silicon (nS) + Organic matter (O) T2
-
Biochar (BC) + Organic matter(O) T3
-
Nano Silicon (nS) + Organic matter (O) T4
-
Nano Zeolite (nZ) + Nano Silicon (nS) + Organic matter (O) T5
-
Biochar (BC) + Nano Silicon (nS) + Organic matter (O) T6
-
Nano Zeolite (nZ) + Biochar (BC) + Nano Silicon (nS) + Organic matter (O) T7

2.9. Data Recorded

The following data were recorded:
A. Morphological Traits
-
Plant height (cm)
-
Lateral branch numbers
-
Shoot fresh and dry weight (g plant−1)
-
Root fresh and dry weight (g plant−1)
-
Yield fresh weight (Kg/Fadden)
-
Plant Water content (%)
-
Photosynthetic rate (CO2 m−2 s−1)
-
Intercellular CO2 concentration (ppm)
-
Transpiration rate (mmol m−2s−1)
-
Plant Water use efficiency (μmol mmol−1)
-
Oil yield\L\Fadden.
B. Relative Water Content (RWC)
After 15 days of treatment, samples from the top leaves were taken for RWC determination. Fresh weight (FW) of five-leaf discs was recorded and then the leaf discs were immersed in deionized water for 4 h. The wet surface of the turgid leaf discs was blot-dried quickly before weighing (TW). The leaf discs were then dried for 72 h at 70°C in the oven, and the dry weight (DW) was then measured. The RWC was calculated and expressed in percentage based on the formula: RWC = (FW − DW/TW − DW) × 100 [33].
C. Net Photosynthesis.
Measurements of net photosynthesis on an area basis [μmol CO2 m−2s−1], leaf stomatal conductance [mol H2O m−2s−1], intercellular CO2 concentration (ppm), and water use efficiency of five different leaves per treatment were monitored using a LICOR 6400 (Lincoln, Nebraska, NE, USA) infrared gas analyzer (IRGA). Light intensity (Photosynthetically active radiation, PAR) within the sampling chamber was set at 1500 [μmol m−2s−1], using a Li-6400- 02B LED light source (LI-COR). The CO2 flow into the chamber was maintained at a concentration of 400 μmol mol−1 using an LI-6400-01 CO2 mixer (LI-COR).
D. Chemical Analysis
The plant herb was dried in an electric oven at 70 °C for 24 h according to, and then finely ground for chemical elements determination. The wet digestion of 0.2 g plant material with sulfuric and perchloric acids was carried out on samples by adding concentrated sulfuric acid (5 mL), and the mixture was heated for 10 min at 100 °C;0.5 mL of perchloric acid was then added and heating continuedat 350 °C till a clear solution was obtained [22,30].
The total nitrogen content of the dried leaves was determined using the modified micro-Kjeldahl method as described by [30]. Phosphorus was determined colorimetrically using the chloro-stannous molybdophosphoric blue color method in sulfuric acid according to [22]. Potassium, calcium, and sodium concentrations were determined using the flame photometer apparatus (CORNING M 410, Darmstadt, Germany). Concentrations of Mg, Zn, Mn, and Fe in plant samples were determined using an atomic absorption spectrophotometer with air-acetylene and fuel (PyeUnicam, model SP-1900, Ventura, CA, USA).
Total chlorophyll and carotenoids content were measured by spectrophotometer and calculated according to the equation described by [34].
Total carbohydrates in plant samples were determined by the phosphomolybdic acid method according to [30]. Total phenolic contents of the extracts were determined spectrophotometrically according to the Folin–Ciocalteu colorimetric method [35]. Total flavonoids were determined using the method of [36]. Free proline content was extracted from the leaf tissues according to the method described by [37]. Total soluble sugar was determined according to the modified method described by Eshligel [38].

2.10. Endogenous Phytohormones

Freeze-dried plant herbs (6 g. FW) were ground to a fine powder within a mortar and pestle. The powdered was extracted three times (once for 3 h and twice for 1 h) with methanol (80% v/v, 15 mL./g. FW), supplemented with butylated hydroxytoluene DBPC(2, 6-di-tert-butyl-P-crosol) as an antioxidant at 4 °C in darkness. The extract was centrifuged at 4000 rpm. The supernatant was transferred into flasks wrapped with aluminum foil and the residue was extracted twice. The supernatants were gathered then the total volume was reduced to 10 mL at 35 °C under vacuum. The aqueous extract was adjusted to pH 8.6 and extracted three times with an equal volume of pure ethyl acetate. The combined alkaline ethyl acetate extract was dehydrated over anhydrous sodium sulfate then filtered. The filtrate was evaporated to dryness under vacuum at 35 °C and redissolved in 1 mL absolute methanol. The methanol extract was used after methylation according to Fales et al. [39] to determine Gibberellic acid (GA),abscisic acid (ABA),and indole-acetic acid (IAA). The quantification of the endogenous phytohormones was carried out with ATI Unicam Gas-LiquidChromatography, 610 Series, equipped with a flame ionization detector according to the method described by [40]. The fractionation of phytohormones was conducted using a coiled glass column (1.5 m × 4 mm.) packed with 1% OV-17. Gases flow rates were 30, 30, and 330 mL/min for nitrogen, hydrogen, and air, respectively. The peaks identification and quantification of phytohormones were performed by using external authentic hormones and a Microsoft program to calculate the concentrations of the identified peaks.

2.11. The Activity of Antioxidant Enzymes

The herb samples used to determine catalase (CAT) and peroxidase (POD) activity were prepared according to themethod of [41]. Briefly, 0.5 g of the herb were ground in liquid nitrogen and homogenized in a mixture consisting of 5 mL potassium phosphate buffer, 0.5% Triton X-100, 2% N-Vinylpyrrolidone (NVP), 5 mM Ethylenediaminetetraacetic Acid, Disodium Salt Dihydrate, and 1 mM ascorbicAcid. The homogenized mixture was centrifuged at 1000× g for 25 min at 4 °C and the supernatants were used to measure the activity of catalase [42], and peroxidase [43]. The values of CAT and POD were defined as units mg−1.

2.12. Statistical Analysis

The experimental design was a randomized complete block design (RCBD) with five replicates. The data were analyzed usingan ANOVA test at 5% significance levelthen analyzed using Duncan MultipleRange Test (DMRT) at 5% [44].

3. Results and Discussion

3.1. Nanoparticles EnhancedPlant Growth, Yield, and Photosynthetic Parameters

Salinity and drought stresses negatively affected all thyme plant growth and its yield quality as clearly evident in T1 (Table 5). Under saline and drought conditions, exogenousT5 (nano-zeolite, nano-silicon, and organic fertilizers) and T7 (nano-zeolite, nano-silicon, biochar, and organic fertilizers) treatments significantly improved thyme growth parameters compared to controlT1. A similar trend was observed in T7 treatmentsince thyme yieldincreased by109and 108% in the first and second seasons, respectively, compared to control. The maximum thyme plant growth was recorded when soils were treated by all fertilizer types (T7). Plant height, lateral branches, shoot fresh and dry weight, root fresh and dry weight increased by 44.6, 72.3, 37,68, 51.5, and 123%, respectively, in the first season, and by 56.4, 73.5, 41,71.3, 53.2, and 101%, respectively, in the second season, compared to control T1.
It was noticed that applying both nano (zeolite and silicon) in combination with both amendments (biochar and organic matter) realized synergistic effects on thyme growth and development compared to their single application with chemical fertilizers (Table 5). This is in accordance with the results obtained by [32], who stated that the combined application of nanoparticles has a substantial effect on plant growth and its physiological parameters. Nano-zeolite and nano-silicon have a good affinity for improving both soil fertilityand soil physical characteristics which in turn promotes plant growth [13,45]. It is well known that salinity and drought have detrimental effects on plant growth and development. Salinity affects plants directly by reducing growth and dry matter accumulation [46]. Indirectly, salinity reduces nitrification and mineralization which in turn limits nutrients uptake [47]. Additionally, salinity causes toxicity to plants by Na+ accumulation and decreasing cell osmotic pressure. As a result, a reduction in plant water movement and its hydraulic conductivity occurs within the root system leading to reduced plant growth and development [48]. Drought stress affects plants in an analogous manner. Drought reduces both germination percentage as reported in [49], and root length in many plant species [50], due to a decreased turgor pressure in plant cells which negatively affects biomass and plant growth [51].
Under saline sandy soil and drought effect, photosynthetic parameters were significantly improved withT5 and T7 treatmentscompared to control treatment (Table 6). For thyme oil yield, the highest incrementwas recorded with T7 since it increased by 178.3 and 102.8% in the first and second seasons, respectively, compared to control. However, T7 significantly improved boththyme leaf water content and water use efficiency. In the first and second seasons, water content increased by 13 and 8%, while water use efficiency increased by 91.6 and 111.2%, respectively, in comparison to control. Regarding photosynthetic parameters, net photosynthesis rate and intercellular CO2 concentration were increased by 36.2 and 29.7% and by 42.2 and 52.7% in the first and second seasons, respectively, compared to control. In addition, the transpiration rate was positively affected since it decreasedby 29 and 38.6% in the first and second seasons, respectively, compared to control. Therefore, combining nano-fertilizers with biochar, and organic matter have a clear synergistic effect on thyme that enhanced it to tolerate salinity and drought stresses.
Due to both cellular dehydration and osmotic stress induced by salinity and drought, water moves from the cytoplasm into the intercellular spaces leading to stomatal closure. As a result, CO2 fixation, transpiration [52], and photosynthesis [53] are negatively affected. These stomatal closure leads to decrease stomatal conductance which reduces the photosynthetic rate and in turn, inhibited growth [11,54]. Salinity and drought enhance oxidative stress that decreases the activity of Ribulose-1,5-bisphosphate carboxylase/oxygenase (Rubisco) leading to an impaired photosynthetic process [55]. In this regard, Isayenkov and Maathuis [56] mentioned that salinity and drought negatively affect plant physiology through damaging vital components in plant cell membranes such as lipids and proteins. Many investigations indicated that relative water content (RWC) can be used to check plant water status under harsh environmental conditions [57]. This is in harmony with the results of the present study (Table 6). In this regard, Rodríguez-Gamir et al. [58] reported that RWC parameter decreased with water deficiency. As a result of what is mentioned in the present results, plants tolerate unfavorable or stressful circumstances through different strategies such as stomatal closure, reduced transpiration, and osmotic adjustment [59].
Due to their unique physicochemical properties in terms of high surface area, mesoporous structure, and high nutrients loading capacity, they can guarantee long-term nutrients supply to plant roots [60]. Even under abiotic stress, nano-fertilizers can increase plant tolerance to drought and salinity. In accordance, Mahmoud and Swaefy [9] mentioned that zeolite enhanced plant height besides plant fresh and dry weight under drought circumstances. Such tolerance is a result of increasing water holding capacity [61], and high salts adsorption [62]. The long-lasting availability of water around the plant root system is due to the extraordinary water attraction of zeolite. Thus, zeolite can absorb water up to 60% of its volume [63]. Additionally, salt removal is governed by adsorption, ion exchange, and salt storage [20]. In this regard, Tripathi et al. [64], and Jullok et al. [65] reported that Si-NPs alleviate the negative physiological effects of abiotic stress on the plants. Kalteh et al. [66] observed that nano-Si might enhance the growth and development of basil under high salinity. Additionally, Gao et al. [67] noticed that silicon applicationincreased leaf number and leaf area in addition to a fresh and dry weight of leaf and roots, due to enhanced photosynthetic activity. Furthermore, DeRosa et al. [68] reported that plant roots absorb nano-silicon forming a layer in the cell wall being responsible for stresses tolerance. In addition, biochar has a porous structure and high adsorption ability [69], which induce high microbial activity in soil [70]. It was found that combining zeolite with biochar can enhance higher microbial activity [71], and in turn better soilquality.

3.2. Nanoparticles EnhancedPhotosynthetic Pigments and Biochemical Contentsof Thyme Plants

Chemical fertilization with organic matter (control) did not suppress the negative effect of salinity and drought stress on chlorophyll, and carotenoids of thyme plants (Table 7). Among the combination treatments, treatment T7, and T5 significantly increased chlorophyll content by73.1 and 69.4%, and by 67.1 and 65%, respectively, in the first and secondseasons compared to control. For carotenoids, the most significant content was achieved by treatments T7, T5, and T6since itincreased by 49.5 and 53.4%, by 48.1 and 51.5%, and by 43.2 and 41.3% in both the first and second seasons, respectively, compared to control treatment. Regarding, other biochemical constituents (soluble sugar, phenols, flavonoids, and proline) showed the opposite effect when nano-fertilizers were applied compared to control treatment. More specifically, soluble sugars significantly increased under control and significantly decreased with the combination treatment (T7). The antioxidants (phenols, flavonoids, and proline) were significantly increased with all nano-zeolite-treated thyme plants (T5 and T7) compared to control.
A similar negative effect of biochemical constituents (soluble sugar, phenols, flavonoids, and proline) on thyme growth and its traits, abiotic stresses also realized negative impacts on both photosystems I and II (PSI and PS II), electron transport chain, and chlorophyll biosynthesis [72]. Drought impairs the thylakoid membraneleading to alteration and reduction in chlorophyll synthesis [73], and in turn, decreasing chlorophyll content [74]. Regarding, the biochemical constituents, many studies confirmed thatplants can tolerate salinity and drought stresses by increasing the accumulation of organic and inorganic osmolytes [75,76]. Hence, adjusting the osmotic gradient and keeping cell turgor to the optimum maintainsproper physiological processes in plant cells [11]. Therefore, increasing both the sugars [9] and proline [77] accumulation under salt and drought stresses is acrucial mechanism for stress plant tolerance. The results in Table 7 showa high accumulation of chlorophyll and carotenoids under T7 treatment which might indicate that the thyme plant was able to tolerate salinity and drought through keeping a protected photosynthetic machinery system. This notable tolerance might be due to the crucial role provided by proline as an osmolyte [78], and by phenol and flavonoids as antioxidants [79]. These molecules exert a direct scavenging system for reactive oxygen species generated due to stress [80]. Additionally, it seems that applying nano-fertilizers (silicon and zeolite) to thyme plants realized a vital role in strengthening the tolerance for salinity and drought (Table 7). In this regard, Song et al. [81] and De Smedt et al. [63] reported that silicon and zeolite nano-fertilizers enhance CO2 assimilation rate and stomatal conductance, resulting in maintaining an efficient photosynthetic rate and pigments accumulation. Additionally, silicon and zeolite guarantee good water and nutrients supply to plants under stress due to their high adsorption property and their physicochemical properties. Therefore, making nitrogen available for plant intake, in turn, enhanced the biosynthesis of chlorophyll, antioxidant enzymes, andother biochemical components in plants [82,83]. So, it can be concluded from Table 7 that the highly accumulated soluble sugars in thyme plant under control treatment indicate that chemical fertilizers in addition to organic matter incorporation did notalleviate salinity and drought stress effects on thyme physiology, and thymeplant tends to accumulate sugars in a way to adjust the osmotic pressure. On the other hand, nano-fertilizers in combination with biochar and organic matter give the thyme plant a high adaptation and tolerance to salinity and drought stresses, which leads to a loweraccumulation of soluble sugars in T7 treatment. Again, these results confirm the positive synergetic effect of combing zeolite and silicon nano-fertilizers with biochar and organic matter in mitigating the effect of drought and salinity on thyme plants.

3.3. Nanoparticles Enhanced Leaf Hormones, and EnzymesActivity of Thyme Plants

Regarding plant hormones and enzymes activity in thyme leaves during the first and second seasons in the control treatment (T1), showed the low synthesis of IAA, and GA3 but high ABA synthesis (Table 8). Additionally, peroxidase and catalase activities were significantly induced among all treatments. The T5 and T7 treatments showed opposite results since they significantly recorded the highest IAA and GA3 synthesis and the lowest ABA synthesis compared to control. In addition, the lowest activities of peroxidase and catalase were significantly recorded, being less with T7 treatment compared to control.
Changed hormonal profile and enzyme activities were also enhanced under abiotic stress along with synthesizing secondary metabolites and accumulation of soluble substances. This is like the results obtained by Cetinkaya et al. [84], who reported that plants tend to follow adaptation strategies with the presence of environmental stresses. The increased ABA accumulation and antioxidant enzymes activities (peroxidase, and catalase) in control treatmentrevealed that thyme plants sufferedfrom salinity and drought stress. Under these stress circumstances, the shortage in water and nutrients supply to the plant resulted in the abscisic acid synthesisof plant roots then transferred to plant leavesleadingtostomatal closure, which led to reduced water loss through transpiration [85]. Therefore, ABA acts as a trigger for plant responses, to salinity and drought stresses, in a way to overcome these unfavorable conditions [86]. Besides ABA, the phytohormones IAA, and GA3 have an integral part in plant responses to abiotic stress [87]. Recently, genetic studies indicated that the expression of several auxin-related genes is altered during abiotic stress response in plants [88,89]. For instance, under salinity and drought conditions, IAA regulates plant root plasticity development and the changes in IAA concentration could be due to changes in shoot-derived long-distance auxin flow as suggested by [90]. Additionally, studying physiological biosynthesis processes such as anabolism, catabolism, transport, and signal transduction of phytohormones [91], indicated the presence of antagonistic and/or synergistic interaction between each other, forming complicated crosstalk networks [92]. Such crosstalk networks introduced an antagonistic interaction between ABA and GA [93]. Additionally, Urano et al. [94] mentioned that GA regulates many physiological processes of plants in response to stress. Regarding enzyme activity, the increased contents of catalase and peroxidase (Table 8) under control treatment reveals a second defense mechanism, antioxidative response, adopted by the thyme plant to overcome the stress factors.In this regard, Garcia-Sanchez et al. [95] and Hussain et al. [96] reported that under drought stress the physiological response of plants tends to synthesize enzymes responsible for reactive oxygen species (ROS) scavenging. On the other hand, treating thyme with nano-fertilizers in addition to biochar and organic matter (Table 8) enhanced thyme’s tolerance to salinity and drought. This is confirmed with the induced accumulation of IAA and GA, and the reduced accumulation of ABA. Additionally, the decrease in catalase and peroxidase indicates the absence of stress-generated ROS. Similarly, Kim et al. [97], and Mahmoud et al. [32] reported a decrease in ABA and an increase in GA3 contents under salt-stressed plants treated with nano-silicon.

3.4. Nanoparticles Enhanced Leaf Endogenous Nutrient Contents of Thyme Plants

Under control treatment in both seasons, all nutrients content except Na decreased in thyme leaves. On the other hand, combiningall used materials improved nutrients content, since T7 treatment was the most significant one compared to control. Treatment T7 in both seasons increased nitrogen and phosphorus nutrients more than onefold, while K and Ca increased by 9.6 and 11.4% and by 24.8 and 32%, respectively, compared to control. For micronutrients, Zn increased by 46.1 and 57.7%, Fe by 19 and 19.4%, and Mn by 49.4 and 33.3% in the first andsecond seasons, respectively, compared to control. Interestingly, treatment T7 decreased Na in thyme leaf by 76 and 69.8% in the first and second seasons, respectively, compared to control.
These results agree with those obtained by Wang et al. [98], who stated that besides the physiological disruption caused by abiotic stress on plants, mineral nutrition, and ion homeostasisare negatively affected. This might be explained by the fact that drought stress reduces water availability in soil and, hence, decreases the available nutrients around the plant root system [99]. In turn, it reduces nutrient concentration in plant tissues. Additionally, drought stress causes membrane damage leading to disrupted ion homeostasis and increasing N nutrient causing a decrease in P nutrient [100]. Regarding salinity, it increases Na+ accumulation, at the expense of K+ and Ca++ leading to ion toxicity and imbalanced nutrients uptake along with disrupted water absorption [46]. These previous studies confirmed what was observed in our results in Table 9.
Thyme plants under control treatment (T1) cannot overcome limited nutrients availability due to abiotic stress. Conversely, applying nano-fertilizers with biochar and organic matter (T7) enhanced nutrients concentration to a higher level. This favorable action is attributed to the high synergistic affinity of nano-zeolite, nano-silicon, and biochar in increasing soil water holding capacity. Additionally, it was noticed a significant reduction in Na concentration to the lowest level. In accordance with the presented results, Mahmoud et al. [32] revealed that the combined application of nanoparticles efficiently increased the concentration of endogenous elements (N, P, K, Ca, Zn, and B). Gong et al. [101] and Abdi et al. [102] indicated that zeolite and silicon activated the plant growth-related enzymes and reduced Na+ toxicity under salinity stress. Furthermore, Morales-Díaz et al. [103] demonstrated the vital role of zeolite, upon incorporation with macroand micro-nutrients, in reducing nutrients deficiencies in the soil. Additionally, the increased endogenous nutrients concentration in T7-treatment (Table 9) due to nano-fertilizers application, could be explained on the basics of nano-fertilizers appear to have an effective role in enhancing root growth leading to increased nutrients uptake [104], reducing soil absorption to some nutrients such as phosphorus, and controlling stomatal closureand transpiration leading to increased nutrient uptake by plant roots [105]. Moreover, nano-fertilizers encourage nitrogen metabolism by reducing nitrate reductase activity and enhancing nitrogen fixation by microorganisms [106]. Specifically, silicon under salinity stress enhances root activity in addition to controlling chlorine uptake, which on the other hand stimulates the promotion of increased nitrogen and phosphorous uptake [107]. In addition, zeolite induces soil nutrients retention besides increasing water availability around the root system under abiotic stress [108]. Al-Busaidi et al. [109] illustrated the increased concentration of macro and micro-nutrients under salinity stress due to zeolite application. Finally, it is obvious that combined nano-fertilizers with biochar and organic matter positively affect soil nutrients availability and nutrients uptake by the thyme root system, leading to vigorous plant growth and development under salinity and drought stress.

3.5. Nanoparticles Enhanced Hydrocarbons and Oxygenated Compounds in Thyme Plant

As presented in Table 10 totalhydrocarbons and oxygenated compounds contents in the thyme plant were negatively affected by drought and salinity stress under control treatment (T1). While treatment T7 recorded the highest total hydrocarbons and oxygenated compounds contents among all treatments. Since total hydrocarbons increased by 34.5 and 66% and by 57.8 and 52.3% for oxygenated compounds in the first and second season, respectively, compared to control. During both seasons two opposite trends were observed. The first one is that total hydrocarbons decreased in the second season compared to the first season due to the application of T1, T2, and T3 by 13.4, 6.17, and 5.8%, respectively. The second one is that total hydrocarbons increased in the 2nd season compared to the first season due to the application of T4, T5, T6, and T7 by 2.3, 10.3, 6.8 and 6.8%, respectively. Furthermore, total oxygenated compounds increased under all treatments in first season compared to the second one. Moreover, the highest content of hydrocarbons (cineol and ß-pinene) was obtained with T4 and T1, respectively. Additionally, the highest content of limonene, α-pinene was obtained with T7. For oxygenated compounds, T7 recorded the highest content for all compounds, except α-Terpineole, with an increment range of 14.6–433.3% in first season, and by 98.9% in the second season compared to control. The highest content of α-Terpineole was obtained using T3 compared to control.
Data in Table 10 show that the oil composition of thyme under abiotic stress was positively affected by incorporating nano-zeolite and nano-silicon amendments with biochar and organic matter (T7). Regarding the chemical classification of thyme, traditionally, thyme oil can be classified into phenolic (hydrocarbon) and non-phenolic (oxygenated) compounds [110]. Unfavorable environmental conditions lead to a change oil composition of thyme. Accordingly, abiotic stress can change the quality and quantity of essential oils. In this regard, Hay [111] reported that Salvia sp. would produce high-quality oils only under stressful conditions (high temperature, drought, low fertility). Additionally, Farahani et al. [112] reported that drought stress decreases essential oil content due to the stress-induced decrement in shoot biomass. Accordingly, drought stress has a remarkable effect on the chemical profile and yield of thyme essential oil [113]. For instance, under stress, 1,8-cineole and oxygenated sesquiterpenes in Eucalyptus camaldulensis increased while non-oxygenated monoterpenes decreased [114]. Ozturk et al. [115] reported that the essential oil ratio was affected positively by increasing the water deficit where the oil ratio increased from 0.12 to 0.16%. Qualitative and quantitative significant changes in essential oil profiles due to water deficit have been also found in other studies concerning phenolic Thymus daenensis, Thymus caramanicus, and other species such as Cymbopogon nardus or Salvia officinalis [116].

4. Conclusions

It was evident from the present study that applying nanoparticles (nano-silicon and nano-zeolite) ameliorates the negative effects of salinity and drought in addition to improving soil physical properties and its fertility. Additionally, a significant synergistic effect was observed when combining nano-zeolite and nano-silicon with biochar and organic matter. This synergetic effect significantly increased water holding capacity and water use efficiency in addition to the long-lasting release of nutrients around the thyme root system under abiotic stress (salt and drought). Consequently, this combination significantly boosted water retention and nutrients as well as induced enzymatic antioxidant activities in thyme plants causing great tolerance for salinity and drought. Eventually, thyme growth and development, yield, and oil in addition to photosynthetic activity were maximized. Another vital achievement of this study is the enhanced synthesis of various pharmaceutically important hydrocarbons and oxygenated compounds in salt and drought-stressed thyme. The possible scientific basis of how the combined nano-fertilizer treatments might be due to promoting plant tolerance to salinity and drought stresses. Such an effective approach is therefore presented as a possible sustainable solution to face the increasing soil salinity and drought problems due to climatic change throughout the world. Further long-term studies on thyme and other medicinal plants are recommended to show the relationship between nanoparticle dose and ecological impact.

Author Contributions

A.W.M.M. and S.E.A.E. conceived the experiments and methodology; A.W.M.M., S.E.A.E., A.B.E.-A., E.Z.O. and R.M.E.-B. performed the experiments, measurements, and analyses required; A.W.M.M., S.E.A.E. and A.B.E.-A. curated and analyzed the data; A.W.M.M., R.M.E.-B. and E.Z.O. wrote the manuscript draft; R.M.E.-B. and E.Z.O. reviewed, edited, and completed the manuscript; A.W.M.M. supervised the whole work. All authors have read and agreed to the published version of the manuscript.

Funding

This research was funded by Cairo University, Faculty of Agriculture, Giza, Egypt.

Institutional Review Board Statement

Not applicable.

Informed Consent Statement

Not applicable.

Data Availability Statement

Not applicable.

Acknowledgments

The authors are grateful to the department of botany, plant physiology section and ornamental department at the Faculty of Agriculture, Cairo University for providing facilities and equipment to finalize this work.

Conflicts of Interest

The authors declare no conflict of interest.

References

  1. Stahl-Biskup, E.; Venskutonis, R.P. Thyme. In Handbook of Herbs and Spices; Elsevier: Boca Raton, FL, USA, 2004; Volume 2, pp. 297–321. ISBN 9781855738355. [Google Scholar]
  2. Arzani, H.; Motamedi, A. Chemical compounds of Thyme as a medicinal herb in the mountainous areas of Iran. J. Nutr. Disord. Ther. 2013, 12, 003. [Google Scholar] [CrossRef] [Green Version]
  3. Fraire-Velázquez, S.; Balderas-Hernández, V.E. Abiotic stress in plants and metabolic responses. In Abiotic Stress-Plant Responses and Applications in Agriculture; Vahdati, K., Leslie, C., Eds.; InTech: London, UK, 2013; pp. 25–48. [Google Scholar] [CrossRef] [Green Version]
  4. Zhang, J.; Jia, W.; Yang, J.; Ismail, A.M. Role of ABA in integrating plant responses to drought and salt stresses. Field Crops Res. 2006, 97, 111–119. [Google Scholar] [CrossRef]
  5. Roy, S.J.; Negrao, S.; Tester, M. Salt resistant crop plants. Curr. Opin. Biotechnol. 2014, 26, 115–124. [Google Scholar] [CrossRef] [PubMed]
  6. Ruan, C.J.; Ja, T.D.S. Metabolomics: Creating new potentials for unraveling the mechanisms in response to salt and drought stress and for the biotechnological improvement of xerohalophytes. Crit. Rev. Biotechnol. 2011, 31, 153–169. [Google Scholar] [CrossRef]
  7. Jalili Marandi, R. Environmental Stress Physiologyand Mechanisms of Resistance in Horticultural Plants; Jahad University Press: Urumie, Iran, 2010; p. 636. [Google Scholar]
  8. De Magalhães Erismann, N.; Machado, E.C.; Tucci, M.L.S.A. Photosynthetic limitation by CO2 diffusion in drought stressed orange leaves on three rootstocks. Photosynth. Res. 2008, 96, 163–172. [Google Scholar] [CrossRef]
  9. Mahmoud, A.W.M.; Swaefy, H.M. Comparison between commercial and nano NPK in presence of nano zeolite on sage plant yield and its components under water stress. Agriculture 2020, 66, 24–39. [Google Scholar] [CrossRef]
  10. Hasani, A.; Beygi, R.O. Effects of water stress on some morphological, physiological, and metabolic characteristics of basil plant. J. Agric. Sci. 2002, 12, 47–59. [Google Scholar]
  11. Mahmoud, A.W.M.; Samy, M.M.; Sany, H.; Eid, R.R.; Rashad, H.M.; Abdeldaym, E.A. Nanopotassium, nanosilicon, and biochar applications improve potato salt tolerance by modulating photosynthesis, water status, and biochemical constituents. Sustainability 2022, 14, 723. [Google Scholar] [CrossRef]
  12. Shang, Y.; Hasan, M.; Ahammed, G.J.; Li, M.; Yin, H.; Zhou, J. Applications of nanotechnology in plant growth and crop protection: A review. Molecules 2019, 24, 2558. [Google Scholar] [CrossRef] [Green Version]
  13. Hassan, A.Z.A.; Mahmoud, A.W.M.; Turky, G.M.; Safwat, G. Rice husk derived biochar as smart material loading nano nutrients and microorganisms. Bulg. J. Agric. Sci. 2020, 26, 309–322. [Google Scholar]
  14. Adisa, I.O.; Pullagurala, V.L.R.; Peralta-Videa, J.R.; Dimkpa, C.O.; Elmer, W.H.; Gardea-Torresdey, J.; White, J. Recent advances in nano-enabled fertilizers and pesticides: A critical review of mechanisms of action. Environ. Sci. Nano 2019, 6, 2002–2030. [Google Scholar] [CrossRef]
  15. Manjunatha, S.B.; Biradar, D.P.; Aladakatti, Y.R. Nanotechnology and its applications in agriculture: A review. J. Farm. Sci. 2016, 29, 1–3. [Google Scholar]
  16. Zulfiqar, F.; Navarro, M.; Ashraf, M.; Akram, N.A.; Munné-Bosch, S. Nanofertilizer use for sustainable agriculture: Advantages and limitations. Plant Sci. 2019, 289, 110270. [Google Scholar] [CrossRef] [PubMed]
  17. Abdel-Haliem, M.E.F.; Hegazy, H.S.; Hassan, N.S.; Naguib, D.M. Effect of silica ions and nano silica on rice plants under salinity stress. Ecol. Eng. 2017, 99, 282–289. [Google Scholar] [CrossRef]
  18. Rastogi, A.; Tripathi, D.K.; Yadav, S.; Chauhan, D.K.; Živčák, M.; Ghorbanpour, M.; El-Sheery, N.I.; Brestic, M. Application of silicon nanoparticles in agriculture. 3 Biotech 2019, 9, 90. [Google Scholar] [CrossRef] [Green Version]
  19. Colombani, N.; Mastrocicco, M.; Giambastiani, B.M.S. Predicting salinization trends in a lowland coastal aquifer: Comacchio (Italy). Water Resour. Manag. 2015, 29, 603–618. [Google Scholar] [CrossRef]
  20. Wen, J.; Dong, H.; Zeng, G. Application of zeolite in removing salinity/sodicity from wastewater: A review of mechanisms, challenges and opportunities. J. Clean. Prod. 2018, 197, 1435–1446. [Google Scholar] [CrossRef]
  21. Richards, L.S. Diagnosis and Improvement of Saline and Alkaline Soils; Handbook; U.S. Department of Agriculture: Washington, DC, USA, 1954; p. 60.
  22. Jackson, M.L. Soil Chemical Analysis; Text book; Printice-Hall of India, Privat Limited: New Delhi, India, 1973; Volume 144–197, p. 381. [Google Scholar]
  23. Karmeli, D.; Keller, J. Trickle Irrigation Design; Rain-Bird Sprinkler Mfg. Co.: Glendora, CA, USA, 1975. [Google Scholar] [CrossRef]
  24. Stenhagen, S.; Abrahamson, E.; MacLafferty, F.W. Registry of Mass Spectral Data; Wiley & Sons: New York, NY, USA, 1974. [Google Scholar]
  25. Sadtler, R. The Sadtler Standard Gas Chromatography Retention Index Library; Sadtler Research Laboratories: Philadelphia, PA, USA, 1986; Volume 4. [Google Scholar]
  26. Kinney, T.J.; Masiello, C.A.; Dugan, B.; Hockaday, W.C.; Dean, M.R.; Zygourakis, K.; Barnes, R.T. Hydrologic properties of biochars produced at different temperatures. Biomass Bioenergy 2012, 41, 34–43. [Google Scholar] [CrossRef]
  27. Mahmoud, A.W.M.; El-Attar, A.B.; Esmail, S.E.A.; Sany, H. Boosting biochemical composition of stevia plant using biochar loaded with beneficial microorganism strains. Bulg. J. Agric. Sci. 2020, 26, 748–760. [Google Scholar]
  28. Hassan, A.Z.A.; Mahmoud, A.W.M. Hydrothermal synthesis of nano crystals (AM) zeolite using variable temperature programs. J. Nanomater. Mol. Nanotechnol. 2015, 4, 7–8. [Google Scholar] [CrossRef]
  29. Li, J.; Wee, C.; Sohn, B. Effect of ammonium- and potassium-loaded zeolite on kale, growth and soil property. Am. J. Plant Sci. 2013, 4, 1976–1982. [Google Scholar] [CrossRef] [Green Version]
  30. Helrich, K. Official Methods of Analysis of the Association of Official Analytical Chemists; Association of Official Analytical Chemists: Arlington, VA, USA, 1990. [Google Scholar]
  31. Zhu, Y.; Gong, H. Beneficial effects of silicon on salt and drought tolerance in plants. Agron. Sustain. Dev. 2014, 34, 455–472. [Google Scholar] [CrossRef] [Green Version]
  32. Mahmoud, A.W.M.; Abdeldaym, E.A.; Abdelaziz, S.M.; El-Sawy, M.B.I.; Mottaleb, S.A. Synergetic effects of zinc, boron, silicon, and zeolite nanoparticles on confer tolerance in potato plants subjected to salinity. Agronomy 2020, 10, 19. [Google Scholar] [CrossRef] [Green Version]
  33. Lugojan, C.; Ciulca, S. Evaluation of relative water content in winter wheat. Hortic. For. Biotechnol. 2011, 15, 173–177. [Google Scholar]
  34. Moran, R. Formulae for determination of chlorophyllous pigments extracted with N,N-dimethylformamide. Plant Physiol. 1982, 69, 1376–1381. [Google Scholar] [CrossRef] [PubMed] [Green Version]
  35. Singleton, V.L.; Rossi, J.A., Jr. Colorimetry of total phenolics with phosphomolybdic-phosphotungstic acid reagents. Am. J. Enol. Vitic. 1965, 16, 144–158. [Google Scholar]
  36. Meda, A.; Lamien, C.E.; Romito, M.; Millogo, J.; Nacoulma, O.G. Determination of the total phenolic, flavonoid and proline contents in Burkina Fasan honey, as well as their radical scavenging activity. Food Chem. 2005, 91, 571–577. [Google Scholar] [CrossRef]
  37. Bates, L.S.; Waldren, R.P.; Teare, I.K. Rapid determination of free proline for waterstress studies. Plant Soil 1973, 39, 205–208. [Google Scholar] [CrossRef]
  38. Sheligel, H.Q. Die verwertungorgngischersourendurch chlorella lincht. Planta J. 1986, 12, 47–51. [Google Scholar]
  39. Fales, H.M.; Jaouni, T.M.; Babashak, J.F. Simple device for preparing ethereal diazomethane without resorting to codistillation. Anal. Chem. 1973, 45, 2302–2303. [Google Scholar] [CrossRef]
  40. Vogel, A.I. A Text Book of Practical Organic Chemistry, 3rd ed.; English Language Book Society and Longman Growth Ltd.: London, UK, 1975; pp. 197–596. [Google Scholar]
  41. Polle, A.; Otter, T.; Mehne-Jakobs, B. Effect of magnesium deficiency on antioxidative systems in needles of Norway spruce [Piceaabies (L.) Karst.] grown with different ratios of nitrate and ammonium as nitrogen sources. New Phytol. 1994, 128, 621–628. [Google Scholar] [CrossRef]
  42. Aebi, H. Catalase in vitro. Methods Enzym. 1984, 105, 121–126. [Google Scholar] [CrossRef]
  43. Nakano, Y.; Asada, K. Hydrogen-peroxide is scavenged by ascorbate-specific peroxidase in spinach-chloroplasts. Plant Cell Physiol. 1981, 22, 867–880. [Google Scholar] [CrossRef]
  44. Duncan, P.B. New multiple range and multiple F-tests biometrics. Biometrics 1955, 11, 1–42. [Google Scholar] [CrossRef]
  45. Mikhak, A.; Sohrabi, A.; Kassaee, M.Z.; Feizian, M. Synthetic nanozeolite/nanohydroxyapatite as a phosphorus fertilizer for German chamomile (Matricaria chamomilla L.). Ind. Crops Prod. 2017, 95, 444–452. [Google Scholar] [CrossRef]
  46. Acosta-Motos, J.R.; Ortuño, M.F.; Bernal-Vicente, A.; Diaz-Vivancos, P.; Sanchez-Blanco, M.J.; Hernandez, J.A. Plant responses to salt stress: Adaptive mechanisms. Agronomy 2017, 7, 18. [Google Scholar] [CrossRef] [Green Version]
  47. Gulzar, S.; Khan, M.A.; Ungar, I.A. Salt tolerance of a coastal salt marsh grass. Commun. Soil Sci. Plant Anal. 2003, 34, 2595–2605. [Google Scholar] [CrossRef]
  48. Rengasamy, P.; Olsson, K.A. Irrigation and sodicity. Aust. J. Soil Res. 1993, 31, 821–837. [Google Scholar] [CrossRef]
  49. Khoshsokhan, F.; Babalar, M.; Chaghazardi, H.R.; Fatahi Moghadam, M.R. Effect of salinity and drought stress on germination in thymeeffect of salinity and drought stress on germination indices of two Thymus species. Cercetări agronomice în Moldova 2012, 1, 27–35. [Google Scholar] [CrossRef] [Green Version]
  50. Nayyar, H.; Gupta, D. Differential sensitivity of C3 and C4 plants to water deficit stress: Association with oxidative stress and antioxidants. Environ. Exp. Bot. 2006, 58, 106–113. [Google Scholar] [CrossRef]
  51. Semerci, A.; Cicek, N.; Karahan, F.A.; Özyürek, E.; Arici, Y.K.; Ekmekci, Y. Some growth and chlorophyll fluorescence parameters of black and hybrid poplar clones under water stress. Turk. J. Agric. For. 2017, 41, 348–356. [Google Scholar] [CrossRef]
  52. Pedroso, F.K.J.V.; Prudente, D.A.; Carolina, A.; Bueno, R.; Machado, E.C.; Ribeiro, R.V. Drought tolerance in citrus trees is enhanced by rootstock-dependent changes in root growth and carbohydrate availability. Environ. Exp. Bot. 2014, 101, 26–35. [Google Scholar] [CrossRef]
  53. Flexas, J.; Bota, J.; Loreto, F.; Cornic, G.; Sharkey, T. Diffusive and metabolic limitations to photosynthesis under drought and salinity in c3 plants. Plant Biol. 2004, 6, 269–279. [Google Scholar] [CrossRef] [PubMed]
  54. Mazher, A.M.A.; El-Quesni, E.M.F.; Farahat, M.M. Responses of ornamental plants and woody trees to salinity. World J. Agric. Sci. 2007, 3, 386–395. [Google Scholar]
  55. Kohli, S.K.; Handa, N.; Sharma, A.; Kumar, V.; Kaur, P.; Bhardwaj, R. Synergistic effect of 24-epibrassinolide and salicylic acid on photosynthetic efficiency and gene expression in Brassica juncea L. under Pb stress. Turk. J. Biol. 2017, 41, 943–953. [Google Scholar] [CrossRef]
  56. Isayenkov, S.V.; Maathuis, F.J.M. Plant salinity stress: Many unanswered questions remain. Front. Plant Sci. 2019, 10, 80. [Google Scholar] [CrossRef] [Green Version]
  57. Bielsa, B.; Hewitt, S.; Reyes-Chin-Wo, S.; Dhingra, A.; Rubio-Cabetas, M.J. Identification of water use efficiency related genes in ‘Garnem’ almond-peach rootstock using time-course transcriptome analysis. PLoS ONE 2018, 13, e0205493. [Google Scholar] [CrossRef]
  58. Rodríguez-Gamir, J.; Primo-Millo, E.; Forner, J.B.; Forner-Giner, M.A. Citrus rootstock responses to water stress. Sci. Hortic. 2010, 126, 95–102. [Google Scholar] [CrossRef]
  59. Sharma, A.; Shahzad, B.; Kumar, V.; Kohli, S.K.; Sidhu, G.P.S.; Bali, A.S.; Handa, N.; Kapoor, D.; Bhardwaj, R.; Zheng, B. Phytohormones regulate accumulation of osmolytes under abiotic stress. Biomolecules 2019, 9, 285. [Google Scholar] [CrossRef] [Green Version]
  60. Thirunavukkarasu, M.; Subramanian, K. Surface modified nano-zeolite used as carrier for slow release of sulphur. J. Nat. Appl. Sci. 2014, 6, 19–26. [Google Scholar] [CrossRef]
  61. Moreno, J.L.; Ondoño, S.; Torres, I.; Bastida, F. Compost, leonardite, and zeolite impacts on soil microbial community under barley crops. J. Soil Sci. Plant Nutr. 2017, 17, 214–230. [Google Scholar] [CrossRef] [Green Version]
  62. Wu, Q.; Chi, D.; Xia, G.; Chen, T.; Sun, Y.; Song, Y. Effects of zeolite on drought resistance and water–nitrogen use efficiency in paddy rice. J. Irrig. Drain. Eng. 2019, 145, 04019024. [Google Scholar] [CrossRef]
  63. De Smedt, C.; Steppe, K.; Spanoghe, P. Beneficial effects of zeolites on plant photosynthesis. Adv. Mater. 2017, 2, 1–11. [Google Scholar] [CrossRef] [Green Version]
  64. Tripathi, D.K.; Singh, V.P.; Kumar, D.; Chauhan, D.K. Impact of exogenous silicon addition on chromium uptake, growth, mineral elements, oxidative stress, antioxidant capacity, and leaf and root structures in rice seedlings exposed to hexavalent chromium. Acta Physiol. Plant. 2012, 34, 279–289. [Google Scholar] [CrossRef]
  65. Jullok, N.; Van Hooghten, R.; Luis, P.; Volodin, A.; Van Haesendonck, C.; Vermant, J.; Van der Bruggen, B. Effect of silica nanoparticles in mixed matrix membranes for pervaporation dehydration of acetic acid aqueous solution: Plant-inspired dewatering systems. J. Clean. Prod. 2016, 112, 4879–4889. [Google Scholar] [CrossRef]
  66. Kalteh, M.; Alipour, Z.T.; Ashraf, S.; Aliabadi, M.M.; Nosratabadi, A.F. Effect of silica nanoparticles on basil (Ocimumbasilicum) under salinity stress. J. Chem. Health Risks 2014, 4, 49–55. [Google Scholar] [CrossRef]
  67. Gao, X.; Zou, C.; Wang, L.; Zhang, F. Silicon decreases transpiration rate and conductance from stomata of maize plants. J. Plant. Nutr. 2006, 29, 1637–1647. [Google Scholar] [CrossRef]
  68. DeRosa, M.C.; Monreal, C.; Schnitzer, M.; Walsh, R.; Sultan, Y. Nanotechnology in fertilizers. Nat. Nanotechnol. 2010, 5, 91. [Google Scholar] [CrossRef]
  69. Xiao, R.; Awasthi, M.K.; Li, R.; Park, J.; Pensky, S.M.; Wang, Q.; Wang, J.J.; Zhang, Z. Recent developments in biochar utilization as an additive in organic solid waste composting: A review. Bioresour. Technol. 2017, 246, 203–213. [Google Scholar] [CrossRef]
  70. Sánchez-García, M.; Alburquerque, J.A.; Sánchez-Monedero, M.A.; Roig, A.; Cayuela, M.L. Biochar accelerates organic matter degradation and enhances N mineralisation during composting of poultry manure without a relevant impact on gas emissions. Bioresour. Technol. 2015, 192, 272–279. [Google Scholar] [CrossRef]
  71. Awasthi, M.K.; Wang, M.; Pandey, A.; Chen, H.; Awasthi, S.K.; Wang, Q.; Ren, X.; Lahori, A.H.; Li, D.S.; Li, R.; et al. Heterogeneity of zeolite combined with biochar properties as a function of sewage sludge composting and production of nutrient-rich compost. Waste Manag. 2017, 68, 760–773. [Google Scholar] [CrossRef] [PubMed]
  72. Kalaji, M.H.; Jajoo, A.; Oukarroum, A.; Brestic, M.; Zivcak, M.; Samborska, I.A.; Cetner, M.D.; Łukasik, I.; Goltsev, V.; Ladle, R.J. Chlorophyll a fluorescence as a tool to monitor physiological status of plants under abiotic stress conditions. Acta Physiol. Plant. 2016, 38, 102. [Google Scholar] [CrossRef] [Green Version]
  73. Bertioli, D.J.; Cannon, S.B.; Froenicke, L.; Huang, G.; Farmer, A.D.; Cannon, E.K.S.; Liu, X.; Gao, D.; Clevenger, J.; Dash, S.; et al. The genome sequences of Arachis duranensis and Arachis ipaensis, the diploid ancestors of cultivated peanut. Nat. Genet. 2016, 48, 438–446. [Google Scholar] [CrossRef] [PubMed]
  74. Demmig-Adams, B.; Jared, J.; Stewart, I.D.; Christopher, R.; Adams, W. Optimization of photosynthetic productivity in contrasting environments by regulons controlling plant form and function. Int. J. Mol. Sci. 2018, 19, 872. [Google Scholar] [CrossRef] [Green Version]
  75. Cha-Um, S.; Kirdmanee, C. Effect of salt stress on proline accumulation, photosynthetic ability and growth characters in two maize cultivars. Pak. J. Bot. 2009, 41, 87–98. [Google Scholar]
  76. Turner, N.C.; Abbo, S.; Berger, J.D.; Chaturvedi, S.K.; French, R.J.; Ludwig, C.; Mannur, D.M.; Singh, S.J.; Yadava, H.S. Osmotic adjustment in chickpea (Cicer arietinum L.) results in no yield benefit under terminal drought. J. Exp. Bot. 2007, 58, 187–194. [Google Scholar] [CrossRef] [Green Version]
  77. Babaee, K.; Dehaghi, M.A.; ModaresSanavi, S.A.M.; Jabbari, R. Water deficit effect on morphology, proline content and thymol percentage of Thyme (Thymus vulgaris L.). Iran. J. Med. Aromat. Plants Res. 2010, 26, 239–251. [Google Scholar] [CrossRef]
  78. Szabados, L.; Savouré, A. Proline: A multifunctional amino acid. Trends Plant Sci. 2010, 15, 89–97. [Google Scholar] [CrossRef]
  79. Al Hassan, M.; Fuertes, M.M.; Ramos Sánchez, F.J.; Vicente, O.; Boscaiu, M. Effects of salt and water stress on plant growth and on accumulation of osmolytes and antioxidant compounds in cherry tomato. Not. Bot. Horti Agrobot. 2015, 43, 1–11. [Google Scholar] [CrossRef]
  80. Treml, J.; Šmejkal, K. Flavonoids as potent scavengers of hydroxyl radicals. Compr. Rev. Food Sci. Food Saf. 2016, 15, 720–738. [Google Scholar] [CrossRef]
  81. Song, A.; Li, P.; Fan, F.; Li, Z.; Liang, Y. The effect of silicon on photosynthesis and expression of its relevant genes in rice (Oryza sativa L.) under high-zinc stress. PLoS ONE 2014, 9, e113782. [Google Scholar] [CrossRef] [PubMed]
  82. Kong, L.; Wang, M.; Bi, D. Selenium modulates the activities of antioxidant enzymes, osmotic homeostasis and promotes the growth of sorrel seedlings under salt stress. Plant Growth Regul. 2005, 45, 155–163. [Google Scholar] [CrossRef]
  83. Abou-Baker, N.H.; Ibrahim, E.A.; Abd-Eladl, M.M. Biozeolite for improving bean production under abiotic stress conditions. Bull. Transilv. Univ. Brasov. For. Wood Ind. Agric. Food Eng. Ser. II 2017, 10, 31–46. [Google Scholar]
  84. Cetinkaya, H.; Kulak, M.; Karaman, M.; Karaman, H.S.; Kocer, F. Flavonoid accumulation behavior in response to the abiotic stress: Can a uniform mechanism be illustrated for all plants. In Flavonoids—From Biosynthesis to Human Health; Intechopen: London, UK, 2017. [Google Scholar] [CrossRef] [Green Version]
  85. Nakashima, K.; Ito, Y.; Yamaguchi-Shinozaki, K. Transcriptional regulatory networks in response to abiotic stresses in Arabidopsis and grasses. Plant Physiol. 2009, 149, 88–95. [Google Scholar] [CrossRef] [Green Version]
  86. Zhu, Y.; Wang, B.; Tang, K.; Hsu, C.C.; Xie, S.; Du, H.; Yang, Y.; Tao, W.A.; Zhu, J.K. An Arabidopsis nucleoporin NUP85 modulates plant responses to ABA and salt stress. PLoS Genet. 2017, 13, e1007124. [Google Scholar] [CrossRef] [Green Version]
  87. Sharma, E.; Sharma, R.; Borah, P.; Jain, M.; Khurana, J.P. Emerging roles of auxin in abiotic stress responses. In Elucidation of Abiotic Stress Signaling in Plants: Functional Genomics Perspectives; Pandey, G.K., Ed.; Springer: New York, NY, USA, 2015; pp. 299–328. [Google Scholar] [CrossRef]
  88. Song, Y.; Wang, L.; Xiong, L. Comprehensive expression profiling analysis of OsIAA gene family in developmental processes and in response to phytohormone and stress treatments. Planta 2009, 229, 577–591. [Google Scholar] [CrossRef]
  89. Yuan, H.; Zhao, K.; Lei, H.; Shen, X.; Liu, Y.; Liao, X.; Li, T. Genome-wide analysis of the GH3 family in apple (Malus× domestica). BMC Genom. 2013, 14, 297. [Google Scholar] [CrossRef] [Green Version]
  90. Korver, R.A.; Koevoets, I.T.; Testerink, C. Out of shape during stress: A key role for auxin. Trends Plant Sci. 2018, 23, 783–793. [Google Scholar] [CrossRef]
  91. Novák, O.; Napier, R.; Ljung, K. Zooming in on plant hormone analysis: Tissue- and cell-specific approaches. Annu. Rev. Entomol. 2017, 68, 323–348. [Google Scholar] [CrossRef]
  92. Shan, X.Y.; Yan, J.B.; Xie, D.X. Comparison of phytohormone signaling mechanisms. Curr. Opin. Plant Biol. 2012, 15, 84–91. [Google Scholar] [CrossRef]
  93. Shu, K.; Chen, Q.; Wu, Y.; Liu, R.; Zhang, H.; Wang, P.; Li, Y.; Wang, S.; Tang, S.; Liu, C.; et al. ABI4 mediates antagonistic effects of abscisic acid and gibberellins at transcript and protein levels. Plant J. 2016, 85, 348–361. [Google Scholar] [CrossRef] [PubMed] [Green Version]
  94. Urano, K.; Maruyama, K.; Jikumaru, Y.; Kamiya, Y.; Yamaguchi-Shinozaki, K.; Shinozaki, K. Analysis of plant hormone profiles in response to moderate dehydration stress. Plant J. 2017, 90, 17–36. [Google Scholar] [CrossRef] [PubMed]
  95. Garcia-Sanchez, F.; Syvertsen, J.P.; Gimeno, V.; Botia, P.; Perez-Perez, J.G. Responses to flooding and drought stress by two citrus rootstock seedlings with different water-use efficiency. Biol. Plant 2007, 130, 532–542. [Google Scholar] [CrossRef]
  96. Hussain, S.; Khalid, M.F.; Saqib, M.; Ahmad, S.; Zafar, W.; Rao, M.J.; Morillon, R.; Anjum, M.A. Drought tolerance in citrus rootstocks is associated with better antioxidant defense mechanism. Acta Physiol. Plant. 2018, 40, 135. [Google Scholar] [CrossRef]
  97. Kim, Y.H.; Khan, A.L.; Kim, D.H.; Lee, S.Y.; Kim, K.M.; Waqas, M.; Jung, H.Y.; Shin, J.H.; Kim, J.G.; Lee, I.J. Silicon mitigates heavy metal stress by regulating P-type heavy metal ATPases, oryza sativa low silicon genes, and endogenous phytohormones. BMC Plant Biol. 2014, 14, 13. [Google Scholar] [CrossRef] [Green Version]
  98. Wang, W.; Vinocur, B.; Altman, A. Plant responses to drought; salinity and extreme temperatures: Towards genetic engineering for stress tolerance. Planta 2003, 218, 1–14. [Google Scholar] [CrossRef]
  99. Reddy, A.R.; Chaitanya, K.V.; Vivekanandan, M. Drought-induced responses of photosynthesis and antioxidant metabolism in higher plants. J. Plant Physiol. 2004, 161, 1189–1202. [Google Scholar] [CrossRef]
  100. Lisar, S.Y.S.; Motafakkerazad, R.; Hossain, M.M.; Rahman, I.M.M. Water stress in plants: Causes, effects and responses. In Water Stress; Rahman, M., Hasegawa, H., Eds.; InTech: Rijeka, Croatia, 2012. [Google Scholar] [CrossRef] [Green Version]
  101. Gong, H.J.; Randall, D.P.; Flowers, T.J. Silicon deposition in the root reduces sodium uptake in rice (Oryza sativa L.) seedlings by reducing bypass flow. Plant Cell Environ. 2006, 29, 1970–1979. [Google Scholar] [CrossRef]
  102. Abdi, G.; Salehi, H.; Eshghi, S. Effect of natural zeolite and paclobutrazol on reducing salt stress in Kentucky bluegrass (Poa pratensis L.). Hortic. Environ. Biotechnol. 2010, 51, 159–166. [Google Scholar]
  103. Morales-Díaz, A.B.; Ortega-Ortíz, H.; Juárez-Maldonado, A.; Cadenas-Pliego, G.; González-Morales, S.; Benavides-Mendoza, A. Application of nanoelements in plant nutrition and its impact in ecosystems. Adv. Nat. Sci. Nanosci. Nanotechnol. 2017, 8, 013001. [Google Scholar] [CrossRef]
  104. Mahmoud, A.W.M.; Abdelaziz, S.M.; El-mogy, M.M.; Abdeldaym, E.A. Effect of foliar ZnO and FeOnanoparticles application on growth and nutritional quality of red radish and assessment of their accumulation on human health. Agriculture 2019, 65, 16–29. [Google Scholar] [CrossRef] [Green Version]
  105. Mehrabanjoubani, P.; Abdolzadeh, A.; Sadeghipour, H.R.; Aghdasi, M. Impacts of silicon nutrition on growth and nutrient status of rice plants grown under varying zinc regimes. Theor. Exp. Plant Physiol. 2015, 27, 19–29. [Google Scholar] [CrossRef]
  106. Bolanos, L.; Lukaszewski, K.; Bonilla, I.; Blevins, D. Why boron? Plant Physiol. Biochem. 2004, 42, 907–912. [Google Scholar] [CrossRef] [PubMed]
  107. Liang, Y.C.; Ding, R.X.; Liu, Q. Effects of silicon on salt tolerance of barley and its mechanism. Sci. Agric. Sin. 1999, 32, 75–83. [Google Scholar]
  108. Noori, M.; Zendehdel, M.; Ahmadi, A. Using natural zeolite for the improvement of soil salinity and crop yield. Toxicol. Environ. Chem. 2006, 88, 77–84. [Google Scholar] [CrossRef]
  109. Al-Busaidi, A.; Yamamoto, T.; Inoue, M.; Eneji, A.E.; Mori, Y.; Irshad, M. Effects of zeolite on soil nutrients and growth of barley following irrigation with saline water. J. Plant. Nutr. 2008, 31, 1159–1173. [Google Scholar] [CrossRef]
  110. Kulevanova, S.; Ristić, M.; Stafilov, T.; Dorevski, K.; Ristov, T. Essential oil analysis of some taxa of genera Thymus L.—Environment influences. Bull. Chem. Technol. Maced. 1996, 15, 33–38. [Google Scholar]
  111. Hay, R.K.M. Phenology and ontogeny. In Volatile Oil Crops: Their Biology, Biochemistry and Production; Longman Scientific and Technical: London, UK, 1993. [Google Scholar]
  112. Farahani, H.A.; Valadabadi, S.A.; Daneshian, J.; Khalvati, M.A. Evaluation changing of essential oil of balm (Melissa officinalis L.) under water deficit stress conditions. J. Med. Plants Res. 2009, 3, 329–333. [Google Scholar]
  113. Bahreininejad, B.; Razmjoo, J.; Mirza, M. Effect of water stress on productivity and essential oil content and composition of Thymus carmanicus. J. Essent. Oil Bear. Plants 2014, 17, 717–725. [Google Scholar] [CrossRef]
  114. Leicach, S.R.; Garau, A.M.; Guarnaschelli, A.B.; Yaber Grass, M.A.; Sztarker, N.D.; Dato, A. Changes in Eucalyptus camaldulensis essential oil composition as response to drought preconditioning. J. Plant Interact. 2010, 5, 205–210. [Google Scholar] [CrossRef]
  115. Ozturk, A.; Unlukara, A.; Ipek, A.; Gurbuz, B. Effects of salt stress and water deficit on plant growth and essential oil content of lemon balm (Melissa officinalis L.). Pak. J. Bot. 2004, 36, 787–792. [Google Scholar]
  116. Sharafzadeh, S.; Zare, M. Effect of drought stress on qualitative and quantitative characteristics of some medicinal plants from Lamiaceae family: A review. Adv. Environ. Biol. 2011, 5, 2058–2062. [Google Scholar]
Figure 1. Zeolite nanoparticles.
Agronomy 12 01069 g001
Figure 2. Silicon nanoparticles.
Agronomy 12 01069 g002
Table 1. Initial soil chemical analysis of the experimental site before treatment application.
ParametersSoil Depth [cm]
0–3030–60
Particle-size distribution [%]
Sand90.1090.00
Silt6.906.50
Clay3.003.50
Textural classSandSand
Saturation water content [cm3 cm−3]0.3850.396
Field capacity [cm3cm−3]0.2130.218
Permanent wilting point [cm3cm−3]0.0570.057
Available water [cm3.cm−3]0.1560.161
Bulk density [mg m−3]1.641.65
Saturated hydraulic conductivity, [m day−1]2.402.34
Organic matter [%]0.310.25
Calcium carbonates [%]4.803.71
pH (1:1 soil: water suspension)7.707.81
EC(1:1 soil: water extract) [dSm−1]4.024.13
Soluble ions [meq/100]
Ca2+13.8513.41
Mg2+12.1510.59
Na+8.1010.25
K+6.006.05
CO32−--
HCO311.929.75
Cl14.0010.50
SO42−15.0821.30
Available nutrients [mg Kg−1 soil]
N16.2113.12
P7.786.21
K46.5045.89
Fe9.2012.00
Mn1.631.50
Cu2.101.15
Zn2.001.61
B0.230.21
Table 2. Chemical properties of applied organic matter (compost).
PropertyValue
Moisture content [%]25
pH [1:5]7.5
EC (1:5 extract) [dS m−1]3.1
Organic matter [%]70
Organic-C [%]33.11
Total-N [%]1.82
C/N ratio14:1
Total-K [%]1.25
Total-P [%]1.29
Fe [ppm]1019
Mn [ppm]111
Cu [ppm]180
Zn [ppm]280
Total content of Bacteria [CFU.g−1]2.5 × 10⁷
Phosphate-dissolving Bacteria [CFU.g−1]2.5 × 10⁶
Weed seeds0
Organic matter (plant residues from legumes and Gramineae corps), at the rate of 2.1 t\ha−1, was incorporated into the soil 15 days before planting.
Table 3. Chemical compositions of prepared rice husk-derived biochar.
PropertyRice Husk-Derived Biochar
Si (mg/kg)179
Ca (mg/kg)213
K (mg/kg)199
Mg (mg/kg)179
Moisture content (%)3.88
Ash (%)47.90
pH7.65
Fixed C (mg/kg)46.35
H (mg/kg)2.64
N (mg/kg) as N2O after inoculation2.4
N (mg/kg) after soaking in ammonium sulfate3.65
Sulfate (mg/kg)0.22
Oxygen (mg/kg)2.74
H:C0.05
C:N (after inoculation by a microorganism)18.85
C:N (after soaking in ammonium sulfate)12.92
EC (dS/m)0.14
Zeta potential (mV)−26.6
Table 4. Chemical composition of Nano-Zeolite after loaded nitrogen.
Chemical Composition (%)SiO2TiO2Al2O3Fe2O3FeOMnOMgOCaONa2OK2OSrOP2O3N
45.502.8113.305.408.310.516.309.522.830.870.220.672.70
Trace Elements (ppm)BaCoCrSeCuZnZrNbNiRbY
101.2350.8196425713551522
Table 5. Effect of nanoparticles on growth parameters and thymeyield during 2020 and 2021 growing seasons.
TreatmentPlant Height (cm)Lateral Branches Number/PlantShoot F.W. (g.)Shoot D.W. (g.)Root F.W. (g.)Root D.W. (g.)YieldF.W. (kg\fed.)
1st2nd1st2nd1st2nd1st2nd1st2nd1st2nd1st2nd
T1
(NPK+ O)
17.7 e18.8 d13.0 c14.7 d34.5 d35.8 d10.6 d11.5 e23.5 d25.0 d8.7 f10.6 e418.5 e442.5 e
T2(NPK+nS+O)19.8 d20.3 c15.2 c 18.2 c36.8 c38.6 c12.8 c13.5 d26.8 c28.8 c12.5 d15.2 c521.1 d561.6 d
T3
(BC+O)
19.5 d18.8 d14.9 c 16.6 c36.1 c38.1 c12.1 c12.7 d25.6 d26.2 d10.8 e12.4 d473.6 e500.7 d
T4
(nS+O)
18.6 d17.8 d17.8 b20.0 b37.5 c39.2 c12.1 c13.5 d28.1 c29.6 c15.1 c15.4 c548.0 d577.3 d
T5(nZ+nS+O)23.1 b25.7 b20.5 a23.3 b43.8 b45.2 b16.2 a16.6 b30.1 b33.5 b17.5 b18.1 b708.5 b783.2 b
T6(BC+nS +O)21.2 c23.0 c18.8 b21.5 b 40.5 b43.7 b14.2 b15.0 c28.7 c30.3 c15.3 c16.7 c670.4 c695.8 c
T7(nZ+BC+nS+O)25.6 a29.4 a22.4 a25.5 a47.3 a50.5 a17.8 a19.7 a35.6 a38.3 a19.4 a21.3 a875.3 a921.5 a
Means with the same letters in a column are not significantly different by DMRT 5%. 1st = first season, 2nd = second season.
Table 6. Effect of nanoparticles on thyme photosynthetic parameters and oil yield during 2020 and 2021 growing seasons.
TreatmentLeaf Water Content (%)Photosynthesis Rate (µmol m−2s−1)Intercellular CO2 Concentration (ppm)Transpiration Rate (mmol m−2s−1)Water Use Efficiency (μmol mmol−1)Oil Yield (L\fed.)
1st2nd1st2nd1st2nd1st2nd1st2nd1st2nd
T1
(NPK+O)
65.96 c66.11 b15.87 d17.82 d92.5 f89.6 g4.39 a5.11 a3.61 d3.48 d2.3 d3.6 d
T2(NPK+nS+O)67.55 b67.32 b17.08 d19.13 c98.3e 100.2 f3.65 b3.72 c4.67 c5.14 b4.8 c5.4 c
T3(BC+O)66.78 c66.13 b18.25 c20.16 b112.5 d114.1 e4.17 a4.52 b4.37 c4.46 c4.3 c5.0 c
T4
(nS+O)
67.95 b66.51 b18.29 c20.07 b115.3 d118.5 d3.38 b3.72 c5.41 b5.39 b4.5 c5.0 c
T5(nZ+nS+O)70.89 b70.12 a19.48 b21.14 b126.7 b130.25 b3.26 b3.29 c5.97 b6.42 a5.6 b6.1 b
T6(BC+nS+O)68.81 b66.93 b19.09 b20.15 b119.4 c122.6 c4.11 a4.17 b4.64 c4.83 c5.2 b5.8 c
T7(nZ+BC+nS+O)74.53 a71.31 a21.61 a23.11 a131.5 a136.8 a3.12 b3.14 c6.92 a7.35 a6.4 a7.3 a
Means with the same letters in a column are not significantly different by DMRT 5%. 1st = first season, 2nd = second season.
Table 7. Effect of nanoparticles on photosynthetic pigments and biochemical contents of thyme plant during 2020 and 2021 growing seasons.
TreatmentTotal Chlorophyll (mg/g FW.)Carotenoids (mg/g FW.)Soluble Sugar (mg/g DW.)Total Phenols (mg Catechin/g DW.)Total Flavonoids (μg CE/g.)Proline Content Leaves (mg g−1)
1st2nd1st2nd1st2nd1st2nd1st2nd1st2nd
T1
(NPK+O)
3.01 c3.14 d2.87 c3.05 b66.42 a68.37 a36.2 b37.2 c0.31 c0.33 c3.89 c3.95 c
T2(NPK+nS+O)3.71 c4.08 b3.58 b3.66 b55.11 b54.83 c38.1 b40.3 b0.35 b0.37 b4.22 b4.25 b
T3
(BC+O)
3.15 c3.42 c3.06 b3.28 b61.25 a62.04 b36.8 b38.5 b0.33 c0.36 b4.06 b4.12 b
T4
(nS+O)
4.11 b4.47 b3.56 b3.72 b50.18 c51.09 c37.0 b38.7 b0.38 b 0.37 b4.51 b4.58 b
T5(nZ+nS+O)5.03 a5.18 a4.25 a4.62 a47.31 d58.45 b40.3 a41.7 b0.43 a0.42 a5.09 a5.13 a
T6(BC+nS+O)4.24 b4.50 b4.11 a4.31 a51.36 c52.26 c37.2 b39.5 b0.41 a0.40 a4.68 b4.77 b
T7(nZ+BC+nS+O)5.21 a5.32 a4.29 a4.68 a43.69 d45.81 d42.5 a44.7 a0.45 a0.44 a5.36 a5.12 a
Means with the same letters in a column are not significantly different by DMRT 5%. 1st = first season, 2nd = second season.
Table 8. Effect of nanoparticles on leaf hormones and enzymes activity of thyme plant during 2020 and 2021 growing seasons.
TreatmentIAA
(µg/g F.W.)
GA3
(µg/g F.W.)
ABA
(µg/g F.W.)
Peroxidase
(Unit/mg Protein)
Catalase
(Unit/mg Protein)
1st2nd1st2nd1st2nd1st2nd1st2nd
T1 (NPK+O)15.272 d14.829 d45.717 c48.096 c14.019 a14.704 a0.118 a0.124 a57.46 a56.96 a
T2 (NPK+nS+O)17.309 c15.616 d52.801 b 51.903 c13.022 a10.801 c0.061 b0.060 b48.81 b50.39 b
T3 (BC+O)18.371 c18.552 c53.078 b 49.661 c11.077 b10.969 c0.109 a0.116 a54.27 a56.18 a
T4 (nS+O)20.771 b22.407 b55.802 b59.470 b13.791 a12.303 b0.043 c0.045 c38.28 c40.08 c
T5 (nZ+nS+O)26.113 a27.491 a61.507 a66.418 a9.460 c 9.710 c0.033 d0.030 d27.84 d30.11 d
T6 (BC+nS+O)22.758 b22.918 b57.416 b60.382 b11.502 b11.779 b0.042 c0.040 c37.61 c36.44 c
T7 (nZ+BC+nS+O)26.417 a28.682 a65.827 a68.339 a8.413 c8.863 d0.025 e0.023 e22.53 e20.71 e
Means with the same letters in a column are not significantly different by DMRT 5%. 1st = first season, 2nd = second season.
Table 9. Effect of nanoparticle on leaf endogenous nutrients contents of thyme plant during 2020 and 2021 growing seasons.
TreatmentN (%)P (%)K (%)Ca (%)Mg (%)Na (%)Zn
(ppm)
Fe
(ppm)
Mn
(ppm)
1st2nd1st2nd1st2nd1st2nd1st2nd1st2nd1st2nd1st2nd1st2nd
T11.05 d1.13 e0.19 e0.22 e2.18 d2.20 d1.33 e1.35 e0.27 d0.30 d1.75 a1.82 a15.41 d16.05 c146.7 d148.5 d12.57 d14.19 c
T21.18 c1.26 d0.25 c0.29 c2.23 b2.26 c1.45 d1.49 d0.31 c0.33 c1.34 c1.51 c17.88 c17.92 c151.2 c150.3 d13.17 c15.05 b
T31.17 c1.25 d0.20 d0.24 d2.20 c2.22 d1.46 d1.48 d0.28 d0.31 c1.62 b1.66 b17.05 c15.14 d153.5 c155.4 c13.06 c14.11 c
T41.20 b1.54 c0.25 c0.28 c2.22 c2.25 c1.45 d1.51 c0.33 c0.36 b0.70 d0.75 d18.87 b20.11 b160.3 b164.6 b14.56 c16.27 b
T51.35 b1.92 b0.31 b0.35 b2.25 b2.31 b1.48 c1.53 c0.37 b0.40 a0.59 e0.63 e22.06 a23.10 a170.1 a173.4 a17.53 a18.21 a
T61.23 b1.56 c0.28 c0.32 b2.24 b2.29 b1.50 b1.59 b0.35 c0.38 b0.71 d0.76 d19.12 b21.15 b165.5 b167.8 b16.44 b18.15 a
T72.11 a2.50 a0.46 a0.49 a2.39 a2.45 a1.66 a1.78 a0.39 a0.42 a0.42 f0.55 f22.51 a25.31 a174.6 a177.3 a18.78 a18.92 a
Means with the same letters in a column are not significantly different by DMRT 5%. 1st = first season, 2nd = second season.
Table 10. Effect of nanoparticles on hydrocarbons and oxygenated compounds in thyme plant during 2020 and 2021 growing seasons.
TreatmentT1T2T3T4T5T6T7
1st2nd1st2nd1st2nd1st2nd1st2nd1st2nd1st2nd
Hydrocarbons
Cineol0.510.460.380.340.370.410.620.570.330.360.360.320.350.33
Limonene18.0715.3920.4119.2221.1619.4416.7317.2922.1824.6222.0423.7125.4127.33
α-Pinene1.141.091.321.201.111.351.151.111.411.401.321.361.511.55
ß-Pinene1.191.161.050.970.520.610.330.300.640.700.320.290.850.81
Total20.9118.1023.1621.7323.1621.8118.8319.2724.5627.0824.0425.6828.1230.02
Oxygenated compound
Linalool1.641.71.241.220.720.770.680.651.711.691.451.371.882.09
Boreniol0.240.270.330.390.260.300.280.360.730.851.010.871.281.34
Methyl-chavicol2.112.632.222.374.022.864.114.162.542.613.102.552.782.74
Thymol32.7135.1139.0841.1337.2640.5126.8829.6542.3141.1437.2839.4850.8953.27
α-Terpineole0.330.380.490.522.192.431.031.110.890.821.121.161.091.18
Carvacrol0.810.920.880.971.021.111.271.311.421.451.141.171.791.83
Total37.8441.0144.2446.645.4747.9834.2537.2449.6048.5645.1046.0659.7162.45
1st = first season, 2nd = second season.
Publisher’s Note: MDPI stays neutral with regard to jurisdictional claims in published maps and institutional affiliations.

