
Mobile Computing for Pest and Disease Management Using Spectral Signature Analysis: A Review

 , ,
, ,
Abstract
:1. Introduction
2. Mobile Application for Pest and Disease Management
2.1. Role of Mobile Applications in Monitoring Pest and Disease
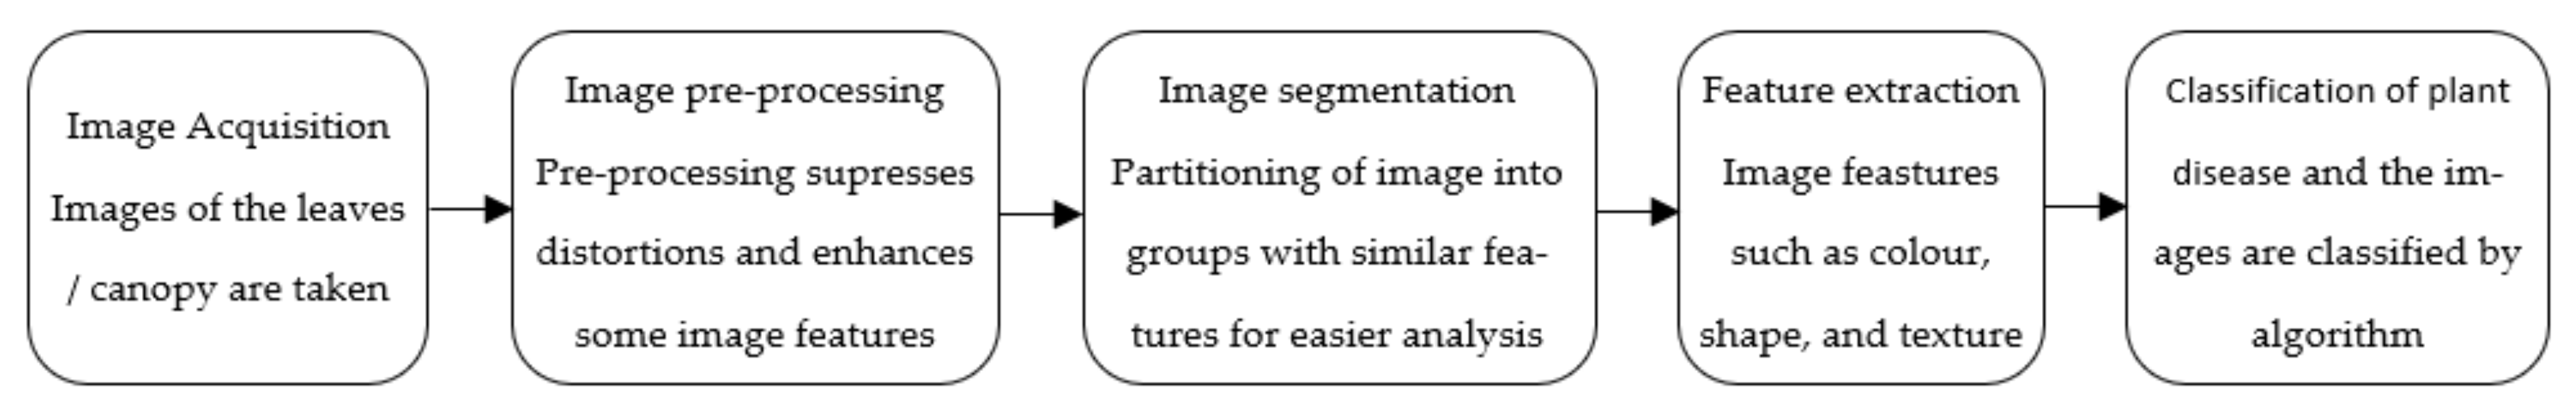
2.2. Image Processing for Pest and Disease Monitoring Using the Mobile Application
2.3. Systems for Extraction of Disease Using the Mobile Application
3. Spectral Signature Analysis for Pest and Disease Management
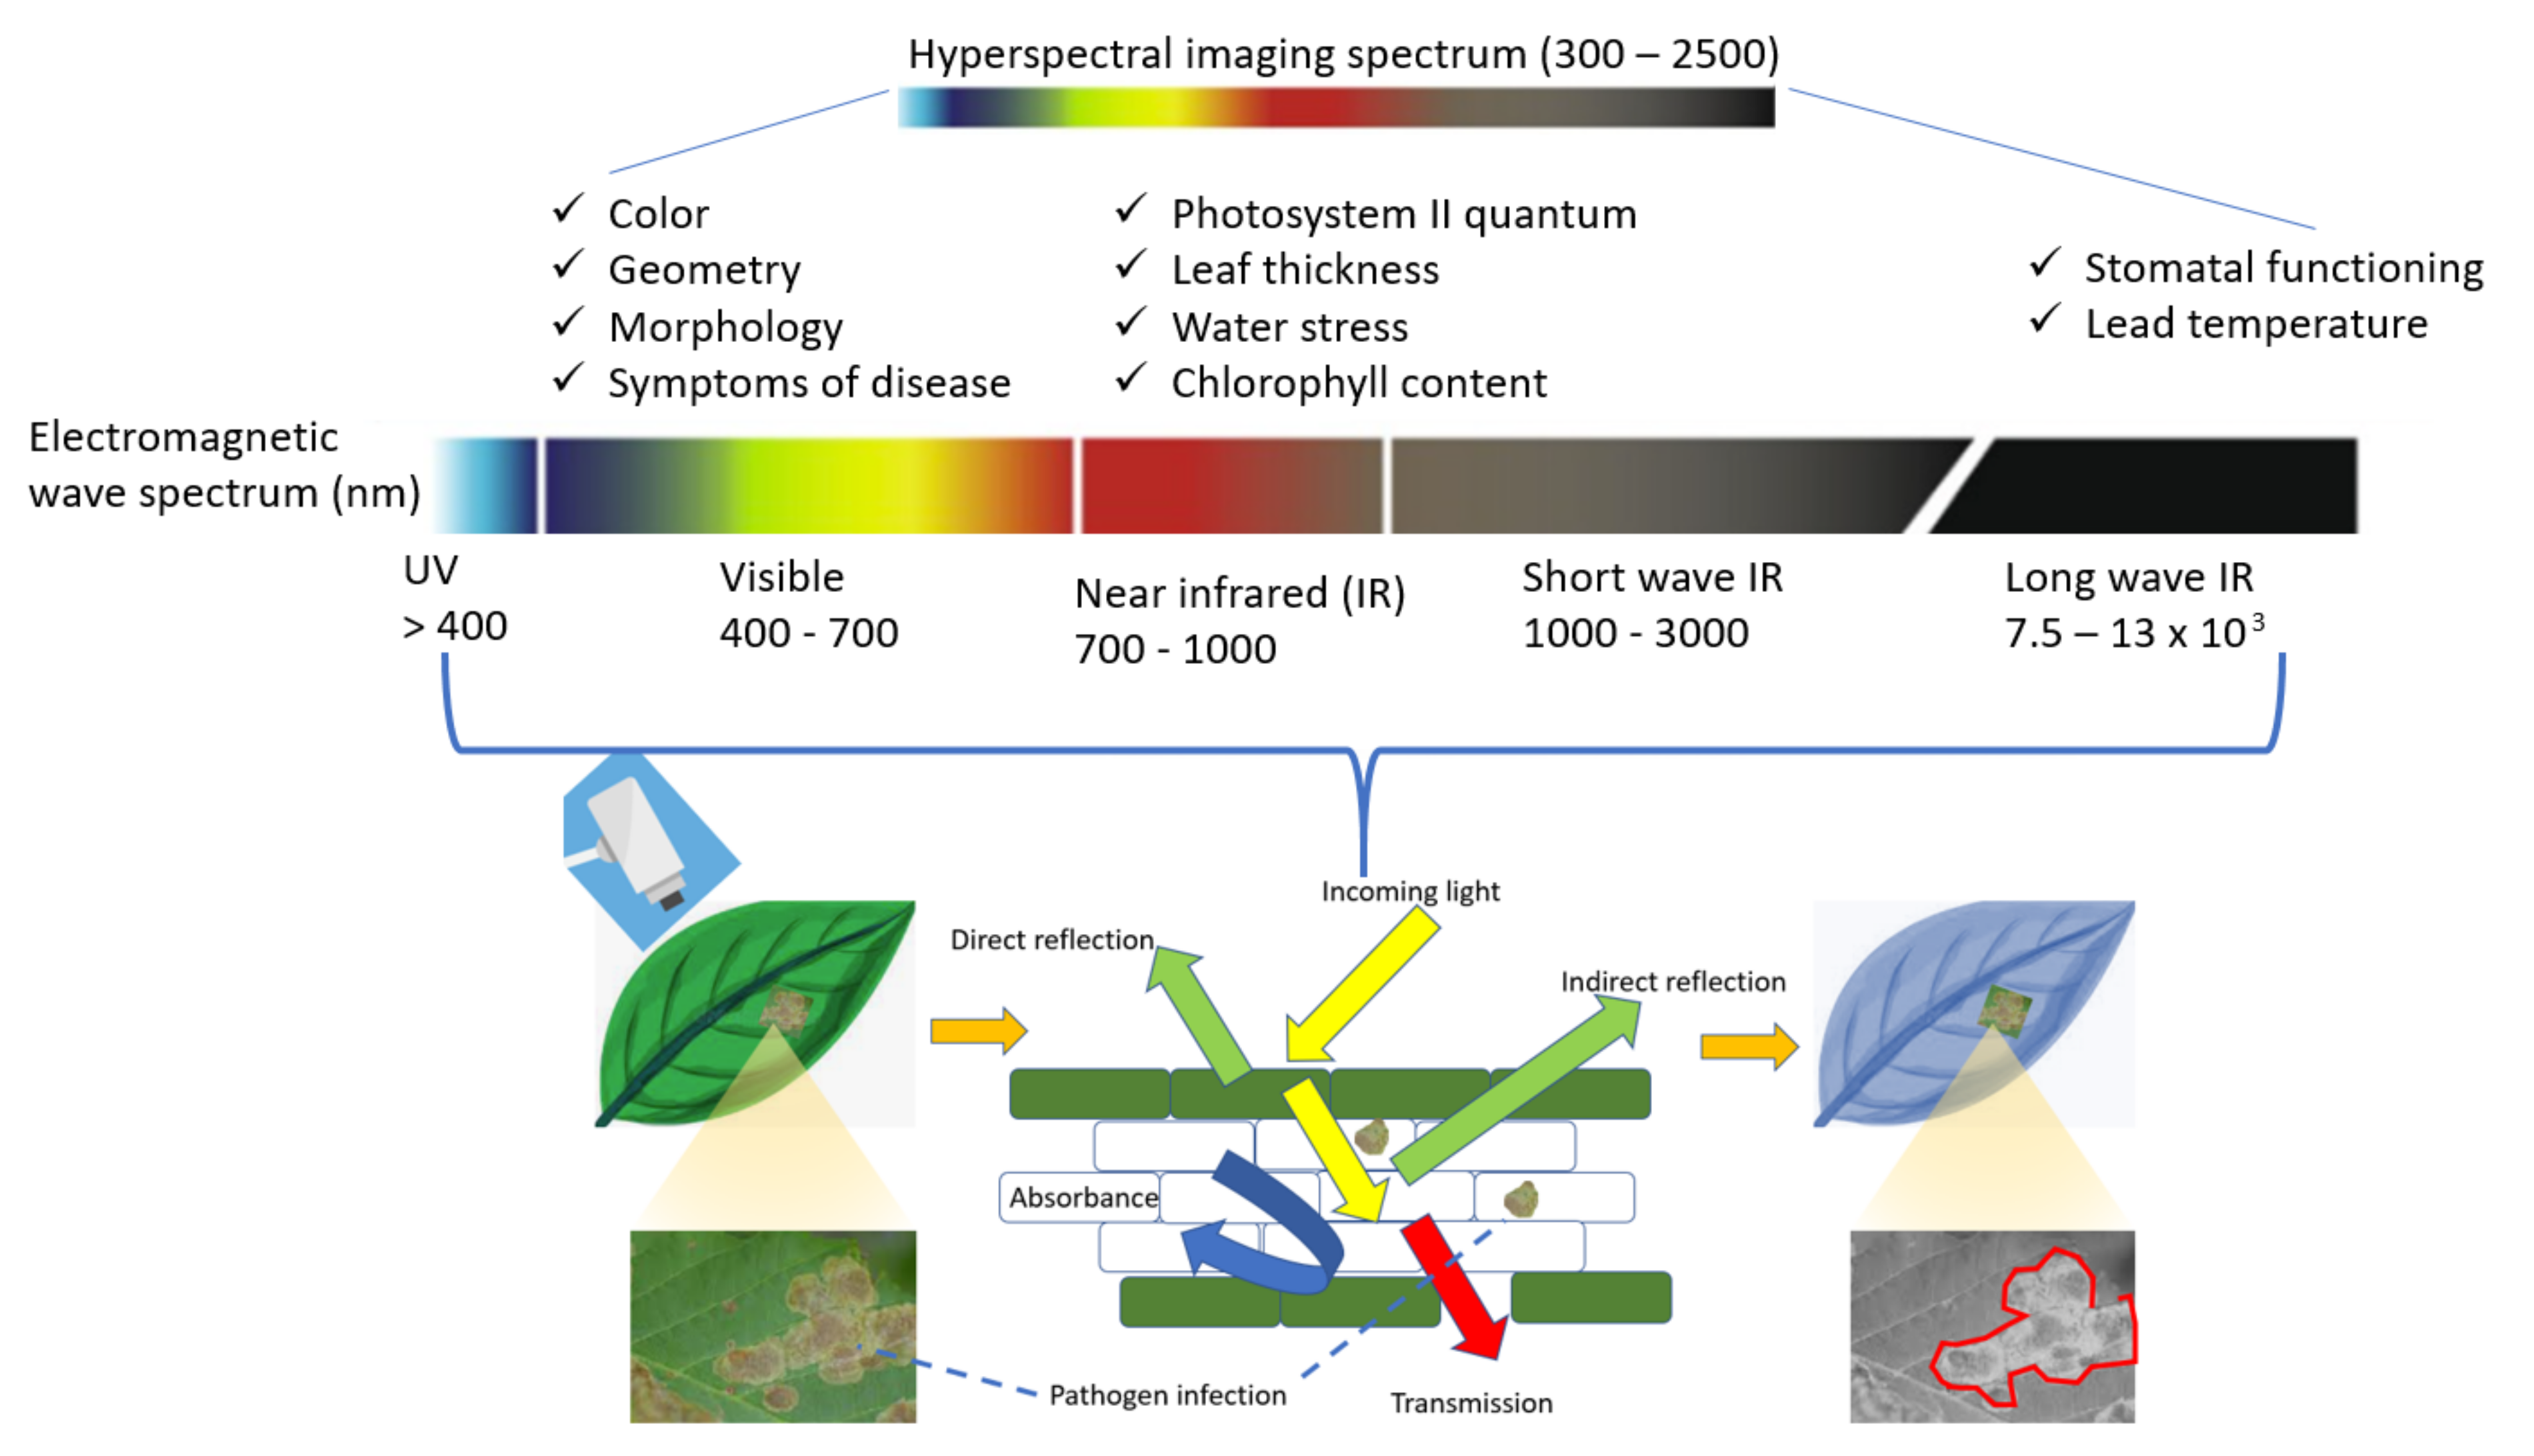
3.1. Spectral Reflectance in Monitoring Plant Health
3.2. Spectral Signature of Pest and Diseases in the Crop Field
3.3. Image Processing for Pest and Disease Diagnosis Based on Spectral Signature
4. The Linkage between the Development of the Mobile Application for Spectral Signature Analysis in Pest and Disease Management
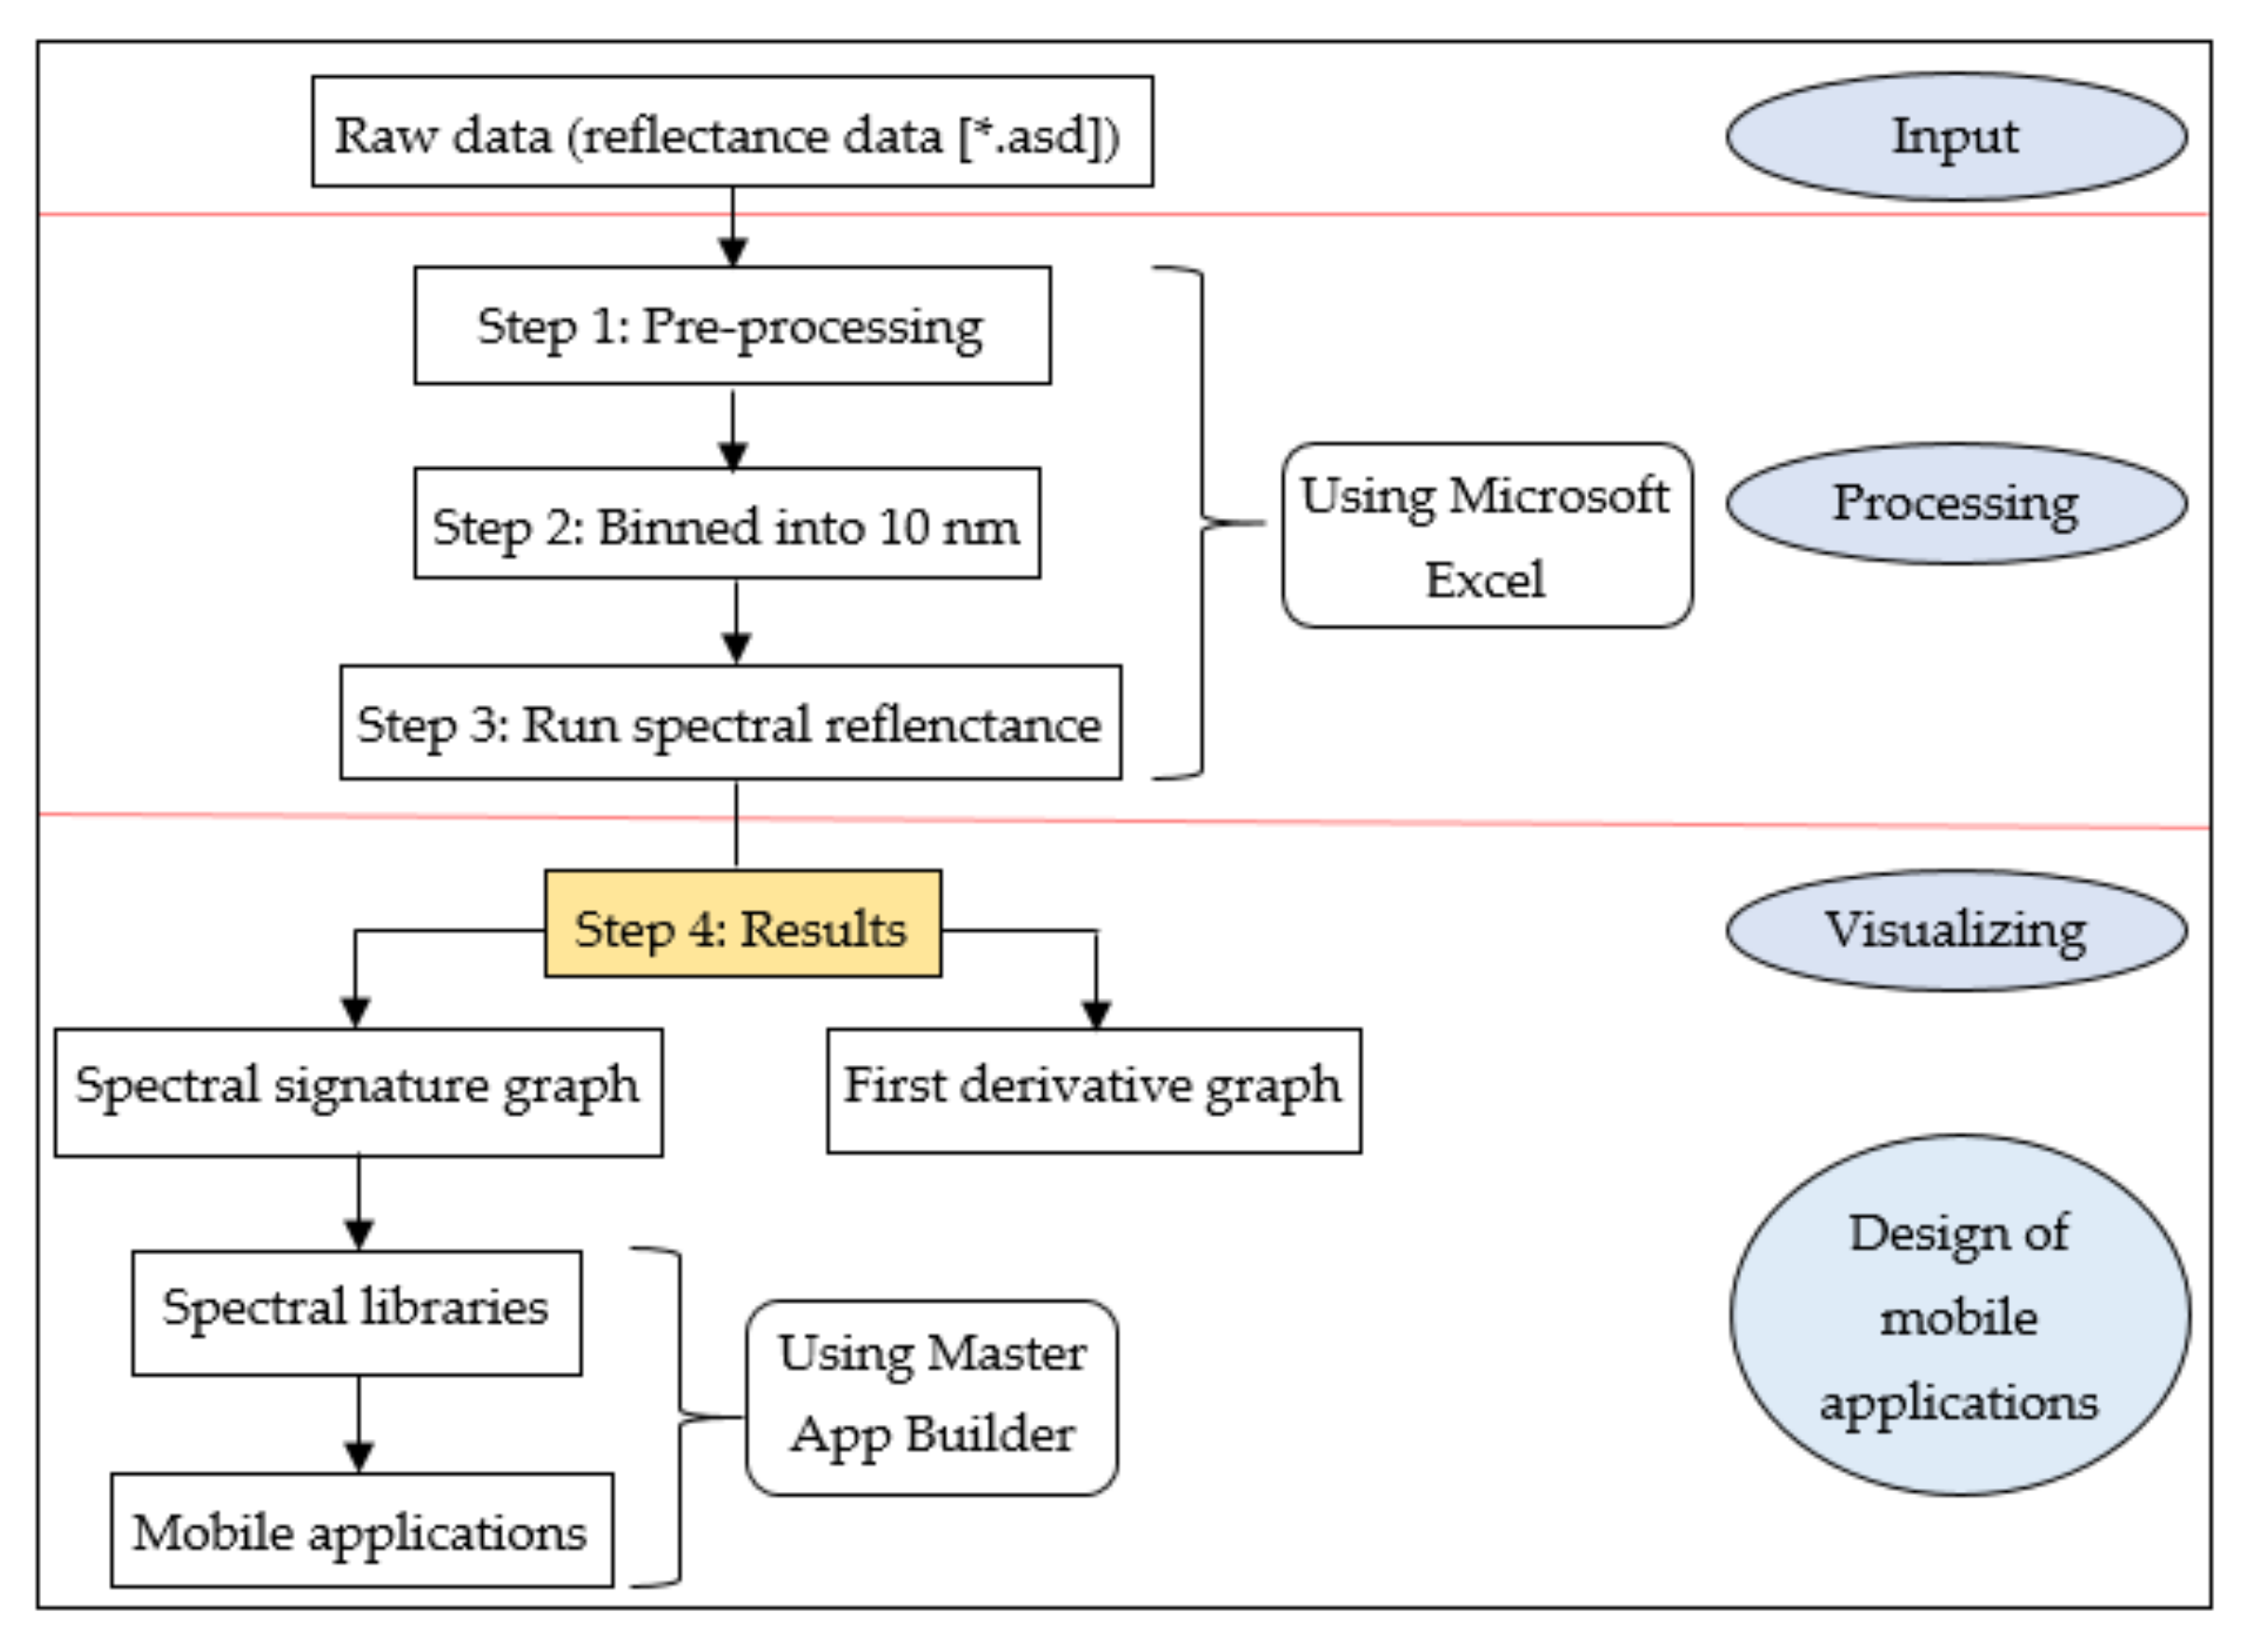
5. Structure of Steps in Developing a Mobile Application That Can Incorporate Spectral Signature Analysis for Pest and Disease Management
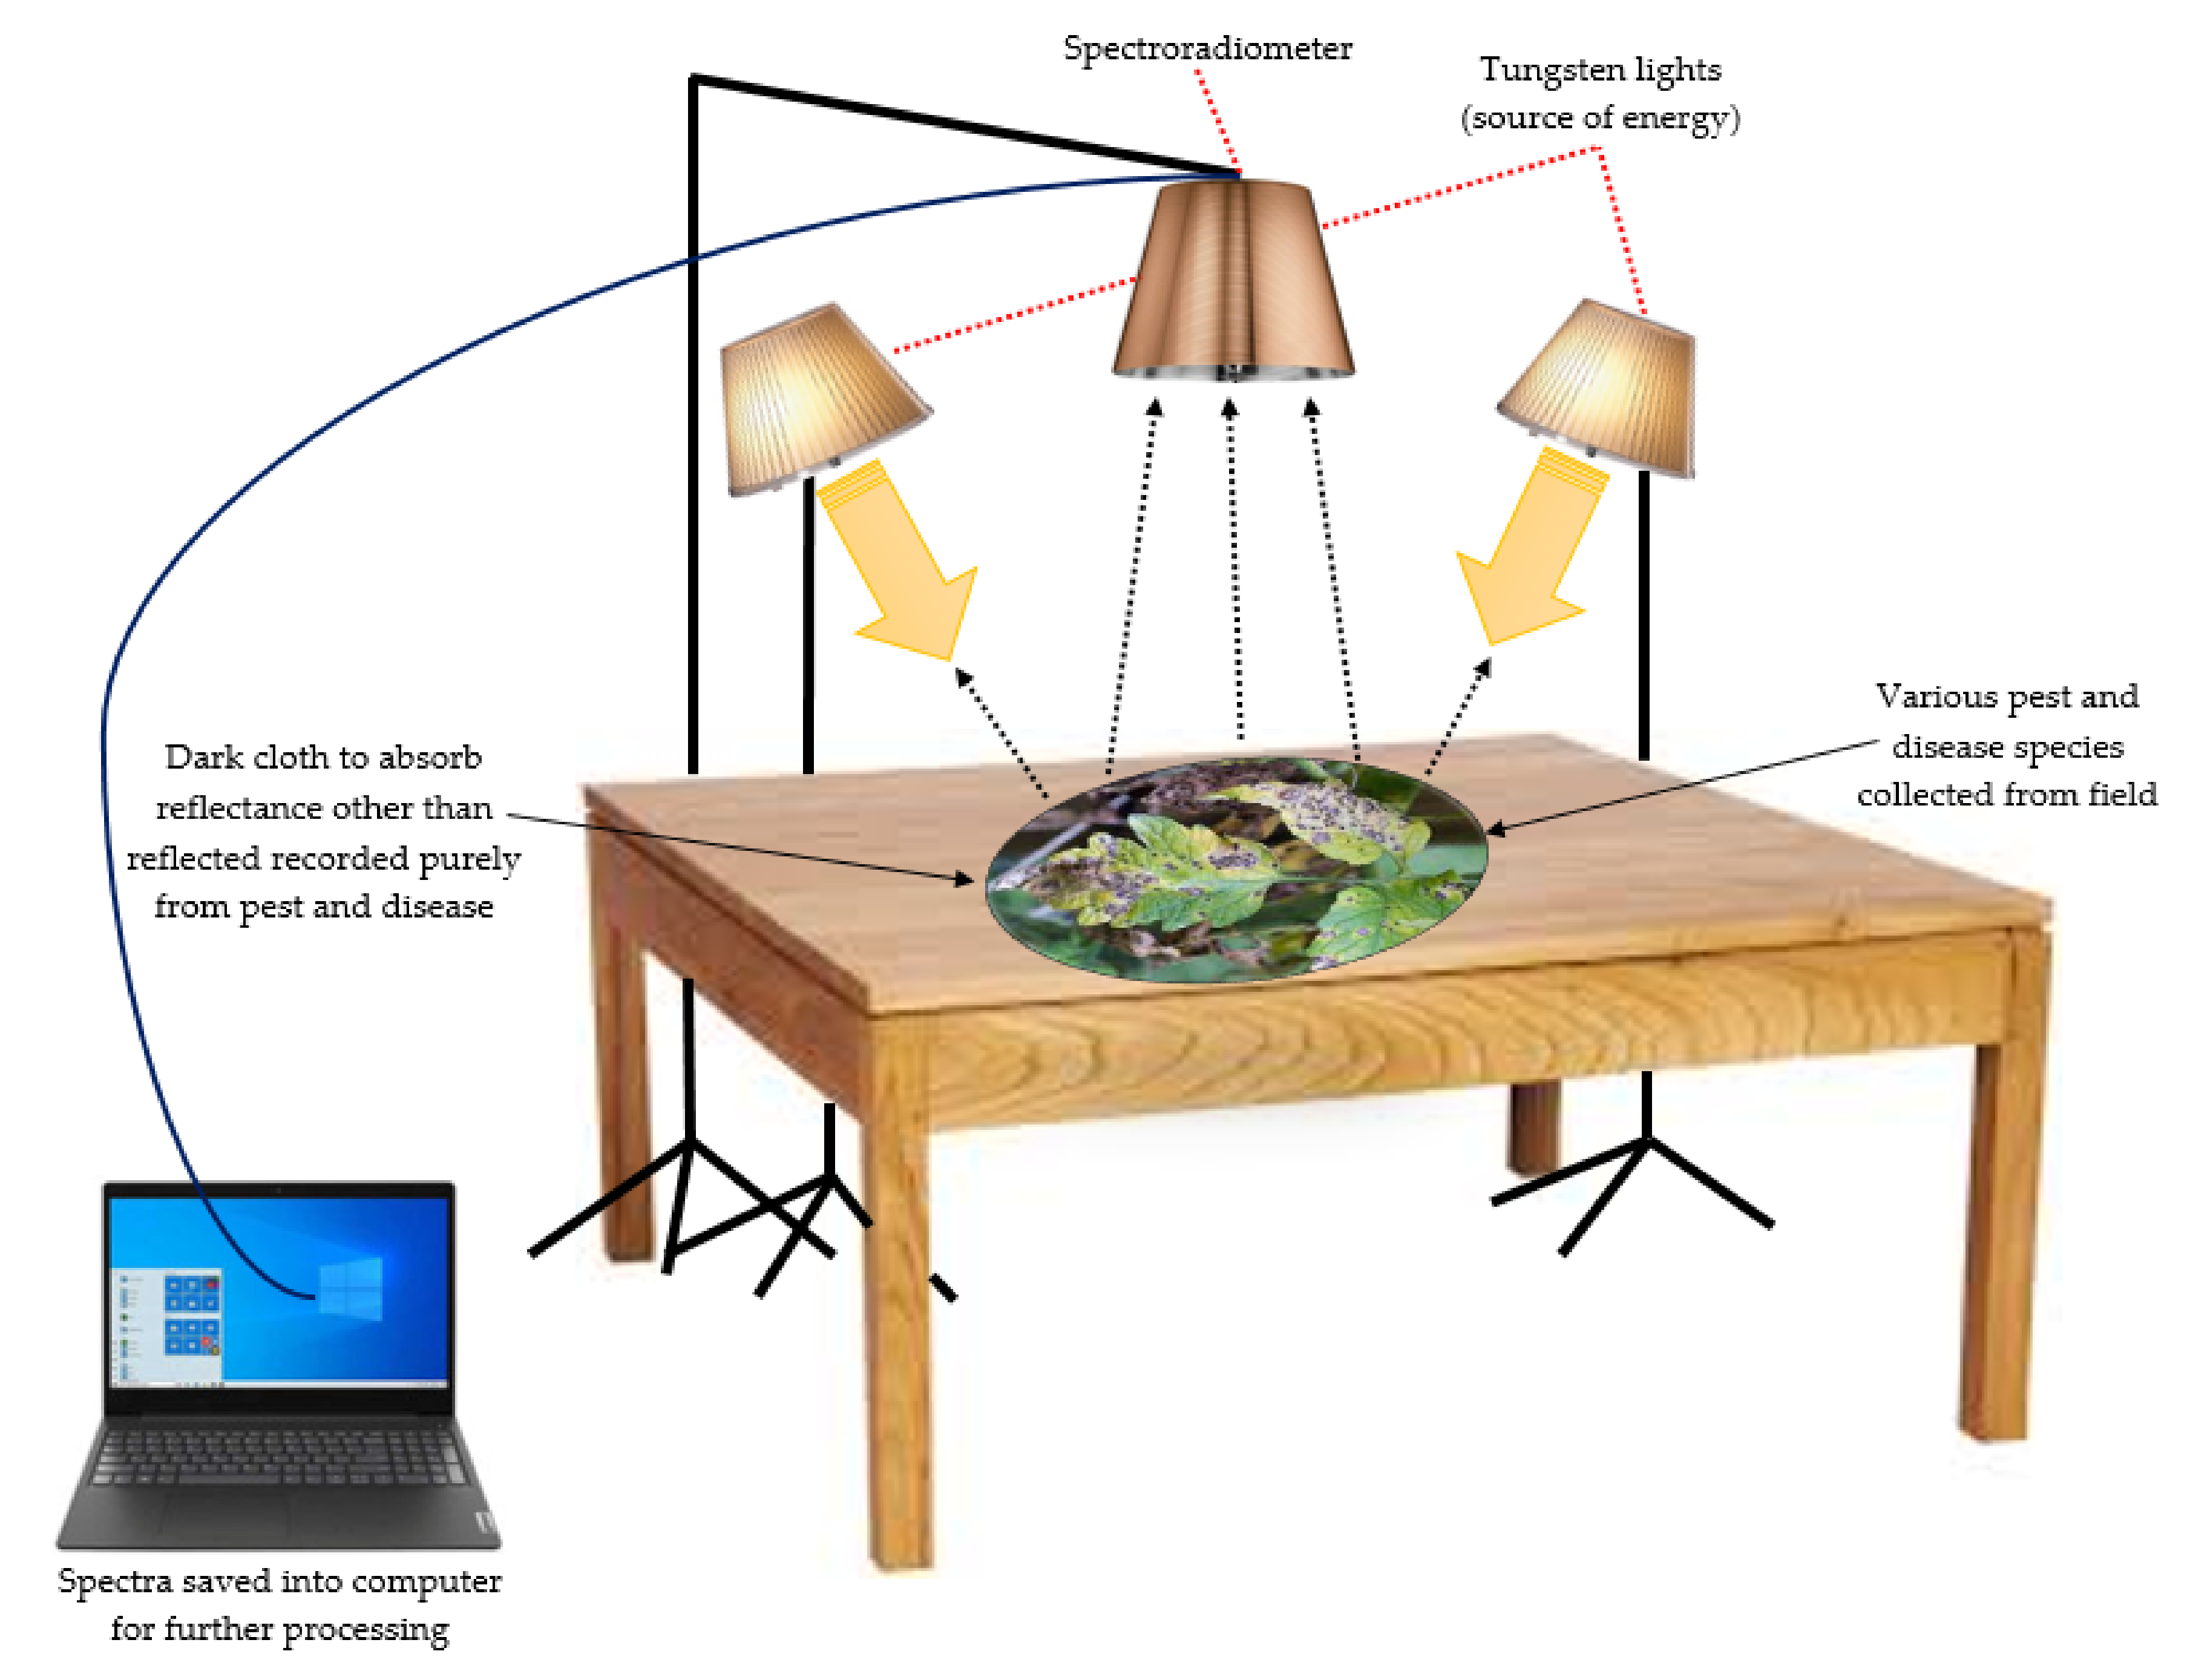
5.1. Collection of Hyperspectral Reflectance Data and Spectral Signatures
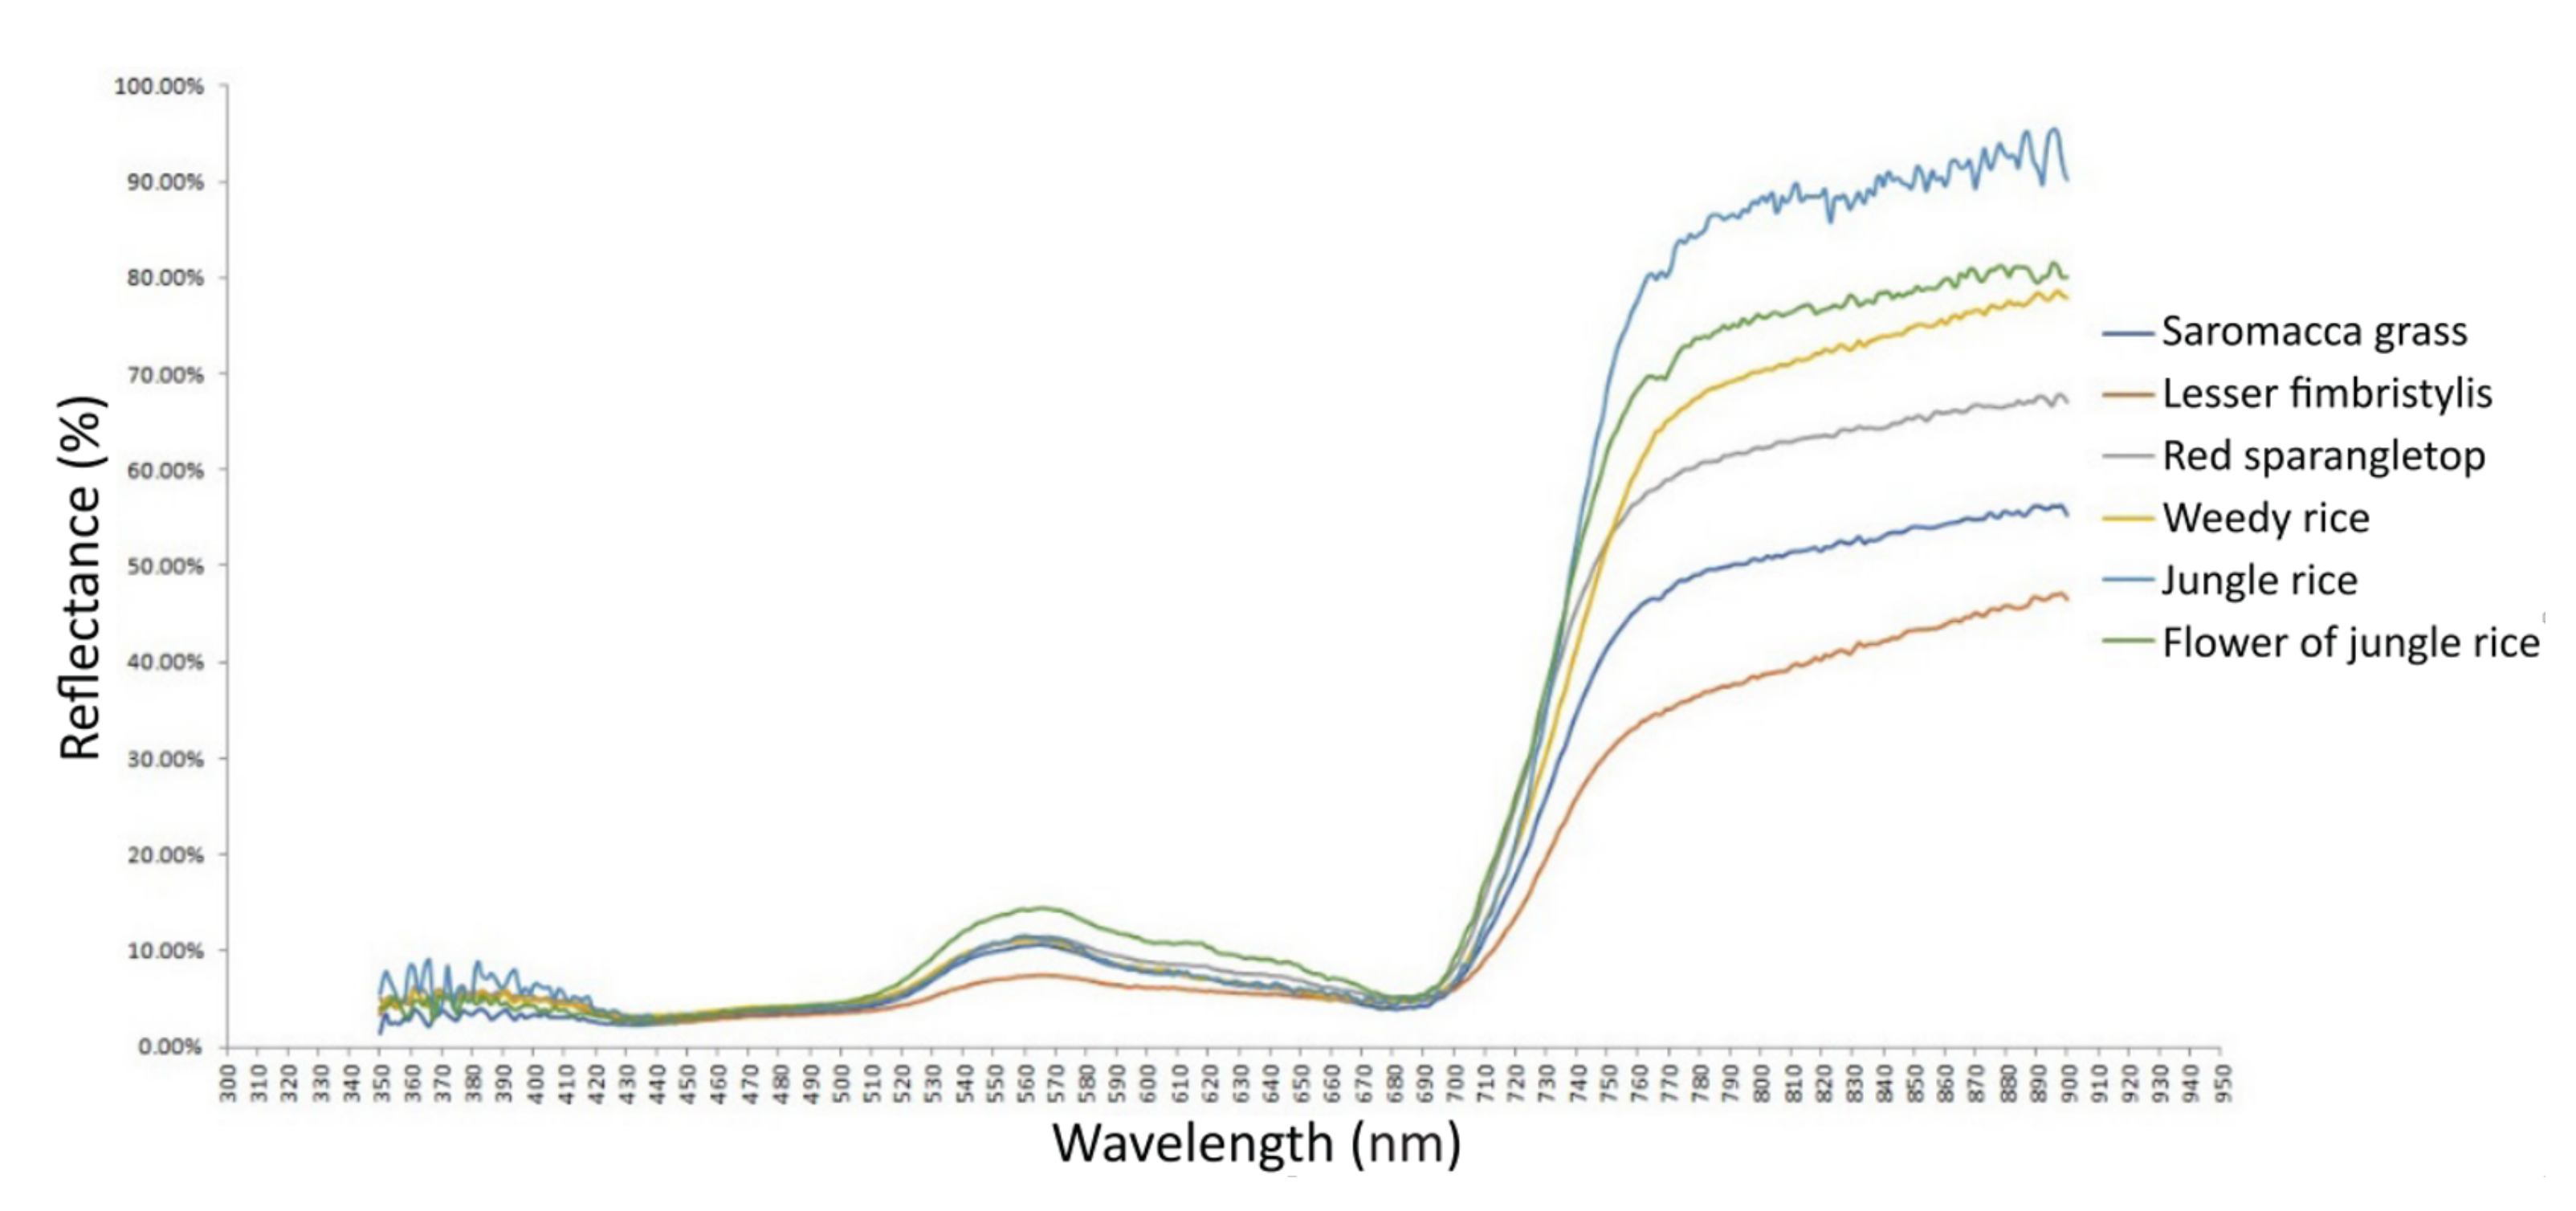
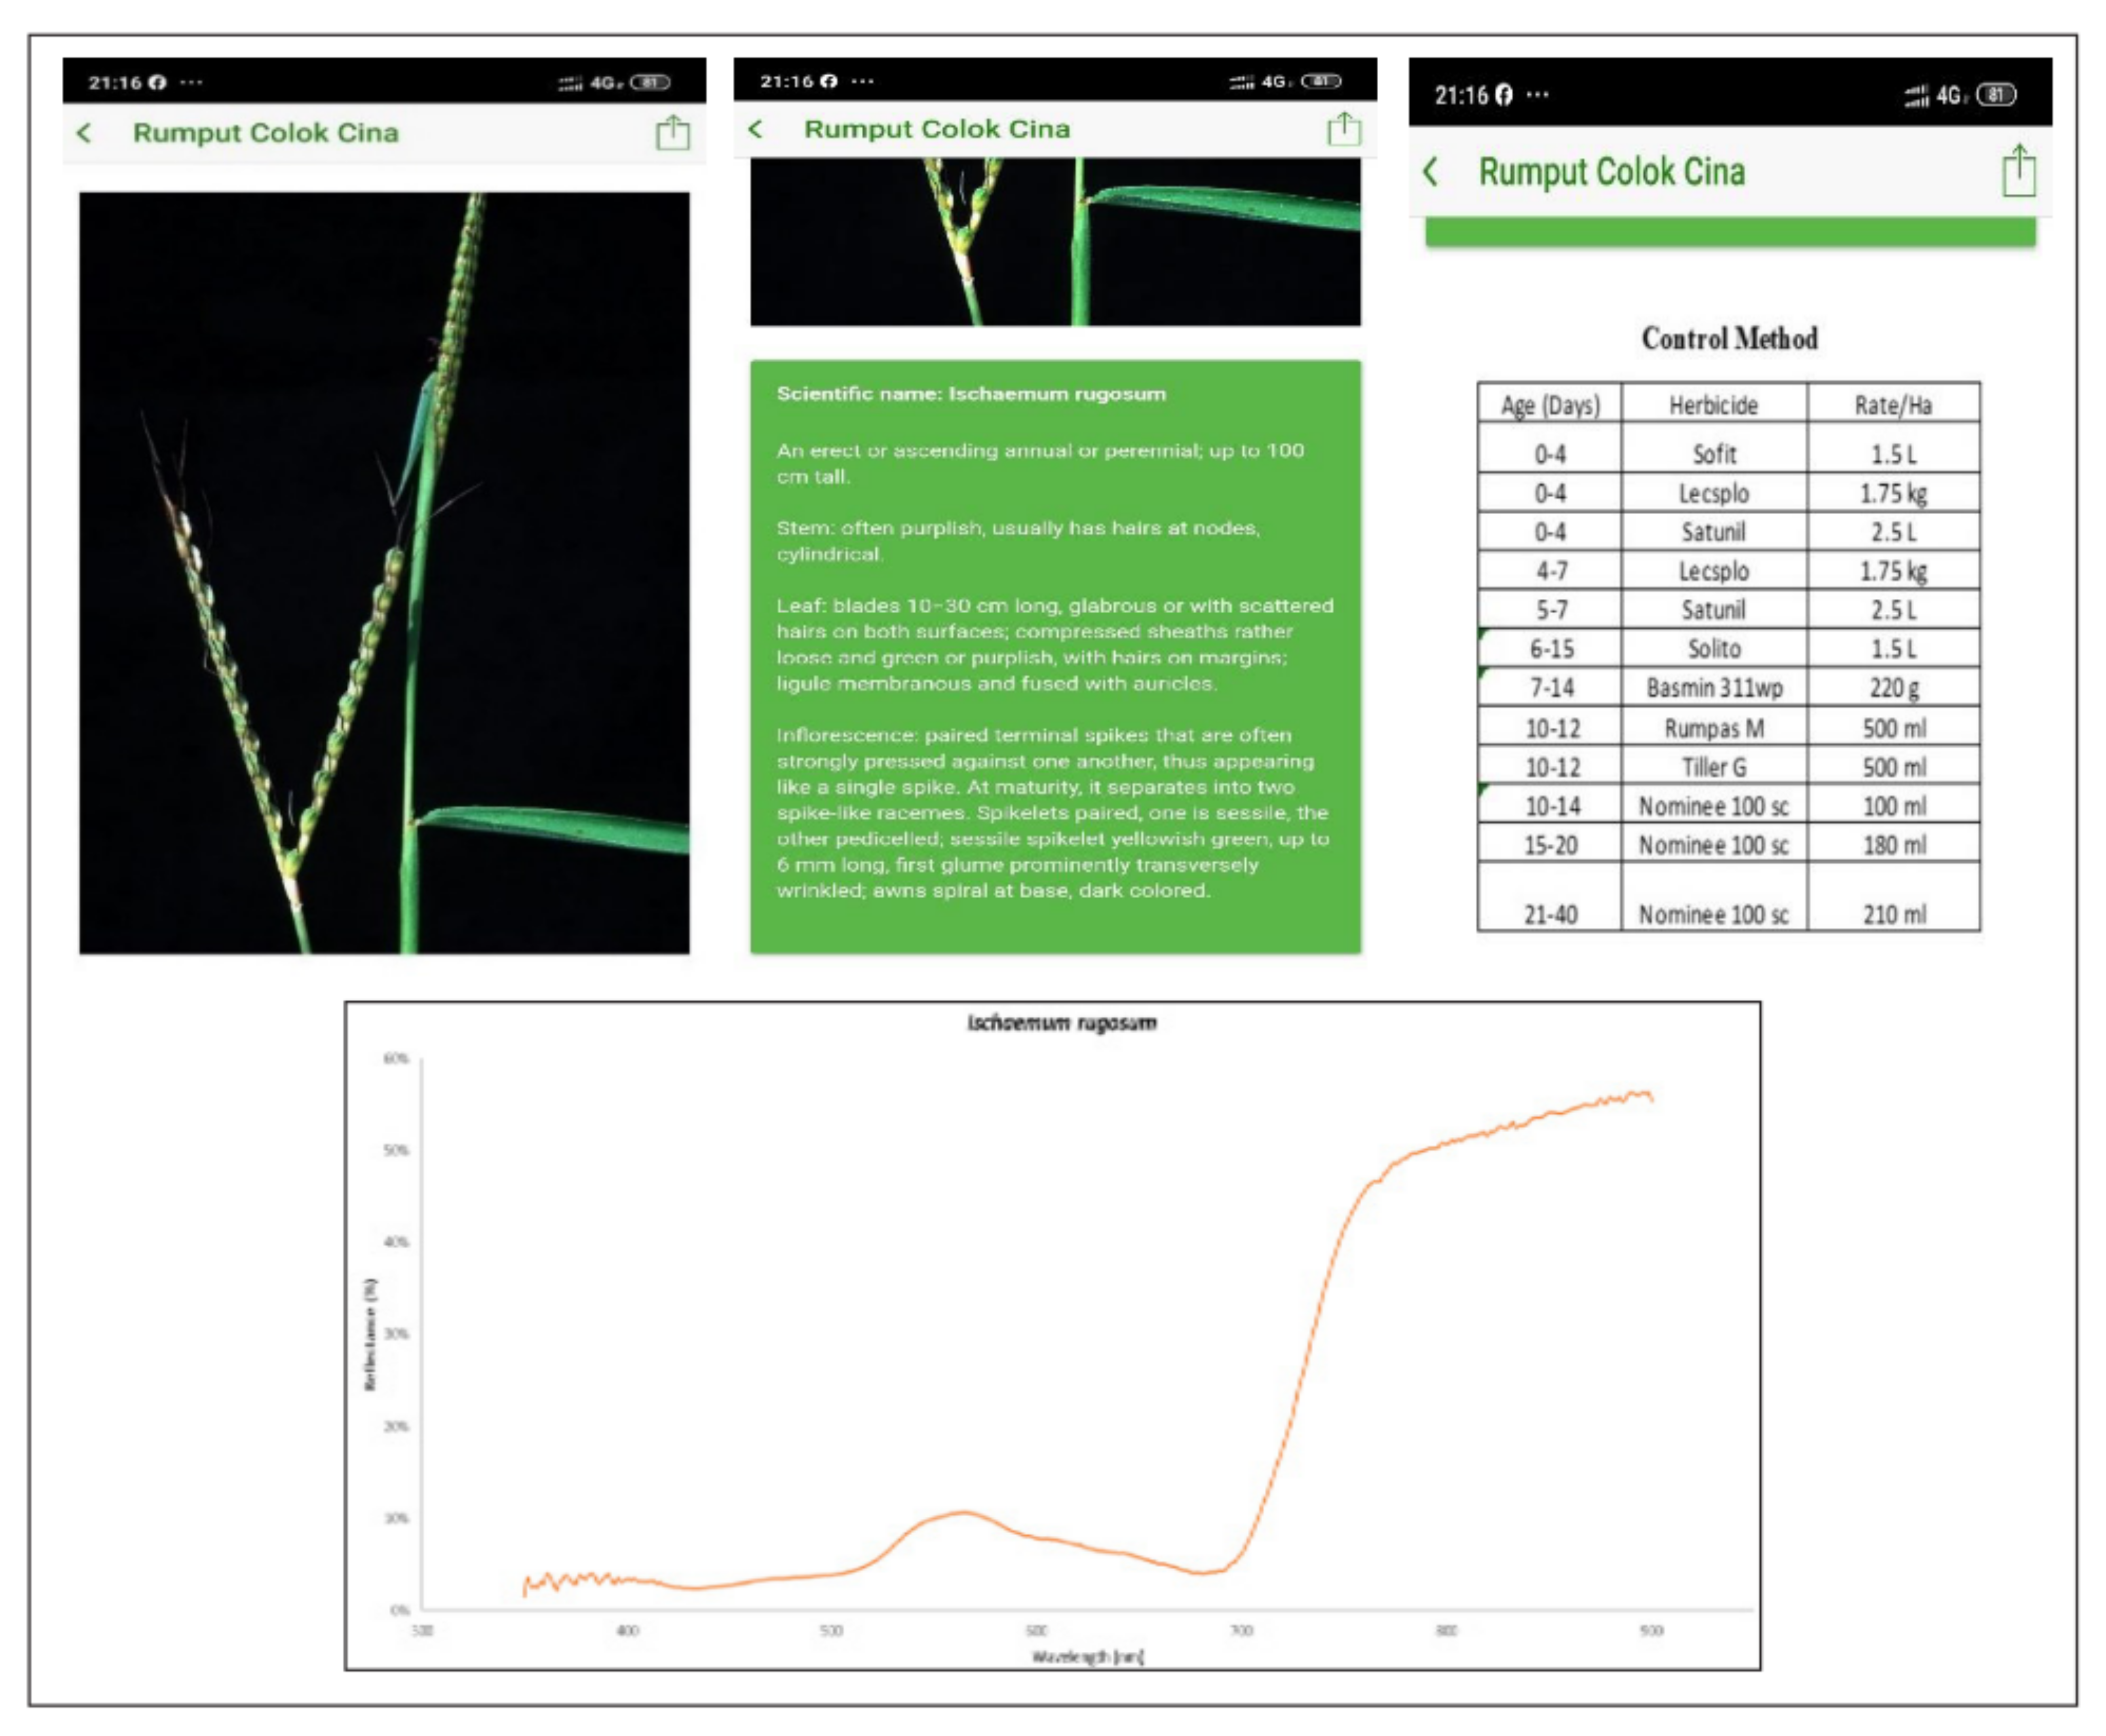
5.2. Generation of Spectral Signature Graph
- (i)
- Visualization of Spectral Reflectance.Create a graphic representation of the spectral reflectance for pest and disease species.
- (ii)
- First Derivative Analysis.Calculate the first derivatives using Equation (1) and display the spectral signature graph and first derivate graph.where:
- FD = First Derivative.
- Reflectance of the first and second reflectance pairs n1 and n2.
- = Wavelength of first and second reflectance pairs n1 and n2.
- = Position of reflectance.
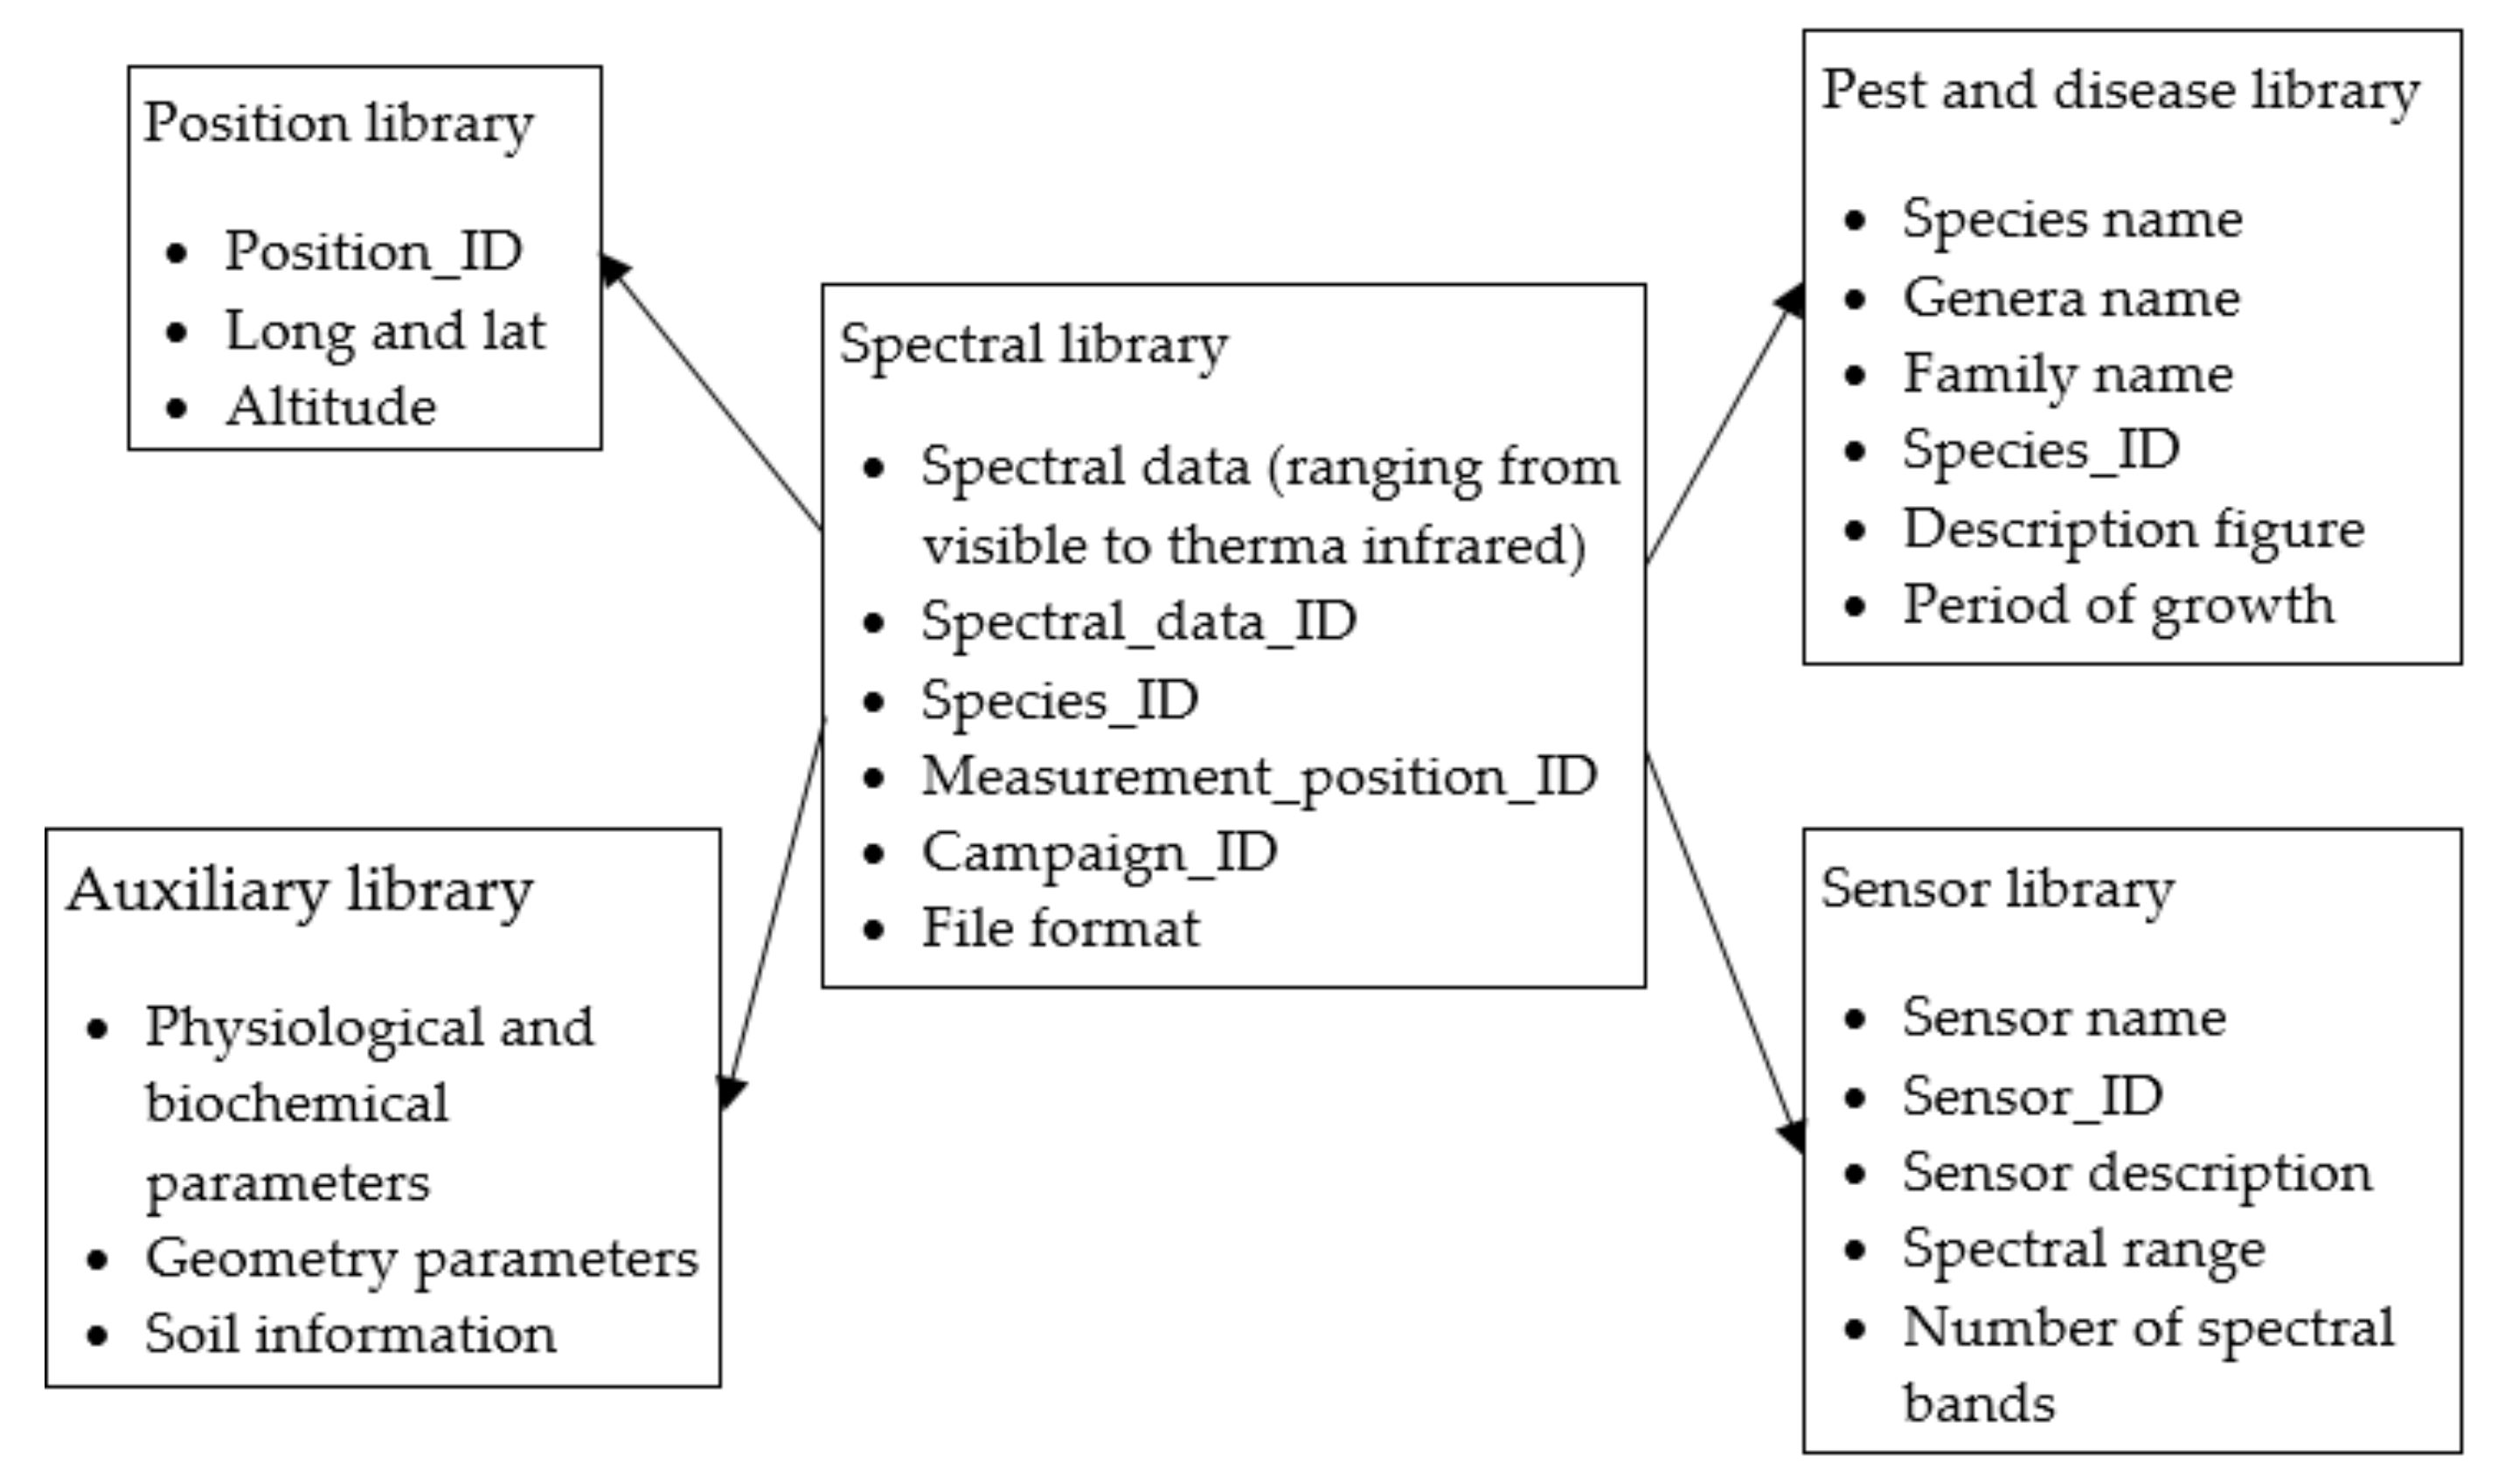
5.3. Incorporation of Spectral Libraries into the Mobile Application
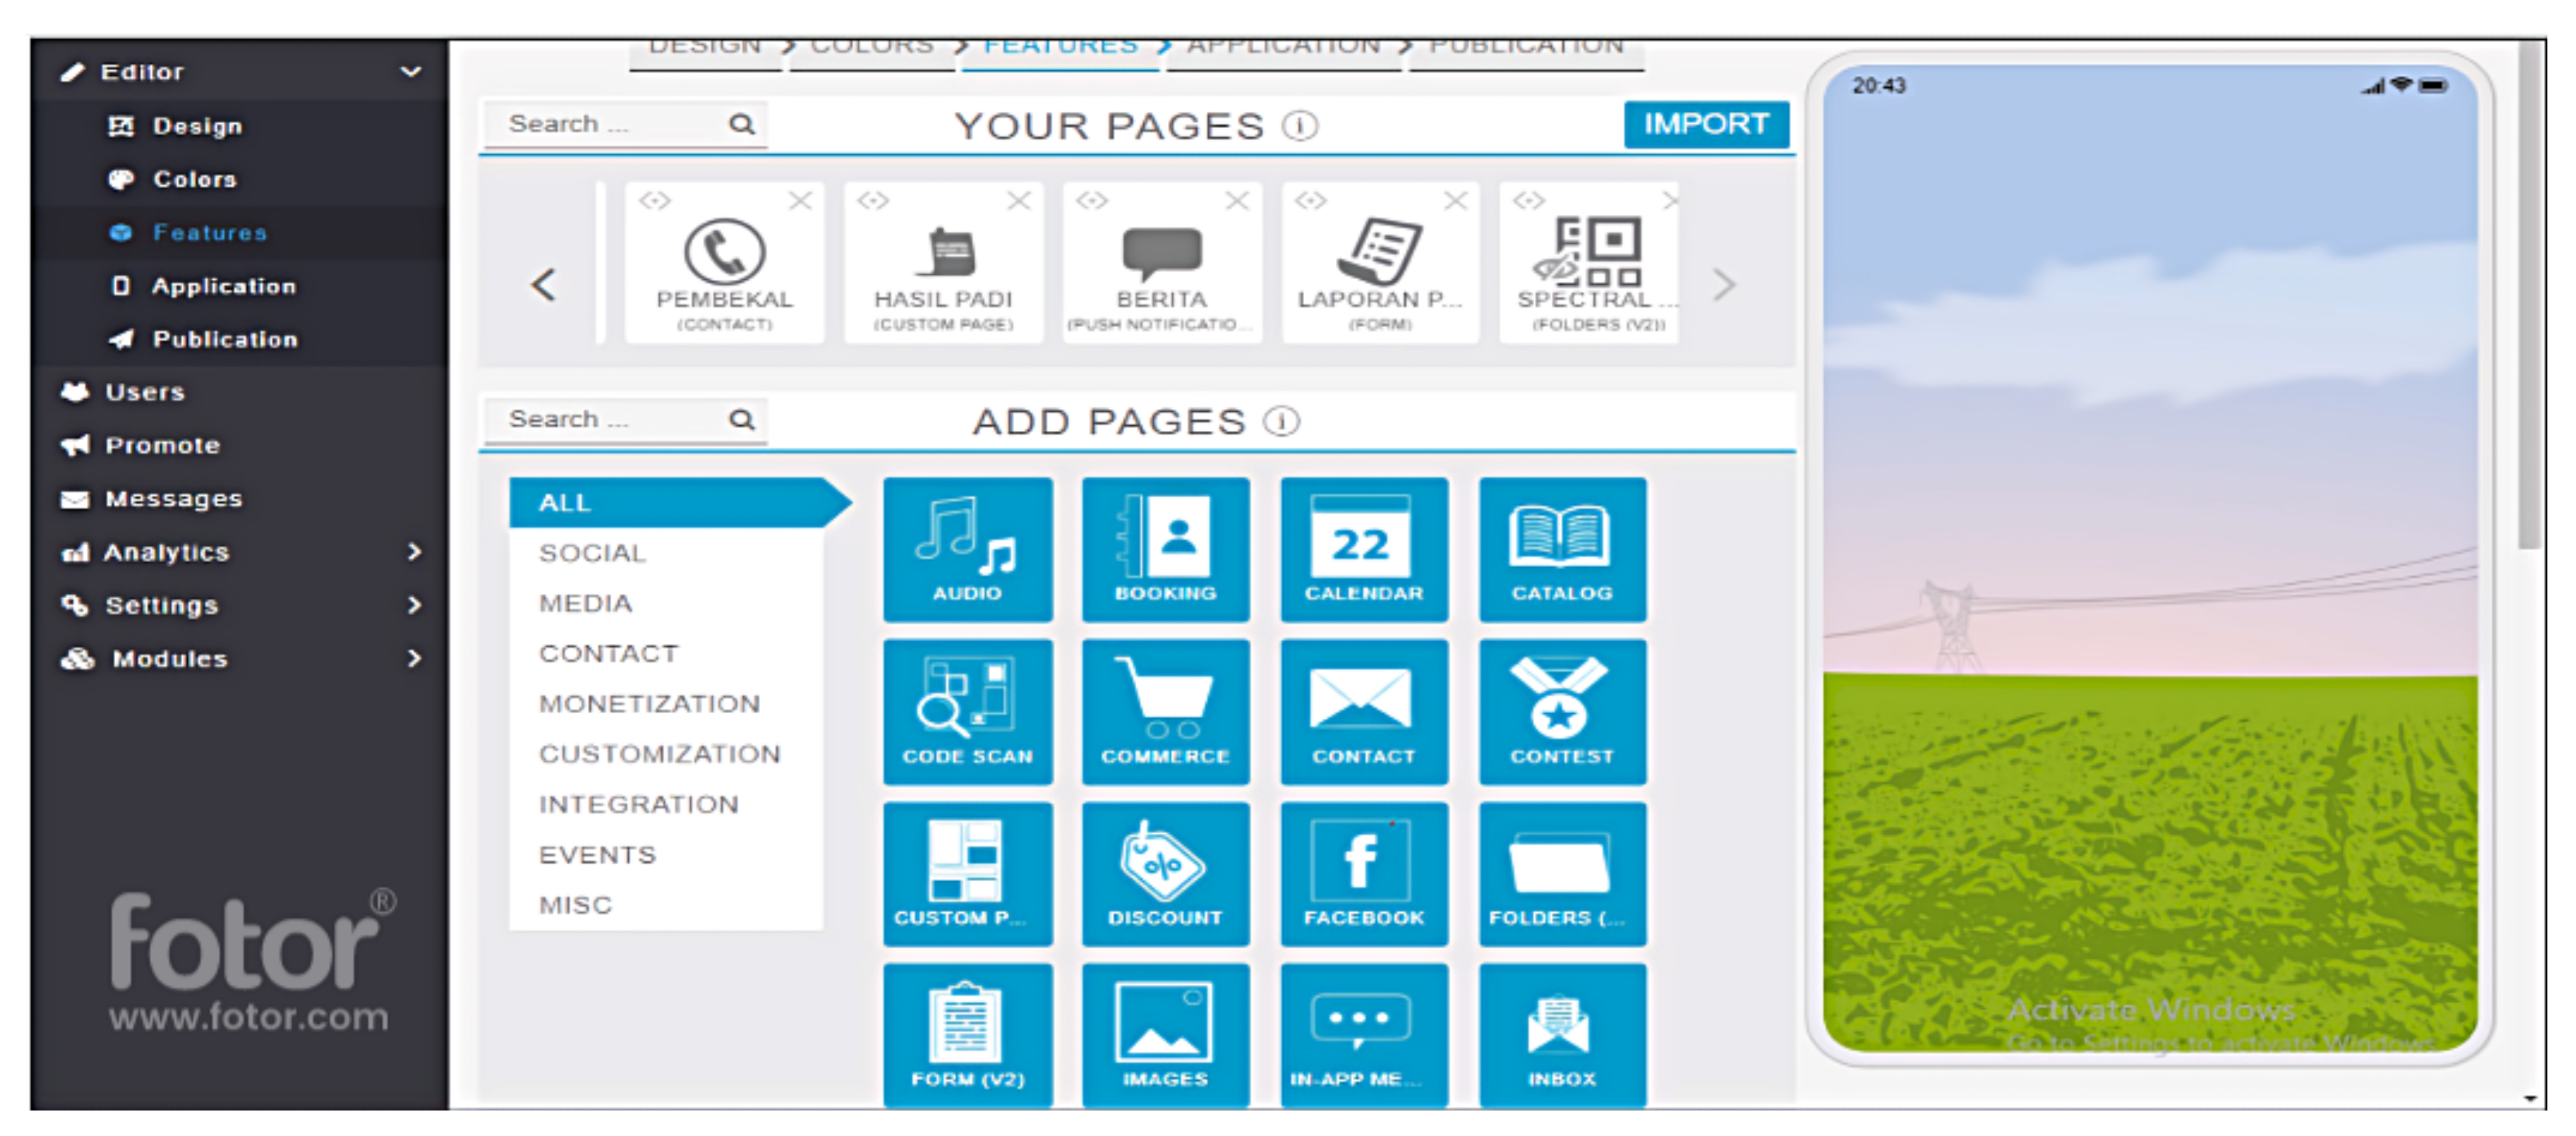
5.4. Design of Mobile Applications Containing the Spectral Libraries
6. Conclusions
Author Contributions
Funding
Conflicts of Interest
Abbreviations
| AI | artificial intelligent |
| ANN | artificial neural network |
| NIR | near-infrared |
| RGB | red, green and blue |
| SWIR | short wave infrared |
| UAV | unmanned aerial vehicle |
References
- Costopoulos, C.; Ntaliani, M.; Karetsos, S. Studying Mobile Apps for Agriculture. IOSR J. Mob. Comput. Appl. 2016, 3, 44–49. [Google Scholar]
- Bayrak, T. Identifying Technical Requirements for a Mobile Business Analytics Application. Int. J. Bus. Anal IJBAN 2021, 8, 91–103. [Google Scholar] [CrossRef]
- Tudpor, K.; Wongkongdech, A.; Wongkongdech, R.; Chaiyakarm, T.; Jitsukka, W.; Sombateyotha, K.; Leethongdeesakul, S.; Kuboonya-Aragsa, N.; Chantarsombat, C.; Kimchai, K. Geographic Information System-Based Mobile Application Design for Health Care in Older Persons in Rural Community by Village Health Volunteers. Stud. Health Technol. Inform. 2022, 289, 426–429. [Google Scholar] [PubMed]
- Mei, A.W.S.; Hong, P.L.; Keikhosrokiani, P.; Xin, C.H.; Ying, T.X.; Samat, N. A GIS-based Mobile Application to Improve Tourism Experience: A Case Study of Terengganu, Malaysia. In Proceedings of the 2021 International Congress of Advanced Technology and Engineering (ICOTEN), Taiz, Yemen, 4–5 July 2021; pp. 1–10. [Google Scholar]
- Aletdinova, A.A. Popular Mobile Applications for Crop Production. In IOP Conference Series: Earth and Environmental Science; IOP Publishing: Bristol, UK, 2021; Volume 666, p. 032036. [Google Scholar]
- Monzon, J.P.; Calviño, P.A.; Sadras, V.O.; Zubiaurre, J.B.; Andrade, F.H. Precision agriculture based on crop physiological principles improves whole-farm yield and profit: A case study. Eur. J. Agron. 2018, 99, 62–71. [Google Scholar] [CrossRef]
- Neupane, A.; Bulbul, I.; Wang, Z.; Lehman, R.M.; Nafziger, E.; Marzano, S.Y.L. Long term crop rotation effect on subsequent soybean yield explained by soil and root-associated microbiomes and soil health indicators. Sci. Rep. 2021, 11, 9200. [Google Scholar] [CrossRef] [PubMed]
- Nesarajan, D.; Kunalan, L.; Logeswaran, M.; Kasthuriarachchi, S.; Lungalage, D. Coconut disease prediction system using image processing and deep learning techniques. In Proceedings of the 2020 IEEE 4th International Conference on Image Processing, Applications and Systems (IPAS), Genova, Italy, 9–11 December 2020; pp. 212–217. [Google Scholar]
- Thar, S.P.; Ramilan, T.; Farquharson, R.J.; Pang, A.; Chen, D. An empirical analysis of the use of agricultural mobile applications among smallholder farmers in Myanmar. Electron. J. Inf. 2021, 87, e12159. [Google Scholar] [CrossRef]
- Sivagnanasundaram, J.; Ginige, A.; Goonetillake, J. Farmers as sensors: A crowdsensing platform to generate agricultural pest incidence reports. In Proceedings of the 2019 International Conference on Internet of Things Research and Practice (iCIOTRP), Sydney, Australia, 24–26 November 2019; pp. 13–18. [Google Scholar]
- Su, W.H. Advanced machine learning in point spectroscopy, RGB-and hyperspectral-imaging for automatic discriminations of crops and weeds: A review. Smart Cities 2020, 3, 767–792. [Google Scholar] [CrossRef]
- Yang, X.F.; Kong, C.H. Interference of allelopathic rice with paddy weeds at the root level. Plant Biol. 2017, 19, 584–591. [Google Scholar] [CrossRef]
- Nelson, S.C.; Corcoja, I.; Pethybridge, S.J. Cluster: A New Application for Spatial Analysis of Pixelated Data for Epiphytotics. Phytopathology 2017, 107, 1556–1566. [Google Scholar] [CrossRef] [Green Version]
- Rossel, R.V.; Behrens, T.; Ben-Dor, E.; Brown, D.J.; Demattê, J.A.M.; Shepherd, K.D.; Shi, Z.; Stenberg, B.; Stevens, A.; Adamchuk, V.; et al. A global spectral library to characterize the world’s soil. Earth-Sci. Rev. 2016, 155, 198–230. [Google Scholar] [CrossRef] [Green Version]
- Chen, S.S.; Fang, L.G.; Liu, Q.H.; Chen, L.F.; Tong, Q.X. The design and development of spectral library of featured crops of South China. In Proceedings of the 2005 IEEE International Geoscience and Remote Sensing Symposium, IGARSS’05, Seoul, Korea, 29 July 2005; Volume 2, p. 4. [Google Scholar]
- Lau, A.M.S.; Hashim, M. The design and building of spectral library of tropical rain forest in Malaysia. In Proceedings of the 28th Asian Conference on Remote Sensing, Kuala Lumpur, Malaysia, 12–16 November 2007; Asian Association on Remote Sensing: Tokyo, Japan; Volume 2, pp. 1150–1157. [Google Scholar]
- Jusoff, K.; Yusoff, M.M.; Ali, N.H.M. Spectral signatures of leaf fall diseases in Hevea brasiliensis using a handheld spectroradiometer. Mod. Appl. Sci. 2010, 4, 78–84. [Google Scholar] [CrossRef] [Green Version]
- Ponnamperuma Arachchi, J.; Bandara, D.M.B.N.; Perera, S.P.M.G.N.H.; Nilakshi, S.V.; Nugaliyadde, L.; Sisira Kumara, W.A.G. An e-pest surveillance and advisory system to empower farmers in managing rice pests and diseases in Sri Lanka. In Proceedings of the International Research Conference on Smart Computing and Systems Engineering-SCSE, Department of Industrial Management, Faculty of Science, University of Kelaniya, Colombo, Sri Lanka, 29 March 2018. [Google Scholar]
- Mohapatra, S.D.; Tripathi, R.; Acharya, P.; Shahid, M.; Raghu, S.; Guru, P.K.; Dash, S.K. NRRI’riceXpert’APP: Taking rice technologies in the doorstep of farmers. In Proceedings of the Souvenir: 3rd ARRW International Symposium, Cuttack, India, 6–9 February 2018. [Google Scholar]
- Mostafa, S.A.; Hazeem, A.A.; Khaleefahand, S.H.; Mustapha, A.; Darman, R. A Collaborative Multi-agent System for Oil Palm Pests and Diseases Global Situation Awareness. In Proceedings of the Future Technologies Conference, Vancouver, BC, Canada, 13–14 November 2018; Springer: Cham, Switzerland, 2018; pp. 763–775. [Google Scholar]
- Rahim, S.E.; Supli, A.A.; Damiri, N. Developing a land suitability evaluation tool in mobile android application for rubber, cocoa and oil palm. J. Int. Soc. Southeast Asian Agric. Sci. 2016, 22, 80–90. [Google Scholar]
- De, A.; Singh, S.P. Analysis of fuzzy applications in the agri-supply chain: A literature review. J. Clean. Prod. 2021, 283, 124577. [Google Scholar] [CrossRef]
- Yusof, M.M.; Rosli, N.F.; Othman, M.; Mohamed, R.; Abdullah, M.H.A. M-DCocoa: M-Agriculture Expert System for Diagnosing Cocoa Plant Diseases. In Proceedings of the International Conference on Soft Computing and Data Mining, Johor, Malaysia, 6–7 February 2018; Springer: Cham, Switzerland, 2018; pp. 363–371. [Google Scholar]
- Rachman, T.; Napitupulu, D. User acceptance analysis of potato expert system application based on TAM approach. Int. J. Adv. Sci. Eng. Inf. Technol. 2018, 8, 185–191. [Google Scholar] [CrossRef] [Green Version]
- Johannes, A.; Picon, A.; Alvarez-Gila, A.; Echazarra, J.; Rodriguez-Vaamonde, S.; Navajas, A.D.; Ortiz-Barredo, A. Automatic plant disease diagnosis using mobile capture devices, applied on a wheat use case. Comput. Electron. Agric. 2017, 138, 200–209. [Google Scholar] [CrossRef]
- Ramcharan, A.; Baranowski, K.; McCloskey, P.; Ahmed, B.; Legg, J.; Hughes, D.P. Deep learning for image-based cassava disease detection. Front. Plant Sci. 2017, 8, 1852. [Google Scholar] [CrossRef] [PubMed] [Green Version]
- Walls, J.T., III; Caciagli, P.; Tooker, J.F.; Russo, J.M.; Rajotte, E.G.; Rosa, C. Modeling the decision process for barley yellow dwarf management. Comput. Electron. Agric. 2016, 127, 775–786. [Google Scholar] [CrossRef]
- Shrimali, S. PlantifyAI: A Novel Convolutional Neural Network Based Mobile Application for Efficient Crop Disease Detection and Treatment. Procedia Comput. Sci. 2021, 191, 469–474. [Google Scholar] [CrossRef]
- Chen, C.J.; Huang, Y.Y.; Li, Y.S.; Chang, C.Y.; Huang, Y.M. An AIoT based smart agricultural system for pests detection. IEEE Access 2020, 8, 180750–180761. [Google Scholar] [CrossRef]
- Roslin, N.A.; Che’Ya, N.N.; Sulaiman, N.; Nor Alahyadi, L.A.; Ismail, M.R. Mobile Application Development for Spectral Signature of Weed Species in Rice Farming. Pertanika J. Sci. Technol. 2021, 29, 2241–2259. [Google Scholar] [CrossRef]
- Singh, N.K.; Dutta, A.; Puccetti, G.; Croll, D. Tackling microbial threats in agriculture with integrative imaging and computational approaches. Comput. Struct. Biotechnol. J. 2021, 19, 372–383. [Google Scholar] [CrossRef] [PubMed]
- Triono, J.; Tristono, T. Expert System Identification of Pest and Diseases of Rice using Html5. Int. J. Adv. Res. Comput. Sci. Softw. Eng. 2016, 7, 60–63. [Google Scholar]
- Morco, R.C.; Calanda, F.B.; Bonilla, J.A.; Corpuz, M.J.S.; Avestro, J.E.; Angeles, J.M. E-Rice: An Expert System using Rule-Based Algorithm to Detect, Diagnose, and Prescribe Control Options for Rice Plant Diseases in the Philippines. In Proceedings of the 2017 International Conference on Computer Science and Artificial Intelligence, Jakarta, Indonesia, 5–7 December 2017; pp. 49–54. [Google Scholar]
- Adama, A.; Ee, K.P.; Sahari, N.; Tida, A.; Shang, C.Y.; Tawie, K.M.; Mohamad, H. Dr. LADA: Diagnosing black pepper pest and diseases with decision tree. Int. J. Adv. Sci. Eng. Inf. Technol. 2018, 8, 1584–1590. [Google Scholar] [CrossRef] [Green Version]
- Nasir, H.; Aris, A.N.; Lajis, A.; Kadir, K.; Safie, S.I. Development of Android Application for Pest Infestation Early Warning System. In Proceedings of the 2018 IEEE 5th International Conference on Smart Instrumentation, Measurement and Application (ICSIMA), Songkhla, Thailand, 28–30 November 2018; pp. 1–5. [Google Scholar]
- Novas, N.; Alvarez-Bermejo, J.A.; Valenzuela, J.L.; Gázquez, J.A.; Manzano-Agugliaro, F. Development of a smartphone application for assessment of chilling injuries in zucchini. Biosyst. Eng. 2019, 181, 114–127. [Google Scholar] [CrossRef]
- Picon, A.; Alvarez-Gila, A.; Seitz, M.; Ortiz-Barredo, A.; Echazarra, J.; Johannes, A. Deep convolutional neural networks for mobile capture device-based crop disease classification in the wild. Comput. Electron. Agric. 2019, 161, 280–290. [Google Scholar] [CrossRef]
- Valdez-Morones, T.; Pérez-Espinosa, H.; Avila-George, H.; Oblitas, J.; Castro, W. An Android App for detecting damage on tobacco (Nicotiana tabacum L.) leaves caused by blue mold (Penospora tabacina Adam). In Proceedings of the 2018 7th International Conference on Software Process Improvement (CIMPS), Guadalajara, México, 17–19 October 2018; pp. 125–129. [Google Scholar]
- Ranjith; Anas, S.; Badhusha, I.; Zaheema, O.T.; Faseela, K.; Shelly, M. Cloud based automated irrigation and plant leaf disease detection system using an android application. In Proceedings of the 2017 International conference of Electronics, Communication and Aerospace Technology (ICECA), Coimbatore, India, 20–22 April 2017; Volume 2, pp. 211–214. [Google Scholar]
- Tan, D.S.; Leong, R.N.; Laguna, A.F.; Ngo, C.A.; Lao, A.; Amalin, D.M.; Alvindia, D.G. AuToDiDAC: Automated tool for disease detection and assessment for cacao black pod rot. Crop Prot. 2018, 103, 98–102. [Google Scholar] [CrossRef]
- Pérez-Castro, A.; Sánchez-Molina, J.A.; Castilla, M.; Sánchez-Moreno, J.; Moreno-Úbeda, J.C.; Magán, J.J. cFertigUAL: A fertigation management app for greenhouse vegetable crops. Agric. Water Manag. 2017, 183, 186–193. [Google Scholar] [CrossRef]
- Katsaros, A.; Keramopoulos, E. FarmAR, a farmer’s augmented reality application based on semantic web. In Proceedings of the 2017 South Eastern European Design Automation, Computer Engineering, Computer Networks and Social Media Conference (SEEDA-CECNSM), Kastoria, Greece, 23–25 September 2017; pp. 1–6. [Google Scholar]
- Katamba, R.; Mutebi, B. Jaguza livestock app, the app transforming livestock production and strengthening food security. In Proceedings of the 2017 IST-Africa Week Conference (IST-Africa), Windhoek, Namibia, 31 May–2 June 2017; pp. 1–12. [Google Scholar]
- Machado, B.B.; Orue, J.P.; Arruda, M.S.; Santos, C.V.; Sarath, D.S.; Goncalves, W.N.; Rodrigues, J.F., Jr. BioLeaf: A professional mobile application to measure foliar damage caused by insect herbivory. Comput. Electron. Agric. 2016, 129, 44–55. [Google Scholar] [CrossRef] [Green Version]
- Simorangkir, G.D.; Sarwoko, E.A.; Sasongko, P.S.; Endah, S.N. Usability Testing of Corn Diseases and Pests Detection on a Mobile Application. In Proceedings of the 2018 2nd International Conference on Informatics and Computational Sciences (ICICoS), Semarang, Indonesia, 30–31 October 2018; pp. 1–6. [Google Scholar]
- Petrellis, N. Plant disease diagnosis for smart phone applications with extensible set of diseases. Appl. Sci. 2019, 9, 1952. [Google Scholar] [CrossRef] [Green Version]
- Rice Doctor—Apps on Google Play. May 2019. Available online: https://play.google.com/store/apps/details?id=com.lucidcentral.mobile.ricedoctor&hl=en (accessed on 9 January 2021).
- Miao, Z.; Yu, X.; Li, N.; He, C.; Sun, T. Weed Detection Based on the Fusion of Multiple Image Processing Algorithms. In Proceedings of the 2021 40th Chinese Control Conference (CCC), Shanghai, China, 26–28 July 2021; pp. 4217–4222. [Google Scholar]
- Mendes, J.; Pinho, T.M.; dos Santos, F.N.; Sousa, J.J.; Peres, E.; Boaventura-Cunha, J.; Cunha, M.; Morais, R. Smartphone applications targeting precision agriculture practices—A systematic review. Agronomy 2020, 10, 855. [Google Scholar] [CrossRef]
- Ouhami, M.; Hafiane, A.; Es-Saady, Y.; El Hajji, M.; Canals, R. Computer vision, IoT and data fusion for crop disease detection using machine learning: A survey and ongoing research. Remote Sens. 2021, 13, 2486. [Google Scholar] [CrossRef]
- Mrisho, L.M.; Mbilinyi, N.A.; Ndalahwa, M.; Ramcharan, A.M.; Kehs, A.K.; McCloskey, P.C.; Murithi, H.; Hughes, D.P.; Legg, J.P. Accuracy of a smartphone-based object detection model, PlantVillage Nuru, in identifying the foliar symptoms of the viral diseases of cassava–CMD and CBSD. Front. Plant Sci. 2020, 1964. [Google Scholar] [CrossRef] [PubMed]
- Mutembesa, D.; Omongo, C.; Mwebaze, E. Crowdsourcing real-time viral disease and pest information: A case of nation-wide cassava disease surveillance in a developing country. In Proceedings of the Sixth AAAI Conference on Human Computation and Crowdsourcing, Zürich, Switzerland, 5–8 July 2018. [Google Scholar]
- Vasavi, P.; Punitha, A.; Narayana Rao, T.V. Crop leaf disease detection and classification using machine learning and deep learning algorithms by visual symptoms: A review. Int. J. Electr. Comput. Eng. 2022, 12, 2079–2086. [Google Scholar] [CrossRef]
- Majid, K.; Herdiyeni, Y.; Rauf, A. I-PEDIA: Mobile application for paddy disease identification using fuzzy entropy and probabilistic neural network. In Proceedings of the 2013 International Conference on Advanced Computer Science and Information Systems (ICACSIS), Bali, Indonesia, 28–29 September 2013; pp. 403–406. [Google Scholar]
- Akbar, S. Handbook of 200 Medicinal Plants: A Comprehensive Review of Their Traditional Medical Uses and Scientific Justifications; Springer: Cham, Switzerland, 2020. [Google Scholar]
- Towers, P.C.; Poblete-Echeverría, C. Effect of the Illumination Angle on NDVI Data Composed of Mixed Surface Values Obtained over Vertical-Shoot-Positioned Vineyards. Remote Sens. 2021, 13, 855. [Google Scholar] [CrossRef]
- Hall, A.; Lamb, D.W.; Holzapfel, B.; Louis, J. Optical remote sensing applications in viticulture—A Review. Aust. J. Grape Wine Res. 2002, 8, 36–47. [Google Scholar] [CrossRef]
- Zhu, J.Y.; He, W.J.; Wang, H.Q.; Yao, J.M.; Qin, G.M.; Xu, C.Y.; Huang, T. The Response of Spectral Characteristics and Leaf Functional Traits of Euonymus Japonicas to Leaf Dustfall. Spectrosc. Spectr. Anal. 2020, 40, 1620–1625. [Google Scholar]
- Al Shehhi, M.R.; Gherboudj, I.; Ghedira, H. Detection of algal blooms over optically complex waters of the Arabian Gulf and Sea of Oman using MODIS fluorescence data. Int. J. Remote Sens. 2019, 40, 3751–3771. [Google Scholar] [CrossRef]
- Soares, J.C.; Santos, C.S.; Carvalho, S.M.; Pintado, M.M.; Vasconcelos, M.W. Preserving the nutritional quality of crop plants under a changing climate: Importance and strategies. Plant Soil 2019, 443, 1–26. [Google Scholar] [CrossRef] [Green Version]
- Veettil, B.K.; Ward, R.D.; Lima, M.D.A.C.; Stankovic, M.; Hoai, P.N.; Quang, N.X. Opportunities for seagrass research derived from remote sensing: A review of current methods. Ecol. Indic. 2020, 117, 106560. [Google Scholar] [CrossRef]
- Landi, M.; Agati, G.; Fini, A.; Guidi, L.; Sebastiani, F.; Tattini, M. Unveiling the shade nature of cyanic leaves: A view from the “blue absorbing side” of anthocyanins. Plant Cell Environ. 2021, 44, 1119–1129. [Google Scholar] [CrossRef]
- Eberlein, J.; Davenport, B.; Nguyen, T.T.; Victorino, F.; Jhun, K.; van der Heide, V.; Kuleshov, M.; Ma’ayan, A.; Kedl, R.; Homann, D. Chemokine signatures of pathogen-specific T cells I: Effector T cells. J. Immunol. 2020, 205, 2169–2187. [Google Scholar] [CrossRef] [PubMed]
- Furlanetto, R.H.; Nanni, M.R.; Mizuno, M.S.; Crusiol, L.G.T.; da Silva, C.R. Identification and classification of Asian soybean rust using leaf-based hyperspectral reflectance. Int. J. Remote Sens. 2021, 42, 4177–4198. [Google Scholar] [CrossRef]
- Golob, A.; Kavčič, J.; Stibilj, V.; Gaberščik, A.; Vogel-Mikuš, K.; Germ, M. The effect of selenium and UV radiation on leaf traits and biomass production in Triticum aestivum L. Ecotoxicol. Environ. Saf. 2017, 136, 142–149. [Google Scholar] [CrossRef] [PubMed]
- Zheng, Y.; Fan, C.; Liu, M.; Chen, Y.; Lu, Z.; Xu, N.; Huang, H.; Zeng, H.; Liu, S.; Cao, H.; et al. Overall quality control of the chemical and bioactive consistency of ShengMai Formula. J. Pharm. Biomed. Anal. 2020, 189, 113411. [Google Scholar] [CrossRef]
- Teofilović, B.; Grujić-Letić, N.; Gligorić, E.; Rašković, A.; Igić, R.; Vastag, G.; Gadžurić, S. Experimental and Computational Evaluation of Extraction Procedure and Scavenging Capacity of Sweet Basil Extracts (Ocimum basilicum L.). Plant Foods Hum. Nutr. 2021, 76, 240–247. [Google Scholar] [CrossRef]
- Arias, F.; Zambrano, M.; Broce, K.; Medina, C.; Pacheco, H.; Nunez, Y. Hyperspectral imaging for rice cultivation: Applications, methods and challenges. AIMS Agric. Food 2021, 6, 273–307. [Google Scholar] [CrossRef]
- Hernández-Clemente, R.; Hornero, A.; Mottus, M.; Peñuelas, J.; González-Dugo, V.; Jiménez, J.C.; Suárez, L.; Alonso, L.; Zarco-Tejada, P.J. Early diagnosis of vegetation health from high-resolution hyperspectral and thermal imagery: Lessons learned from empirical relationships and radiative transfer modelling. Curr. For. Rep. 2019, 5, 169–183. [Google Scholar] [CrossRef] [Green Version]
- Mahlein, A.-K.; Alisaac, E.; Al Masri, A.; Behmann, J.; Dehne, H.-W.; Oerke, E.-C. Comparison and combination of thermal, fluorescence, and hyperspectral imaging for monitoring fusarium head blight of wheat on spikelet scale. Sensors 2019, 19, 2281. [Google Scholar] [CrossRef] [Green Version]
- Guo, Y.; Chen, S.; Wu, Z.; Wang, S.; Robin Bryant, C.; Senthilnath, J.; Cunha, M.; Fu, Y.H. Integrating Spectral and Textural Information for Monitoring the Growth of Pear Trees Using Optical Images from the UAV Platform. Remote Sens. 2021, 13, 1795. [Google Scholar] [CrossRef]
- Keller, M. The Science of Grapevines; Academic Press: Cambridge, MA, USA, 2020. [Google Scholar]
- Mandi, S.S. Natural UV Radiation in Enhancing Survival Value and Quality of Plants; Springer: New Delhi, India, 2016. [Google Scholar]
- Doehlemann, G.; Ökmen, B.; Zhu, W.; Sharon, A. Plant pathogenic fungi. Microbiol. Spectr. 2017, 5, 5.1.14. [Google Scholar] [CrossRef]
- Marın-Ortiz, J.C.; Gutierrez-Toro, N.; Botero-Ferna´ndez, V.; Hoyos- Carvajal, L.M. Linking physiological parameters with visible/ near-infrared leaf reflectance in the incubation period of vascular wilt disease. Saudi J. Biol. Sci. 2020, 27, 88–99. [Google Scholar] [CrossRef] [PubMed]
- Soja-Woźniak, M.; Craig, S.E.; Kratzer, S.; Wojtasiewicz, B.; Darecki, M.; Jones, C.T. A novel statistical approach for ocean colour estimation of inherent optical properties and cyanobacteria abundance in optically complex waters. Remote Sens. 2017, 9, 343. [Google Scholar] [CrossRef] [Green Version]
- Meng, R.; Lv, Z.; Yan, J.; Chen, G.; Zhao, F.; Zeng, L.; Xu, B. Development of Spectral Disease Indices for Southern Corn Rust Detection and Severity Classification. Remote Sens. 2020, 12, 3233. [Google Scholar] [CrossRef]
- Moore, C.E.; Meacham-Hensold, K.; Lemonnier, P.; Slattery, R.A.; Benjamin, C.; Bernacchi, C.J.; Lawson, T.; Cavanagh, A.P. The effect of increasing temperature on crop photosynthesis: From enzymes to ecosystems. J. Exp. Bot. 2021, 72, 2822–2844. [Google Scholar] [CrossRef] [PubMed]
- Martinelli, F.; Scalenghe, R.; Davino, S.; Panno, S.; Scuderi, G.; Ruisi, P.; Villa, P.; Stroppiana, D.; Boschetti, M.; Goulart, L.R.; et al. Advanced methods of plant disease detection. A review. Agron. Sustain. Dev. 2015, 35, 1–25. [Google Scholar] [CrossRef] [Green Version]
- Al-lami, A.K.; Abbood, R.A.; Al Maliki, A.A.; Al-Ansari, N. Using vegetation indices for monitoring the spread of Nile Rose plant in the Tigris River within Wasit province, Iraq. Remote Sens. Appl. Soc. Environ. 2021, 22, 100471. [Google Scholar] [CrossRef]
- Thamaga, K.H.; Dube, T. Testing two methods for mapping water hyacinth (Eichhornia crassipes) in the Greater Letaba river system, South Africa: Discrimination and mapping potential of the polar-orbiting Sentinel-2 MSI and Landsat 8 OLI sensors. Int. J. Remote Sens. 2018, 39, 8041–8059. [Google Scholar] [CrossRef]
- Bradly, B. Remote detection of invasive plants: A review of spectral, textural and phenological approaches. Biol. Invaions 2014, 16, 1411–1425. [Google Scholar] [CrossRef]
- Paz-Kagan, T.; Silver, M.; Panov, N.; Karnieli, A. Multispectral approach for identifying invasive plant species based on flowering phenology characteristics. Remote Sens. 2019, 11, 953. [Google Scholar] [CrossRef] [Green Version]
- Dube, T.; Mutanga, O.; Sibanda, M.; Bangamwabo, V.; Shoko, C. Evaluation the performance of the newly-launched Landsat 8 sensor in detecting and mapping the spatial confguration of water hyacinth (Eichhornia crassipes) in inland lakes, Zimbabwe. Phys. Chem. Earth Parts A/B/C 2017, 100, 101–111. [Google Scholar] [CrossRef]
- Chander, S.; Pompapathi, V.; Gujrati, A.; Singh, R.P.; Chaplot, N.; Patel, U.D. Growth of invasive aquatic macrophytes over Tapi river. In Proceedings of the International Archives of the Photogrammetry, Remote Sensing and Spatial Information Sciences, Volume XLII- 5, 2018 ISPRS TC V Mid-term Symposium “Geospatial Technology—Pixel to People”, Dehradun, India, 20–23 November 2018. [Google Scholar]
- Cesarano, G.; Zotti, M.; Antignani, V.; Marra, R.; Scala, F.; Bonanomi, G. Soil sickness and negative plant-soil feedback: A reappraisal of hypotheses. Plant Pathol. 2017, 99, 545–570. [Google Scholar]
- Di Gennaro, S.F.; Battiston, E.; Di Marco, S.; Facini, O.; Matese, A.; Nocentini, M.; Palliotti, A.; Mugnai, L. Unmanned Aerial Vehicle (UAV)-based remote sensing to monitor grapevine leaf stripe disease within a vineyard affected by esca complex. Phytopathol. Mediterr. 2016, 55, 262–275. [Google Scholar]
- Fantin, L.H.; de Souza Madureira Felício, A.L.; Braga, K.; Gaeta, G.M.; de França, J.A.; Canteri, M.G. Spectral characterization and quantification of Phakopsora pachyrhizi urediniospores by Fourier transformed infrared with attenuated total reflectance. Eur. Plant Pathol. 2019, 154, 1149–1157. [Google Scholar] [CrossRef]
- Wei, X.; Johnson, M.A.; Langston, D.B.; Mehl, H.L.; Li, S. Identifying optimal wavelengths as disease signatures using hyperspectral sensor and machine learning. Remote Sens. 2021, 13, 2833. [Google Scholar] [CrossRef]
- Soca-Muñoz, J.L.; Rodríguez-Machado, E.; Aday-Díaz, O.; Hernández-Santana, L.; Orozco-Morales, R. Spectral signature of brown rust and orange rust in sugarcane. Rev. Fac. Ing. Univ. Antioq. 2020, 96, 9–20. [Google Scholar]
- Żelazny, W.R.; Chrpová, J.; Hamouz, P. Fusarium head blight detection from spectral measurements in a field phenotyping setting—A pre-registered study. Biosyst. Eng. 2021, 211, 97–113. [Google Scholar] [CrossRef]
- Cordon, G.; Andrade, C.; Barbara, L.; Romero, A.M. Early detection of tomato bacterial canker by reflectance indices. Inf. Process. Agric. 2021, in press. [Google Scholar] [CrossRef]
- Mirandilla, J.R.F.; Paringit, E.C. Detection and differentiation of selected rice diseases using hyperspectral data. In Proceedings of the 40th Asian Conference on Remote Sensing (ACRS 2019), Daejeon, Korea, 14–18 October 2019; Daejeon Convention Center(DCC): Daejeon, Korea, 2019. [Google Scholar]
- de Oliveira Pires, M.S.; de Carvalho Alves, M.; Pozza, E.A. Multispectral radiometric characterization of coffee rust epidemic in different irrigation management systems. Int. J. Appl. Earth Obs. Geoinf. 2020, 86, 102016. [Google Scholar] [CrossRef]
- Manganiello, G.; Nicastro, N.; Caputo, M.; Zaccardelli, M.; Cardi, T.; Pane, C. Functional hyperspectral imaging by high-related vegetation indices to track the wide-spectrum Trichoderma biocontrol activity against soil-borne diseases of baby-leaf vegetables. Front. Plant Sci. 2021, 12, 630059. [Google Scholar] [CrossRef]
- Areni, I.S. Mobile image processing application for CACAO’S fruits pest and disease attack using deep learning algorithm. ICIC Express Lett. 2020, 14, 1025–1032. [Google Scholar]
- Ko, C.H.; Ren, H.; Tsai, J.R.; Wang, B.J.; Lin, S.F.; Huang, C.H.; Hong, C.T.; Chiu, W.H. Agriculture Application with Airborne Hyperspectral Images from Two-Dimensional Concave Grating System. In Proceedings of the AIAA Scitech 2019 Forum, San Diego, CA, USA, 7–11 January 2019; Volume 1542. [Google Scholar]
- Che’Ya, N.; Gupta, M.; Doug, G.; Lisle, A.; Basnet, B.; Campbell, G. Spectral discrimination of weeds using hyperspectral radiometry. In Proceedings of the 5th Asian Conference on Precision Agriculture (ACPA), Jeju, Korea, 25–28 June 2013. [Google Scholar]
- Park, Y.; Jin, S.; Noda, I.; Jung, Y.M. Emerging developments in two-dimensional correlation spectroscopy (2D-COS). J. Mol. Struct. 2020, 1217, 128405. [Google Scholar] [CrossRef]
- Hassanzadeh, A.; Murphy, S.P.; Pethybridge, S.J.; van Aardt, J. Growth Stage Classification and Harvest Scheduling of Snap Bean Using Hyperspectral Sensing: A Greenhouse Study. Remote Sens. 2020, 12, 3809. [Google Scholar] [CrossRef]
- Contreras, I.C.; Khodadadzadeh, M.; Gloaguen, R. Multi-Label Classification for Drill-Core Hyperspectral Mineral Mapping. ISPRS Arch. Int. Arch. 2020, 43, 383–388. [Google Scholar] [CrossRef]
- Henson, Y.; Martin, R.; Quinnell, R.; Van Ogtrop, F.; Try, Y.; Tan, D. Development of a weed identifier mobile application for Cambodian rice farmers. In Proceedings of the 18th Australian Society of Agronomy Conference, Ballarat, Australia, 24–28 September 2017; pp. 1–4. [Google Scholar]
- Roslin, N.A.; Che’Ya, N.N.; Rosle, R.; Ismail, M.R. Smartphone Application Development for Rice Field Management through Aerial Imagery and Normalised Difference Vegetation Index (NDVI) Analysis. Pertanika J. Sci. Technol. 2021, 29, 809–836. [Google Scholar] [CrossRef]
- Abdulridha, J.; Ehsani, R.; De Castro, A. Detection and differentiation between laurel wilt disease, phytophthora disease, and salinity damage using a hyperspectral sensing technique. Agriculture 2016, 6, 56. [Google Scholar] [CrossRef] [Green Version]
- Rahman, M.; Blackwell, B.; Banerjee, N.; Saraswat, D. Smartphone-based hierarchical crowdsourcing for weed identification. Comput. Electron. Agric. 2015, 113, 14–23. [Google Scholar] [CrossRef]
- Haug, S.; Michaels, A.; Biber, P.; Ostermann, J. Plant classification system for crop/weed discrimination without segmentation. In Proceedings of the IEEE Winter Conference on Applications of Computer Vision, Steamboat Springs, CO, USA, 24–26 March 2014; pp. 1142–1149. [Google Scholar]
- Liu, H.; Shen, X.; Cao, L.; Yun, T.; Zhang, Z.; Fu, X.; Chen, X.; Liu, F. Deep Learning in Forest Structural Parameter Estimation Using Airborne LiDAR Data. IEEE J. Sel. Top Appl. Earth Obs. Remote Sens. 2020, 14, 1603–1618. [Google Scholar] [CrossRef]
- Buddenbaum, H.; Watt, M.S.; Scholten, R.C.; Hill, J. Preprocessing ground-based visible/near infrared imaging spectroscopy data affected by smile effects. Sensors 2019, 19, 1543. [Google Scholar] [CrossRef] [Green Version]
- Che’Ya, N.N. Site-Specific Weed Management Using Remote Sensing. Ph.D. Thesis, The University of Queensland, St Lucia, Australia, 2016. [Google Scholar]


| Name of Application | Function of Application | Country | Accuracy of Pest and/or Disease Identification | Reference |
|---|---|---|---|---|
| PlantifyAI | To diagnose 26 diseases across 14 crop species by offering treatment methods, common symptoms, and access to suggested cure treatments for each disease. | United States of America | Disease and crop classification: 95.7%. | Shrimali et al. [28] |
| Not mentioned | To identify and classify pests in images, extract characteristics of pests, and evaluate areas that prone to pests | Taiwan | Pest identification: 84%, and pest classification: 86% | Chen et al. [29] |
| Padi2U | To create a database of spectral signatures of weed species in rice fields | Malaysia | Weed separation species: 710 nm to 750 nm areas | Roslin et al. [30] |
| Mentha Mitra | To provide information about improved menthol mint types, nutrient requirements, diseases, and mechanisms for insect-pest control. | India | Not mentioned | Singh et al. [31] |
| Sistem Pakar Identifikasi Hama dan Penyakit Padi | To obtain a response from the user on the signs of pests and diseases that exist in rice | Indonesia | Not mentioned | Triono and Tristono [32] |
| e-RICE | To categorise the symptoms in order to make an accurate diagnosis of common rice diseases and problems. | Philippines | 4.29 rating by respondents agree that the app is functional in detecting disease | Morco et al. [33] |
| Dr Lada | To identify pests and diseases in peppers and propose appropriate techniques to solve the problem | Malaysia | Pest and disease diagnosis: 97% | Adama et al. [34] |
| PEST APP | To provide an early warning system on the infestation of the pest at early stages in paddy | Malaysia | Not mentioned | Nasir et al. [35] |
| Not mentioned | To identify the extend of cold-induced injuries in zucchini in real acquisition condition | Spain | Not mentioned | Novas et al. [36] |
| Leaf Analysis | To identify disease in different types of crop | Spain | Picon et al. [37] | |
| TobaccoApp | To detect any damage on tobacco leaf | Mexico | Damage caused by fungi: 97% | Valdez-Morones et al. [38] |
| Not mentioned | To control irrigation system and identify the images of plant leaf disease | India | Not mentioned | Ranjith et al. [39] |
| AuToDiDAC | To detect, separate, and assess the disease in cacao black pod rot | Philippines | Disease detection | Tan et al. [40] |
| cFertiGUAL | by calculating the amounts of fertiliser and monitoring irrigation systems, and select the best amongst the many crop growth systems and fertigation technologies | Spain | Disease detection: 97% | Pérez-Castro et al. [41] |
| FarmAR | To provide information about plants to farmers such as common name, scientific name of the plant, and plant diseases | Greece | Not mentioned | Katsaros and Keramopoulos [42] |
| Jaguza Livestock App | To improve the production and productivity of livestock by detecting livestock diseases and dealing with dangerous disease outbreaks. | Uganda | Not mentioned | Katamba and Mutebi [43] |
| BioLeaf | To quantify the foliar damage induced by insect herbivores on leaves | Brazil | Regular artificial damage: 25% and 50% of damaged area | Machado et al. [44] |
| Online at Sawah (OAS) | To detect diseases or pests that affect corn based on symptoms provided by users | Indonesia | Effectiveness: 82.5%, efficiency: 93.12%; learnability: 77.33%, and satisfaction: 73% | Simorangkir et al. [45] |
| Not mentioned | To identify the disease on wheat crop based on the detection of early symptom | Spain | Colour constancy algorithm of disease image: 0.81 | Johannes et al. [25] |
| Plant Disease | To diagnose plant disease with extensible set of diseases | Greece | Disease recognition: Between 80% and 98% | Petrellis [46] |
| Malay Language | English Language |
|---|---|
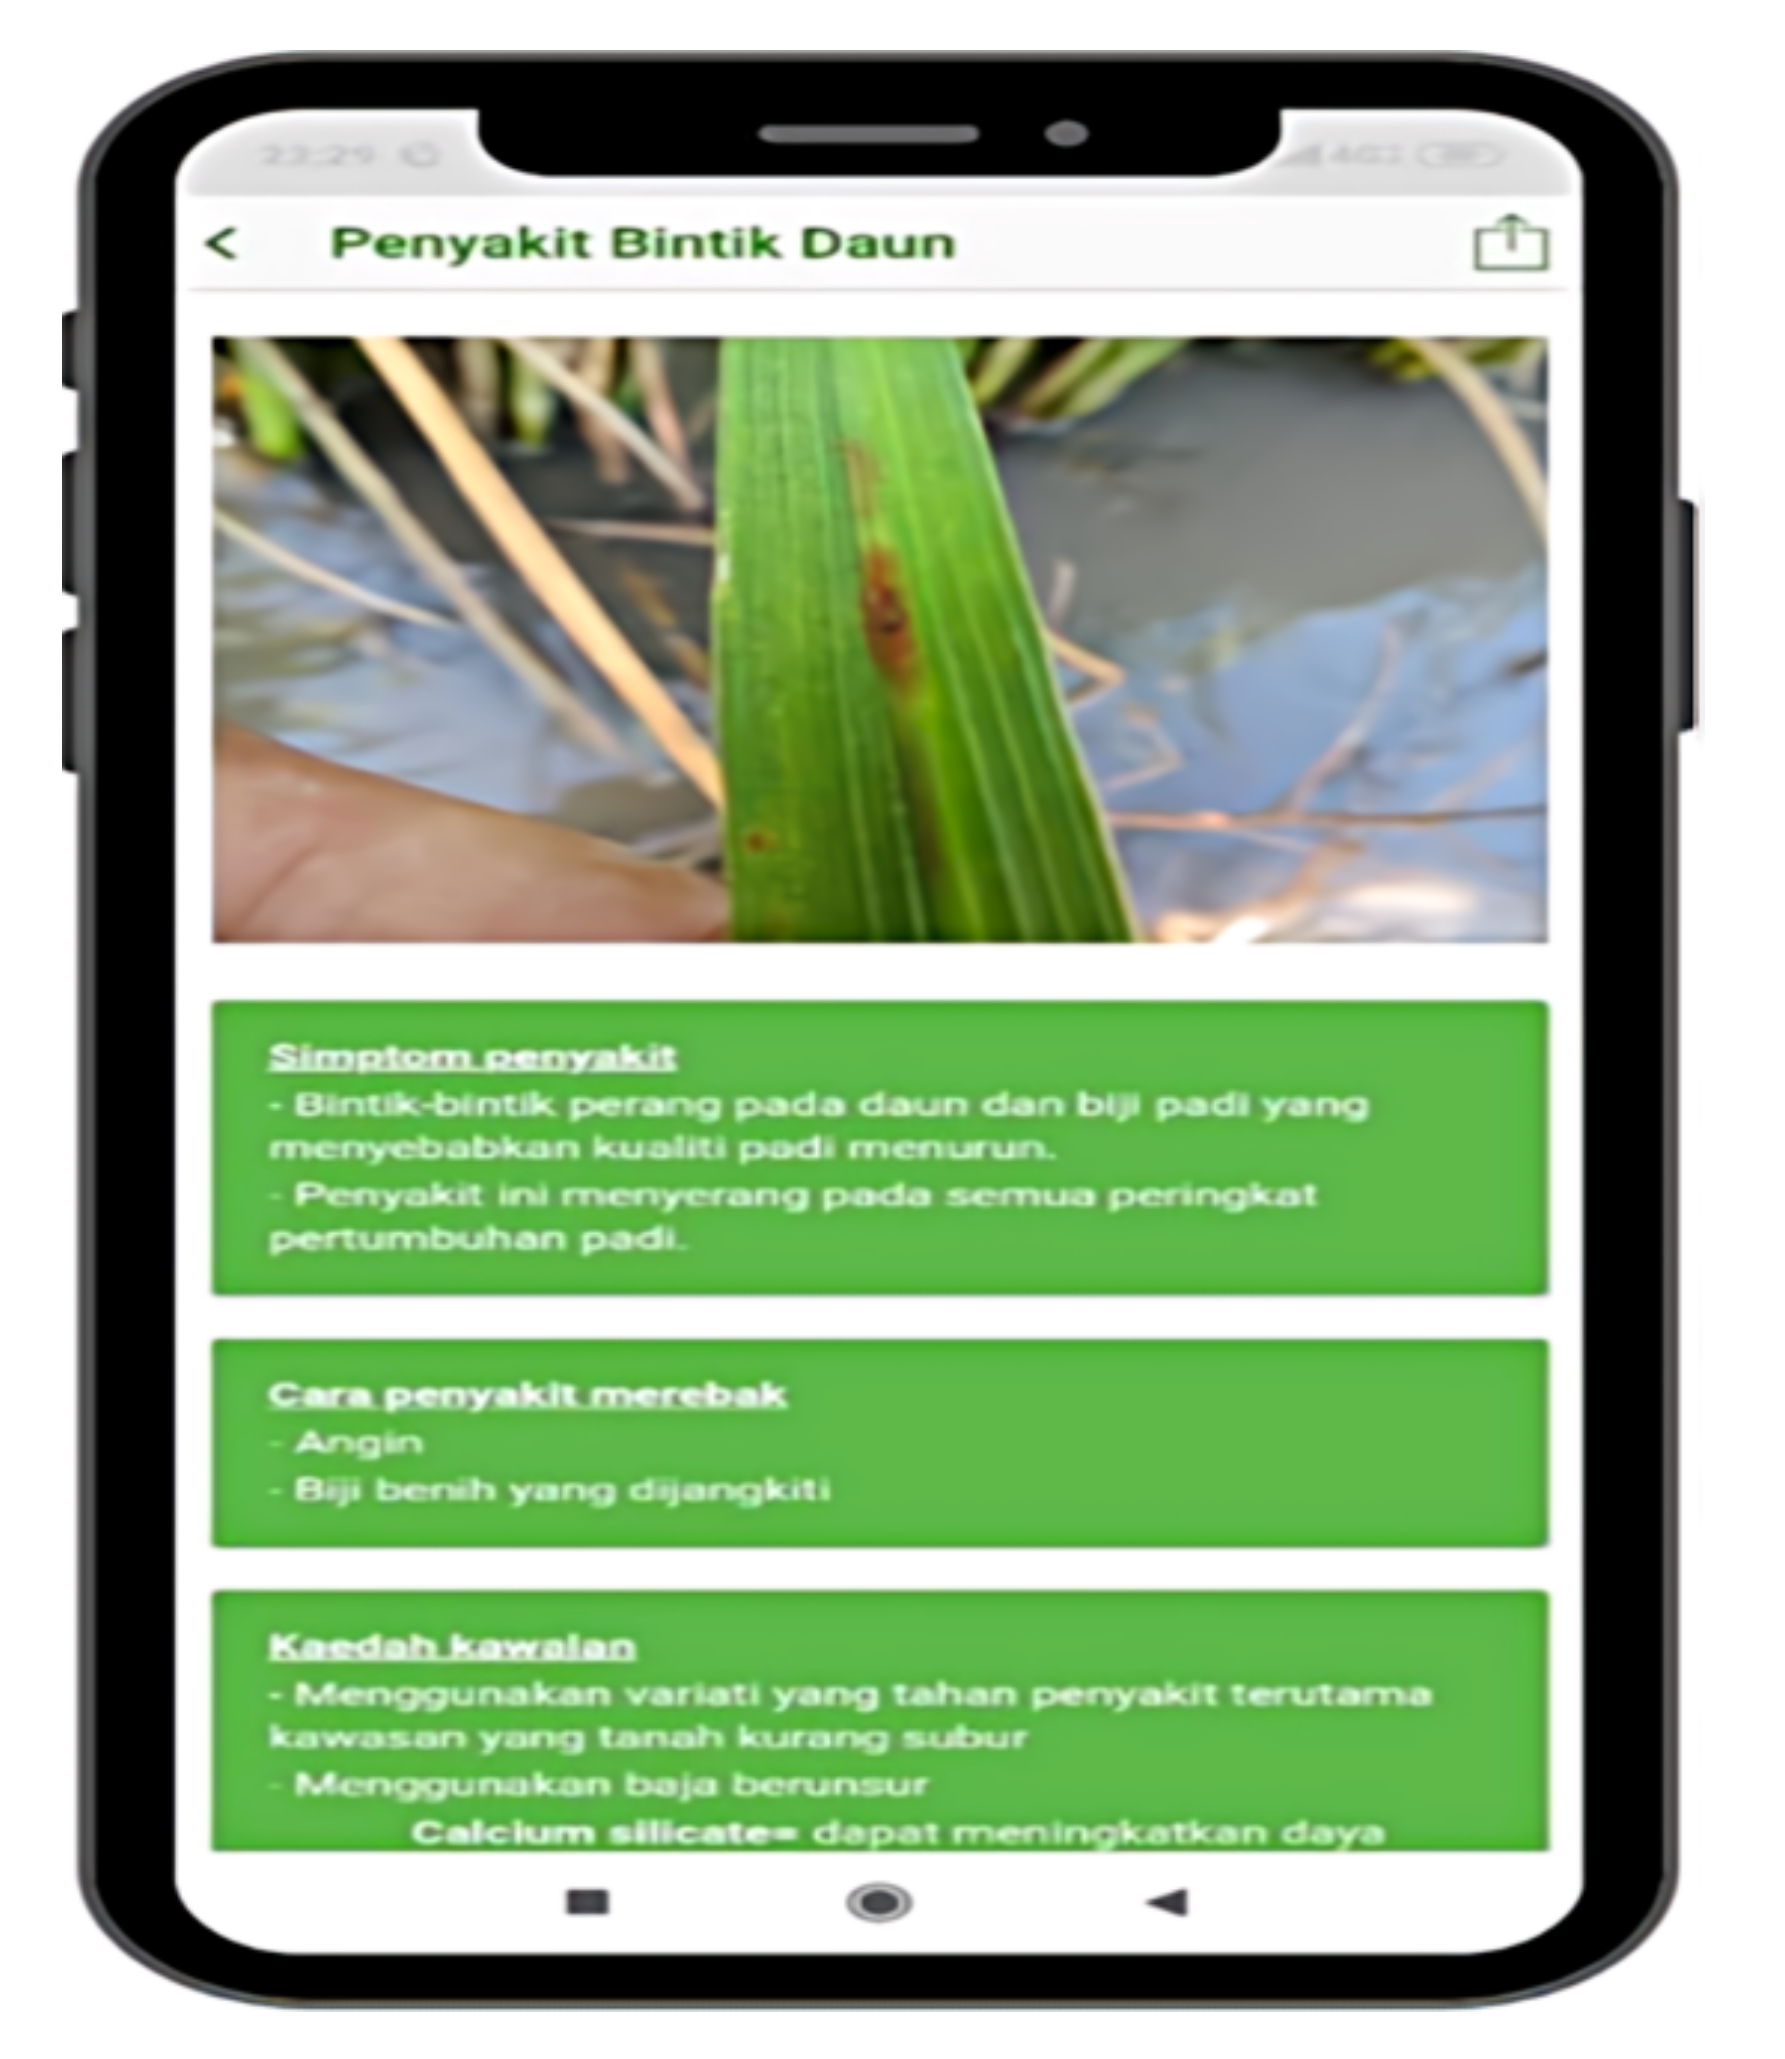
| Penyakit Bintik Daun | Lead spot disease |
| Simptom penyakit Bintik-bintik perang pada daun dan biji padi yang menyebabkan kualiti padi menurun. Penyakit ini menyerang pada semua peringkat pertumbuhan padi | Symptoms of the disease Brown spots on the leaves and seeds of rice that cause the decline of rice quality. The disease attacks at all stages of rice growth. |
| Cara penyakit merebak Angin Biji benih yang dijangkiti | Methods on the spread of disease Wind Infected seeds |
| Kaedah kawalan Menggunakan variati yang tahan penyakit terutama kawasan yang kurang subur. Menggunakan baja berunsur cancium sillicates | Control methods Using disease-resistant varieties in less fertile areas Using calcium silicates fertilizers |
| Previous Studies | Purpose | Research Findings |
|---|---|---|
| Fanti et al. [88] | To determine a spectral signature for the Asian soybean rust (Phakopsora pachyrhizi) and quantify the number of urediniospores in a water sample. | Phakopsora pachyrhizi’s spectral signature ranged from 1500 cm−1 to 1550 cm−1. The quantification yielded high values for calibration coefficients (R2 = 0.95), cross-validation coefficients (R2 = 0.93), and prediction coefficients (R2 = 0.92), demonstrating the accuracy of estimating the amount of urediniospores. |
| Wei et al. [89] | To select the optimal wavelengths to be used as disease spectral signatures in order to distinguish between healthy and diseased peanut infected with Athelia rolfsii. | Two or more feature selection methods were used to choose wavelengths of 501–505, 690–694, 763, and 884 nm. These wavelengths can be used to create optical sensors for automated stem rot detection in peanut fields. |
| Soca-Muñoz et al. [90] | To examine the spectral reflectance signatures of brown rust (Puccinia melanocephala) and orange rust (Puccinia ku-ehnii) in surgarcane. | The difference in reflectance among healthy and contaminated leaves in the red and near-infrared bands of the electromagnetic spectrum means it is able to determine contamination with both orange and brown rust by combinations of these bands. |
| Żelazny et al. [91] | To investigate the impact of spectrum pre-processing on the severity of Fusarium spp. head blight infection in winter wheat. | Milk-ripening phase predictions based on mean-aggregated spectra obtained at the same crop developmental stage can be beneficial through standard normal variate pre-processing. |
| Cordon et al. [92] | To develop indices based on the reflectance spectral signature of the plants for detecting tomato plants infected by bacterial canker before symptoms appear. | Three shortwave-infrared zone indices enabled the detection of bacterial canker-inoculated plants in a faster and non-destructive manner, up to one week before symptoms arose: Normalized Difference Water Index, Simple Ratio of Water Index, and Water Index 1 180 (WI1180). |
| Mirandilla et al. [93] | To differentiate the spectral responses of the three principal pests and diseases, blast, bacterial leaf blight, and rice tungro disease. | The three diseases are particularly sensitive to the red and red-edge ranges. As the disease progressed, NIR wavelengths were reduced. During the early stages of tungro, the yellow-orange region (550–620 nm) is highly sensitive. |
| de Oliveira et al. [94] | To investigate the spectral signature of rust incidence in the coffee field. | In the visible, SWIR-1, and SWIR-2 spectral regions, rainfed areas had higher reflectance values than irrigated areas during wet seasons. |
| Furlanetto et al. [67] | To create a procedure for early and reliable identification and differentiation of soybean under different levels of Asian rust disease according to spectral analysis. | The spectral signature of the leaves revealed a significant increase in reflectance of the vegetation indices region as disease levels increased, which was associated with a lower pigment concentration. More than 97.00% of the spectral variance in the first and second principal components, and the stepwise procedure selected from 87 spectral bands. |
| Manganiello et al. [95] | To detect the spectral signatures of R. solani-assayed wild rocket including green baby lettuce, red baby lettuce, and R. rolfsii and S. sclerotiorum. | OSAVI, SAVI, TSAVI, and TVI were found to be highly correlated to disease severity, are promising for all pathosystems analysed, and capable of tracking biological control activity against multiple soil-borne pathogens of baby leaf vegetables, based on significant changes in spectral signatures between healthy, infected, and bio-protected plants. |
| Menu | Details Information |
|---|---|
| Location | Research site, area of crop field, and total plot that being used for the research |
| Planting schedule | Planting activities |
| UAV images | Hyperspectral images |
| Field problems | Images of condition at the field |
| Pest and disease | List of pest and disease, its spectral signature graph, and suggestion of methods to control |
| Weather forecast | Weather condition at the field |
| Yield | Amount of harvested yield |
| Report | Farmers can use and send report about pest and disease |
Publisher’s Note: MDPI stays neutral with regard to jurisdictional claims in published maps and institutional affiliations. |
© 2022 by the authors. Licensee MDPI, Basel, Switzerland. This article is an open access article distributed under the terms and conditions of the Creative Commons Attribution (CC BY) license (https://creativecommons.org/licenses/by/4.0/).
Share and Cite
Che’Ya, N.N.; Mohidem, N.A.; Roslin, N.A.; Saberioon, M.; Tarmidi, M.Z.; Arif Shah, J.; Fazlil Ilahi, W.F.; Man, N. Mobile Computing for Pest and Disease Management Using Spectral Signature Analysis: A Review. Agronomy 2022, 12, 967. https://doi.org/10.3390/agronomy12040967
Che’Ya NN, Mohidem NA, Roslin NA, Saberioon M, Tarmidi MZ, Arif Shah J, Fazlil Ilahi WF, Man N. Mobile Computing for Pest and Disease Management Using Spectral Signature Analysis: A Review. Agronomy. 2022; 12(4):967. https://doi.org/10.3390/agronomy12040967
Chicago/Turabian StyleChe’Ya, Nik Norasma, Nur Adibah Mohidem, Nor Athirah Roslin, Mohammadmehdi Saberioon, Mohammad Zakri Tarmidi, Jasmin Arif Shah, Wan Fazilah Fazlil Ilahi, and Norsida Man. 2022. "Mobile Computing for Pest and Disease Management Using Spectral Signature Analysis: A Review" Agronomy 12, no. 4: 967. https://doi.org/10.3390/agronomy12040967