Article

Dynamics of Pyricularia oryzae Population Race Structures from 2003 to 2017 in Jiangsu Province, China

1
Institute of Plant Protection, Jiangsu Academy of Agricultural Science, Nanjing 210014, China
2
IRRI-JAAS Joint Laboratory, Jiangsu Academy of Agricultural Science, Nanjing 210014, China
3
Department of Plant Pathology, College of Plant Protection, Nanjing Agricultural University, Nanjing 210014, China
*
Author to whom correspondence should be addressed.
Agronomy 2022, 12(4), 956; https://doi.org/10.3390/agronomy12040956
Submission received: 24 March 2022 / Revised: 11 April 2022 / Accepted: 13 April 2022 / Published: 15 April 2022

Abstract

:
Rice blast, caused by Pyricularia oryzae, is one of the most destructive rice diseases worldwide. It is essential to understand the population structure and race distribution of P. oryzae for the prevention and control of rice blast. This study collected 1584 isolates across Jiangsu province from 2003 to 2017 to determine race diversity, common and dominant race structures, and resistance profiles using eight parameters from the Chinese differential cultivars (CDC) entries. Race diversity analysis indicated that the race diversity of 1584 isolates in Jiangsu province increased from 2003 to 2006 and fluctuated steadily from 2007 to 2017. Common race structure analysis showed that the common race structure of the isolates fluctuated wildly on an annual basis. Moreover, the race ZG1 was the dominant race, suggesting that the most commonly grown rice varieties in Jiangsu are highly adaptive to race ZG1. In addition, due to a higher level (>85%) of resistance to the population of isolates from 2003 to 2017, Tetep may be conformed as the most promising donor of blast resistance for resistance breeding in Jiangsu province. In summary, it is beneficial to control rice blast by continuous monitoring of the population structure and distribution of P. oryzae with the monogenic germplasm entries and by maintaining a diversity of rice varieties.

1. Introduction

Rice blast disease, caused by the heterothallic ascomycete fungus Pyricularia oryzae, is one of the most critical diseases impacting global rice production. It damages rice mainly through leaf and panicle neck blast and causes 10–30% of the world’s food loss each year [1,2,3,4]. The use of resistant rice varieties is one of the primary methods to control the disease [5]. However, the resistance phenotype can become weakened or lost after 3–5 years of field cultivation. It is generally accepted that there are two reasons for this phenomenon: the first is that pathogenic races of P. oryzae (also referred to as physiological races or pathotypes) used to screen resistant varieties cannot represent the dominant population in targeted regions; the second is that the selection pressure caused by large-scale planting of a single resistant variety drives changes in the race structures of P. oryzae populations [6,7,8,9]. In rice/P. oryzae interactions, the dynamics of host resistance and pathogenicity of P. oryzae can be explained through the classical gene-for-gene model, in which a plant resistance gene recognizes a single pathogen effector, which induces plant resistance [10,11]. Therefore, characterizing and monitoring the dynamics of population race structures of P. oryzae are imperative for the breeding and rational distribution of resistant rice varieties [12,13,14,15].
In 1980, a set of Chinese differential cultivars (CDCs) were screened including Tetep, Zhenlong 13, Sifeng 43, Dongnong 363, Kanto 51, Hejiang 18, and Lijiangxintuanheigu (LTH) [16]; the P. oryzae isolates can be divided into seven groups (race ZA/ZB/ZC/ZD/ZE/ZF/ZG) based on the pathogenicity on the seven varieties of the CDC set, and the naming rules are elaborated in the materials and methods. In China, races ZA and ZB were dominant in populations of all rice-growing regions, race ZC was found in southern China, races ZD, ZE, and ZF were dominant in northern regions, and race ZG was dominant in eastern China [17]. Broad production areas and different climatic conditions, cultivation systems, and rice varieties employed are drivers of the genetic diversity of P. oryzae populations in China.
Jiangsu province is a major rice-growing region in China, with a perennial planting area of more than 2.1 million hectares (6.93% of the national rice production area); rice blast occurred in areas ranging from 0.5 million hectares (2017) to 1.3 million hectares (2015) (data from Jiangsu Plant Protection Station). In a previous study, we monitored the population structures of P. oryzae in Jiangsu from 2001 to 2010 using seven cultivars from the CDCs, and the ZG1 race occurred most frequently [18]. This study focuses on characterizing the dynamic behavior of the P. oryzae population in Jiangsu with four aspects: race diversity, common race structure, dominant race structure, and resistance gene structure. A total of 1584 monoconidial isolates were collected in Jiangsu from 2003 to 2017; all isolates were tested for pathogenicity using the set of Chinese differential cultivars and the races were identified.

2. Materials and Methods

2.1. Collection of Monoconidial Isolates

Diseased rice panicles were collected from farmers’ fields in eleven cities in Jiangsu province from 2003 to 2017 (no diseased samples in 2008), including northern Jiangsu (Xuzhou, Yancheng, Huai’an, and Lianyungang) and mid-southern Jiangsu (Nanjing, Suzhou, Changzhou, Nantong, and Yangzhou). Diseased rice panicles were collected in early October and samples were stored in separate brown paper envelopes and brought back to the laboratory for isolation of P. oryzae according to previously established methods [19].
Monoconidial isolate assays were performed as previously described [19]. To isolate P. oryzae from infected necks, the typical blast lesions were excised, washed with ddH2O (double distilled water) for 2 min, then soaked in 75% ethanol for 1 min, washed with ddH2O for 2 min, and then grown on moisturizing sterilized filter paper at 25 °C for 20 h in the dark. Single spores were selected by needle under a microscope (Nikon Eclipse 50i) and placed on 2% water agar. After 24 h of culture at 25 °C, germinating spores were transferred to a potato dextrose agar (PDA) medium. In total, 1584 monoconidial isolates were cultured on PDA medium at 28 °C.

2.2. Plant Infection Assays and Disease Assessments

For conidiation of P. oryzae, strain blocks were maintained on straw decoction and corn agar medium (SDC) (100 g of rice straw decoction was boiled in 1 L of ddH2O for 20 min and filtered, and the filtrate was mixed with 40 g of cornmeal and 15 g of agar and adjusted to 1 L with ddH2O). The mixture was incubated at 28 °C for 7 d in the dark, after which aerial hyphae were scraped off, and the remaining mixture was maintained for 3 d with continuous illumination under a black light [20].
For plant infection assays, conidia of each isolate were suspended at a concentration of 5 × 10⁴ spores/mL in a 0.2% (w/v) gelatin solution, and 5 mL was sprayed on 20 approximately two-week-old rice seedlings of the CDC entries including three indica-type and four japonica-type entries. The inoculated plants were kept in the dark for 24 h at 25 °C with 100% relative humidity and then moved to a growth room with a 16 h light:8 h dark cycle. The disease severity was assessed 7 d after inoculation. Inoculation of each CDC entry with each isolate was repeated three times in independent inoculations [20].
The rice leaf blast reactions were scored using the following numerical scale (0 to 2: resistant; 3 to 5: susceptible) (Figure S1) [21]. In cases of the inconsistency of three repetitions, the highest score was recorded as an assessment of the host reaction.

2.3. Race Identification

The CDC set contained three indica-type entries (cultivars Tetep (A64), Zhenong 13 (B32), and Sifeng 43 (C16)) along with four japonica-type entries (cultivars Dongnong 363 (D8), Kando 51 (E4), Hejiang 18 (F2), and Lijiangxintuanheigu LTH (G1)). Each of the seven CDC entries was assigned a race code, combining both an alphabetical component and a numerical component. During the race numbering, the alphabet of the first susceptible rice variety is the group number, and the race number is found by adding 1 to the sum of the corresponding numbers of all the resistant rice varieties following the susceptible variety. For example, the pathogenic reaction of one isolate on the CDC entry (from A to G) is RSRSSRS; according to the above naming convention, the isolate belongs to race B, and named B16 + 2 + 1, B19 [16].

2.4. Data Analysis

A total of 1584 isolates were tested for pathogenicity against the CDC entries (Table S1). Race structure characteristics were analyzed using the methods of Zhang et al., which include four aspects and eight parameters [22] (Zhang et al., 2019). Four aspects contain race diversity, common race structure, dominant race structure, and resistance gene structure, and the eight parameters are the race diversity index hrdi, the total race frequency ftr, the population common race isolate frequency fpcr, the population common race isolate frequency fpcri, the total population common race isolate frequency ftpcri, top one race isolate frequency ftri, the cultivar resistance frequency fCR, and the total cultivar resistance frequency fTCR (Table S2).
To test a hypothesis that the race structure has not changed in 14 years in Jiangsu province, the Chi-square analysis (χ2) was applied to compare three key parameter (ftr, ftpcri, and ftri) of 14 years using the SPSS 20.

3. Results

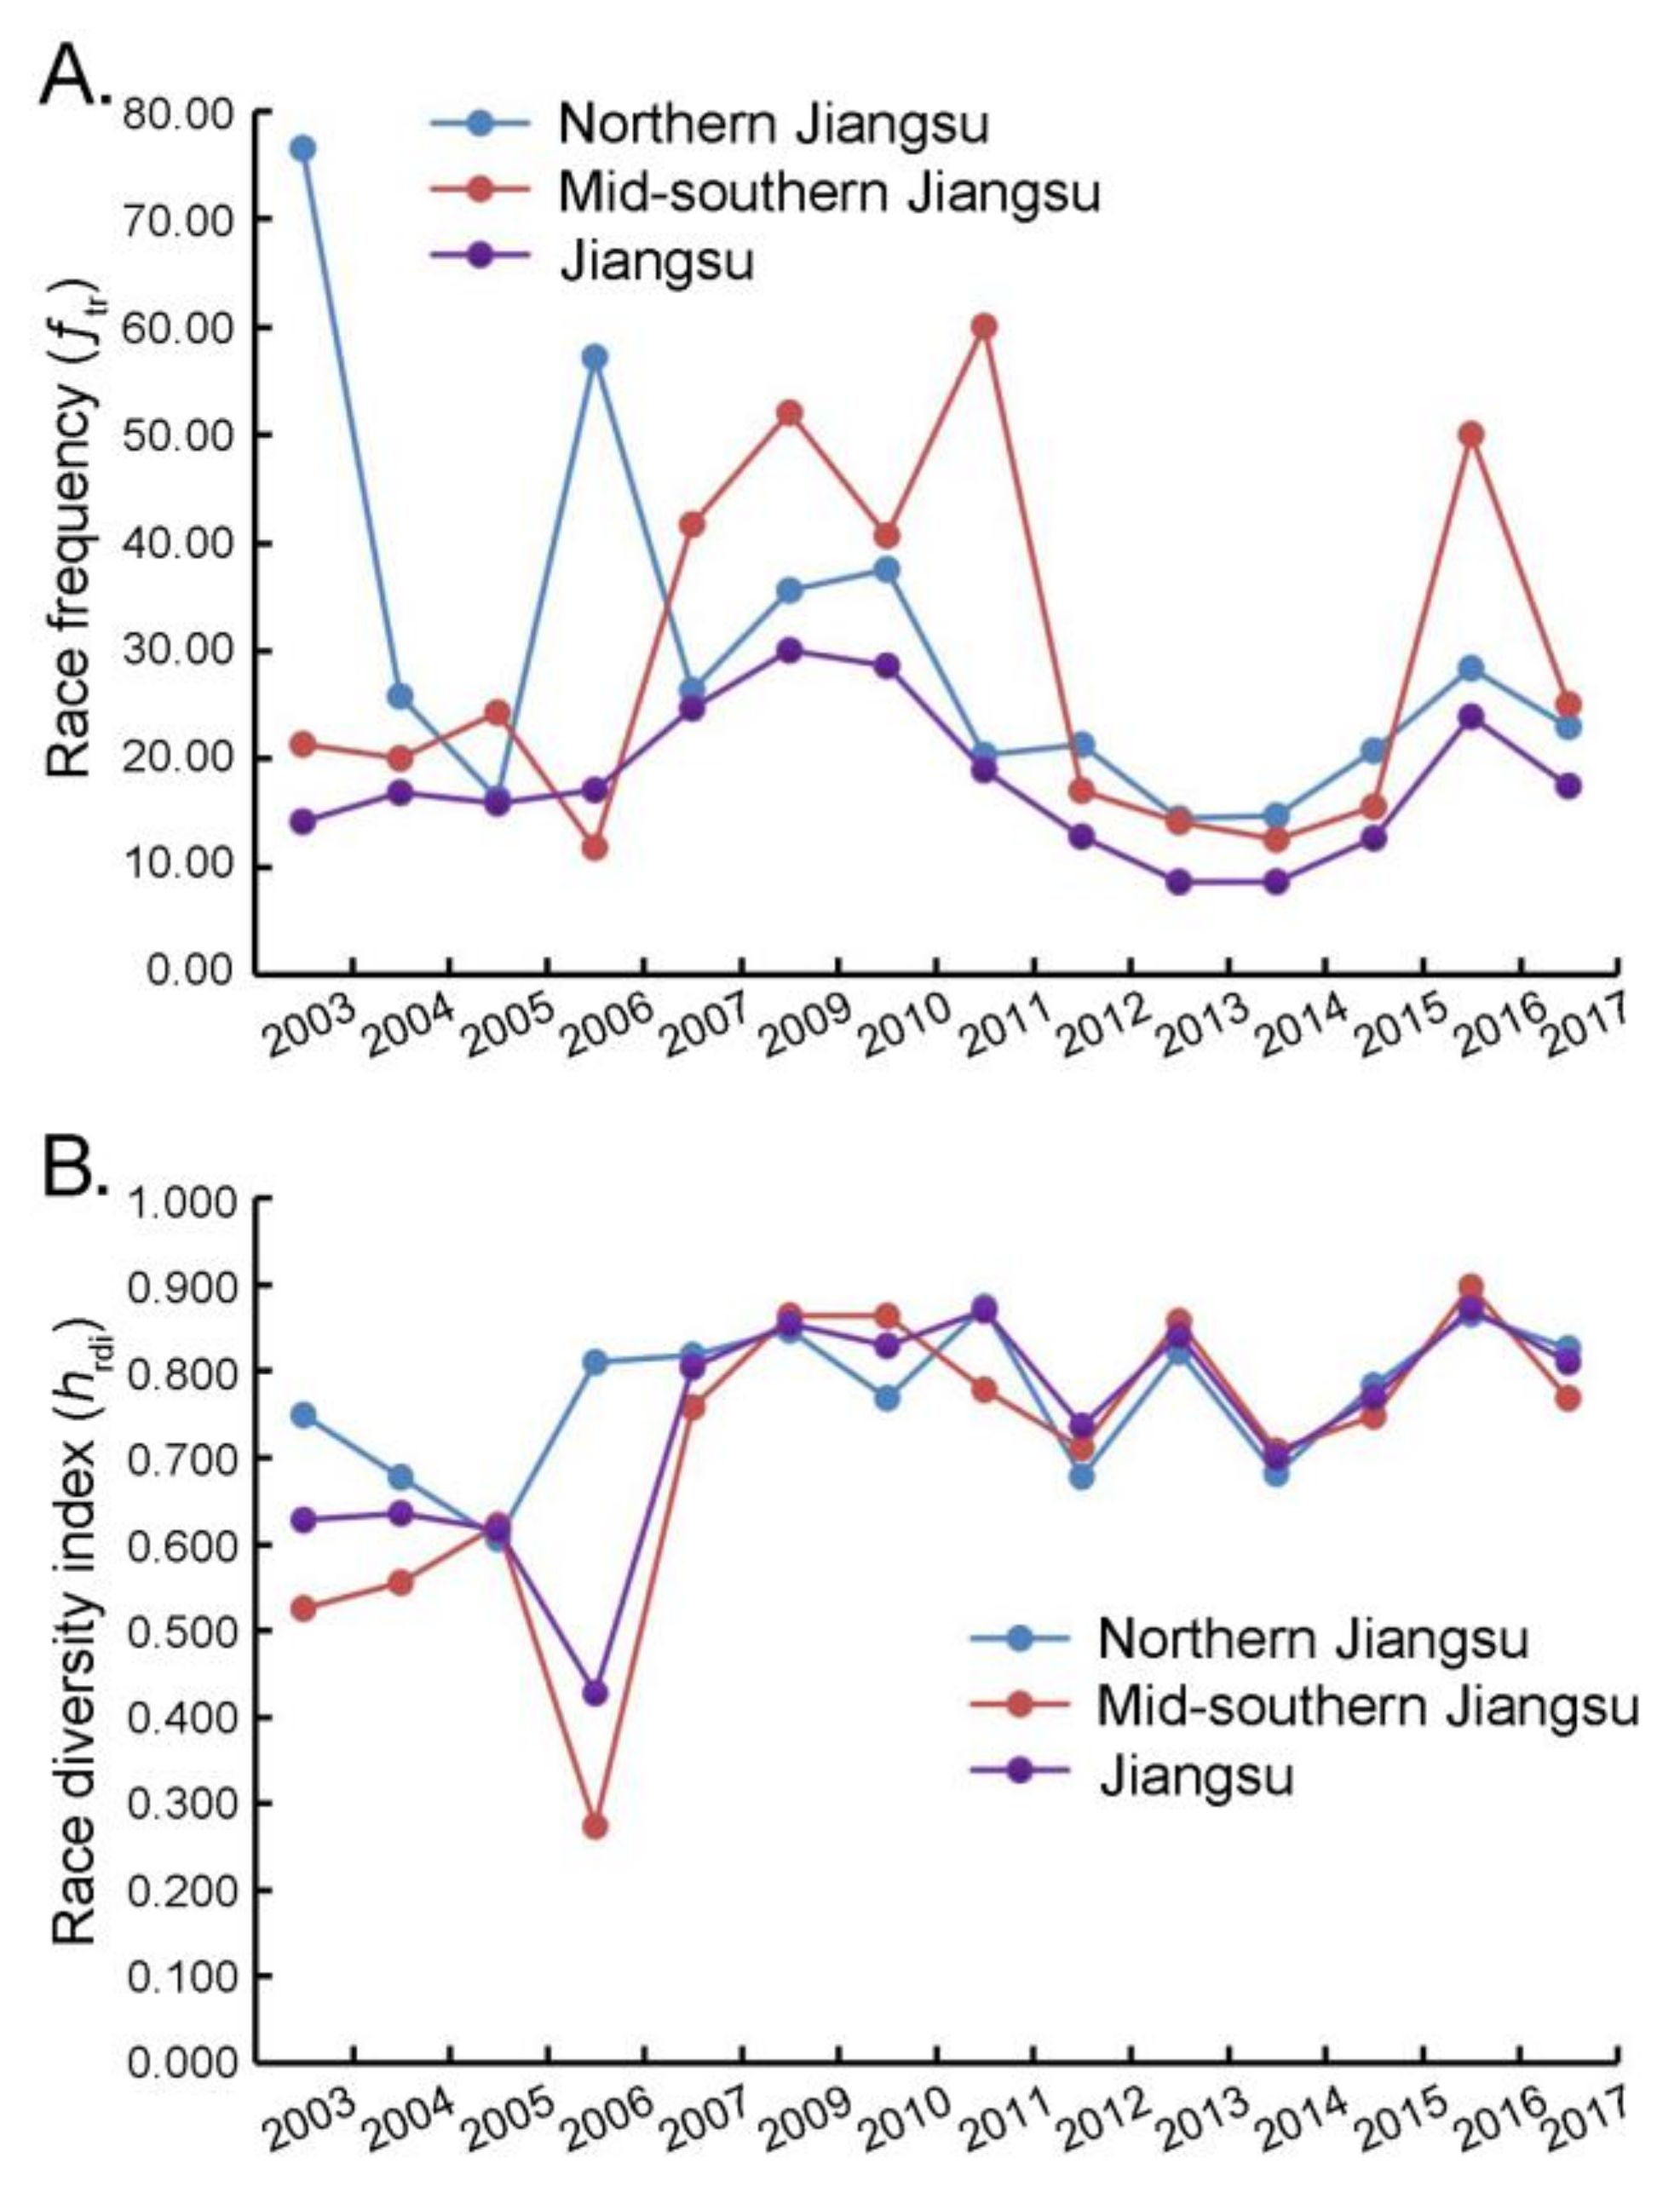
3.1. Race Diversity of P. oryzae in Jiangsu Province

From 2003 to 2017, we obtained information about the P. oryzae races in Jiangsu province over 14 years (no isolates in 2008). The race frequency increased slowly from 2003 to 2009, peaking in 2009 (featuring an ƒtr value of 30%), then declined, reaching the lowest frequency in 2013, followed by a slight increase in the following years. The Chi-square analysis indicated that the race frequency changed significantly from 2003 to 2017 (Figure 1A, Table 1). However, the race diversity index was not consistent with race frequency. From 2003 to 2006, the hrdi values decreased, reaching their lowest point in 2006 (featuring hrdi values of 0.427), and the diversity index fluctuated steadily from 2007 to 2017 (Figure 1B, Table 1). Both trends of race frequency and the race diversity index in Jiangsu were similar between the mid-southern (2003–3006) and northern (2007–2017) regions (Figure 1, Table 1 and Table S3). These results indicated that race diversity decreased from 2003 to 2006, followed by steady fluctuations between 2007 to 2017; moreover, the race frequency and diversity were not consistent.

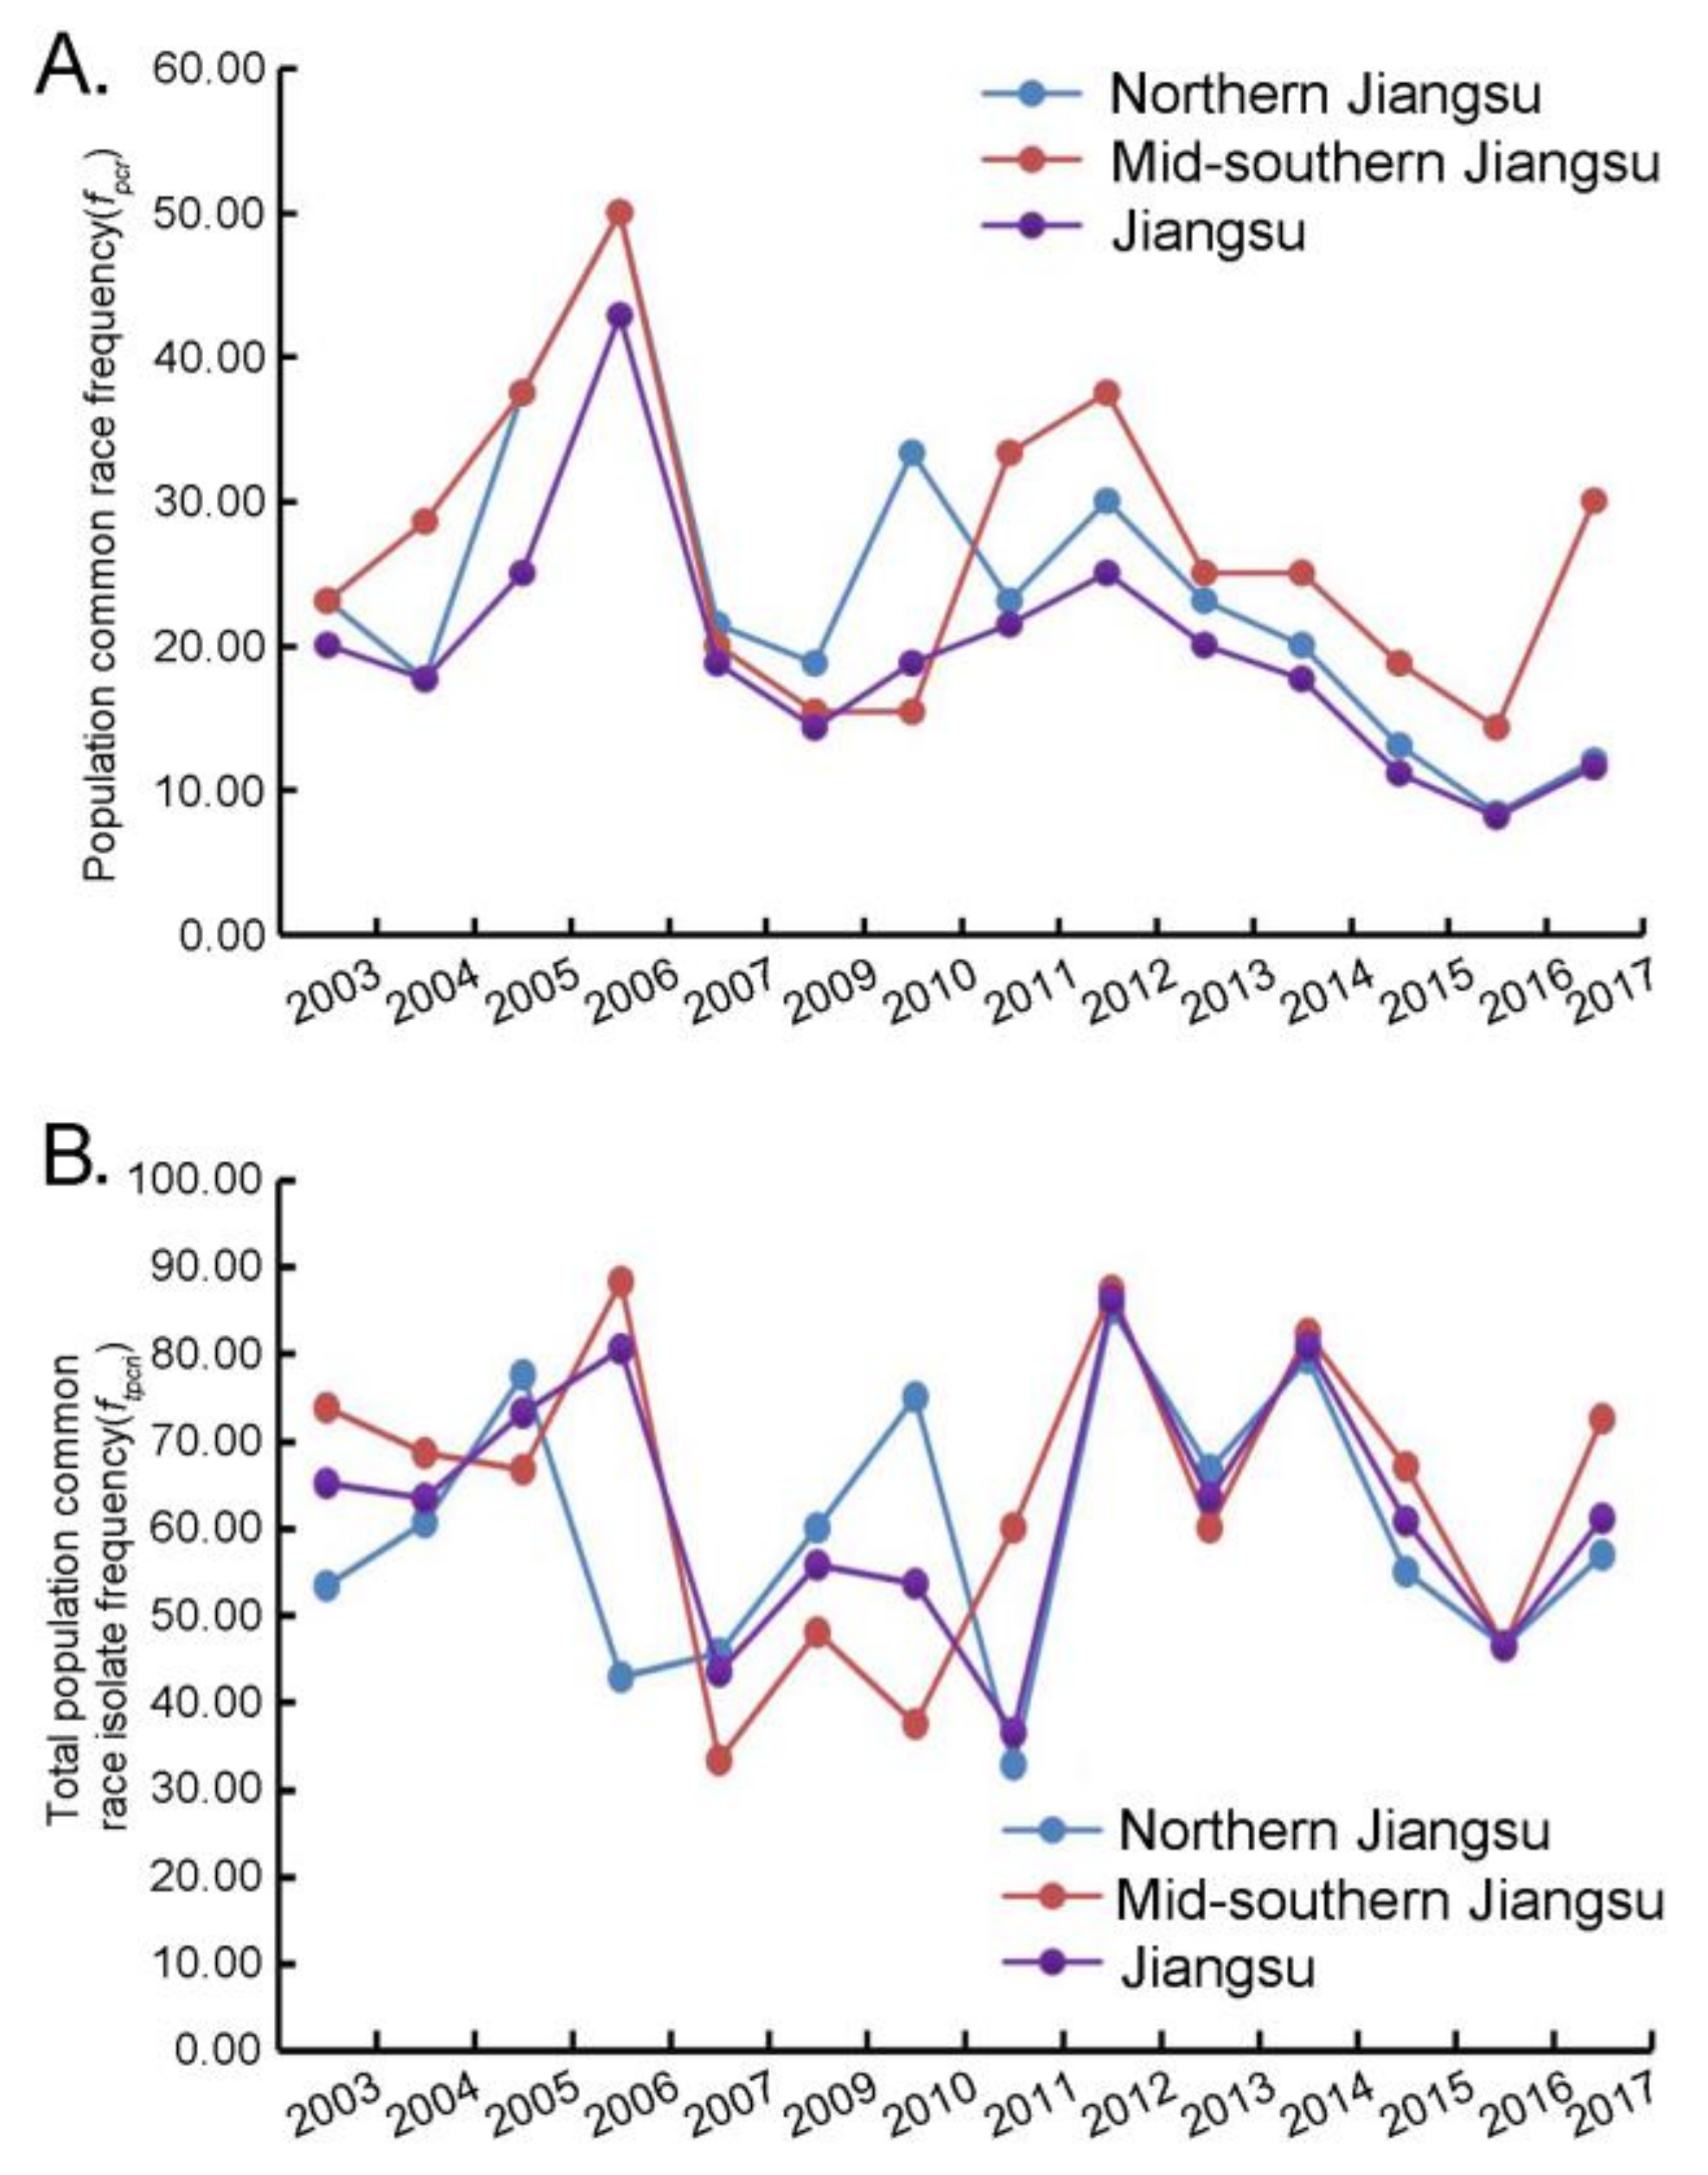
3.2. Common Race Structure in Jiangsu Province

From 2003 to 2017, three races (ZB15, ZC15, and ZG1) were identified as being represented in all populations, leading to estimated ƒpcr values from 8.11% (2016) to 42.86% (2006) (Table 2). The trend of ƒpcr values declined slowly from 2007 to 2017, indicating that P. oryzae races in Jiangsu were more complex within this decade. In addition, ƒpcr values for the set of shared races varied from 1.35% (ZB15 in 2011) to 75.61% (ZG1 in 2006). The estimated ƒpcr values ranged from 36.49% (2011) to 86.17% (2012), which were at a lower level from 2007 to 2011, and fluctuated wildly from 2012 to 2017 (Figure 2, Table 2), suggesting that the common race structure fluctuated greatly on an annual basis. However, the trends of the two parameters of the northern and mid-southern Jiangsu regions were similar (Table S4). Moreover, the Chi-square analysis indicated that the total population common race isolate frequency changed significantly from 2003 to 2017.

3.3. Dominant Race Structure in Jiangsu Province

From 2003 to 2017, ZG1 was the dominant race in Jiangsu province, and ZD1 exhibited the same frequency (21.62%) as ZG1 in 2011 (Table 3). Moreover, ZB13 and ZD1 emerged as the dominant races in 2006 and 2011 in northern Jiangsu, while ZF1 and ZC15 were the dominant races in 2007, 2012, and 2014 (Table 3). Overall, the proportion of dominant races was high from 2003 to 2006, then significantly declined in 2007, and stabilized to relatively low levels from 2007 to 2017. From 2004 to 2006, the trend of ftri values of northern Jiangsu was consistent with that of Jiangsu, while from 2007 to 2017, the trend of mid-southern Jiangsu was close to that of Jiangsu (Table 3). Considering the entire decade, only a few P. oryzae races were dominant, the proportions of which increased from 2003 to 2006, then stabilized at relatively low levels from 2007 to 2017, and the Chi-square analysis suggested that the dominant race frequency changed significantly from 2003 to 2017.

3.4. Rice Resistance Structure in Jiangsu Province

There are 13 known resistance genes in seven cultivars, including three indica types and four japonica types [23]. In Jiangsu, Tetep showed a greater level of resistance than other entries, whereas Sifeng 43 expressed a lower level of resistance than others (Table 4), implying that the combination of the resistance genes Pi1, Pi4, Pi54, Pid3, Pita, and Pi5 imparted a superior level of resistance. Zhenlong 13 was more resistant when challenged by isolates from 2005, 2006, 2011, and 2014 than when challenged by isolates from other years, and similar results were found in northern Jiangsu (Table 4 and Table S5). However, Sifeng 43 exhibited a stronger resistance phenotype when challenged by isolates from 2004–2007 and 2011 in mid-southern Jiangsu than others in Jiangsu and northern Jiangsu (Table S5). Among the japonica types, LTH was susceptible to all P. oryzae isolates. Dongnong 363 was more resistant to isolates from most years than Zhenlong 13, which reflected the presence of unknown resistance genes other than ε in Dongnong 363 (Table 4). In conclusion, the resistance levels of the CDC entries to P. oryzae isolates from Jiangsu and northern Jiangsu were relatively high compared with those from mid-southern Jiangsu, except for Tetep (Table S5).

4. Discussion

Understanding and accurately monitoring the dynamic behavior of the race structure of P. oryzae populations from different rice-growing regions in real-time is critical for precise resistance breeding in rice, rational distribution of resistant varieties, long-term and effective prevention, and overall control of rice blast disease. There are several differential virulent entries of blast fungus used worldwide, including the DVs (differential varieties) composed of 12 single genes [24], the Chinese differential cultivars, the 31 monogenic lines [25], and the DVs containing 24 major R genes [26]. In this study, a total of 1584 P. oryzae isolates were collected from Jiangsu province. The population structure, including race diversity, common and dominant race structure, and resistance structure were analyzed using the Chinese differential cultivars (CDC) entries. We found that the race diversity fluctuated, the dominant race was stable, and the resistance composition of the CDC set in 14 years reacted differently.
Zhang et al. reported that the number of rice cultivars grown in Heilongjiang province was the principal factor driving changes in the race structure of P. oryzae populations [22]. In Jiangsu province, there were 213 rice varieties approved for cultivation from 2003 to 2017, and 80 rice varieties were planted in Jiangsu in 2005 [27]; the numbers increased to 107 and 224 by 2010 and 2017, respectively, which included 127 in northern Jiangsu and 97 in mid-southern Jiangsu (data from Jiangsu Seed Management Station). In this study, we found that the race diversity index was not consistent with race frequency, which was presumably due to the number of isolates and the equitability of race in one year, so the race diversity index is appropriate to assess the race diversity of the P. oryzae population. Moreover, the race diversity from 2003 to 2006 decreased, and continuous fluctuations were observed from 2007 to 2017. No increases in race diversity from 2010 to 2017 were observed. We speculated that the number of rice cultivars plays a role in race diversity, but there were other reasons, such as the high homogeneity (same resistance genes) of rice varieties [23]. In the United States, a total of 1022 isolates collected from 1959 to 2015 were analyzed for pathogenicity against eight international rice cultivars, the results of which suggested that hosts are a driving force for the genetic variability of P. oryzae isolates [7]. Moreover, the genetic variability of P. oryzae isolates is also related to sexual reproduction [28,29], and we found sexual reproduction affects the genetic diversity and dissemination of P. oryzae in Jiangsu in a previous study [19].
Three common races (ZB15, ZC15, and ZG1) appeared in Jiangsu rice-producing regions from 2003 to 2017, which were different from the dominant races (ZD1, ZD3, ZD5, and ZE1) in Heilongjiang province [22]. The frequency of the common isolates in Jiangsu was low in all 14 years (8.11% to 42.86%), but the total frequency of the common races was high (36.49% to 86.17%), indicating that the number of common race isolates was larger than that of other races. Moreover, annually, the frequency of race ZG1 was the highest for all races, making ZG1 the dominant race in Jiangsu. Similar results were found in the main rice-producing areas of Hubei, Hunan, Yunnan, and Guangxi provinces, while five other races dominated in other rice-growing regions of China [17]. A possible explanation for this is that the main rice varieties in Jiangsu are highly susceptible to race ZG1, and the main rice varieties contain some of the same resistance genes (the distribution frequency of resistance genes Pish, Pit, Pia, Pi1 and Pib in 120 main rice varieties were 100.00%, 95.83%, 80.83%, 70.83%, and 70.83%, respectively; data not published). However, large-scale production of highly homogeneous rice varieties will lead to the occurrence of a targeted and highly virulent P. oryzae population and increase the risk of losing resistant rice varieties and experiencing rice blast outbreaks. In addition, the top race isolate frequency (ftri) decreased after 2006, and one possible explanation is the increasing number of other races, especially ZB15 and ZC15, also reflected the increase in race diversity after 2006.
It is well known that using the resistant rice varieties is the most economical and effective control measure to control the occurrence of and damage caused by the rice blast pathogen [20]. In this study, we found that the effective resistance frequency of the Tetep cultivar was highest among all tested cultivars from 2003 to 2017, indicating that most P. oryzae isolates were non-pathogenic against this cultivar. It is also known that the Tetep cultivar contains some resistance genes such as Pi1, Pi4, Pi54, Pid3, Pia, Pita, and Pi5 [23], which are primarily responsible for resistance in indica (Pid3, Pi54, Pi5, and Pi1) and japonica-type (Pita and Pia) accessions. In addition, the Sifeng43 cultivar exhibited reduced resistance compared with other entries, and harbored the Pib, Pia, Pi9, Pb1, and α resistance genes. These results revealed that the Pi54, Pi1, and Pi5 genes in indica rice conferred effective resistance against P. oryzae. On the other hand, the resistance frequency of three rice cultivars (Dongnong 363, Kando 51, and Hejiang 18) varied each year, sometimes dramatically, demonstrating that it can be difficult to predict suitable resistance genes for japonica rice variety in Jiangsu.
The monogenic germplasm entries [30] have been widely used in recent years, and the resistance frequency of a certain resistance gene can be accurately connected to the pathogenicity of P. oryzae isolates in a certain region. In Japan, 16 resistance genes varied in their effectiveness against Japanese populations of P. oryzae, with the Pit gene exhibiting resistance against all tested isolates [13]. In China, four resistance genes Pi1, Pik, Pik m, and Piz are appropriate for rice breeding in Guangdong and Hunan provinces, while Pik and Pib genes are specifically used in Liaoning and Heilongjiang provinces [31]. Pi9 and Pi5 could be employed in cultivation areas that grow indica and japonica rice, but Pik-h, Pita-2, Piz-5, Pita, and Piz genes can only be used in indica rice-growing areas, and Piz-t and Pi20 genes in japonica rice growing areas in Yunnan province [30]. In Jiangsu province, the resistance genes Pii, Pi54 (Pik-h), Pi5, Piz-5, and Piz showed higher resistance frequencies to rice blast based on the pathogenicity of isolates from 2019 [19]. Similarly, Pi54 and Pi5 in Tetep provided stronger resistance against P. oryzae within the CDC entries. These results suggest that the efficacy of dominant resistance genes varies by the rice cultivation region in which they are employed, and that optimum resistance genes are different between different rice cultivars.

5. Conclusions

In this research, we analyzed the dynamic behavior of the P. oryzae population in Jiangsu from 2003 to 2017 and found that race diversity fluctuated and race ZG1 was the dominant race, which was stable. In addition, the variety Tetep showed higher resistance to all populations in 2003 to 2017, which may be a potential resistance source for resistance breeding in Jiangsu province. These results are useful for us to have a better understanding of the population structure of blast fungus and provide excellent germplasm for resistance breeding. However, as the CDC set contains multiple resistance genes, we cannot obtain the distribution of avirulence genes in Jiangsu province. Therefore, we will employ continuous monitoring of the population structures and distribution of avirulence genes using the DVs including 24 major resistance genes.

Supplementary Materials

The following supporting information can be downloaded at: https://www.mdpi.com/article/10.3390/agronomy12040956/s1, Figure S1: The schematic diagram of leaf blast classification; Table S1: Race designation of isolates of P. oryzae collected in Jiangsu province from 2003 to 2017 was tested with CDC entries; Table S2: Parameters used for characterization of race and resistance structures in this study; Table S3: Race diversity of 14 populations of P. oryzae in northern and mid-southern Jiangsu from 2003 to 2017 was tested with CDC entries; Table S4: Common races of P. oryzae in 14 populations of isolates in northern and mid-southern Jiangsu from 2003 to 2017; Table S5: Resistance genes and resistance frequency of a set of CDC entries that were challenged with isolates collected in northern and mid-southern Jiangsu from 2003 to 2017.

Author Contributions

Writing—first draft preparation, Z.Q., Y.D. and M.L.; Writing—review and editing, Z.Q., J.Y., R.Z., M.Y., H.C., T.S., X.P., D.L. and Y.L.; Funding acquisition, Y.L. and Z.Q.; and Figures and Tables, Z.Q. All authors have read and agreed to the published version of the manuscript.

Funding

We acknowledge Jiangsu Agriculture Science and Technology Innovation Foundation grant CX19(1008); Funding from National Natural Science Foundation of China grants 31861143011 and 31871921; Jiangsu Modern Agricultural Technology System of Rice and Wheat Industry JAST (2021) 271. Exploratory Innovation Project of Jiangsu Academy of Agricultural Sciences ZX(21)1213.

Institutional Review Board Statement

Not applicable.

Informed Consent Statement

Not applicable.

Data Availability Statement

Data sharing not applicable.

Conflicts of Interest

The authors declare no conflict of interest.

References

  1. Couch, B.C.; Kohn, L.M. A multilocus gene geneology concordant with host preference indicates segregation of a new species, Magnaporthe oryzae, from Magnaporthe grisea. Mycologia 2002, 94, 683–693. [Google Scholar] [CrossRef] [PubMed]
  2. Deng, Y.; Zhai, K.; Xie, Z.; Yang, D.; Zhu, X.; Liu, J.; Wang, X.; Qin, P.; Yang, Y.; Zhang, G.; et al. Epigenetic regulation of antagonistic receptors confers rice blast resistance with yield balance. Science 2017, 355, 962–965. [Google Scholar] [CrossRef] [PubMed]
  3. Singh, W.H.; Kapila, R.K.; Sharma, T.R.; Rathour, R. Genetic and physical mapping of a new allele of Pik locus from japonica rice ‘Lijiangxintuanheigu’. Euphytica 2015, 205, 889–901. [Google Scholar] [CrossRef]
  4. Wilson, R.A.; Talbot, N.J. Under pressure, investigating the biology of plant infection by Magnaporthe oryzae. Nat. Rev. Microbiol. 2009, 7, 185–195. [Google Scholar] [CrossRef]
  5. Zhai, C.; Zhang, Y.; Yao, N.; Lin, F.; Liu, Z.; Dong, Z.; Wang, L.; Pan, Q. Function and interaction of the coupled genes responsible for Pik-h encoded rice blast resistance. PLoS ONE 2014, 9, e98067. [Google Scholar] [CrossRef]
  6. Mekwatanakarn, P.; Kositratana, W.; Levy, M.; Zeigler, R.S. Pathotype and avirulence gene diversity of Pyricularia grisea in Yhailand as determined by rice lines near-isogenic for major resistance gene. Plant Dis. 2000, 84, 60–70. [Google Scholar] [CrossRef] [Green Version]
  7. Wang, X.; Jia, Y.; Wamishe, Y.; Jia, M.H.; Valent, B. Dynamic changes in the rice blast population in the USA over six decades. Mol. Plant-Microbe Interac. 2017, 30, 803–812. [Google Scholar] [CrossRef] [Green Version]
  8. Wu, W.; Wang, L.; Zhang, S.; Li, Z.; Zhang, Y.; Lin, F.; Pan, Q. Stepwise arms race between AvrPik and Pik alleles in the rice blast pathosystem. Mol. Plant-Microbe Interac. 2014, 27, 759–769. [Google Scholar] [CrossRef] [Green Version]
  9. Zeigler, R. The relationship between lineage and virulence in Pyricularia grisea in the Philippines. Phytopathology 1995, 85, 443–451. [Google Scholar] [CrossRef]
  10. Flor, H.H. Current status of the gene for gene concept. Annu. Rev. Phytopathol. 1971, 9, 275–296. [Google Scholar] [CrossRef]
  11. Silue, D.; Notteghem, J.L.; Tharreau, D. Evidence for a gene-for-gene relationship in the Oryza sativa-Magnaporthe grisea pathosystem. Phytopathology 1992, 82, 569–578. [Google Scholar] [CrossRef]
  12. Hu, Z.; Chen, J.; Wang, L.; Qiu, Q.; Pan, Q. Molecular genetic studies on the rice blast fungus population. II. Temporal and spatial characterization of genetic structure of the fungus population in 2000 in Guangdong province. Mycosystema 2002, 21, 203–209, (In Chinese with English Abstract). [Google Scholar] [CrossRef]
  13. Kawasaki-Tanaka, A.; Hayashi, N.; Yanagihara, S.; Fukuta, Y. Diversity and distribution of rice blast (Pyricularia oryzae Cavara) races in Japan. Plant Dis. 2016, 100, 816–823. [Google Scholar] [CrossRef] [PubMed] [Green Version]
  14. Kolmer, J.A.; Hughes, M.E. Physiologic specialization of Puccinia triticina on wheat in the United States in 2016. Plant Dis. 2018, 102, 1066–1071. [Google Scholar] [CrossRef] [Green Version]
  15. Liu, T.; Wan, A.; Liu, D.; Chen, X. Changes of races and virulence genes in Puccinia striiformis f. sp. tritici, the wheat stripe rust pathogen, in the United States from 1968 to 2009. Plant Dis. 2017, 101, 1522–1532. [Google Scholar] [CrossRef] [Green Version]
  16. All China Corporation of Research on Physiological Races of Pyricularia oryzae. Research on physiological races of rice blast fungus in China. Acta Phytopathol. Sin. 1980, 10, 71–82, (In Chinese with English Abstract). [Google Scholar]
  17. Xiao, D.; Zhang, P.; Wang, L.; Huang, S. Research progress on populations and physiological race distribution of rice blast pathogen (Magnaporthe grisea) in China. Chin. J. Rice Sci. 2013, 27, 312–320, (In Chinese with English Abstract). [Google Scholar] [CrossRef]
  18. Liu, Y.; Chen, Z.; Hu, M.; Li, L.; Liu, Y. Distribution of Magnaporthe grisea populations and virulence of predominant races in Jiangsu province. Chin. J. Rice Sci. 2004, 18, 351–356, (In Chinese with English Abstract). [Google Scholar] [CrossRef]
  19. Qi, Z.; Pan, X.; Du, Y.; Shen, L.; Yu, M.; Cao, H.; Song, T.; Yu, J.; Zhang, R.; Yong, M.; et al. Pathogenicity and population structure analysis of Pyricularia oryzae in different districts of Jiangsu province, China. Plant Pathol. 2021, 70, 449–458. [Google Scholar] [CrossRef]
  20. Qi, Z.; Yu, J.; Shen, L.; Yu, Z.; Yu, M.; Du, Y.; Zhang, R.; Song, T.; Yin, X.; Zhou, Y.; et al. Enhanced resistance to rice blast and sheath blight in rice (Oryza sativa L.) by expressing the oxalate decarboxylase protein Bacisubin from Bacillus subtilis. Plant Sci. 2017, 265, 51–60. [Google Scholar] [CrossRef]
  21. Pan, Q.; Wang, L.; Ikehashi, H.; Tanisaka, T. Identification of a new blast resistance gene in the indica rice cultivar kasalath using Japanese differential cultivars and isozyme markers. Phythopathology 1996, 86, 1071–1075. [Google Scholar] [CrossRef]
  22. Zhang, Y.; Wang, J.; Yao, Y.; Jin, X.; Correll, J.; Wang, L.; Pan, Q. Dynamics of race structures of the rice blast pathogen population in Heilongjiang province, China from 2006 through 2015. Plant Dis. 2019, 103, 2759–2763. [Google Scholar] [CrossRef] [PubMed] [Green Version]
  23. Wu, Y.; Xiao, N.; Yu, L.; Pan, C.; Li, Y.; Zhang, X.; Liu, G.; Dai, Z.; Pan, X.; Li, A. Combination patterns of major R genes determine the level of resistance to the M. oryzae in rice (Oryza sativa L.). PLoS ONE 2015, 10, e0126130. [Google Scholar] [CrossRef] [PubMed] [Green Version]
  24. Kiyosawa, S.; Ikehashi, H.; Kato, H.; Zhong, Z. Pathogenicity test of Philippine isolates of blast fungus sing two sets of rice varieties. Japan. J. Breed. 1981, 31, 367–376. [Google Scholar] [CrossRef] [Green Version]
  25. Tsunematsu, H.; Yanoria, M.; Ebron, L.; Nagao, H.; Ikuo, A.; Hiroshi, K.; Tokio, I.; Khush, G. Development of monogenic lines for rice blast resistance. Breed. Sci. 2000, 50, 229–234. [Google Scholar] [CrossRef] [Green Version]
  26. Telebanco-Yanoria, M.; Koide, Y.; Fukuta, Y.; Imbe, T.; Kato, H.; Tsunematsu, H.; Kobayashi, N. Development of near-isogenic lines of Japonica-type rice variety Lijiangxintuanheigu as differentials for blast resistance. Breed. Sci. 2010, 60, 629–638. [Google Scholar] [CrossRef] [Green Version]
  27. Wang, C. Current situation and development trend of rice breeding and production in Jiangsu province. Jiangsu Agr. Sci. 2005, 2, 1–6, (In Chinese with English Abstract). [Google Scholar] [CrossRef]
  28. McDonald, B.A.; Linde, C. Pathogen population genetics, evolutionary potential, and durable resistance. Annu. Rev. Phytopathol. 2002, 40, 349–379. [Google Scholar] [CrossRef] [Green Version]
  29. Saleh, D.; Milazzo, J.; Adreit, H.; Fournier, E.; Tharreau, D. South-East Asia is the center of origin, diversity and dispersion of the rice blast fungus, Magnaporthe oryzae. New Phytol. 2014, 201, 1440–1456. [Google Scholar] [CrossRef] [Green Version]
  30. Dong, L.; Wang, Q.; Liu, S.; Zheng, F.; Li, X.; Yang, Q. Pathogenicity analysis of Magnaporthe oryzae populations of Yunnan on monogenic lines for resistance to rice blast. Southwest China J. Agric. Sci. 2012, 25, 467–473, (In Chinese with English Abstract). [Google Scholar] [CrossRef]
  31. Zhang, Y.; Zhu, Q.; Yao, Y.; Zhao, Z.; Correll, J.; Wang, L.; Pan, Q. The race structure of the rice blast pathogen across southern and northeastern China. Rice 2017, 10, 46. [Google Scholar] [CrossRef] [PubMed] [Green Version]
Figure 1. The race frequency and race diversity index of the P. oryzae in different regions of Jiangsu province from 2003 to 2017. The race frequency (A). The race diversity index (B). The blue line represents P. oryzae from Northern Jiangsu; the red line represents P. oryzae from mid-southern Jiangsu and the purple line represents P. oryzae from Jiangsu.
Agronomy 12 00956 g001
Figure 2. The population common race frequency and total population common race isolate frequency of the P. oryzae in different regions of Jiangsu province from 2003 to 2017. Population common race frequency (A). The total population common race isolate frequency (B). The blue line represents P. oryzae from northern Jiangsu; the red line represents P. oryzae from mid-southern Jiangsu, and the purple line represents P. oryzae from Jiangsu.
Agronomy 12 00956 g002
Table 1. Race diversity of 14 populations of P. oryzae in Jiangsu province from 2003 to 2017 tested with CDC entries.
Parameter2003 A (106)2004 (101)2005 (82)2006 (41)2007 (69)2009 (70)2010 (56)2011 (74)2012 (94)2013 (175)2014 (198)2015 (214)2016 (155)2017 (149)
No. of race group76646776566777
No. of race151713716211614121517273726
Race frequency (ƒtr)14.15 a–d16.83 b–e15.85 a–e17.07 a–f23.19 c–f30.00 f28.57 e,f18.92 b–f12.77 a–c8.57 a8.59 a12.62 a,b23.87 d–f17.45 b–e
Race diversity index (hrdi)0.6270.6350.6160.4270.8030.8540.8290.8690.7360.8410.6990.7690.8710.810
χ2 for ftr45.55 B
A: Numbers shown in parentheses indicate the numbers of isolates tested. B: Significant at the p = 0.01 level for a χ2. The same superscript lowercase letters represent no significant difference at the p = 0.05 level.
Table 2. Common races of P. oryzae in 14 populations of isolates in Jiangsu province from 2003 to 2017.
Race/ParameterZB15ZC15ZG1ƒpcr∑/ƒtpcriχ2 for ftpcri
2003 (106) ANo.326420.0065.09 b–e113.99 B
ƒpcri2.831.8960.38
2004 (101)No.316017.6563.37 b–d
ƒpcri2.970.9959.41
2005 (82)No.375025.0073.17 c–e
ƒpcri3.668.5460.98
2006 (41)No.113142.8680.49 c–e
ƒpcri2.442.4475.61
2007 (69)No.352218.7543.48 a,b
ƒpcri4.357.2531.88
2009 (70)No.962414.2955.71 a–c
ƒpcri12.868.5734.29
2010 (56)No.352218.7553.57 a–c
ƒpcri5.368.9339.29
2011 (74)No.1101621.4336.49 a
ƒpcri1.3513.5121.62
2012 (94)No.16303525.0086.17 e
ƒpcri17.0231.9137.23
2013 (175)No.31334720.0063.43 b–d
ƒpcri17.7118.8626.86
2014 (198)No.8688417.6580.81 d,e
ƒpcri4.0434.3442.42
2015 (214)No.4319511.1160.75 b,c
ƒpcri1.8714.4944.39
2016 (155)No.220508.1146.45 a,b
ƒpcri1.2912.9032.26
2017 (149)No.11206011.5461.07 b,c
ƒpcri7.3813.4240.27
A: Numbers shown in parentheses indicate the numbers of isolates tested. B: Significant at the p = 0.01 level for a χ2. The same superscript lowercase letters represent no significant difference at the p = 0.05 level. fpcr: The population common race frequency; fpcri: The population common race isolate frequency; and ftpcri: The total population common race isolate frequency. The equations are shown in Table S2.
Table 3. Dominant race of P. oryzae in 14 populations of isolates in Jiangsu province from 2003 to 2017.
PopulationJiangsuNorthern JiangsuMid-Southern Jiangsu
Top Races (No. of Isolates)ftriTop Races (No. of Isolates)ftriTop Races (No. of Isolates)ftri
2003 (106) AZG1 (64)60.38 b,dZG1 (22) A48.89 a,bZG1 (42) A68.85 c,d
2004 (101)ZG1 (60)59.41 b,dZG1 (37)56.06 bZG1 (23)65.71 b–d
2005 (82)ZG1 (50)60.98 b,dZG1 (30)61.22 bZG1 (20)60.61 b–d
2006 (41)ZG1 (31)75.61 dZB13 (3)42.86 a,bZG1 (29)85.29 d
2007 (69)ZG1 (22)31.88 a,bZG1 (18)31.58 a,bZF1 (5)41.67 a–c
2009 (70)ZG1 (24)34.29 a–cZG1 (15)33.33 a,bZG1 (9)36.00 a–c
2010 (56)ZG1 (22)39.29 a–cZG1 (11)45.83 a,bZG1 (11)34.38 a–c
2011 (74)ZD1 (16)/ZG1 (16)21.62 aZD1 (15)23.44 aZG1 (5)50.00 b–d
2012 (94)ZG1 (35)37.23 a–cZG1 (25)53.19 a,bZC15 (22)46.81 b,c
2013 (175)ZG1 (47)26.86 aZG1 (30)33.33 a,bZG1 (17)/ZB15 (17)/ZC15 (17)20.00 a
2014 (198)ZG1 (84)42.42 a–cZG1 (50)49.02 a,bZC15 (39)40.63 a–c
2015 (214)ZG1 (95)44.39 b,cZG1 (48)43.24 a,bZG1 (47)45.63 b,c
2016 (155)ZG1 (50)32.26 a–cZG1 (43)33.86 a,bZG1 (7)25.00 a,b
2017 (149)ZG1 (60)40.27 a–cZG1 (42)38.53 a,bZG1 (18)45.00 a–c
χ2 for ftri 100.02 B 38.09 B 74.45 B
A: Numbers shown in parentheses indicate the number of isolates tested. B: Significant at the p = 0.01 level for a χ2. The same superscript lowercase letters represent no significant difference at the p = 0.05 level. ftri: The top race isolate frequency and the equation are shown in Table S2.
Table 4. Resistance genes and resistance frequency of a set of CDC entries that were challenged with isolates collected in Jiangsu province from 2003 to 2017.
Differential CultivarTetepZhenlong 13Sifeng 43Dongnong 363Kando 51Hejiang 18Lijiangxintuanheigu
Race codeA64B32C16D8E4F2G1
Resistance genePi1, Pi4, Pi54, Pid3, Pia, Pita, Pi5Pik, Pia, Pi9, Pb1, β, εPib, Pia, Pi9, Pb1, αPik, Pia, Piz, Pish, Pi54, βPik, Pish, γPii, Pia, Pi9, Pik, Pish, δPik-l
Resistance gene (ƒCR)2003 (106)99.06 *77.3677.3685.85 *95.28 *72.640.00
2004 (101)100.00 *80.2084.1694.06 *85.15 *76.240.00
2005 (82)100.00 *85.37 *80.4995.12 *92.68 *87.80 *0.00
2006 (41)100.00 *87.80 *80.4997.56 *95.12 *85.37 *0.00
2007 (69)94.20 *81.1673.9185.51 *100.00 *46.380.00
2009 (70)97.14 *64.2964.2980.0085.71 *85.71 *0.00
2010 (56)98.21 *76.7973.2176.7960.7173.210.00
2011 (74)97.30 *93.24 *70.2751.3541.8958.110.00
2012 (94)100.00 *76.6040.4393.62 *94.68 *90.43 *0.00
2013 (175)99.43 *53.1432.5778.2997.71 *82.290.00
2014 (198)97.98 *89.90 *47.4791.92 *97.47 *90.91 *0.00
2015 (214)95.79 *84.1170.0984.1182.7190.65 *0.00
2016 (155)85.81 *81.2958.0676.1365.1676.770.00
2017 (149)95.97 *80.5455.7083.2283.2280.540.00
Total resistance frequencies (ƒTCR)96.7278.9861.0583.9085.2980.740.00
Note: The asterisk indicates higher levels of resistance (>85%).
Publisher’s Note: MDPI stays neutral with regard to jurisdictional claims in published maps and institutional affiliations.

