Article

Identification of Aluminum Tolerance in Ethiopian Chickpea (Cicer arietinum L.) Germplasm

by
Hawi Negusse
1,2,
Douglas R. Cook
3,
Teklehaimanot Haileselassie
1 and
Kassahun Tesfaye
1,2,*
1
Institute of Biotechnology, Addis Ababa University, Addis Ababa 1000, Ethiopia
2
Ethiopian Biotechnology Institute (EBTi), Addis Ababa 1000, Ethiopia
3
Department of Plant Pathology, University of California, Davis, CA 95616, USA
*
Author to whom correspondence should be addressed.
Agronomy 2022, 12(4), 948; https://doi.org/10.3390/agronomy12040948
Submission received: 28 February 2022 / Revised: 1 April 2022 / Accepted: 13 April 2022 / Published: 15 April 2022

Abstract

:
Aluminum (Al) toxicity is a major abiotic stress that negatively impacts plant growth and crop productivity. Al ions are released into soil solutions as a function of soil pH, which is in turn determined by a combination of factors, including local geology, historic vegetation and land-use patterns. Selection and use of Al-tolerant crops is a preferred method to address the problem of Al toxicity. The present study evaluated a combination of modern cultivars, advanced breeding lines and a local landrace for Al tolerance using a seedling-based hydroponic assay. Two sequential experiments were conducted to score root and shoot traits in the presence of aluminum. Initially, six Al concentrations (0, 50, 100, 120, 150 and 200 µM) were tested on six chickpea genotypes to identify the single Al concentration that best discriminates among genotypes. Subsequently, 31 chickpea genotypes were evaluated at 0 and 120 µM Al. Progressive declines in trait values were observed in all genotypes with increasing Al, although the degree of sensitivity varied significantly among genotypes. Genotypes were evaluated both for total root length under 120 µM Al and for relative root growth compared to a 0 µM Al control treatment. Considering both parameters, we identified four tolerant chickpea genotypes (DZ-2012-CK-0237, Wollega LV, DZ-2012-CK-0233 and Natoli) and two sensitive genotypes (Akaki and Fetenech). Wollega LV is a local landrace obtained from acidic soil regions of Western Ethiopia, presenting the possibility that historical selection during cultivation on acidic soils might underlie its unusual tolerance. The aluminum tolerance traits identified here are candidates for introgression breeding of new Ethiopian chickpea varieties with potential to increase yield and expand the area of cultivation.

1. Introduction

Chickpea (Cicer arietinum L.) is the world’s second most widely grown pulse legume next to common bean (Phaseolus vulgaris), with particular importance in the semi-arid tropics of sub-Saharan Africa. Ethiopia is sub-Saharan Africa’s largest producer, consumer and exporter of chickpea [1], and the sixth largest producer globally [2].
Within Ethiopia, chickpea ranks third among pulse crops for cultivated area and total production, next to faba and haricot bean [3]. Chickpea is grown widely across the highlands and semi-arid regions of Ethiopia [4,5], encompassing eight agro-ecological zones and spanning mean annual rainfall from 700 to 2000 mm and altitudes ranging from 1400 to 2300 m a.s.l [6].
In particular, among Ethiopia’s subsistence farmers, which account for ~80% of the crop’s production effort, chickpea is an important source of dietary protein and other nutritional components as well as on-farm cash income [5,7]. Thus, chickpea is the key to food and nutritional security of smallholder farmers. Chickpea is also an important commodity, generating ~25% of Ethiopia’s total pulse export income, second only to white pea bean [8]. Among 340,000 metric tons of pulses exported in 2016/2017, chickpea accounted for 78,000 metric tons, with an income value of USD 75 million [9]. Chickpea also has the advantage of fixing atmospheric nitrogen to ammonia, which supports crop health and improves soil fertility for the following crops.
Despite chickpea’s socio-economic importance, its average productivity in Ethiopia is low (2.0 t ha−1), far below its estimated production potential of 6 t ha−1 [7,10]. The cultivation of chickpea across a range of agro-ecological zones exposes the crop to a number of adverse environmental factors that limit its production potential. Among these, soil acidity and associated aluminum (Al) toxicity represent major challenges that have not been addressed [11,12]. In particular, Al tolerance has not been prioritized as a breeding target, and research regarding specific agronomic impacts is lacking.
Al is the most abundant metal in the earth’s crust, accounting for ~7% of its mass [13]. In a pH-dependent manner (pH < 5.5), phytotoxic forms of Al are released into the soil solution, affecting root growth and plant vigor [14,15]. The initial symptom of Al toxicity is inhibition of root growth [16,17,18], which occurs within a few hours of exposure [17]. Although the precise mechanisms of Al toxicity remain uncertain, growth effects are correlated with altered microtubule dynamics [19]. Al-sensitive roots become thick, brittle and necrotic, negatively affecting acquisition of nutrients and water and ultimately leading to yield reductions [18]. The scale of the problem is huge. More than 50% of the world’s potentially arable lands are acidic [14,15], and Al (Al3+) is the key agricultural constraint on 67% of this area [15]. In Ethiopia, nearly 43% of arable lands are affected by soil acidity [20,21], with the greatest incidence in the north-western, south-western, southern and central parts of the country [22].
According to the Ethiopian Agricultural Transformation Agency (ATA), significant portions of the major chickpea-producing zones in Amhara and Oromia regional states [23] are affected by soil acidity [21], including 65% of the soils tested in Gojjam with pH < 5.5 [11]. Moreover, the problem is increasing in scope and magnitude, severely limiting productivity of crops throughout the country [24].
Soil amendment by liming is widely used to mitigate acidity, but it is only practical on surface soil because accessing sub-soils is both technically difficult and expensive [25,26,27]. Moreover, liming is not feasible for resource-poor farmers who predominate in tropical countries where acidic soils are most frequent [27]. Selection and use of acid and Al-tolerant cultivars is an attractive alternative, either alone or in conjunction with soil management practices [25,26,27].
A solution culture assay is the most common method for screening plant germplasm for Al tolerance [18,28,29]. Because Al affects the root system, sensitivity to Al is more easily scored using solution culture rather than soil-based assays [28,30,31]. Hydroponic systems permit simple control over key environmental factors, including pH and media composition, which increases precision of hydroponic assays [30,32]. Finally, solution culture assays are rapid and non-destructive, allowing individual plants to be retrieved for further analysis, including for genetic studies and pre-breeding activities [32,33].
Several studies have quantified the Al tolerance of crop plants, including cereals (rice [15,25], durum wheat [34,35], spring rye [30], barley [36], tef [37]) and legumes (soybean [38,39], faba bean [40], common bean [31,41] and lentil [42]). Although chickpea is widely understood to be sensitive to acid soils [29,43], detailed studies of Al tolerance in cultivated chickpea germplasm are lacking. Nevertheless, Al-tolerant varieties have been nominated (e.g., ICC14880 and IPC 92-39), and initial attempts at genetic analysis have been conducted [44]. Rai [45] evaluated the effects of soil acidity on the interaction of chickpea genotypes and rhizobium strains, suggesting that relevant variation may exist in both the plant and bacterial partner. Rodrigues et al. [46] suggest that sensitivity of the bacterial symbiont to pH is correlated with the pH of origin soils, while Vargas and Graham [47] concluded that tolerance to acidity in either the host plant or the bacterium may be sufficient to confer acid-tolerant nodulation. Interestingly, a recent report by Vance et al. [48] identified Al tolerance traits both in cultivated accessions and in wild Cicer accessions. Because crop varieties are typically adapted to local agronomic conditions and consumer preferences, it is important to evaluate the Al tolerance of Ethiopian chickpea germplasm. Alemu and Lule [12] documented yield and agronomic performance for sixteen desi-type chickpea genotypes on the acid soils of Western Ethiopia. In this study, we complement and expand those efforts by evaluating a wider range of chickpea genotypes in a hydroponic solution assay where Al toxicity is the explicit stress. The present study aims (i) to determine the dose–response of chickpea genotypes to increasing Al and, in doing so, to identify the single Al concentration best suited to discriminate among genotypes, and (ii) to evaluate the level of Al tolerance among 31 chickpea genotypes, including modern cultivars, advanced lines and a local landrace (Wollega LV) obtained from the acidic soil regions of Western Ethiopia.

2. Materials and Methods

2.1. Experiment I: Determination of Optimum Aluminum Concentration

2.1.1. Plant Materials

Six chickpea genotypes, including five improved varieties and one local landrace, were used to test a range of Al concentrations under hydroponic conditions (Table 1). Seeds of improved varieties were obtained from Debrezeit Agricultural Research Center (DZARC), Ethiopia, and a local landrace was collected from acid soil locations in Oromia regional state, Kelem Wollega zone, Seyo wereda.

2.1.2. Sterilization and Germination

Seeds were surface-sterilized with 1% sodium hypochlorite (NaOCl) solution for five minutes and rinsed 5–10 times with distilled water (dH2O). For germination, seeds were incubated in the dark for 72 h at room temperature in a Petri dish lined with moistened paper towels. Healthy seedlings with uniform root and shoot lengths were selected for the assay. Seedlings were transferred to plastic trays containing eight liters of low-ionic-strength hydroponic medium. The hydroponic apparatus was adapted from Wayima et al. [35] by substituting the plastic cups with plastic mesh cups and using pyro foam to support the plastic mesh cups and suspend the seedlings in the nutrient solution.

2.1.3. Nutrient Solution Preparation and Growth Conditions

Hydroponic nutrient solution medium was prepared according to [49,50] with slight modifications, containing 500 μM KNO3, 500 μM CaCl2, 500 μM NH4NO3, 200 μM MgSO47H2O, 100 μM KH2PO4, 46 μM H3BO3, 20 μM Fe: EDTA, 2 μM MnCl24H2O, 1 μM ZnSO47H2O, 0.5 μM NaMoO42H2O and 0.3 μM CuSO45H2O. Aluminum sulphate octadecahydrate (Al2(SO4)318H2O) was used as an Al source, and six Al concentrations (0, 50, 100, 120, 150 and 200 µM) were tested to identify a single optimal concentration for further assay. Nutrient solution pH was maintained at 4.5 with additions of 1 M HCl or NaOH as necessary. Continuous aeration was provided by an aquarium air pump with an air stone, and solutions were fully replaced every 72 h to minimize pH and Al fluctuations.

2.1.4. Experimental Layout and Statistical Analysis

The dose–response experiment (Experiment I) was arranged in a split-plot design with chickpea genotypes assigned to the main plots as the main plot factor and Al concentrations assigned to the sub-plots as the sub-plot factor. Each treatment (genotype and aluminum concentration) involved five seedlings, and the entire experiment was repeated twice.
After six days of continuous growth, intact seedlings were removed from the test solution and plant traits were scored. Root lengths (RL) and shoot lengths (SL) were measured with a centimeter-graded ruler, and the number of leaves (NLS) and lateral roots (NLRS) were counted. Roots and shoots were separated, and fresh weights of roots (FWR) and shoots (FWS) were determined with an analytical balance.
Analysis of variance (ANOVA) was computed using a linear mixed model fit by REML. Chickpea genotypes, Al treatments and interaction between genotypes and Al treatments were arranged as fixed factors, while replication (Block) and main plot error were arranged as random factors using the following equation:
Yijk = μ + ρk + αi + ηki + βj + (αβ)ij + εijk
where Yijk is the response variable of the ith genotype, at the jth Al concentration, in the kth replication; µ is the overall mean; αi is the fixed effect of ith genotype; βj is the fixed effect of the jth Al concentration; αβij is the fixed interaction effect of the ith genotype in the jth Al concentration; ρk is the random effect of the kth replication; ηki is the main plot error of the ith genotype of the kth replication; and εijk is the sub-plot error of the ith genotype in the jth Al concentration within the kth replication.
Linear mixed-effect models were implemented using the ‘nlme’ [51] and ‘lme4’ [52] R [53] packages. Box plots were constructed using the R program packages ‘ggplot2’ [54] and ‘dplyr’ [55]. Pearson’s correlation analysis was conducted using the R program package ‘corrplot’ [56].

2.2. Experiment II: Evaluation of Improved Cultivars and Advanced Chickpea Genotypes for Tolerance to Aluminum

2.2.1. Plant Materials

Thirty-one chickpea genotypes representing twenty-four improved cultivars, six advanced lines and one local-variety landrace (Wollega LV) were tested. Seeds of improved cultivars and advanced lines were obtained from Debrezeit Agricultural Research Center (DZARC), Ethiopia, while seeds of Wollega LV were obtained from farmers in the Oromia regional state, Kelem Wollega zone, Seyo wereda (Table S1). Wollega LV and Akaki were used as tolerant and susceptible references, respectively, based on results of the optimization experiment (Experiment I).
Seeds were surface-sterilized, germinated and grown in the same manner as described above for (Experiment I).

2.2.2. Experimental Design and Statistical Analysis

The experimental design was a randomized complete block (RCB) with two replications and factorial combinations of 31 chickpea genotypes with two Al levels (0 and 120 µM). Each replicate consisted of five seedlings, and the entire experiment was replicated twice, with data combined to generate an average performance value for each genotype.
Phenotypic traits such as root length (RL) and shoot length (SL) were measured manually, while fresh weights of roots (FWR) and shoots (FWS) were determined using an analytical balance. Biomasses of roots (DWR) and shoots (DWS) were recorded on an analytical balance after samples were dried in an oven at 70 °C for 72 h.
Data were subjected to analysis of variance (ANOVA) using the generalized linear model (GLM) implemented in R [53] with the ‘aov’ function. The Ryan–Einot–Gabriel–Welsch (REGW) multiple-range test was used to compare genotype means and rank them accordingly. Pearson’s correlation analysis among phenotypic traits of chickpea genotypes was conducted using R program package ‘corrplot’ [56].
Root tolerance index (RTI) was calculated according to [30,57].
Root   tolerance   index   ( RTI % ) = Root   length ( 120   μ M 0   μ M ) 100
Percent reduction rate (% RR) for the genotypes was calculated according to [31].
Reduction   rate   ( RR % ) = Root   Growth ( 0   μ M 120   μ M 0   μ M ) 100

3. Results

3.1. Determination of Optimum Al Concentration

As a prelude to the analysis of a full set of genotypes, six different Al concentrations ranging from 0 to 200 (µM) were evaluated for six chickpea genotypes. The aim of this initial analysis was to identify the single Al concentration that best discriminates among genotypes for further analysis. The tested genotypes together represent modern cultivars and a local landrace, with the latter originating from the acidic soil regions of Western Ethiopia.

3.1.1. Analysis of Variance (ANOVA) for Seedling Traits

Analysis of variance (ANOVA) revealed the presence of significant differences among chickpea genotypes and Al concentrations for all traits evaluated except for the number of lateral roots (NLRS). Significant genotype–Al concentration interactions were observed for root traits (RL, FWR and NLRS), but not for shoot traits (SL, FWS and NLS)), indicating that root traits are best suited to discriminating among genotypes for Al sensitivity (Table 2).

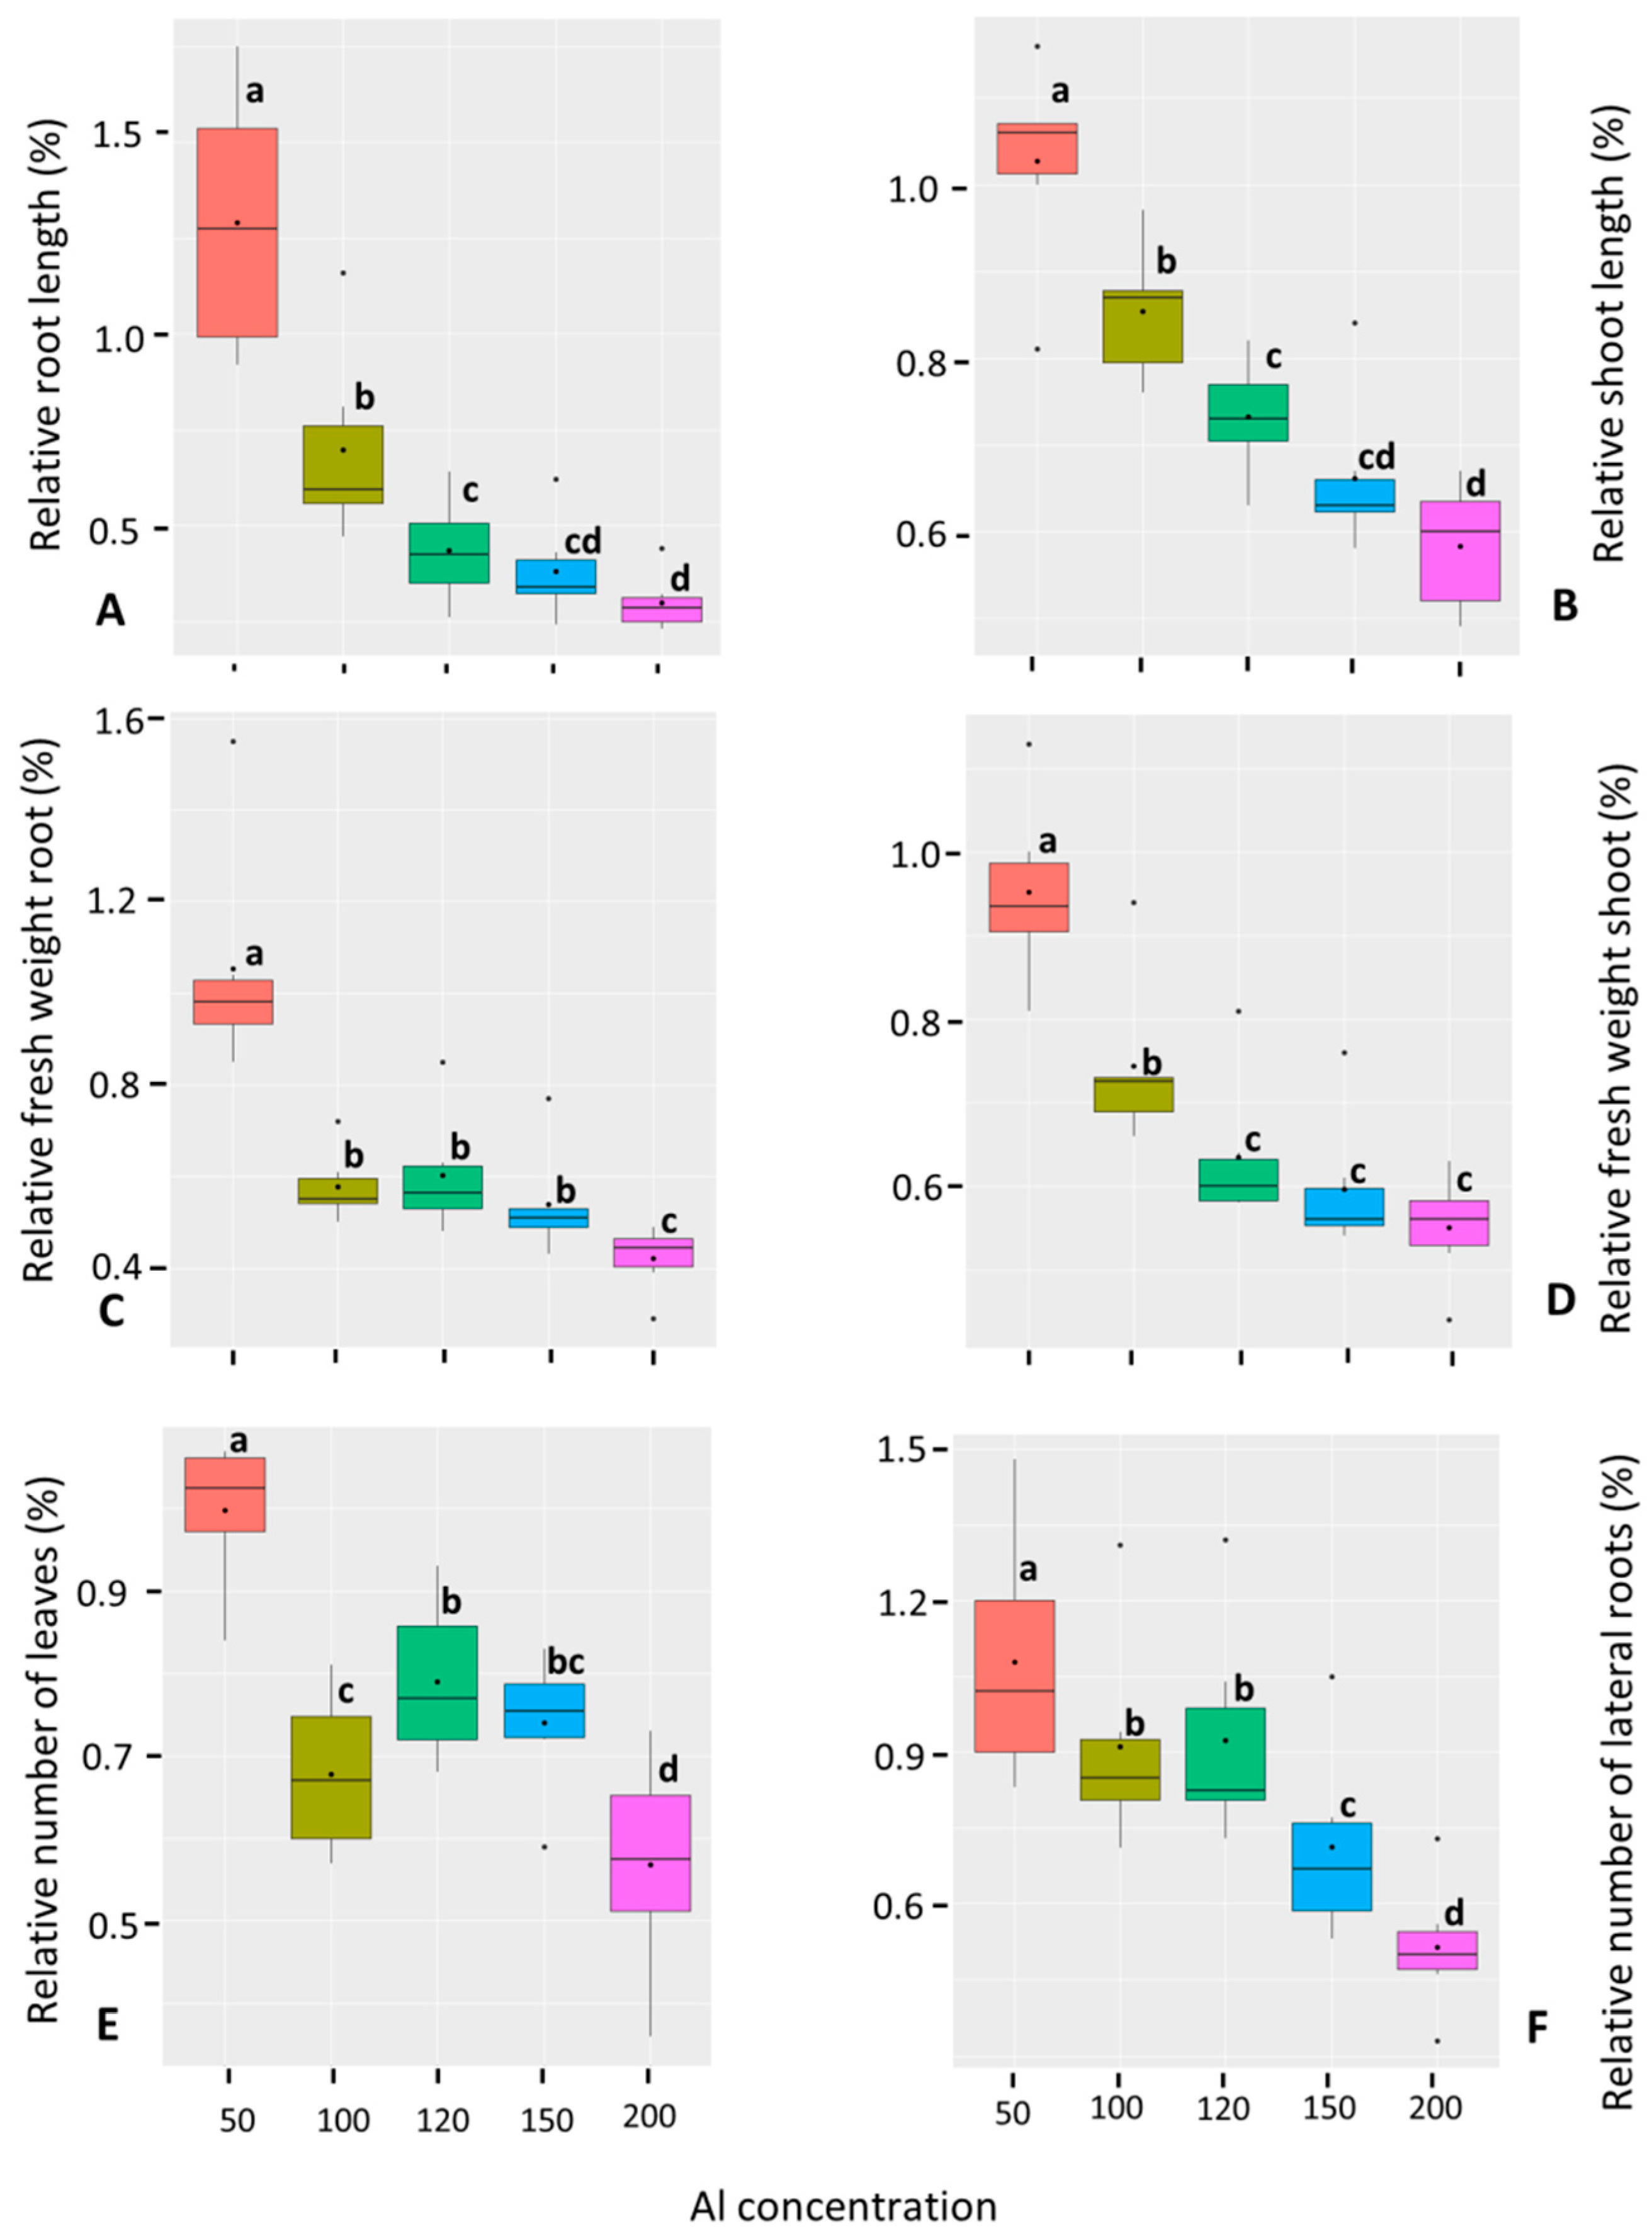
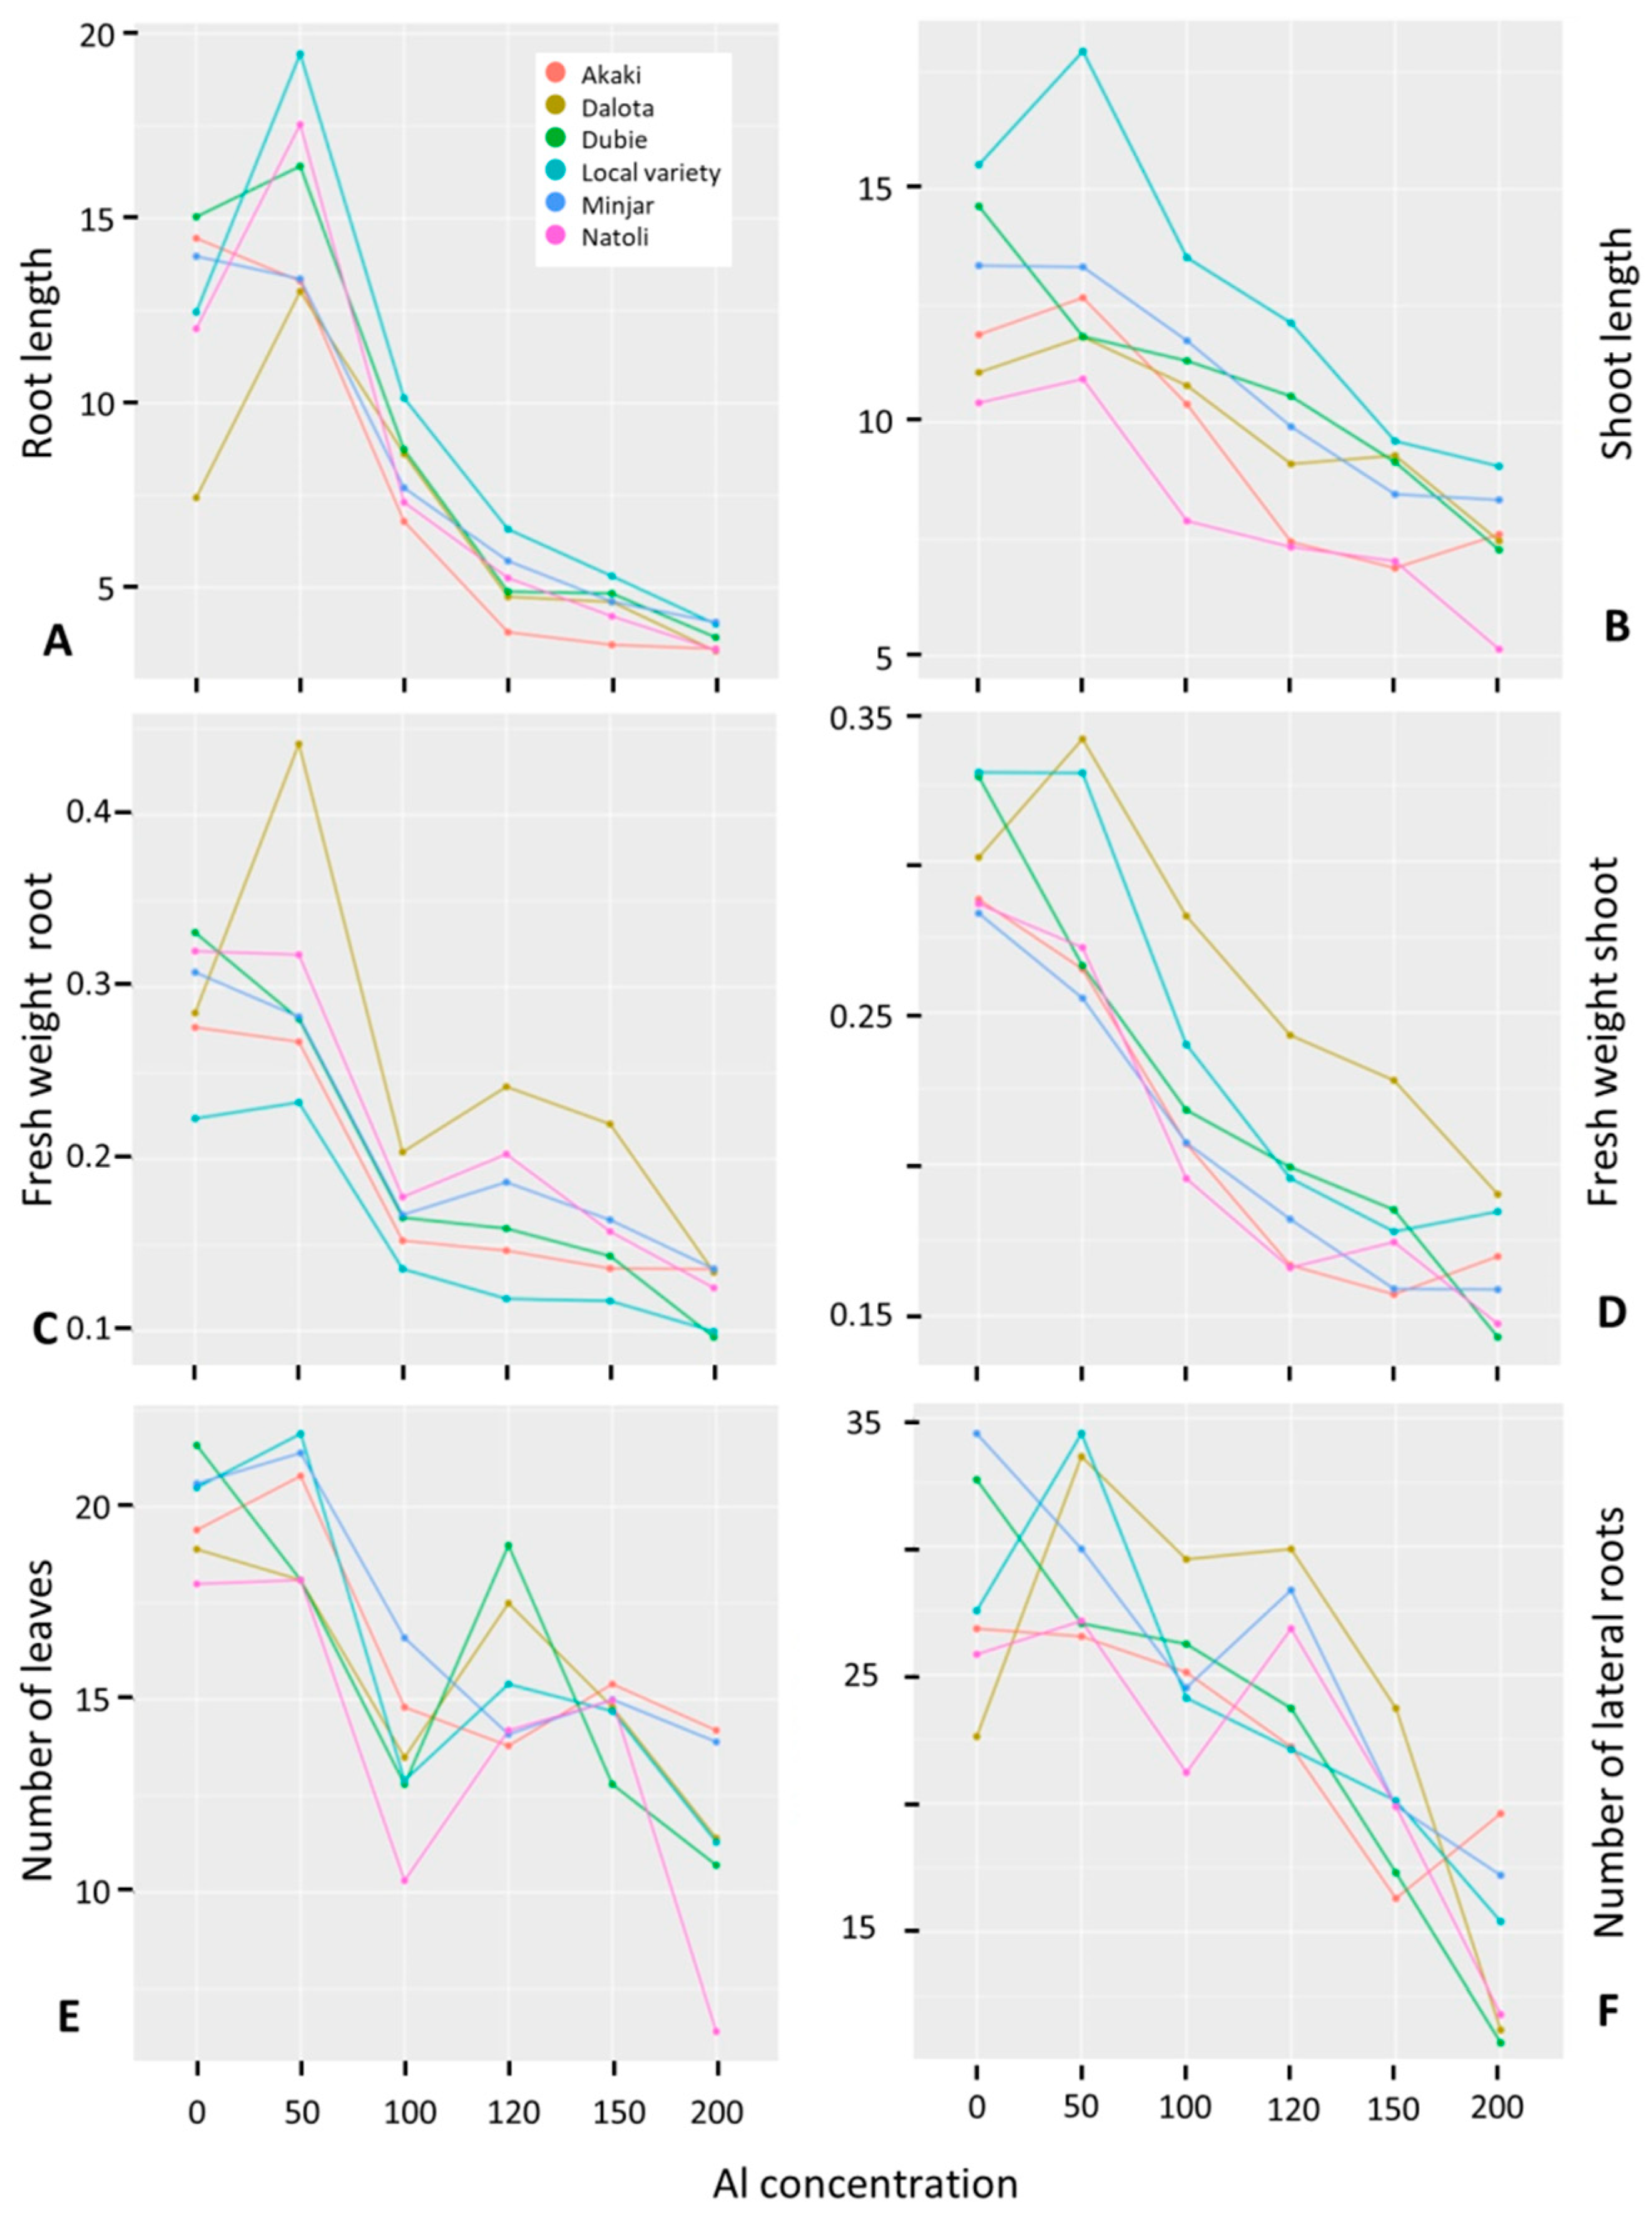
3.1.2. Response of Chickpea Genotypes to Increasing Al Concentrations

Considering all plant genotypes and treatments, Al concentration was the main effect. Thus, the combined genotypes exhibited a progressive and statistically significant decline in the mean performance of all traits as Al concentration increased from 50 to 200 µM Al (Figure 1).
Plotting absolute trait values for each genotype and treatment revealed considerable variation among chickpea varieties for all traits, even in the absence of Al treatment (Figure 2). To more confidently compare genotype responses, data were normalized to the respective 0 µM Al control values (Table S2). Several traits, most notably root length (Table 3), were positively affected in a genotype-specific manner as the concentration of Al increased from 0 to 50 µM Al. Notably, three genotypes, namely Natoli, Wollega LV and Dalota, exhibited 46–70% increased root length at 50 µM Al compared to 0 µM Al. Wollega LV and Dalota were unusual in being stimulated for at least half of recorded traits at 50 µM Al, while Dubie was on average the most inhibited at 50 µM Al for all traits except root length (Table S2). The relative insensitivity and rank order of Natoli, Wollega LV and Dalota varieties were retained in the 50–120 µM Al treatments, indicating that these genotypes are indeed less sensitive to Al.

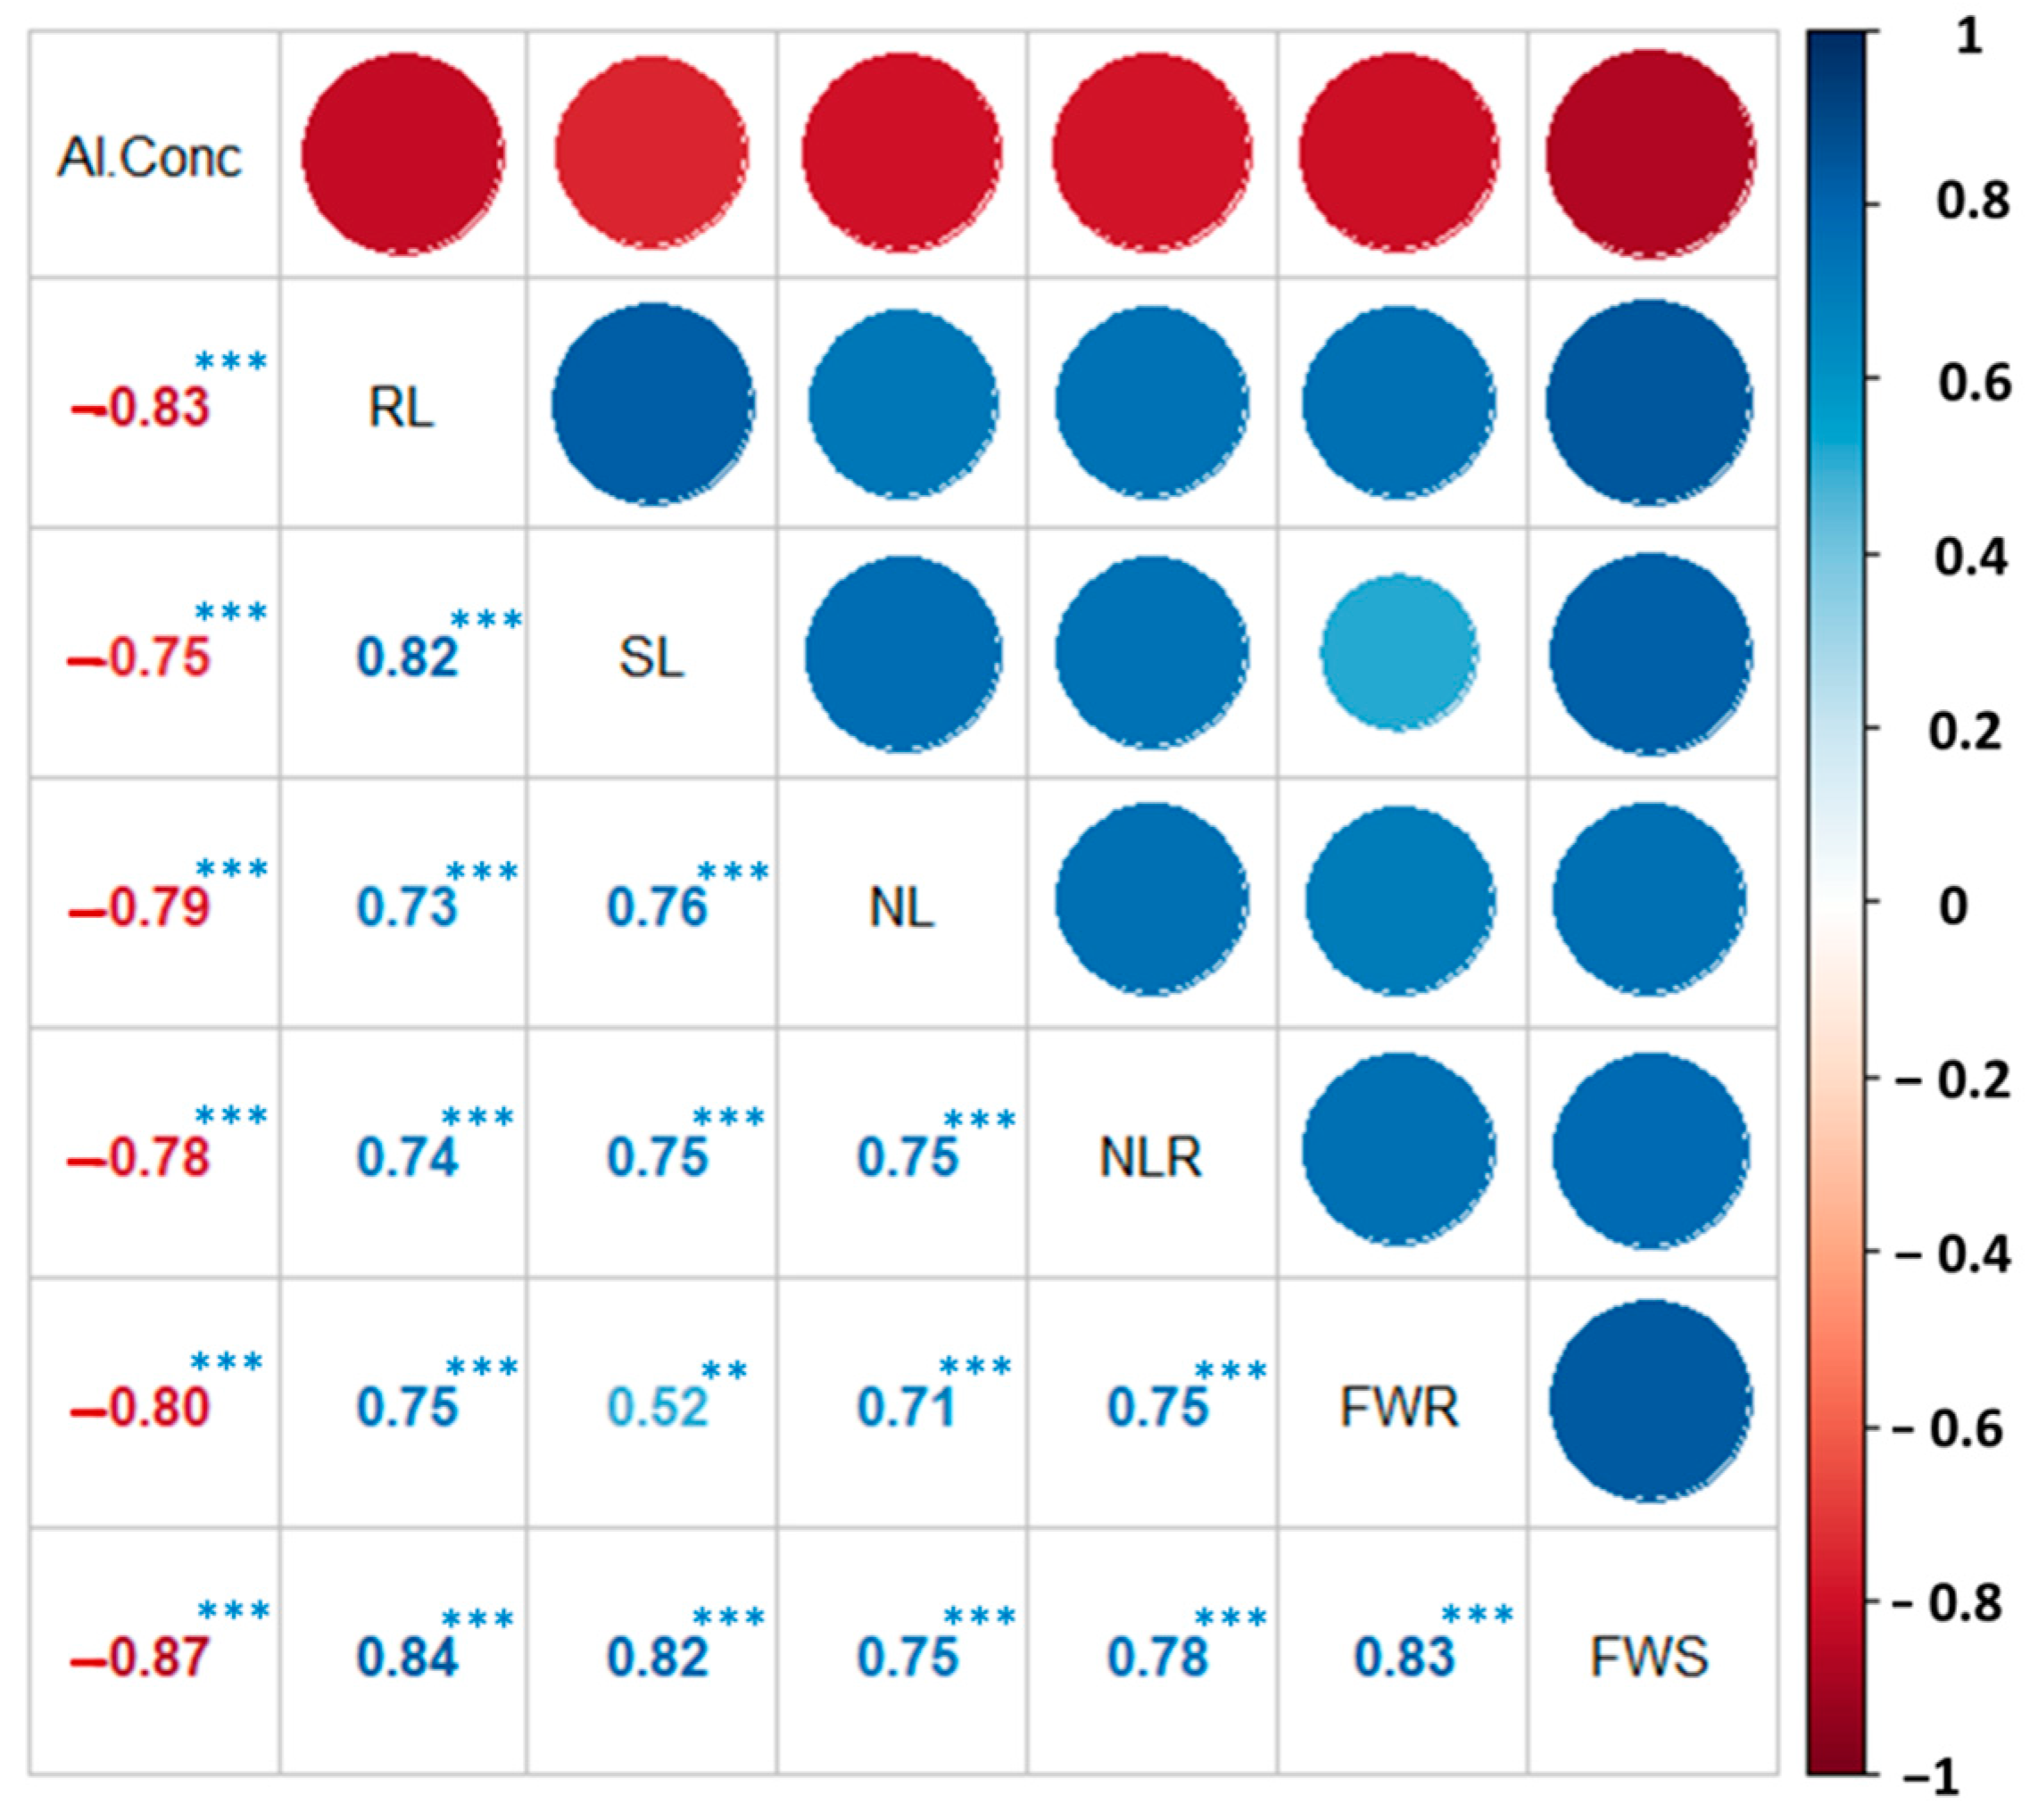
3.1.3. Correlation Analysis among Phenotypic Traits of Chickpea Genotypes

Pearson’s simple correlation analysis among the six phenotypic traits and Al concentrations confirmed the main negative effect of Al on all traits (p < 0.001). Moreover, the analysis revealed significant (p < 0.001) strong positive correlations among all traits of the six chickpea genotypes (Figure 3).

3.2. Screening of Improved Cultivars and Advanced Genotypes of Chickpea for Aluminum Tolerance

Based on the results of the Al dose–response experiment, 0 and 120 µM Al treatments were selected for testing of a wider set of chickpea germplasm. Because NLS and NLRS failed to resolve genotypes based on Al treatment, these traits were removed from further consideration. Genotypes Wollega LV and Akaki were included in the trial as tolerant and sensitive controls because they were consistently at the extremes of relative root length responses (Figure 2 and Table 3). Using this framework, we assayed the Al response of thirty-one chickpea genotypes, including twenty-four improved varieties, six advanced breeding lines and one local landrace.

3.2.1. Analysis of Variance (ANOVA) for Seedling Phenotypic Traits

Analysis of variance revealed significant differences (p < 0.001) among the 31 tested genotypes for all traits under both control (0 µM) and Al (120 µM) treatments. Combined ANOVA revealed significant differences (p < 0.001) among chickpea genotypes, aluminum concentrations and genotype interactions with Al concentration for all traits under evaluation, with the exception of DWS (Table 4).

3.2.2. Differential Response of Ethiopian Chickpea Germplasm to Al Treatment

In general, phenotypic means were larger and the range of values among chickpea accessions were wider in the Al-free (0 µM Al) nutrient solution as compared to that with 120 µM Al. RL, the parameter most strongly affected by Al, ranged from 6.68 to 22.19 cm (median = 13.79 cm) under 0 µM Al and from 3.03 to 8.30 cm (median = 4.49 cm) under 120 µM Al (Table 5). Indeed, root traits were generally more impacted by the Al toxicity than shoot traits, with mean percent reduction rates (%RR) of 64%, 44% and 33% for RL, FWR and DWR, respectively, and 23%, 20% and 20%, for SL, FWS and DWS, respectively.
As observed in the dose–response experiment, Wollega LV and Dalota had root tolerance indices that ranked them among the most Al-tolerant genotypes, while Akaki was the most sensitive genotype (Table 5). The screening experiment also identified Teji as an additional Al-tolerant line, comparable to Wollega LV and Dalota. DZ-2012-CK-0237 is also of interest, as it had the longest root system in both control and Al treatments and a root tolerance index in the upper quartile. Conversely, Fetenech had Al sensitivity approaching that of Akaki (Table 5).

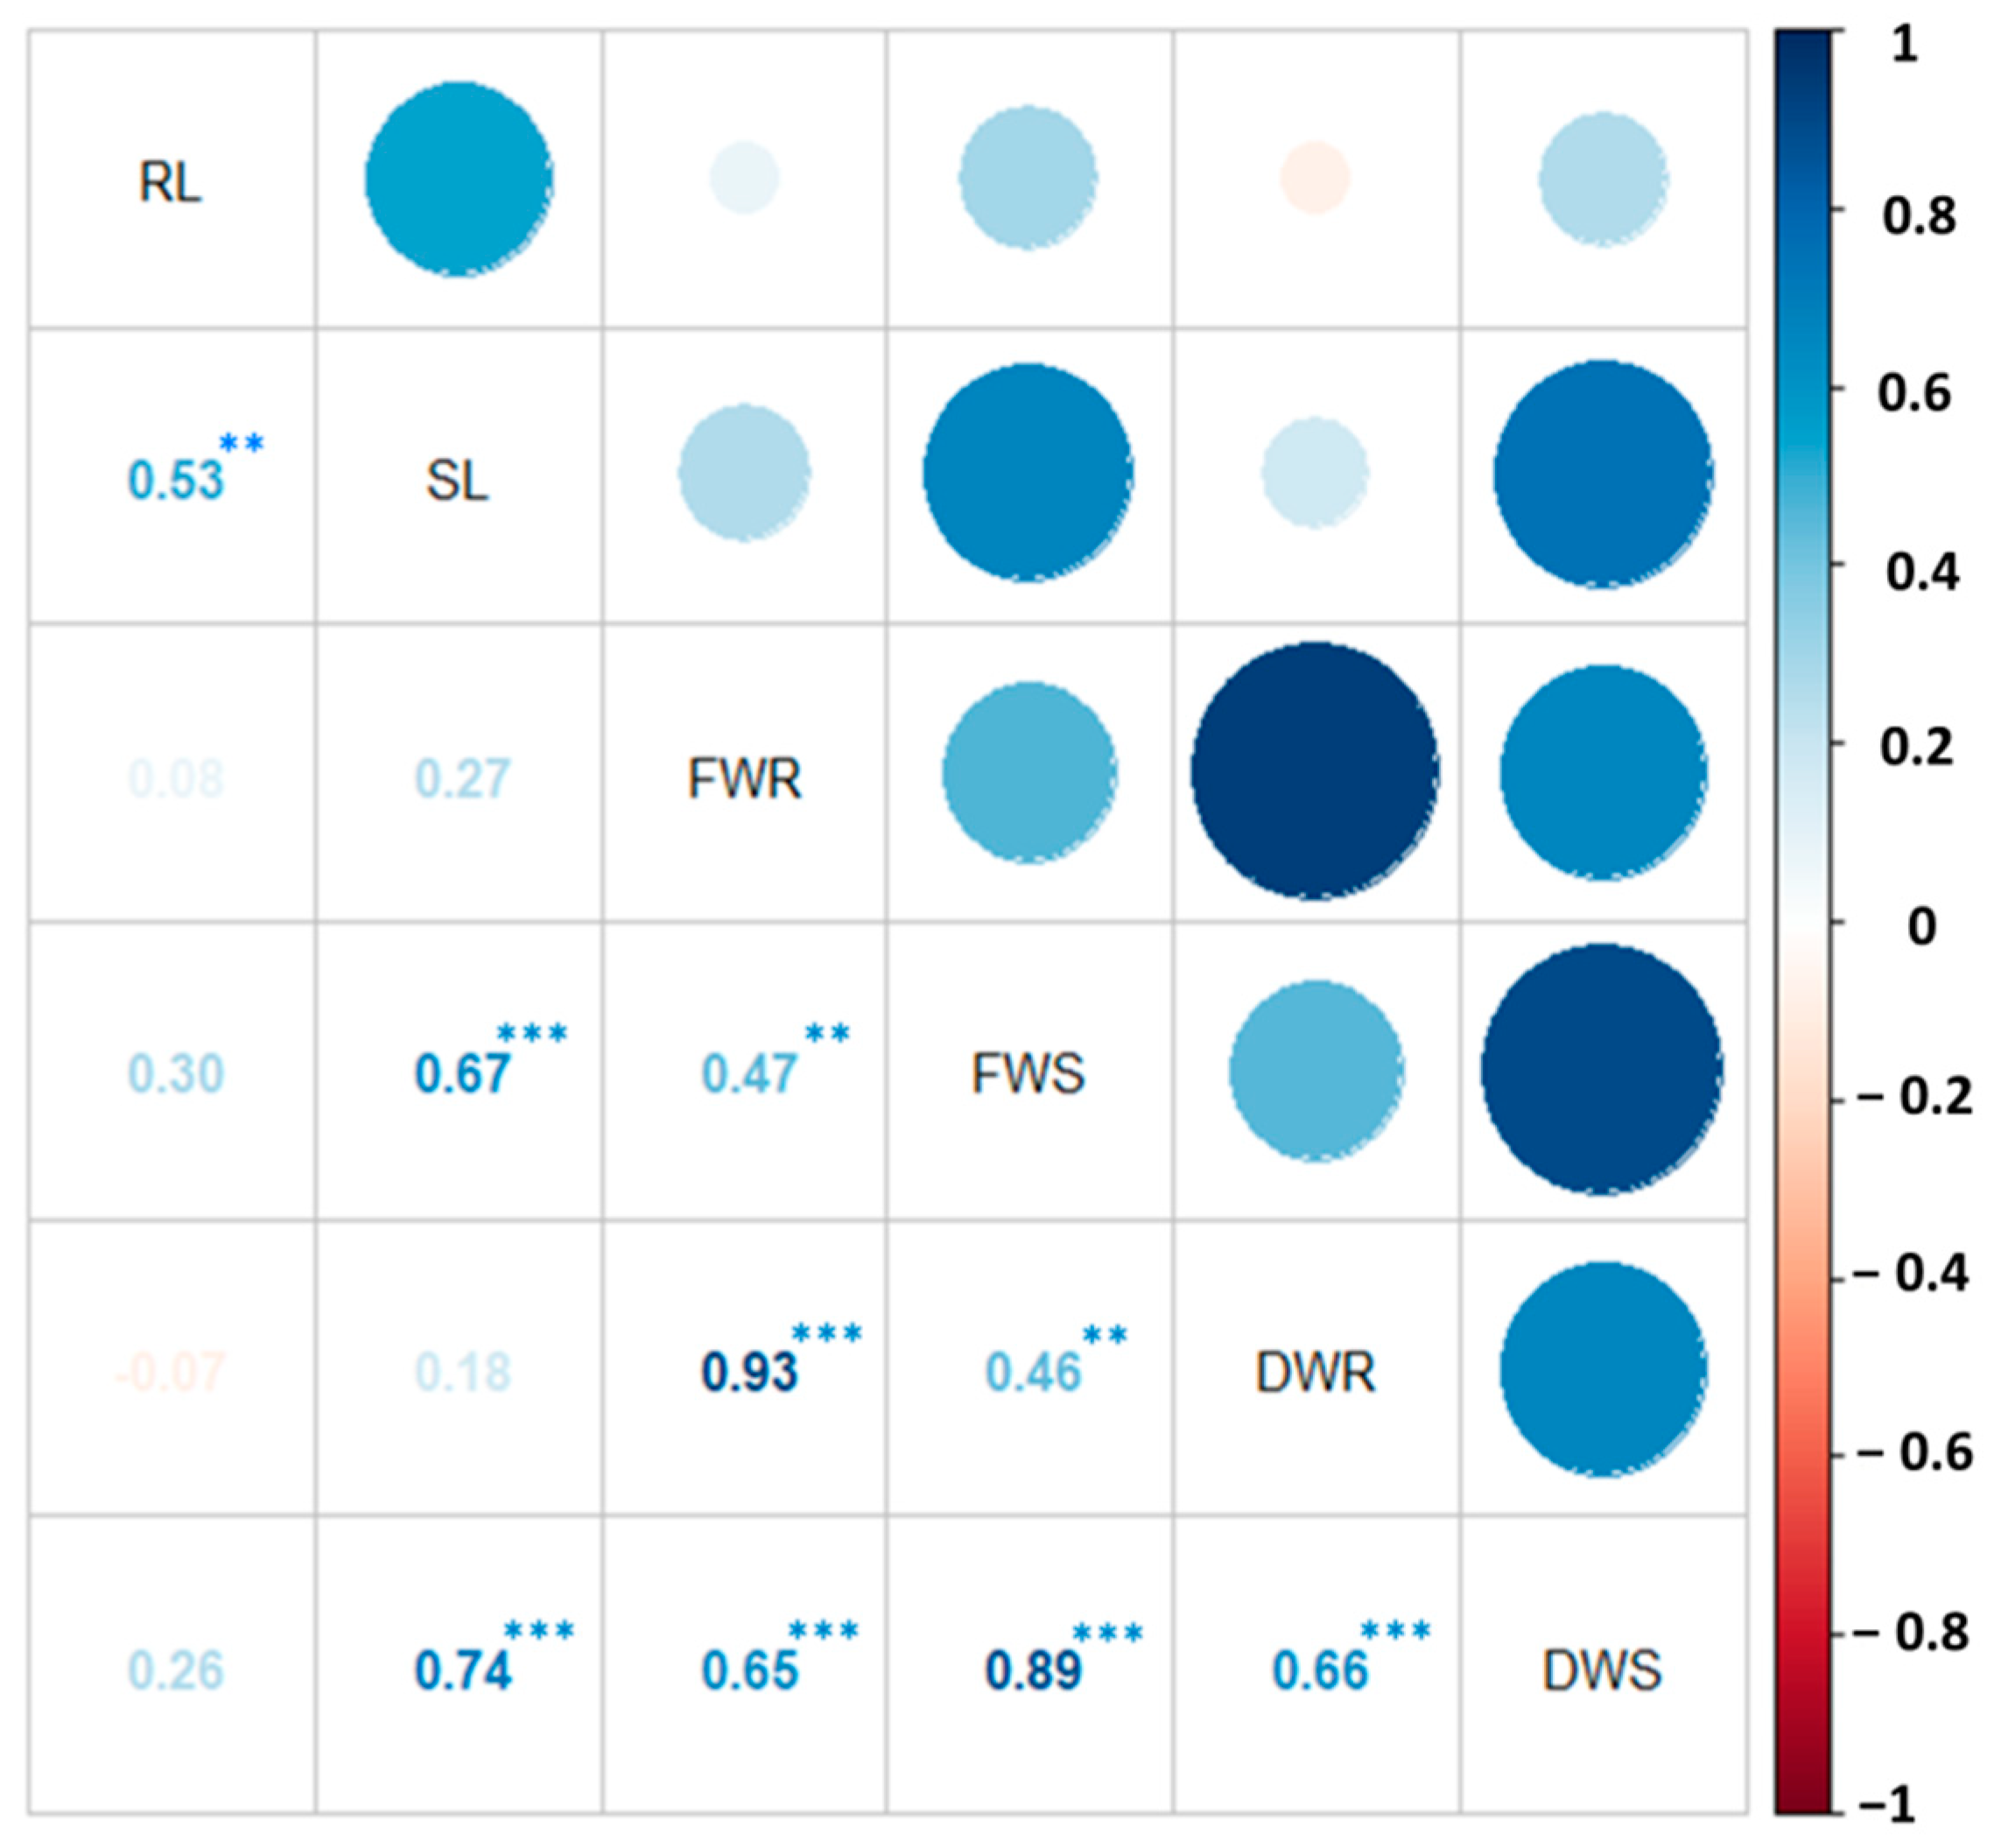
3.2.3. Relationship among Phenotypic Traits of Improved and Advanced Chickpea Genotypes

Pearson’s simple correlation analysis among six phenotypic traits of 31 chickpea genotypes grown in a 120 µM Al solution revealed significant positive correlations among all phenotypic traits, except for the weak non-significant associations observed among RL and SL with root weight measurements (FWR and DWR) (Figure 4). A strong positive correlation (p < 0.001) was detected among fresh and dry biomasses of roots and shoots, respectively. Likewise, significant (p < 0.001) positive relationships were observed between SL and shoot biomasses (FWS and DWS). RL and SL exhibited a significant (p < 0.01) moderate level of association with each other (Figure 4).

4. Discussion

In the present study, two separate experiments were conducted. A dose–response experiment tested the effect of six Al concentrations on six chickpea genotypes, identifying 120 µM Al as the treatment best suited to differentiating among genotypes. In a second experiment, treatments with 0 and 120 µM Al were used to test and rank the Al tolerance of thirty-one improved cultivars and breeding lines. Working with the pulse legume pigeon pea, Choudhary and Singh [29] also identified ~120 µM Al as the treatment best suited to discriminating among genotypes. Under 120 µM Al treatment, root length (RL) was the most strongly affected trait (average reduction rate of 64%), consistent with studies in other pulse legumes [31,42,58].
Across all chickpea genotypes, increasing Al concentrations above 50 µM caused a progressive and significant decline in all trait values. Despite the well-established main effect of Al toxicity [59] on plant traits, we also observed significant and consistent variation among plant genotypes in their degree of sensitivity to aluminum. Thus, in the dose–response experiment, Dalota and Wollega LV were the most tolerant while Akaki was the most sensitive at all aluminum concentrations. The fact that these reference genotypes performed similarly in the single-dose experiment supports the validity of the genotype rankings for 31 Ethiopian accessions. Species-level variation in Al tolerance has been observed in numerous other studies, including in rice [25], other pulse legumes, including lentil [42], common bean [41] and pigeon pea [29], and in both cultivated chickpea [44,48] and wild Cicer species [48].
In contrast to the toxic effect of Al at high concentrations, certain chickpea genotypes exhibited root growth stimulation at 50 µM Al. Genotypes Dalota and Wollega LV exhibited both the greatest root growth stimulation at 50 µM Al and also the greatest tolerance at 120 µM Al, suggesting that relevant variation may exist at sub-phytotoxic concentrations of Al. Stimulation of root growth by Al could have agronomic significance, because soil pH, which is the proximate cause of Al solubilization, is often stratified by depth in agricultural soils [60]. Thus, rapid root growth could confer escape to deeper soil fractions where pH effects tend to be less extreme. Root growth stimulation by low Al concentrations is widespread among plants [25,61], including in the pulse legumes cowpea [62] and faba bean [63]. Consistent with our survey of Ethiopian chickpea varieties, other authors also report variation in the strength of the growth stimulation response among genotypes within a species [61]. Although the mechanism of root growth stimulation by Al is unknown, some authors suggest enhanced nutrient uptake [25,62], especially the uptake of iron and phosphorous, as a factor.
It is noteworthy that genotypes also differed significantly for the measured traits in the absence of Al. However, because all assays were conducted at pH 4.5, we cannot discriminate between scenarios of differing tolerance to low pH stress or innate differences in root architecture. Neto et al. [31] reported similar results in common bean, where cultivars were distinct for measured traits, even in the absence of Al, and attributed to differences in genetic capacities.
The root tolerance index (RTI) permits comparison between genotypes and among experiments because it expresses trait values relative to untreated controls. Thus, RTI calculations yielded a consistent ranking of tolerant and susceptible genotypes between the dose–response and single-dose experiments, with Dalota, Teji and Wollega LV as the most tolerant and Akaki and Fetenech as the most sensitive. However, Hede et al. [30] point out that while RTI identifies genotypes with superior Al tolerance, it can obscure desirable agronomic characteristics, such as root vigor. In the current study, genotype DZ-2012-CK-0237 had a moderate root tolerance index in the upper quartile, but its root system was significantly longer in both control and Al treatments (Table 5). Thus, chickpea improvement programs should consider both absolute and relative trait values in selecting breeding materials.
Hede et al. [18] report that Al-tolerant genotypes identified through hydroponic screens often display improved agronomic performance relative to sensitive genotypes. Thus, the Al-tolerant genotypes identified here are potentially valuable materials for Al tolerance breeding in chickpea. Moreover, given the significant trait variation observed here, we suggest that screening a larger collection of germplasm using a similar hydroponic scheme is likely to have added value.

5. Conclusions

The results of this study suggest that Ethiopian chickpea germplasm may be a useful source of Al tolerance traits. As a next step, Al-tolerant and susceptible genotypes identified in the present study should be tested under multi-location field trials to assess the agricultural relevance of these traits. Such trials should include both acidic aluminum toxic soils and non-toxic limed soil controls. Depending on the results of such field trials, tolerant genotypes could be introduced into chickpea breeding programs. The materials identified in this study would have further value if the explanatory genetic loci were identified by means of genetic mapping (e.g., QTL or genetic association) and further explored using genomic prediction approaches. In any case, further characterization of Ethiopian chickpea germplasm, including historic landraces (farmers’ varieties) and conserved gene bank accessions, is required to obtain a comprehensive understanding of acid and Al tolerance in the Ethiopian situation.

Supplementary Materials

The following are available online at https://www.mdpi.com/article/10.3390/agronomy12040948/s1. Table S1. Descriptions of chickpea genotypes used in the screening experiment. Table S2. Mean relative performances of chickpea genotypes for the five Al concentrations (50, 100, 120, 150 and 200) µM relative to 0 µM Al.

Author Contributions

Conceptualization, H.N., K.T. and T.H.; methodology, H.N. and K.T.; software, H.N. and K.T.; validation, H.N., K.T., T.H. and D.R.C.; formal analysis, H.N. and K.T.; investigation, H.N. and K.T.; resources, K.T., D.R.C. and T.H.; data curation, H.N. and K.T.; writing—original draft preparation, H.N. and K.T.; writing—review and editing, H.N., D.R.C., K.T. and T.H.; visualization, H.N., K.T. and D.R.C.; supervision, K.T., T.H. and D.R.C.; project administration, K.T., T.H. and D.R.C.; funding acquisition, K.T., D.R.C. and T.H. All authors have read and agreed to the published version of the manuscript.

Funding

This research was part of a collaborative project entitled ‘Enhancing Food Security through Improved Productivity, Nutrition and Marketing of Chickpea in Central and Western Ethiopia.’ The study was supported by the USAID-PEER Program Cycle-4, administered by the U.S. National Academies of Sciences, Engineering and Medicine (NAS), and by the USAID Award AID-OAA-A-14-00005 to D.R.C. and K.T.

Institutional Review Board Statement

Not applicable.

Informed Consent Statement

Not applicable.

Data Availability Statement

Not applicable.

Acknowledgments

The authors would like to acknowledge Institute of Biotechnology, Addis Ababa University for its unreserved support during the course of this study and Debre Zeit Agricultural Research Center (DZARC) for its kind willingness in providing seeds of improved and advanced chickpea lines for the experiment.

Conflicts of Interest

The authors declare no conflict of interest.

References

  1. Damte, T.; Ojiewo, C.O. Current status of wilt/root rot diseases in major chickpea growing areas of Ethiopia. Arch. Phytopathol. Plant Prot. 2016, 49, 222–238. [Google Scholar] [CrossRef]
  2. FAOSTAT. FAO (Food and Agriculture Organization of the United Nations). Available online: https://www.fao.org/faostat/en/ (accessed on 18 June 2020).
  3. CSA (Central Statistical Agency). The Federal Democratic Republic of Ethiopia Central Statistical Agency Report on Area and Production of Major Crops Private Peasant Holdings; Meher Season: Addis Ababa, Ethiopia, 2018; pp. 1–58. [Google Scholar]
  4. Dadi, L.; Regassa, S.; Fikre, A.; Mitiku, D.; Gaur, P.; Gowda, C.; Bantilan, M. Adoption Studies on Improved Chickpea Varieties in Ethiopia; International Crops Research Institute for the Semi-Arid Tropics (ICRISAT): Patancheru, India, 2005; pp. 1–32. [Google Scholar]
  5. Shiferaw, B.; Teklewold, H. Structure and Functioning of Chickpea Markets in Ethiopia: Evidence Based on Analyses of Value Chains Linking Smallholders and Markets; Improving Productivity and Market Success (IPMS) of Ethiopian Farmers Project Working Paper 6; ILRI (International Livestock Research Institute): Nairobi, Kenya, 2007; pp. 1–63. [Google Scholar]
  6. Ferede, S.; Fikre, A.; Ahmed, S. Assessing the Competitiveness of Smallholders Chickpea Production in the Central Highlands of Ethiopia. Ethiop. J. Crop Sci. 2018, 6, 51–65. [Google Scholar]
  7. Korbu, L.; Tafes, B.; Kassa, G.; Mola, T.; Fikre, A. Unlocking the genetic potential of chickpea through improved crop management practices in Ethiopia. A review. Agron. Sustain. Dev. 2020, 40, 13. [Google Scholar] [CrossRef]
  8. Ferede, S.; Aliy, S.; Girma, N. Validating Product Concepts for Optimizing Chickpea Breeding; Ethiopian Institute of Agricultural Research (EIAR): Addis Ababa, Ethiopia, 2019; pp. 1–55.
  9. USDA (United States Department of Agriculture Foreign Agricultural Service). Pulse Crops Market Update, Assessments of Commodity and Trade Issues; Report Number: ET1819; Global Agricultural Information Network (GAIN): Addis Ababa, Ethiopia, 2018.
  10. Fikre, A.; Funga, A.; Korbu, L.; Eshete, M.; Girma, N. Stability Analysis in Chickpea Genotype Sets as Tool for Breeding Germplasm Structuring Strategy and Adaptability Scoping. Ethiop. J. Crop Sci. 2018, 6, 19–37. [Google Scholar]
  11. Hawando, T. Soil and Climatic Stresses on Chickpea Production in Ethiopia. In Adaptation of Chickpea and Pigeonpea to Abiotic Stresses, Proceedings of the Consultants’ Workshop, ICRISAT Center, Patancheru, India, 19–21 December 1984; Gopalachari, N.C., Garver, C.L., Eds.; International Crops Research Institute for the Semi-Arid Tropics (ICRISAT): Patancheru, India, 1987; pp. 159–167. [Google Scholar]
  12. Alemu, B.; Lule, D. Yield and agronomic performances of desi type chickpea genotypes against acidic soil of Western Ethiopia. J. Agric. Biotechnol. Sustain. Dev. 2018, 10, 116–121. [Google Scholar] [CrossRef] [Green Version]
  13. Delhaize, E.; Ryan, P.R. Aluminum toxicity and tolerance in plants. Plant Physiol. 1995, 107, 315–321. [Google Scholar] [CrossRef] [PubMed] [Green Version]
  14. Kochian, L.V.; Piñeros, M.A.; Hoekenga, O.A. The physiology, genetics and molecular biology of plant aluminum resistance and toxicity. Plant Soil 2005, 274, 175–195. [Google Scholar] [CrossRef]
  15. Roy, B.; Bhadra, S. Effects of toxic levels of aluminium on seedling parameters of rice under hydroponic culture. Rice Sci. 2014, 21, 217–223. [Google Scholar] [CrossRef]
  16. Delhaize, E.; Ryan, P.R.; Randall, P.J. Aluminum Tolerance in Wheat (Triticum aestivum L.) II. Aluminum-Stimulated Excretion of Malic Acid from Root Apices. Plant Physiol. 1993, 695–702. [Google Scholar] [CrossRef] [Green Version]
  17. Kochian, L.V. Cellular mechanisms of aluminum toxicity and resistance in plants. Annu. Rev. Plant Physiol. Plant Mol. Biol. 1995, 46, 237–260. [Google Scholar] [CrossRef]
  18. Hede, A.R.; Skovmand, B.; López-Cesati, J. Acid Soils and Aluminum Toxicity. In Application of Physiology in Wheat Breeding; Reynolds, M.P., Ortiz-Monasterio, J.I., McNab, A., Eds.; International Maize and Wheat Improvement Center (CIMMYT): Texcoco, Mexico, 2001; pp. 172–182. [Google Scholar]
  19. Blancaflor, E.B.; Jones, D.L.; Gilroy, S. Alterations in the Cytoskeleton Accompany Aluminum Induced Growth Inhibition and Morphological Changes in Primary Roots of Maize. Plant Physiol. 1998, 118, 159–172. [Google Scholar] [CrossRef] [PubMed] [Green Version]
  20. Legesse, H.; Nigussie-Dechassa, R.; Gebeyehu, S.; Bultosa, G.; Mekbib, F. Response to Soil Acidity of Common Bean Genotypes (Phaseolus vulgaris L.) under Field Conditions at Nedjo, Western Ethiopia Hirpa. Sci. Technol. Arts Res. J. 2013, 2, 3–15. [Google Scholar] [CrossRef] [Green Version]
  21. Kassahun, B. Soil Fertility Mapping and Fertilizer Blending; Ethiopian Agricultural Transformation Agency (Ethiopian ATA): Addis Ababa, Ethiopia, 2015.
  22. Mosissa, F. Progress of Soil Acidity Management Research in Ethiopia. Adv. Crop Sci. Technol. 2018, 6, 1–8. [Google Scholar] [CrossRef]
  23. Kassie, M.; Shiferaw, B.; Asfaw, S.; Abate, T.; Muricho, G.; Ferede, S.; Eshete, M.; Assefa, K. Current Situation and Future Outlooks of the Chickpea Sub—Sector in Ethiopia; International Crops Research Institute for the Semi-Arid Tropics (ICRISAT): Nairobi, Kenya, 2009; pp. 1–39. [Google Scholar]
  24. Agegnehu, G.; Yirga, C.; Erkossa, T. Soil Acidity Management; Ethiopian Institute of Agricultural Research (EIAR): Addis Ababa, Ethiopia, 2019; pp. 1–56.
  25. Fageria, N.K.; Wright, R.J.; Baligar, V.C. Rice cultivar response to aluminum in nutrient solution. Commun. Soil Sci. Plant Anal. 1988, 19, 1133–1142. [Google Scholar] [CrossRef]
  26. Ma, J.F.; Zheng, S.J.; Li, X.F.; Takeda, K.; Matsumoto, H. A rapid hydroponic screening for aluminium tolerance in barley. Plant Soil 1997, 191, 133–137. [Google Scholar] [CrossRef]
  27. Rao, I.M.; Zeigler, R.S.; Vera, R.; Sarkarung, S. Selection and Breeding for Acid-Soil Tolerance in Crops Upland rice and tropical forages as case studies. Bioscience 1993, 43, 454–465. [Google Scholar] [CrossRef]
  28. Furlani, P.R.; Clark, R.B. Screening Sorghum for Aluminum Tolerance in Nutrient Solutions 1. Agron. J. 1981, 73, 587–594. [Google Scholar] [CrossRef]
  29. Choudhary, A.K.; Singh, D. Screening of pigeonpea genotypes for nutrient uptake efficiency under aluminium toxicity. Physiol. Mol. Biol. Plants 2011, 17, 145–152. [Google Scholar] [CrossRef] [Green Version]
  30. Hede, A.R.; Skovmand, B.; Ribaut, J.M.; González-De-León, D.; Stølen, O. Evaluation of aluminium tolerance in a spring rye collection by hydroponic screening. Plant Breed. 2002, 121, 241–248. [Google Scholar] [CrossRef]
  31. Dos Santos Neto, J.; Delfini, J.; Silva, T.W.; Hirose, A.A.; Novais, J.M.; Azeredo Gonçalves, L.S.; Moda-Cirino, V. Response of common bean cultivars and lines to aluminum toxicity. Agronomy 2020, 10, 296. [Google Scholar] [CrossRef] [Green Version]
  32. Shavrukov, Y.; Genc, Y.; Hayes, J. The Use of Hydroponics in Abiotic Stress Tolerance Research. In Hydroponics—A Standard Methodology for Plant Biological Researches; Asao, T., Ed.; InTech: Rijeka, Croatia, 2012; pp. 39–66. [Google Scholar]
  33. Giaveno, C.D.; Miranda Filho, J.B. Rapid screening for aluminum tolerance in maize (Zea mays L.). Genet. Mol. Biol. 2000, 23, 847–850. [Google Scholar] [CrossRef] [Green Version]
  34. Foy, C.D. Tolerance of durum wheat lines to an acid, aluminum-toxic subsoil. J. Plant Nutr. 1996, 19, 1381–1394. [Google Scholar] [CrossRef]
  35. Wayima, E.F.; Ligaba-Osena, A.; Dagne, K.; Tesfaye, K.; Machuka, E.M.; Mutiga, S.K.; Delhaize, E. Screening of diverse Ethiopian durum wheat accessions for aluminum tolerance. Agronomy 2019, 9, 440. [Google Scholar] [CrossRef] [Green Version]
  36. Echart, C.L.; Fernandes Barbosa-Neto, J.; Garvin, D.F.; Cavalli-Molina, S. Aluminum tolerance in barley: Methods for screening and genetic analysis. Euphytica 2002, 126, 309–313. [Google Scholar] [CrossRef]
  37. Abate, E.; Hussein, S.; Laing, M.; Mengistu, F. Quantitative responses of tef [Eragrostis tef ( Zucc.) Trotter] and weeping love grass [Eragrostis curvula (Schrad.) Nees] varieties to acid soil. Aust. J. Crop Sci. 2013, 7, 1854–1860. [Google Scholar]
  38. Campbell, K.A.G.; Carter, T.E. Aluminum Tolerance in Soybean: I. Genotypic Correlation and Repeatability of Solution Culture and Greenhouse Screening Methods. Crop Sci. 1990, 30, 1049. [Google Scholar] [CrossRef]
  39. Villagarcia, M.R.; Carter, T.E.; Rufty, T.W.; Niewoehner, A.S.; Jennette, M.W.; Arrellano, C. Genotypic rankings for aluminum tolerance of soybean roots grown in hydroponics and sand culture. Crop Sci. 2001, 41, 1499–1507. [Google Scholar] [CrossRef] [Green Version]
  40. Belachew, K.Y.; Stoddard, F.L. Screening of faba bean (Vicia faba L.) accessions to acidity and aluminium stresses. PeerJ 2017, 5, e2963. [Google Scholar] [CrossRef] [Green Version]
  41. Blair, M.W.; López-Marín, H.D.; Rao, I.M. Identification of aluminum resistant Andean common bean (Phaseolus vulgaris L.) genotypes. Braz. J. Plant Physiol. 2009, 21, 291–300. [Google Scholar] [CrossRef]
  42. Singh, D.; Dikshit, H.K.; Singh, R. Variation of aluminium tolerance in lentil (Lens culinaris Medik.). Plant Breed. 2012, 131, 751–761. [Google Scholar] [CrossRef]
  43. Froese, P.S.; Carter, A.H.; Pumphrey, M.O. Recommended Crop Species and Wheat Varieties for Acidic Soil; Washington State University: Washington, DC, USA, 2015. [Google Scholar]
  44. Singh, D.; Raje, R.S. Genetics of aluminium tolerance in chickpea (Cicer arietinum). Plant Breed. 2011, 130, 563–568. [Google Scholar] [CrossRef]
  45. Rai, R. Effects of soil acidity factors on interaction of chickpea (Cicer arietinum L.) genotypes and Rhizobium strains: Symbiotic N-fixation, grain quality and grain yield in acid soils. In Plant-Soil Interactions at Low pH, Proceedings of the Second International Symposium on Plant-Soil Interactions at Low pH, Beckley West Virginia, USA, 24–29 June 1990; Wright, R.J., Baligar, V.C., Murrmann, R.P., Eds.; Springer: Dordrecht, The Netherlands, 1991; pp. 619–631. [Google Scholar]
  46. Rodrigues, C.S.; Laranjo, M.; Oliveira, S. Effect of Heat and pH Stress in the Growth of Chickpea Mesorhizobia. Curr. Microbiol. 2006, 53, 1–7. [Google Scholar] [CrossRef] [Green Version]
  47. Vargas, A.A.T.; Graham, P.H. Cultivar and pH effects on competition for nodule sites between isolates of Rhizobium in beans. Plant Soil 1989, 117, 195–200. [Google Scholar] [CrossRef]
  48. Vance, W.; Pradeep, K.; Strachan, S.R.; Diffey, S.; Bell, R.W. Novel Sources of Tolerance to Aluminium Toxicity in Wild Cicer (Cicer reticulatum and Cicer echinospermum) Collections. Front. Plant Sci. 2021, 12, 678211. [Google Scholar] [CrossRef] [PubMed]
  49. Simon, L.; Smalley, T.J.; Benton Jones, J., Jr.; Lasseigne, F.T. Aluminum toxicity in tomato. Part 1. growth and mineral nutrition. J. Plant Nutr. 1994, 17, 293–306. [Google Scholar] [CrossRef]
  50. Delhaize, E.; Ryan, P.R.; Hebb, D.M.; Yamamoto, Y.; Sasaki, T.; Matsumoto, H. Engineering high-level aluminum tolerance in barley with the ALMT1 gene. Proc. Natl. Acad. Sci. USA 2004, 101, 15249–15254. [Google Scholar] [CrossRef] [PubMed] [Green Version]
  51. Pinheiro, J.; Bates, D.; DebRoy, S.S.; Sarkar, D.; R Core Development Team. Nlme: Linear and Nonlinear Mixed Effects Models. R Package Version 3.1-155. 2022. Available online: https://CRAN.R-project.org/package=nlme (accessed on 13 December 2021).
  52. Bates, D.; Mächler, M.; Bolker, B.; Walker, S. Fitting Linear Mixed-Effects Models Using lme4. J. Stat. Softw. 2015, 67, 48. [Google Scholar] [CrossRef]
  53. R Core Team. R: A Language and Environment for Statistical Computing. R Foundation for Statistical Computing, Vienna, Austria. 2021. Available online: https://www.R-project.org/ (accessed on 20 September 2021).
  54. Wickham, H. Ggplot2: Elegant Graphics for Data Analysis. Springer-Verlag New York. 2016. Available online: https://ggplot2.tidyverse.org (accessed on 20 September 2021).
  55. Wickham, H.; François, R.; Henry, L.; Müller, K. Dplyr: A Grammar of Data Manipulation. R Package Version 0.7.6. 2018. Available online: https://CRAN.R-project.org/package=dplyr (accessed on 13 December 2021).
  56. Wei, T.; Simko, V. R Package “Corrplot”: Visualization of a Correlation Matrix (Version 0.92). 2021. Available online: https://github.com/taiyun/corrplot (accessed on 20 September 2021).
  57. Baier, A.C.; Somers, D.J.; Gusiafson, J.P. Aluminium tolerance in wheat: Correlating hydroponic evaluations with field and soil performances. Plant Breed. 1995, 114, 291–296. [Google Scholar] [CrossRef]
  58. Choudhury, S.; Sharma, P. Aluminum stress inhibits root growth and alters physiological and metabolic responses in chickpea (Cicer arietinum L.). Plant Physiol. Biochem. 2014, 85, 63–70. [Google Scholar] [CrossRef]
  59. Fageria, N.K.; Ballgar, V.C.; Wright, R.J. Aluminum toxicity in crop plants. J. Plant Nutr. 1988, 11, 37–41. [Google Scholar] [CrossRef]
  60. Paul, K.I.; Black, A.S.; Conyers, M. Development of Acidic Subsurface Layers of Soil under Various Management Systems. Adv. Agron. 2003, 78, 187–214. [Google Scholar]
  61. Foy, C.D.; Chaney, R.L.; White, M.C. The Physiology of Metal Toxicity in Plants. Annu. Rev. Plant Physiol. 1978, 29, 511–566. [Google Scholar] [CrossRef]
  62. Kushwaha, J.K.; Pandey, A.K.; Dubey, R.K.; Singh, V.; Mailappa, A.S.; Singh, S. Screening of cowpea [Vigna unguiculata (L.) walp.] for aluminium tolerance in relation to growth, yield and related traits. Legum. Res. 2017, 40, 434–438. [Google Scholar] [CrossRef] [Green Version]
  63. Belachew, K.Y. Root and Shoot Traits Associated with Acidity and Drought Tolerance in Vicia faba L. Plants. Ph.D. Thesis, University of Helsinki, Helsinki, Finland, 25 October 2019. [Google Scholar]
Figure 1. Main effect of increasing aluminum concentration on chickpea seedling traits. (A) Relative root length (% RL); (B) relative shoot length (% SL), (C) relative fresh weight root (% FWR); (D) relative fresh weight shoot (% FWS); (E) relative number of leaves (% NL); (F) relative number of lateral roots (% NLR). Data represent the normalized values for each trait expressed relative to 0 µM Al for each genotype and aggregated among the six different cultivated accessions. All solutions were at pH 4.5. Box plots delimit the mid-50% range of trait values. Horizontal lines in the plot represent the median of each trait’s values. Vertical lines extending from each box represent ranges of values among all genotypes. Box plots with the same letter are not significantly different from each other.
Agronomy 12 00948 g001
Figure 2. Response of individual chickpea genotypes to increasing Al concentrations. Data represent absolute values of each genotype for each trait. All solutions were at pH 4.5. (A) RL—root length (cm); (B) SL—shoot length (cm); (C) FWR—fresh weight root (g); (D) FWS—fresh weight shoot (g); (E) NL—number of leaves; (F) NLR—number of lateral roots.
Agronomy 12 00948 g002
Figure 3. Correlation analysis among phenotypic traits and Al concentrations of chickpea genotypes combined for all the six Al concentrations. Al. Conc, Al concentrations; RL, root length; SL, shoot length; NL, number of leaves; NLR, number of lateral roots; FWR, fresh weight roots; FWS, fresh weight shoots. Significance codes: ‘***’ 0.001; ‘**’ 0.01.
Agronomy 12 00948 g003
Figure 4. Correlation analysis among phenotypic traits of chickpea genotypes grown in 120 µM Al concentration. RL: root length; SL: shoot length; FWR: fresh weight roots; FWS: fresh weight shoots; DWR: dry weight roots; DWS: dry weight shoots. Significance codes: ‘***’ 0.001; ‘**’ 0.01.
Agronomy 12 00948 g004
Table 1. Descriptions of chickpea genotypes used in the optimization experiment.
GenotypeTypeOriginClassificationYear of ReleaseSeed Source
Akaki DesiICRISATVariety1995DZARC
Dalota DesiICRISATVariety2013DZARC
Dubie DesiEthiopiaVariety1978DZARC
Minjar DesiICRISATVariety2010DZARC
Natoli DesiICRISATVariety2007DZARC
Wollega LV DesiEthiopiaLandraceUnknownFARMERS
DZARC, Debrezeit Agricultural Research Center; ICRISAT, International Crops Research Institute for the Semi-Arid Tropics.
Table 2. Analysis of variance of chickpea genotypes and Al concentrations evaluated in a solution culture under varying levels of Al concentrations.
Mean Square
Source of VariationdfRLSLFWRFWSNLSNLRS
Genotypes511.17 ***31.67 ***0.013 *0.007 *15.170 **24.00 NS
Replication (Block)10.102.860.0050.00034.37644.10
Main plot error 50.840.860.0030.0011.02813.35
Al. Conc.5279.39 ***64.46 ***0.069 ***0.040 ***140.712 ***403.29 ***
Genotype: Al. Conc.254.87 ***1.86 NS0.002 *0.001 NS6.085 NS23.18 ***
Subplot error 301.333.0620.0010.0017.5695.85
CV(A) 11.1%9%25.2%14.9%6.4%15.4%
CV(B) 14%16.9%13.3%10.9%17.4%10.2%
R2 0.980.850.960.930.810.94
Significance codes: ‘***’ 0.001; ‘**’ 0.01; ‘*’ 0.05; NS, ‘not-significant’. df, degrees of freedom; CV (A), coefficient of variation for the main plot; CV (B), coefficient of variation for the sub plot; R2, coefficient of determination; RL, root length; SL, shoot length; FWR, fresh weight roots; FWS, fresh weight shoots; NLS, number of leaves; NLRS, number of lateral roots.
Table 3. Mean relative root growth of chickpea genotypes for the five Al concentrations (50, 100, 120, 150 and 200) µM relative to 0 µM Al.
Relative Root Length
Al Concentration
Variety050100120150200
Akaki-0.92 b0.47 c0.26 e0.24 d0.23 b
Dalota-1.77 a1.16 a0.64 a0.62 a0.44 a
Dubie-1.09 b0.58 bc0.33 de0.32 cd0.24 b
Wollega LV-1.56 ab0.81 b0.53 b0.43 b0.32 ab
Minjar-0.96 b0.55 bc0.41 cd0.33 cd0.29 ab
Natoli-1.46 ab0.61 bc0.44 bc0.35 bc0.28 ab
Range -0.90–2.150.32–1.240.24–0.670.23–0.670.21–0.54
G.M -1.290.700.440.380.30
SEM -0.110.080.040.040.03
LSD -0.650.320.100.090.18
CV % -19.6817.798.589.3122.39
Means with the same letter are not significantly different. G.M, grand mean; SEM, standard error of mean; LSD, least significant difference; CV, coefficient of variation.
Table 4. Separate and combined analysis of variance (ANOVA) for chickpea genotypes evaluated under control (0 µM Al) and Al treatment (120 µM Al) conditions.
Mean Square
Source of VariationdfRLSLFWRFWSDWRDWS
ControlReplication10.1871.7500.0010.0010.0000.001
(0 µM Al)Genotype3024.643 ***18.865 ***0.015 ***0.008 ***0.002 ***0.001 ***
Error300.5720.8320.0020.0010.00030.0003
CV 5.549.9211.4811.6615.0416.70
Al treatmentReplication10.5250.8170.00010.00010.00010.0002
(120 µM Al)Genotype302.565 ***16.790 ***0.007 ***0.0061 ***0.0012 ***0.0011 ***
Error300.4240.3130.0010.00040.00010.0001
CV 13.837.8811.5810.1815.1811.76
CombinedGenotype3016.67 ***33.71 ***0.016 ***0.013 ***0.002 ***0.002 ***
Al. Conc.12481.89 ***136.64 ***0.766 ***0.081 ***0.053 ***0.013 ***
Replication10.042.48 *0.0010.00050.00010.001 *
Genotype: Al. Conc.3010.54 ***1.94 ***0.005 ***0.001 **0.0005 **0.0002 NS
Error610.500.560.0010.0010.00020.0002
CV 7.719.2211.8911.1215.3215.01
Significance codes: ‘***’ 0.001; ‘**’ 0.01; ‘*’ 0.05; NS, ‘not-significant’. df, degrees of freedom; CV, coefficient of variation; RL, root length; SL, shoot length; FWR, fresh weight roots; FWS, fresh weight shoots; DWR, dry weight roots; DWS, dry weight shoots.
Table 5. Mean performances of chickpea genotypes at 0 and 120 µM Al concentrations.
GenotypesRoot LengthTolerance Index
Control
(pH 4.5 and 0 µM)
Al Treatment
(pH 4.5 and 120 µM)
RTI (%)
DZ-2012-CK-003215.79 c–h3.87 cd25 d–f
DZ-2012-CK-003415.03 d–j5.05 cd34 d–f
DZ-2012-CK-20113-2-004218.13 bc5.89 bc33 d–f
DZ-2012-CK-023313.44 g–o5.58 bcd42 b–f
DZ-2012-CK-023720.02 ab8.3 a42 b–f
DZ-2012-CK-031312.47 i–p4.72 cd38 c–f
Akaki16.19 c–g3.48 d22 f
Arerti15.06 d–i3.96 cd26 d–f
Chefe9.78 pq3.5 d37 c–f
Dalota7.31 r4.94 cd68 a
Dhera11.99 k–p4.64 cd39 c–f
Dimtu15.95 c–g5.19 cd33 d–f
Dubie14.83 d–j5.24 bcd35 d–f
Dz-10-1111.45 m–p3.92 cd34 d–f
Dz-10-414.17 e–l4.83 cd35 d–f
Ejere10.65 n–q3.99 cd38 c–f
Fetenech22.19 a5.07 cd23 f
Habru14.87 d–j4.33 cd30 d–f
Hora10.44 o–q4.49 cd43 b–e
Kasech12.02 j–p4.07 cd34 d–f
Kobo10.79 n–p4.81 cd45 b–d
Mariye16.52 cde4.01 cd24 ef
Mastewal17.19 b–d4.23 cd25 ef
Minjar13.79 f–m5.53 bcd40 c–f
Natoli12.92 h–o5.49 bcd43 b–f
Shasho11.58 l–p3.63 cd32 d–f
Teji6.68 r4.03 cd60 ab
Teketay14.74 d–k4.11 cd28 d–f
Wollega LV13.44 g–n7.82 ab58 a–c
Worku16.33 c–f4.30 cd26 d–f
Yelebe7.67 qr3.03 d40 c–f
Range6.68–22.193.03–8.3022–68
G.M13.664.7136
SEM0.450.150.01
CV%5.5413.8314.88
Means followed by the same letter are not significantly different; RTI, root tolerance index; G.M, grand mean; SEM, standard error of mean; CV, coefficient of variation.
Publisher’s Note: MDPI stays neutral with regard to jurisdictional claims in published maps and institutional affiliations.

