
Maize Small Leaf Spot Classification Based on Improved Deep Convolutional Neural Networks with a Multi-Scale Attention Mechanism

Abstract
:1. Introduction
- By dividing the grade of maize small leaf spot into fine-grained image classification, this paper proposes a DISE-Net model to realize the classification and detection of maize small leaf spot.
- A maize small leaf spot grade data set was collected. The data set contained 1268 maize leaves, which were divided into five categories, including infection grade 4 and healthy maize leaves. In the complex environment, the field maize disease data set is collected through various mobile devices, and then manually calibrated according to the disease classification standard.
- Based on the above data sets, the proposed DISE-Net model conducted extensive comparative experiments with VGG16, ResNet50, InceptionV3, MobileNetv1, MobileNetv2 and DenseNet121 classic networks (for example, performance, attention visualization). The results show that the proposed DISE-Net is better than the traditional six networks.
2. Materials and Methods
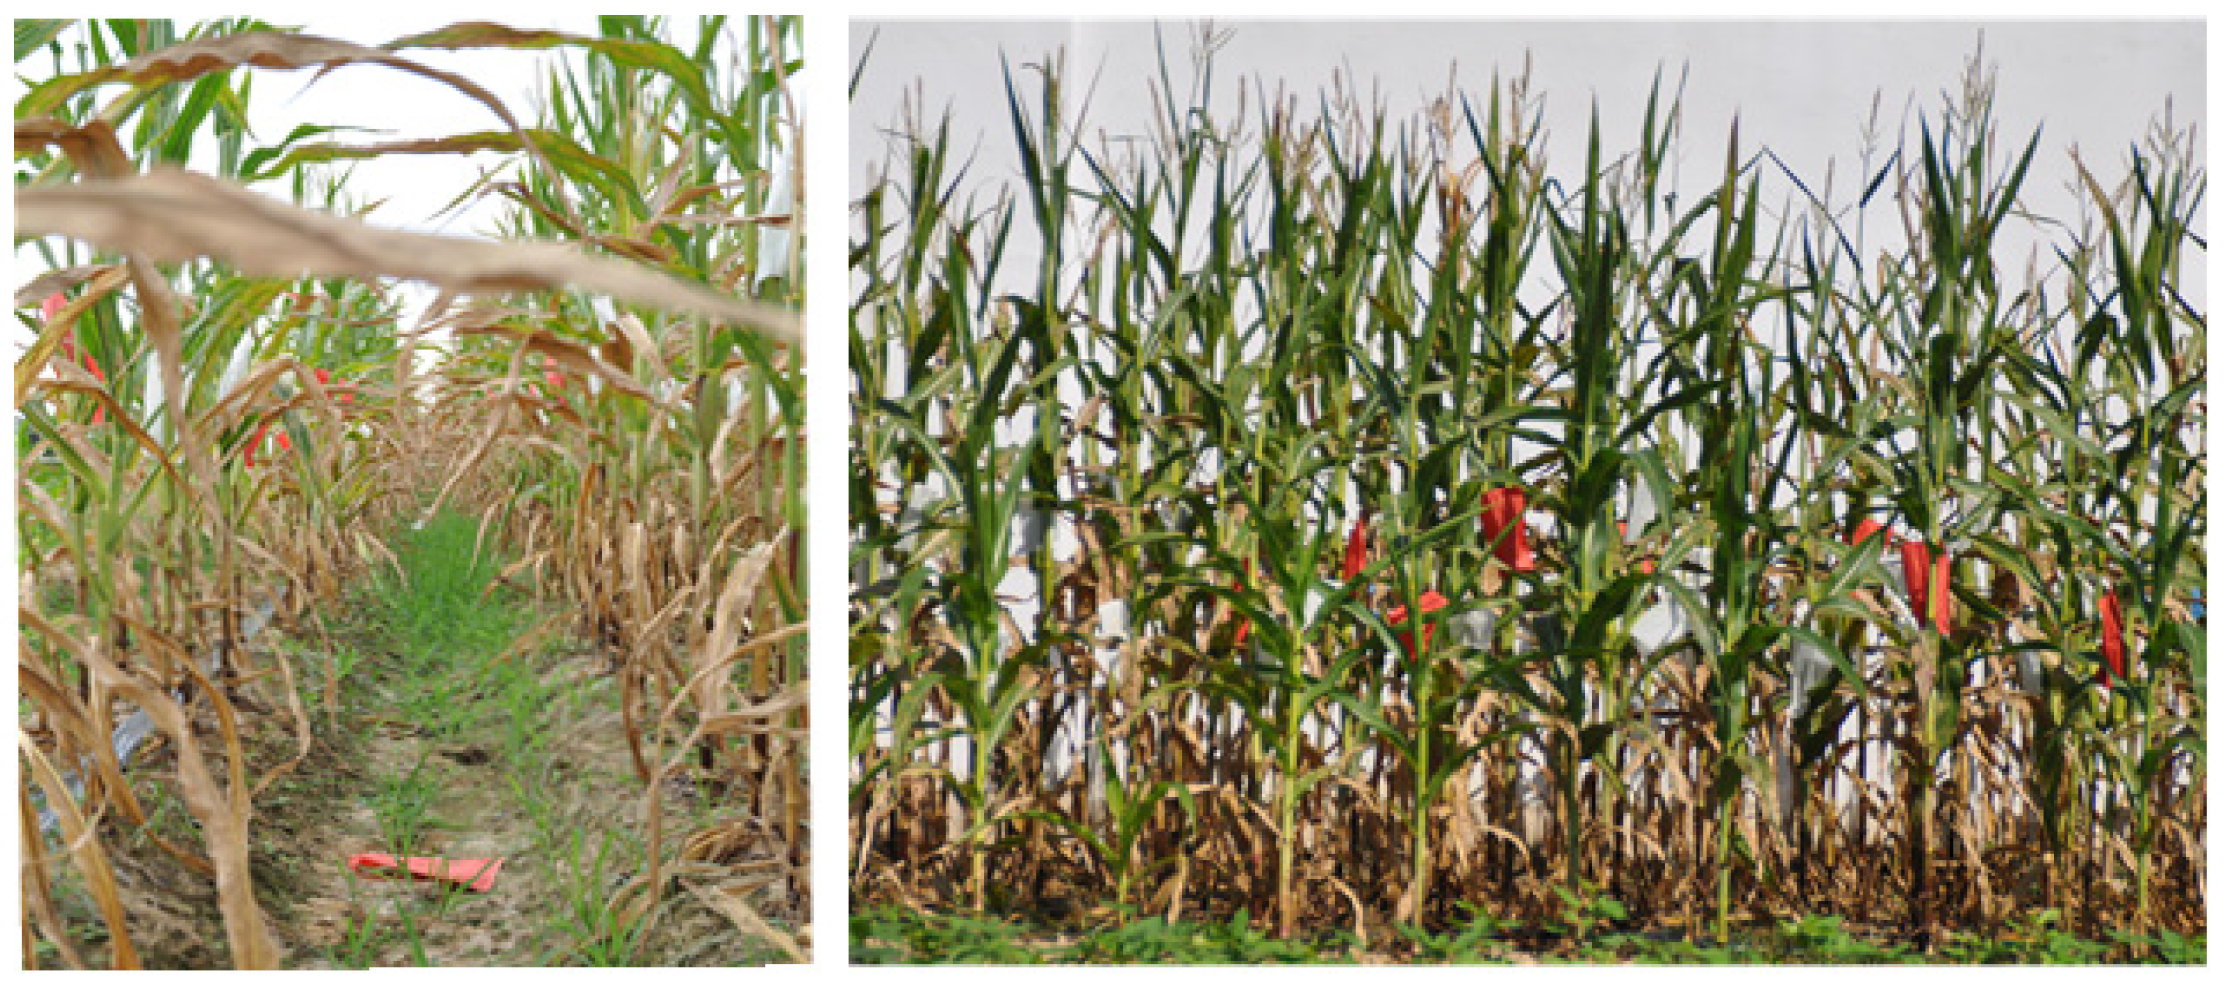
2.1. Overview of Sampling Area
2.2. Image Acquisition
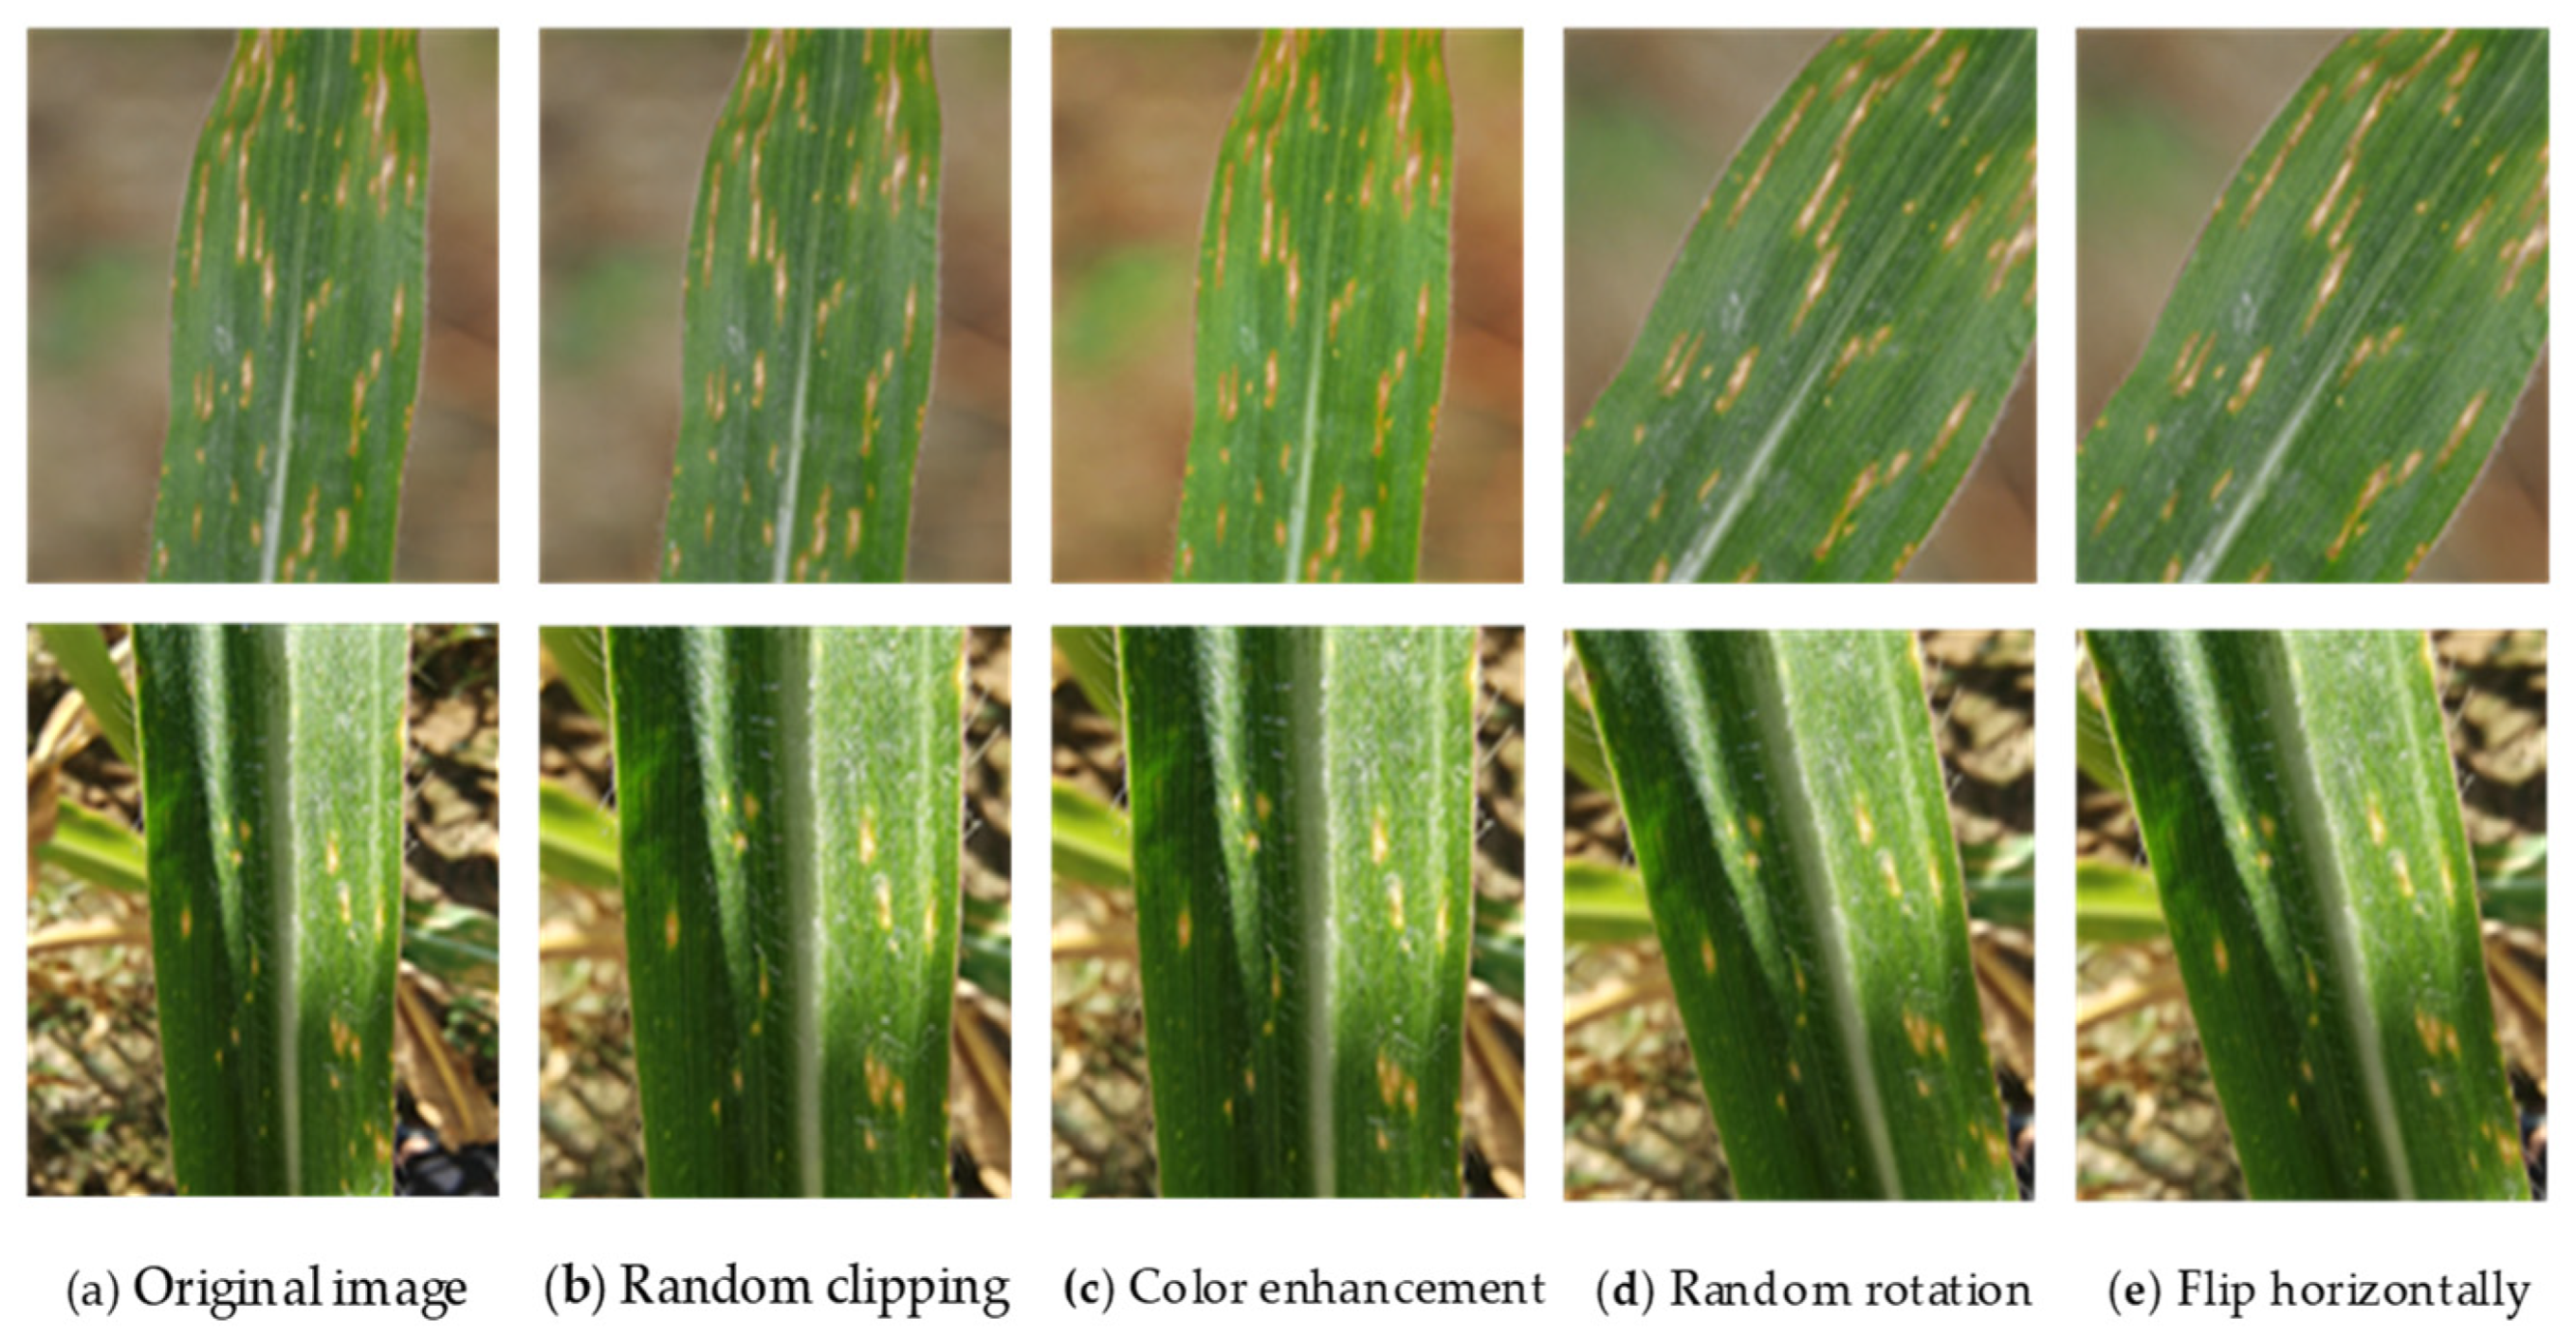
2.3. Image Enhancement
2.4. Architecture of DIS-NET Model
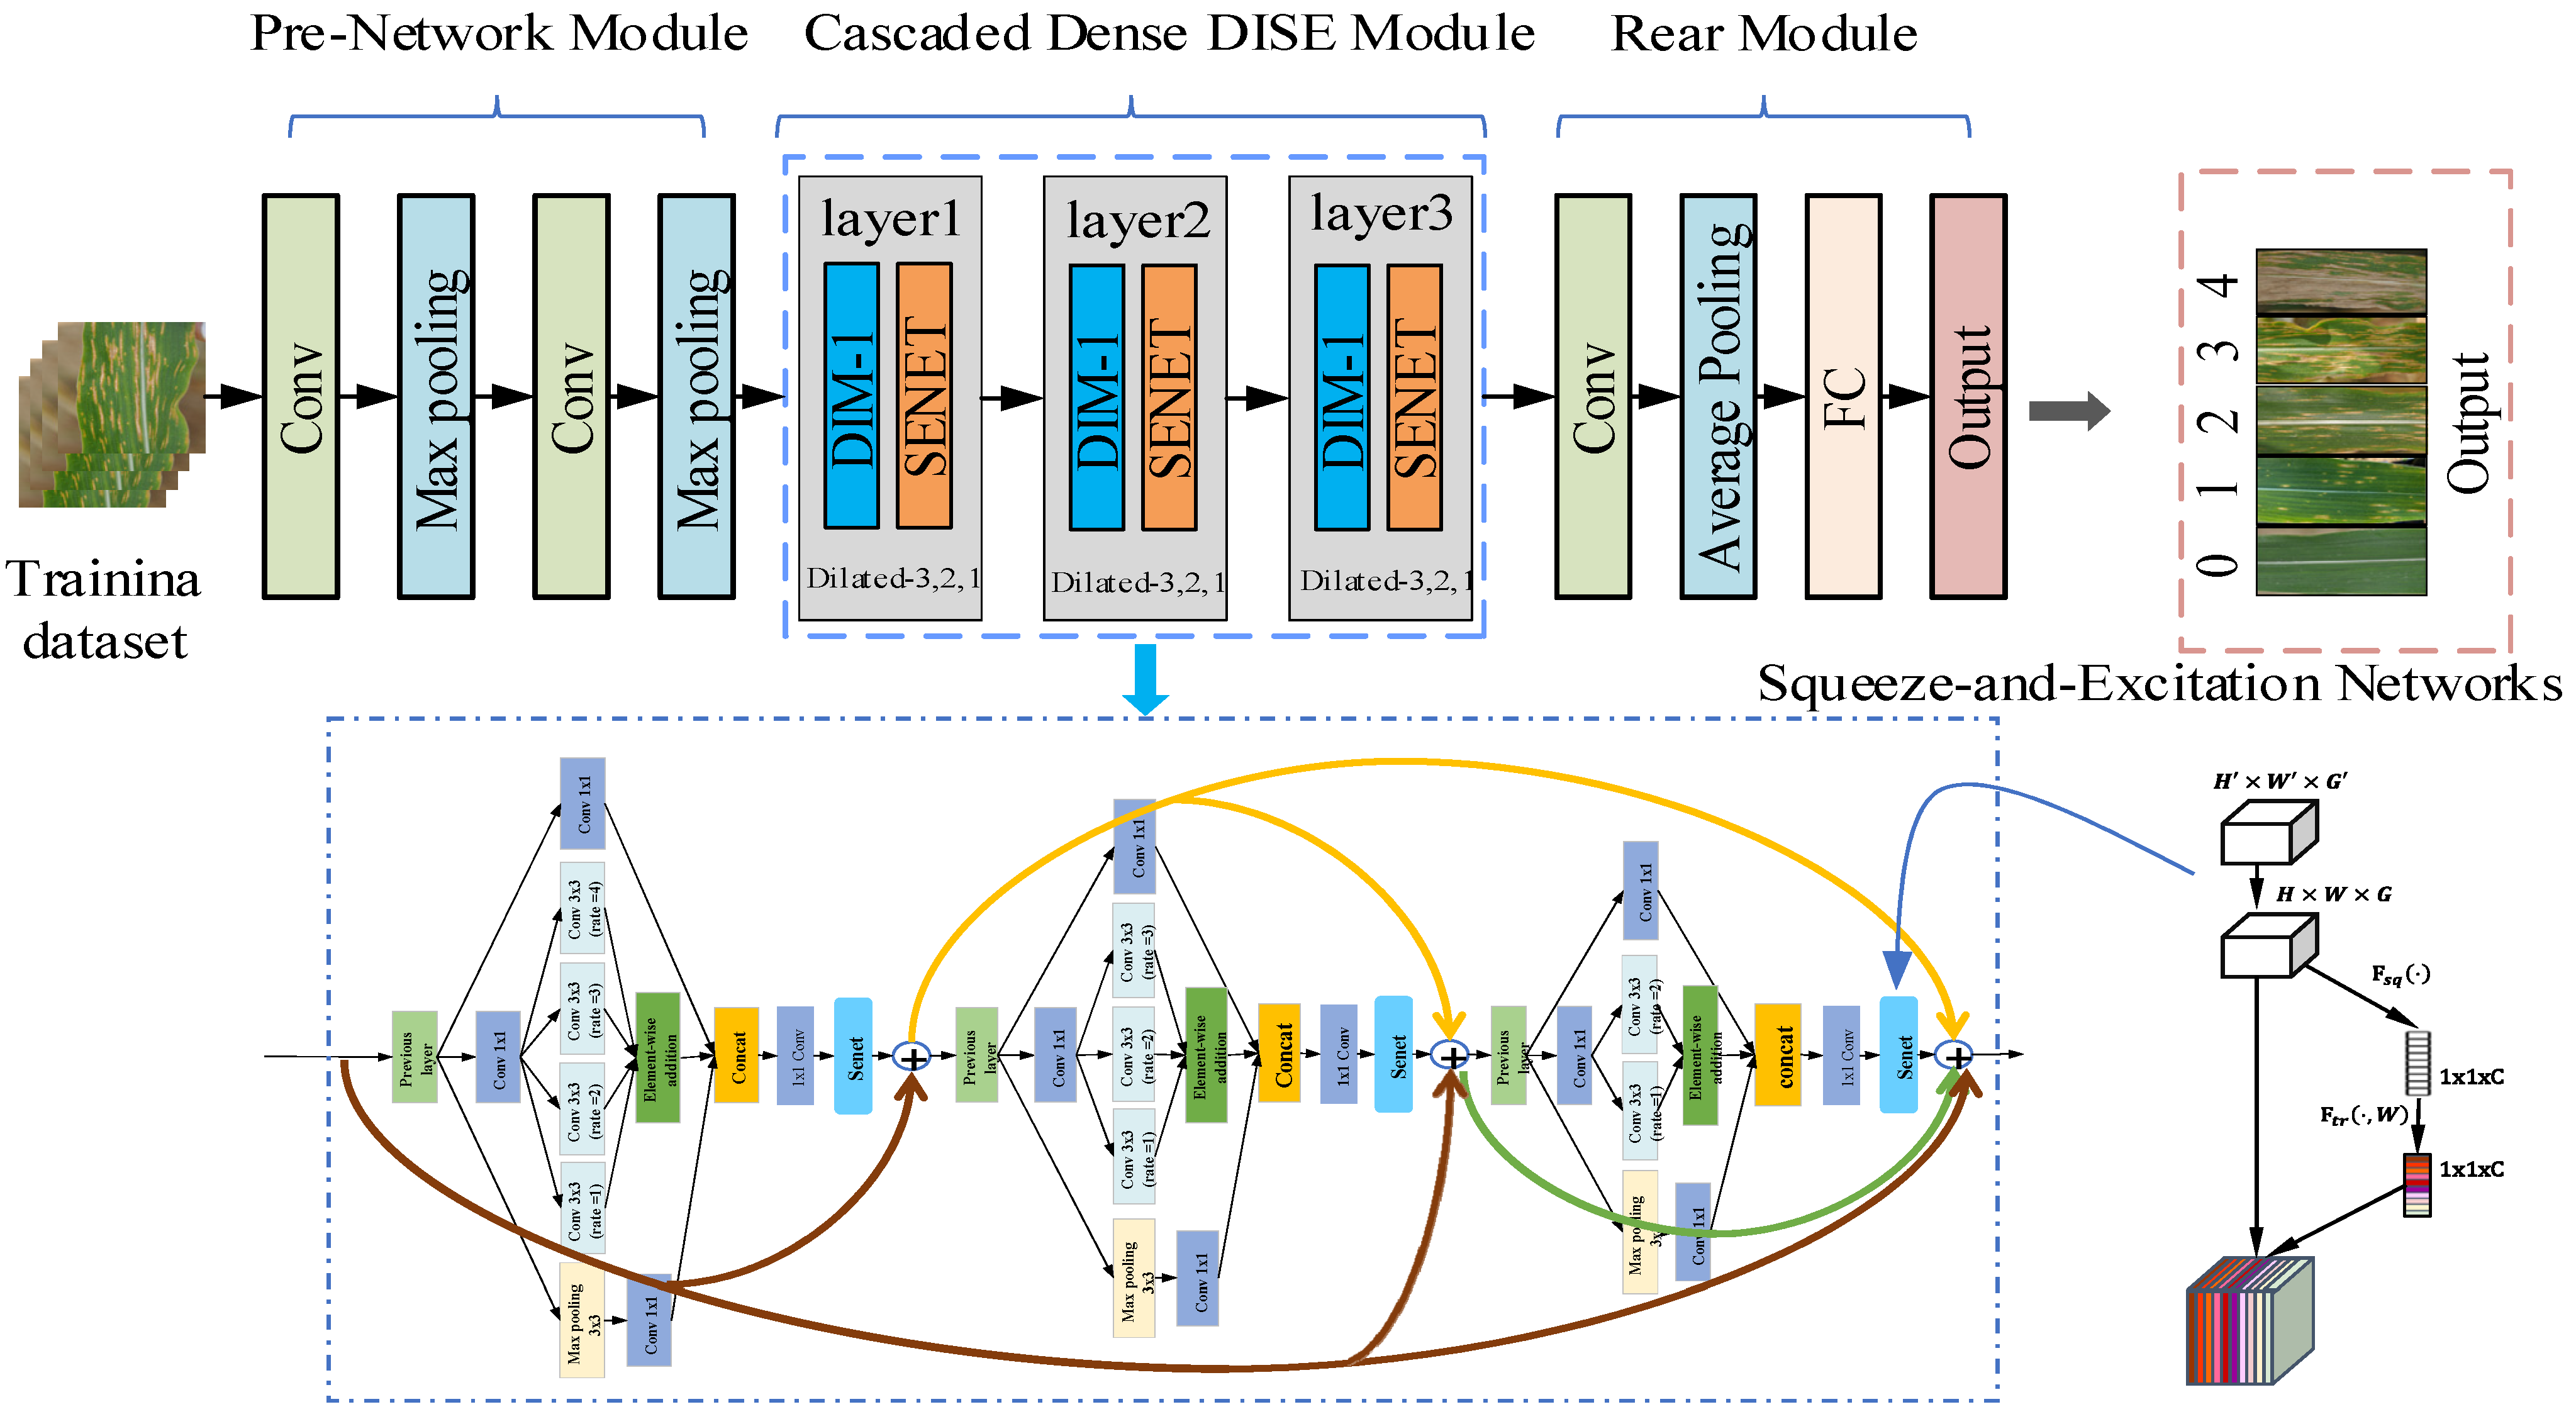
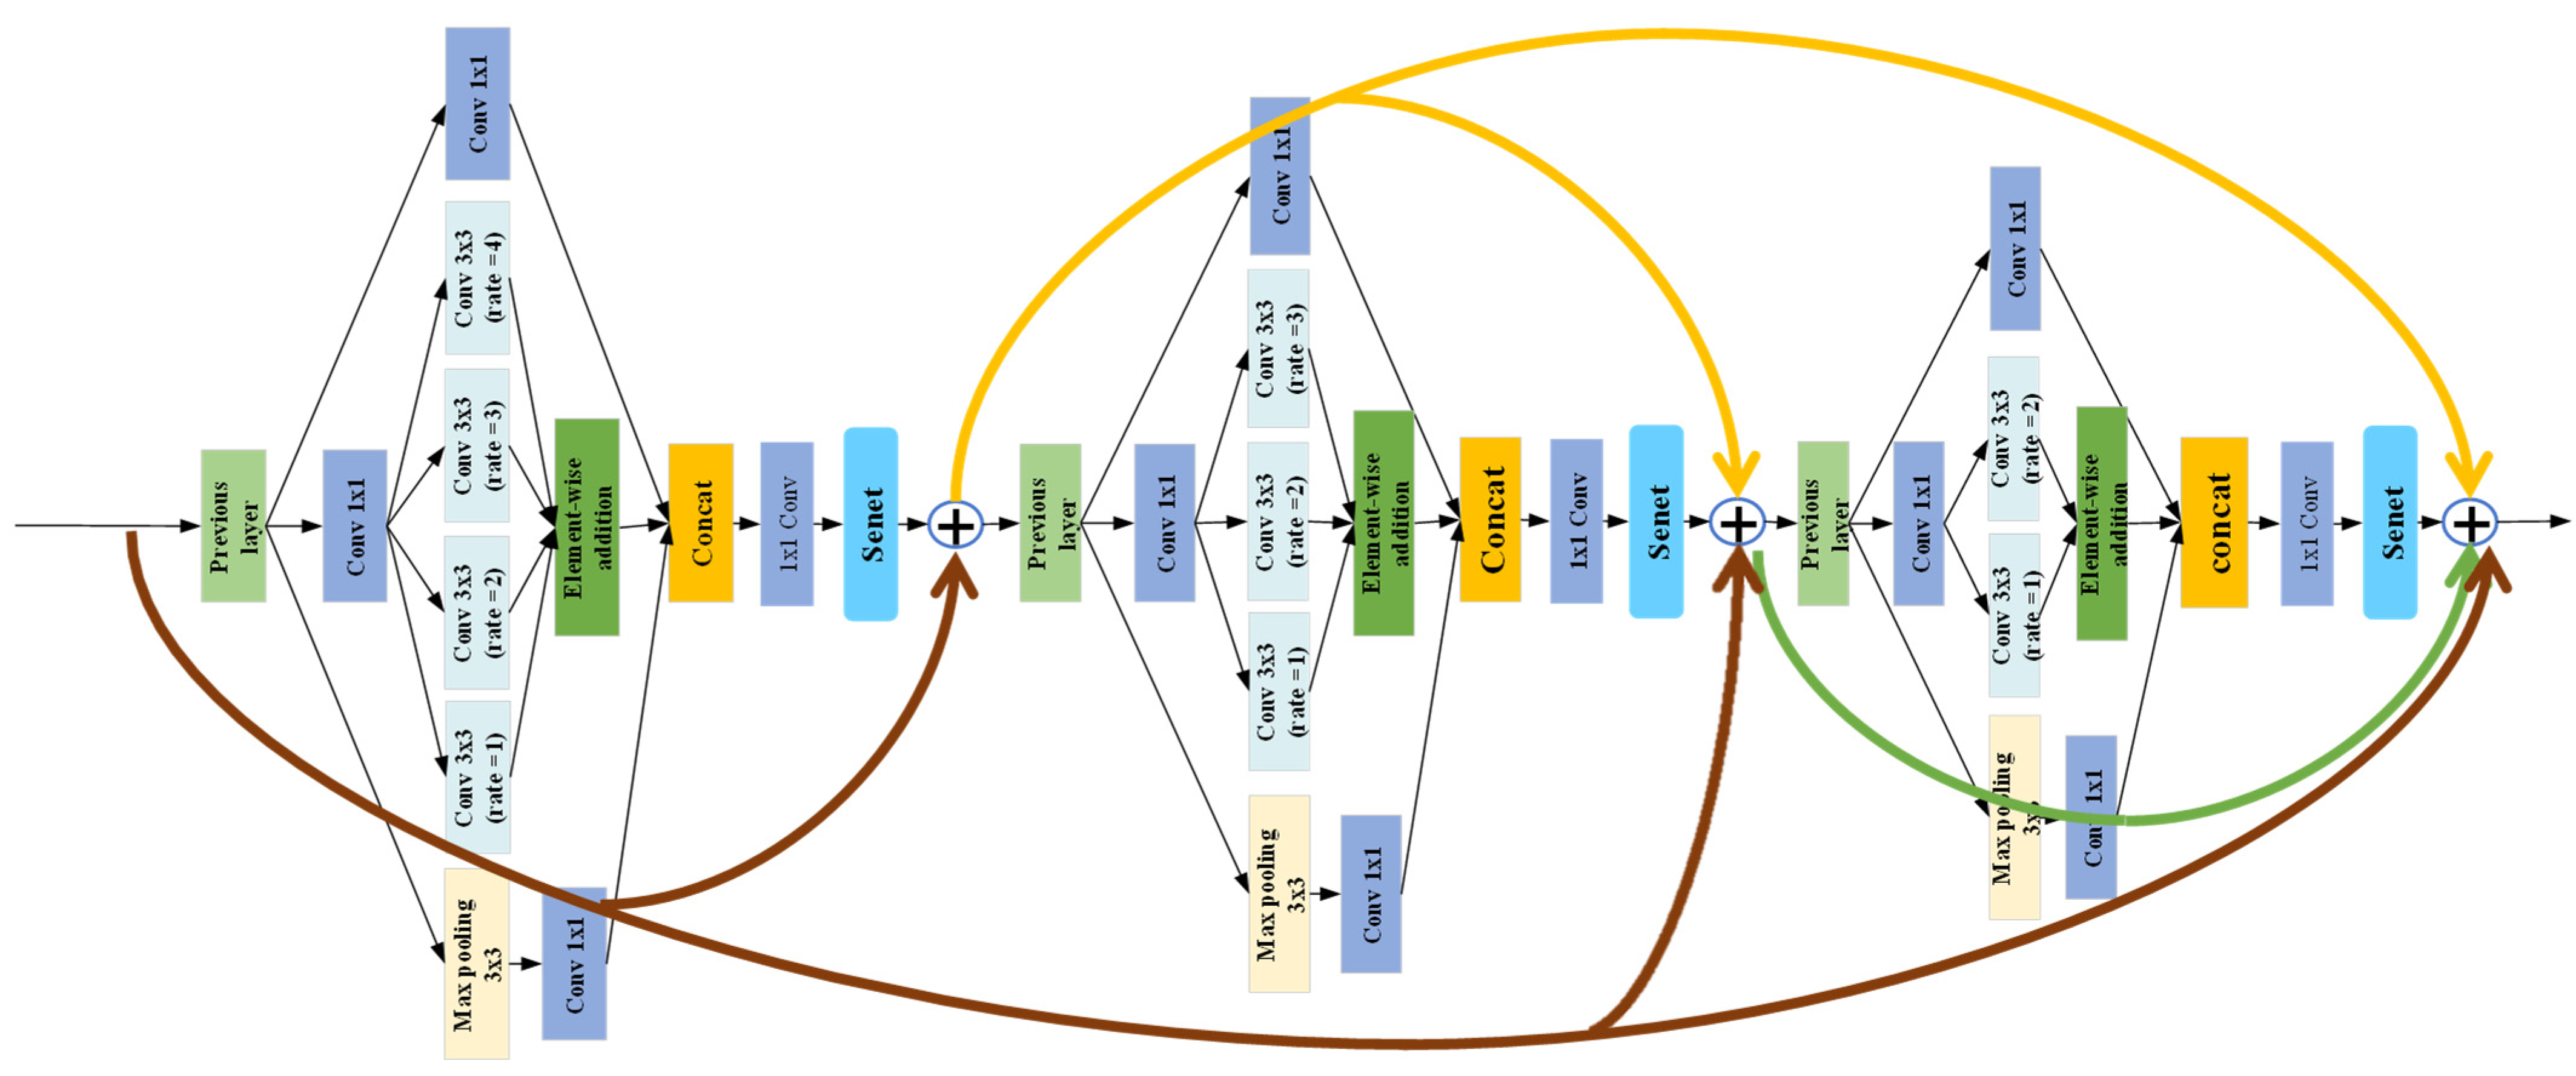
2.4.1. Network Architecture
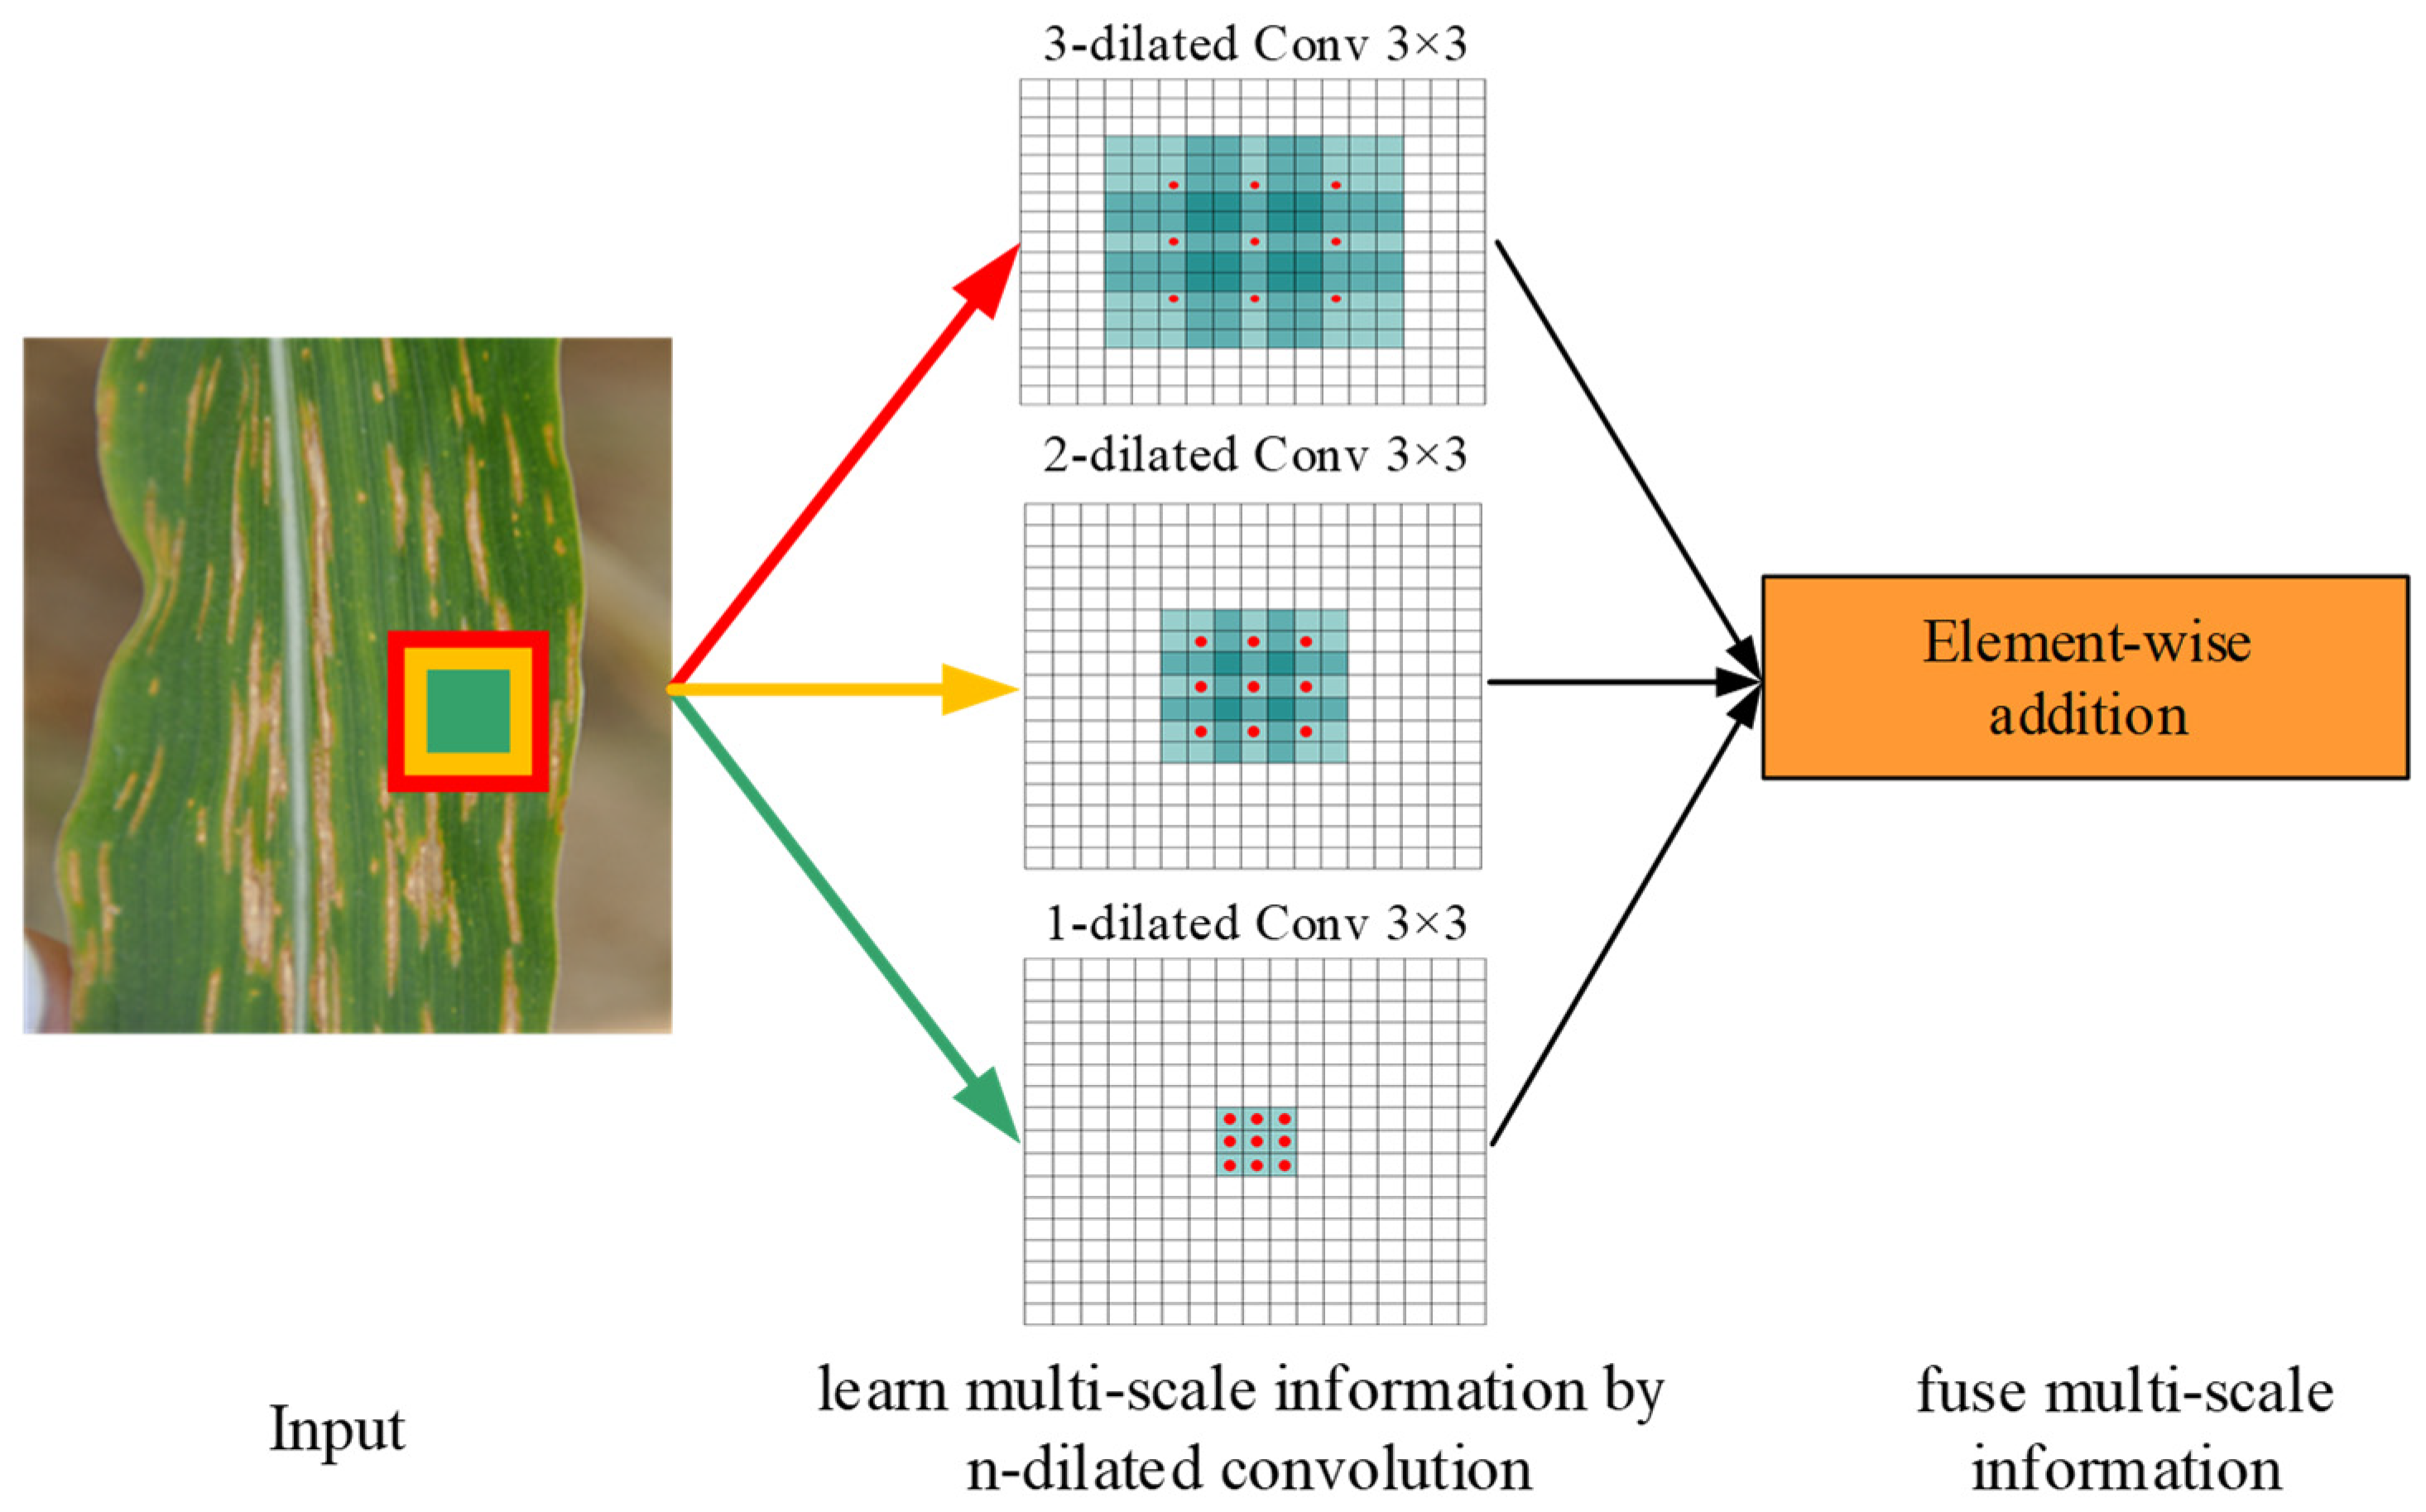
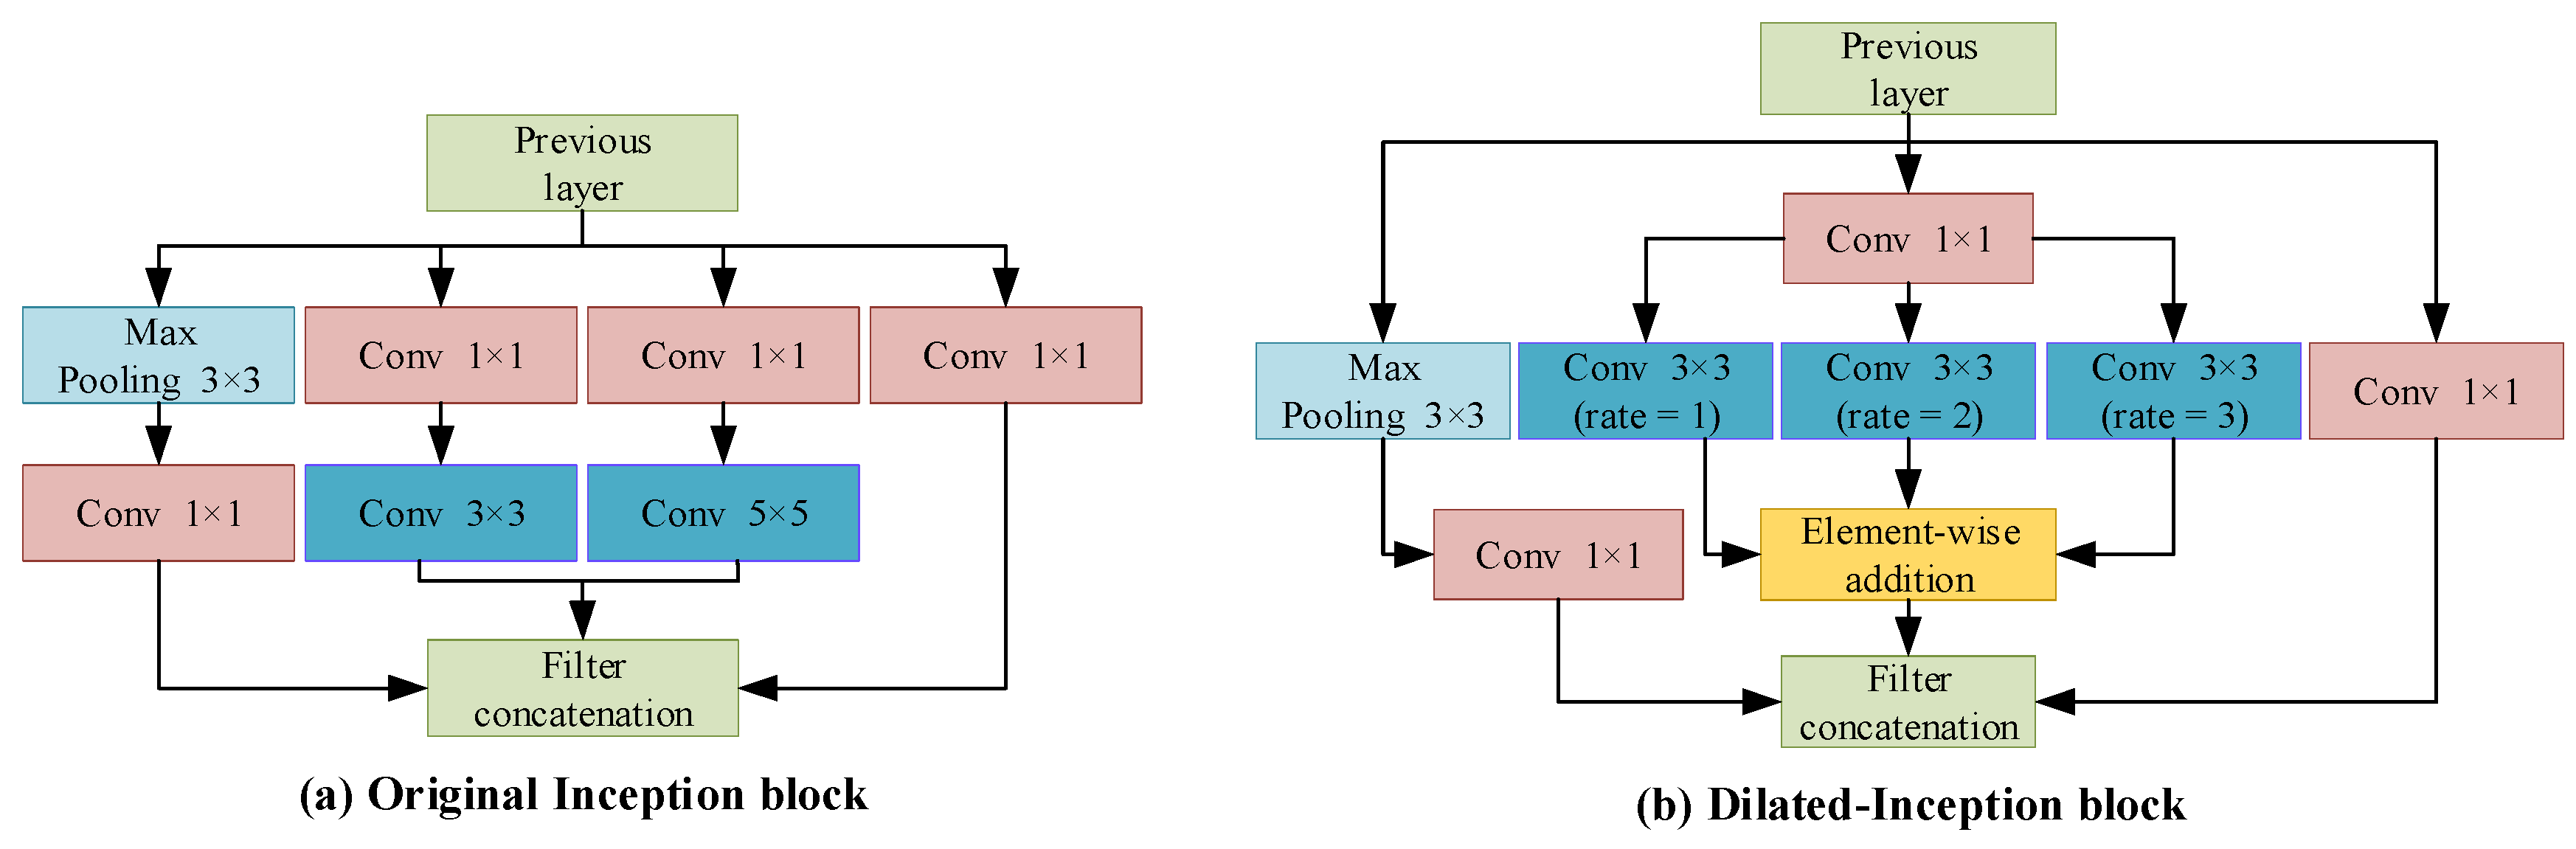
2.4.2. Multi-Scale Dilated-Inception Module
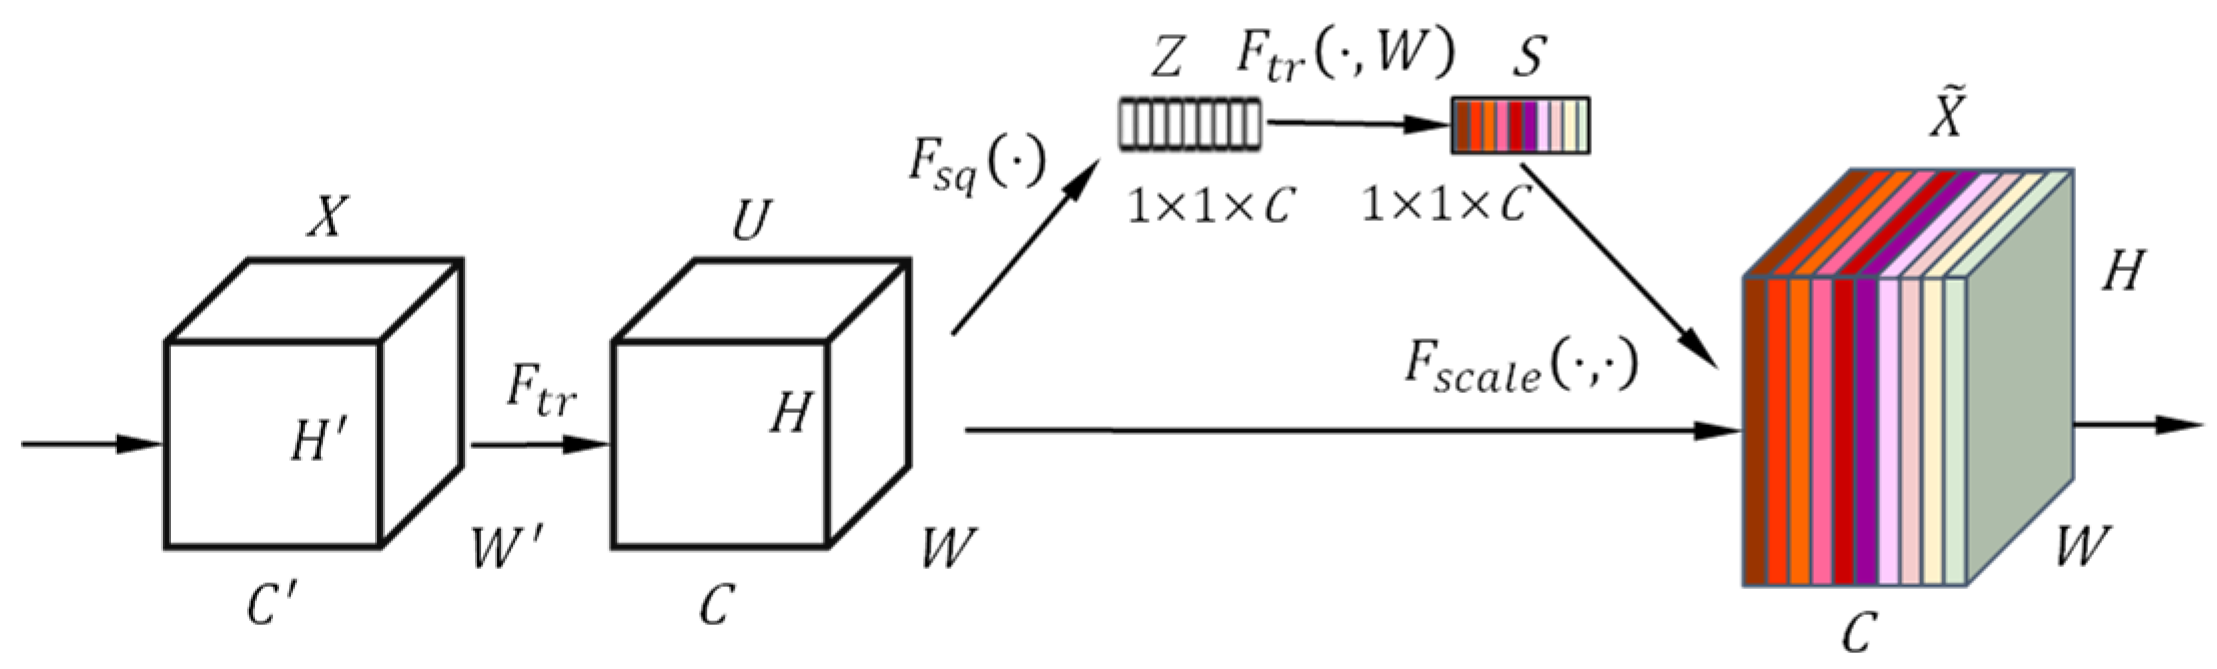
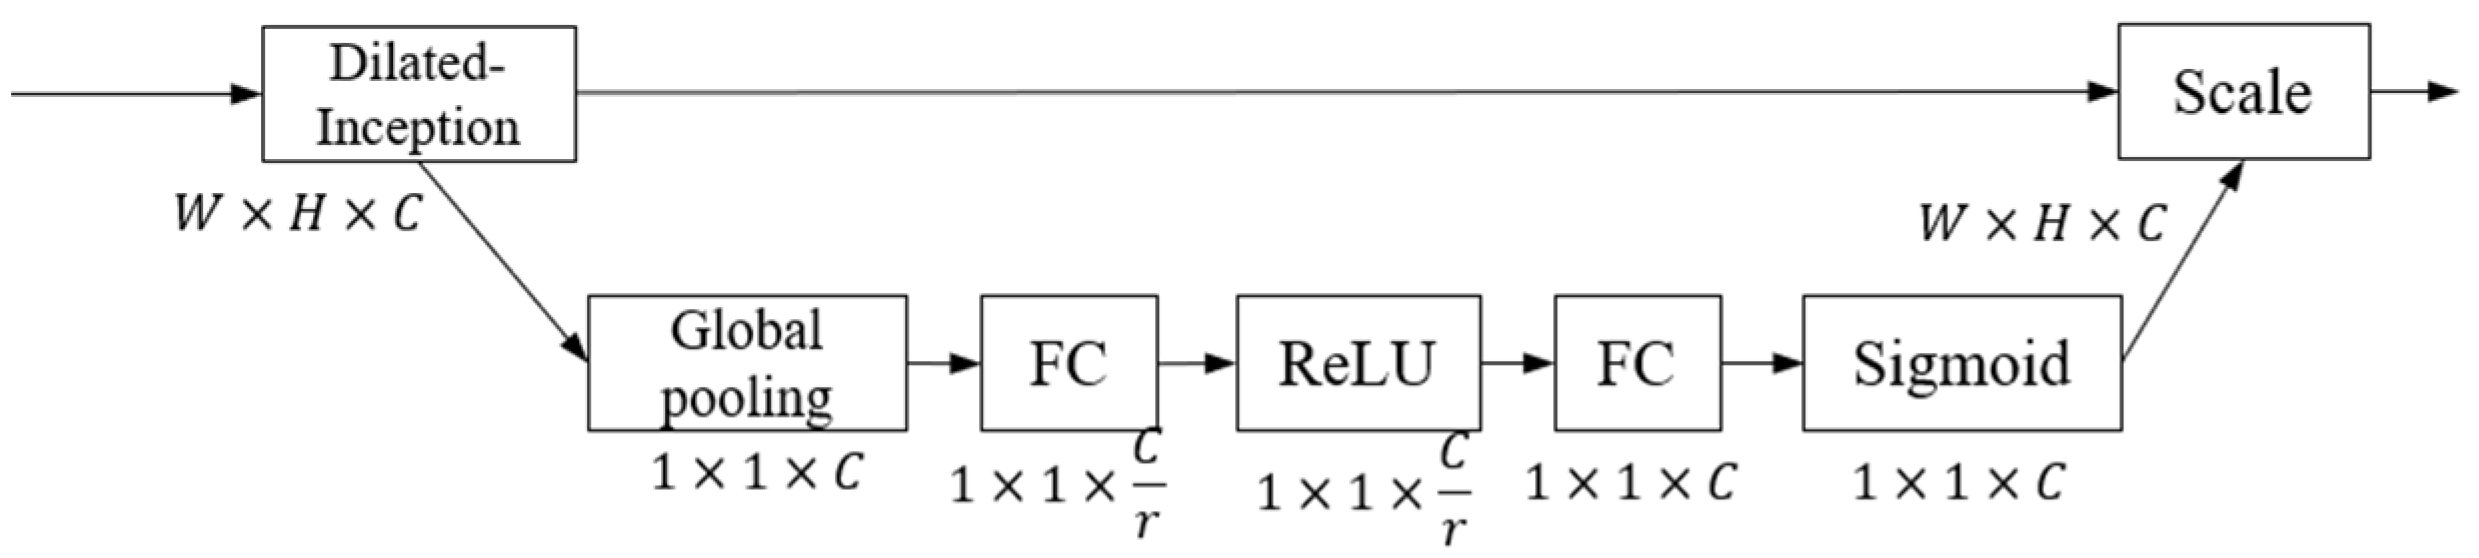
2.4.3. Squeeze-and-Excitation Networks
2.4.4. Cascade Dense Connectivity Strategy
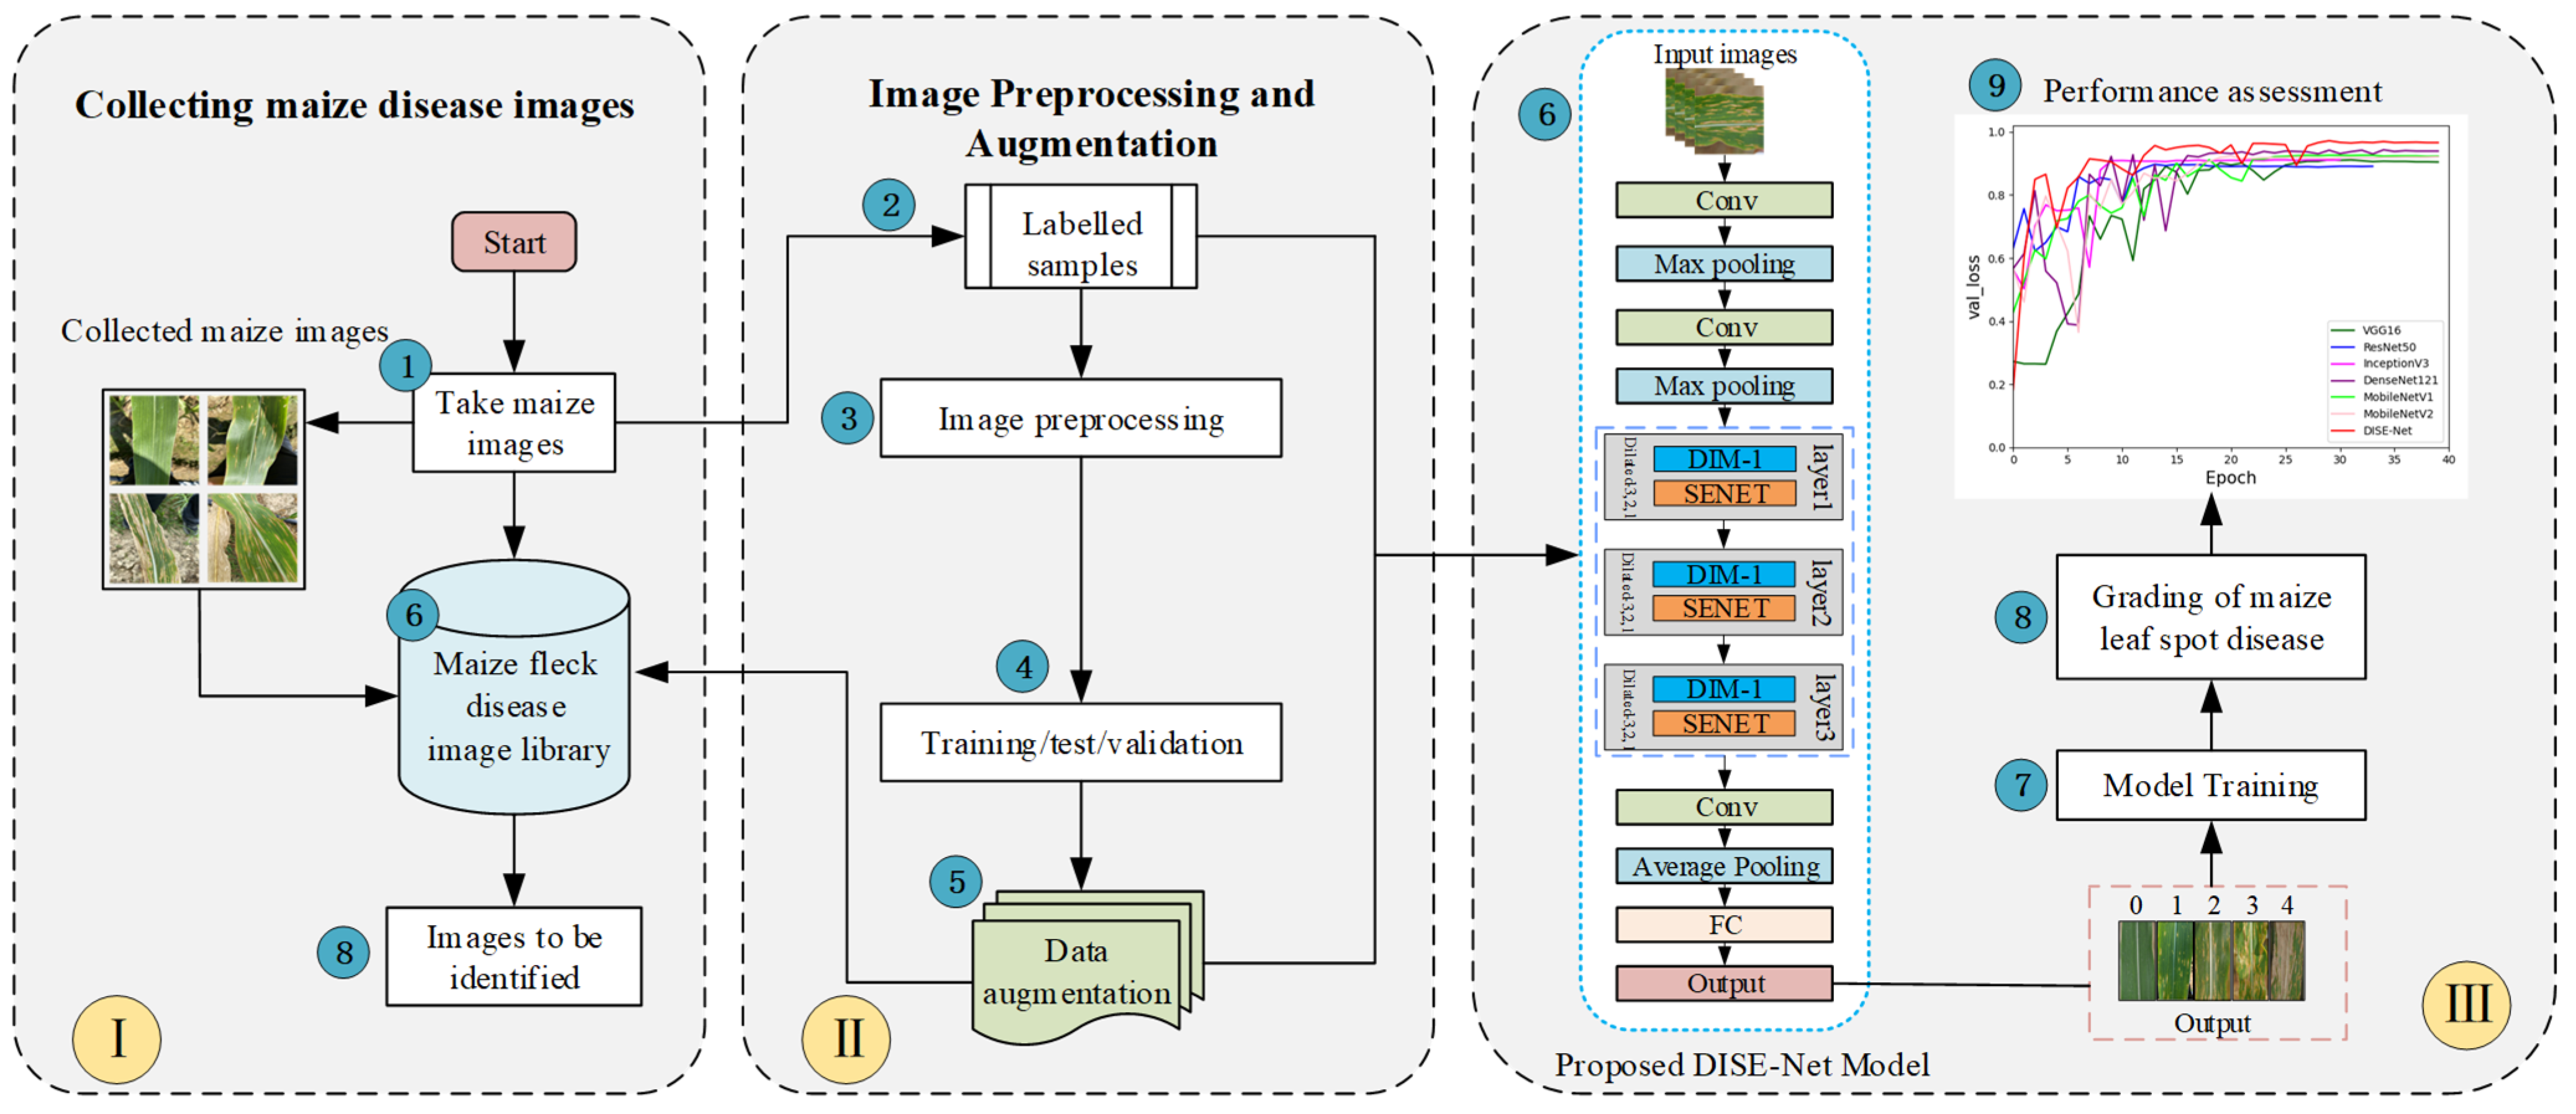
2.5. Overall Process
2.6. Evaluation Indexes
3. Results and Discussion
3.1. Experimental Setup
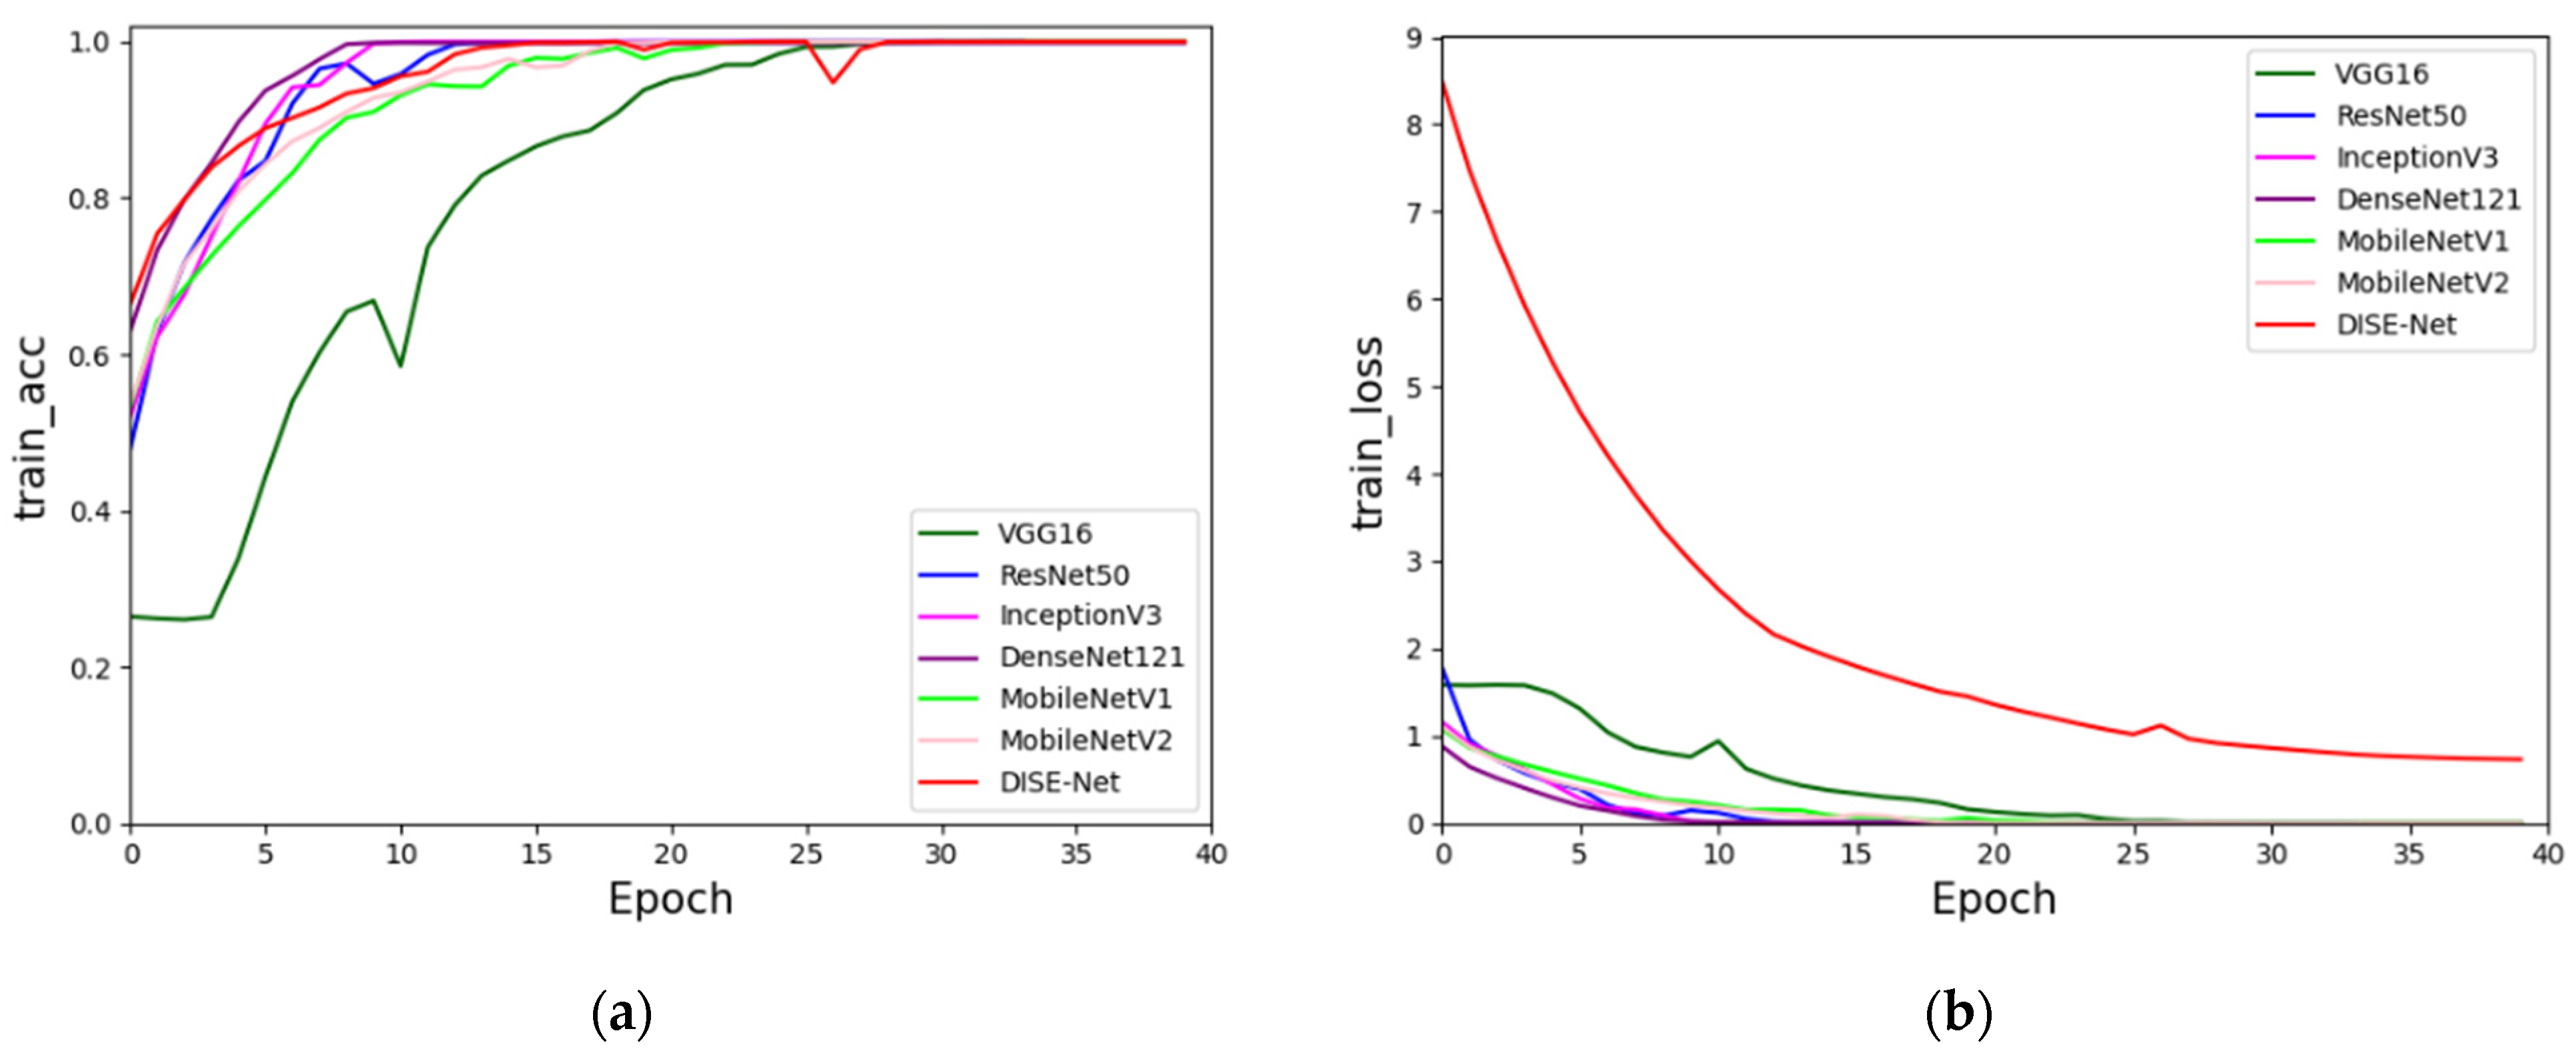
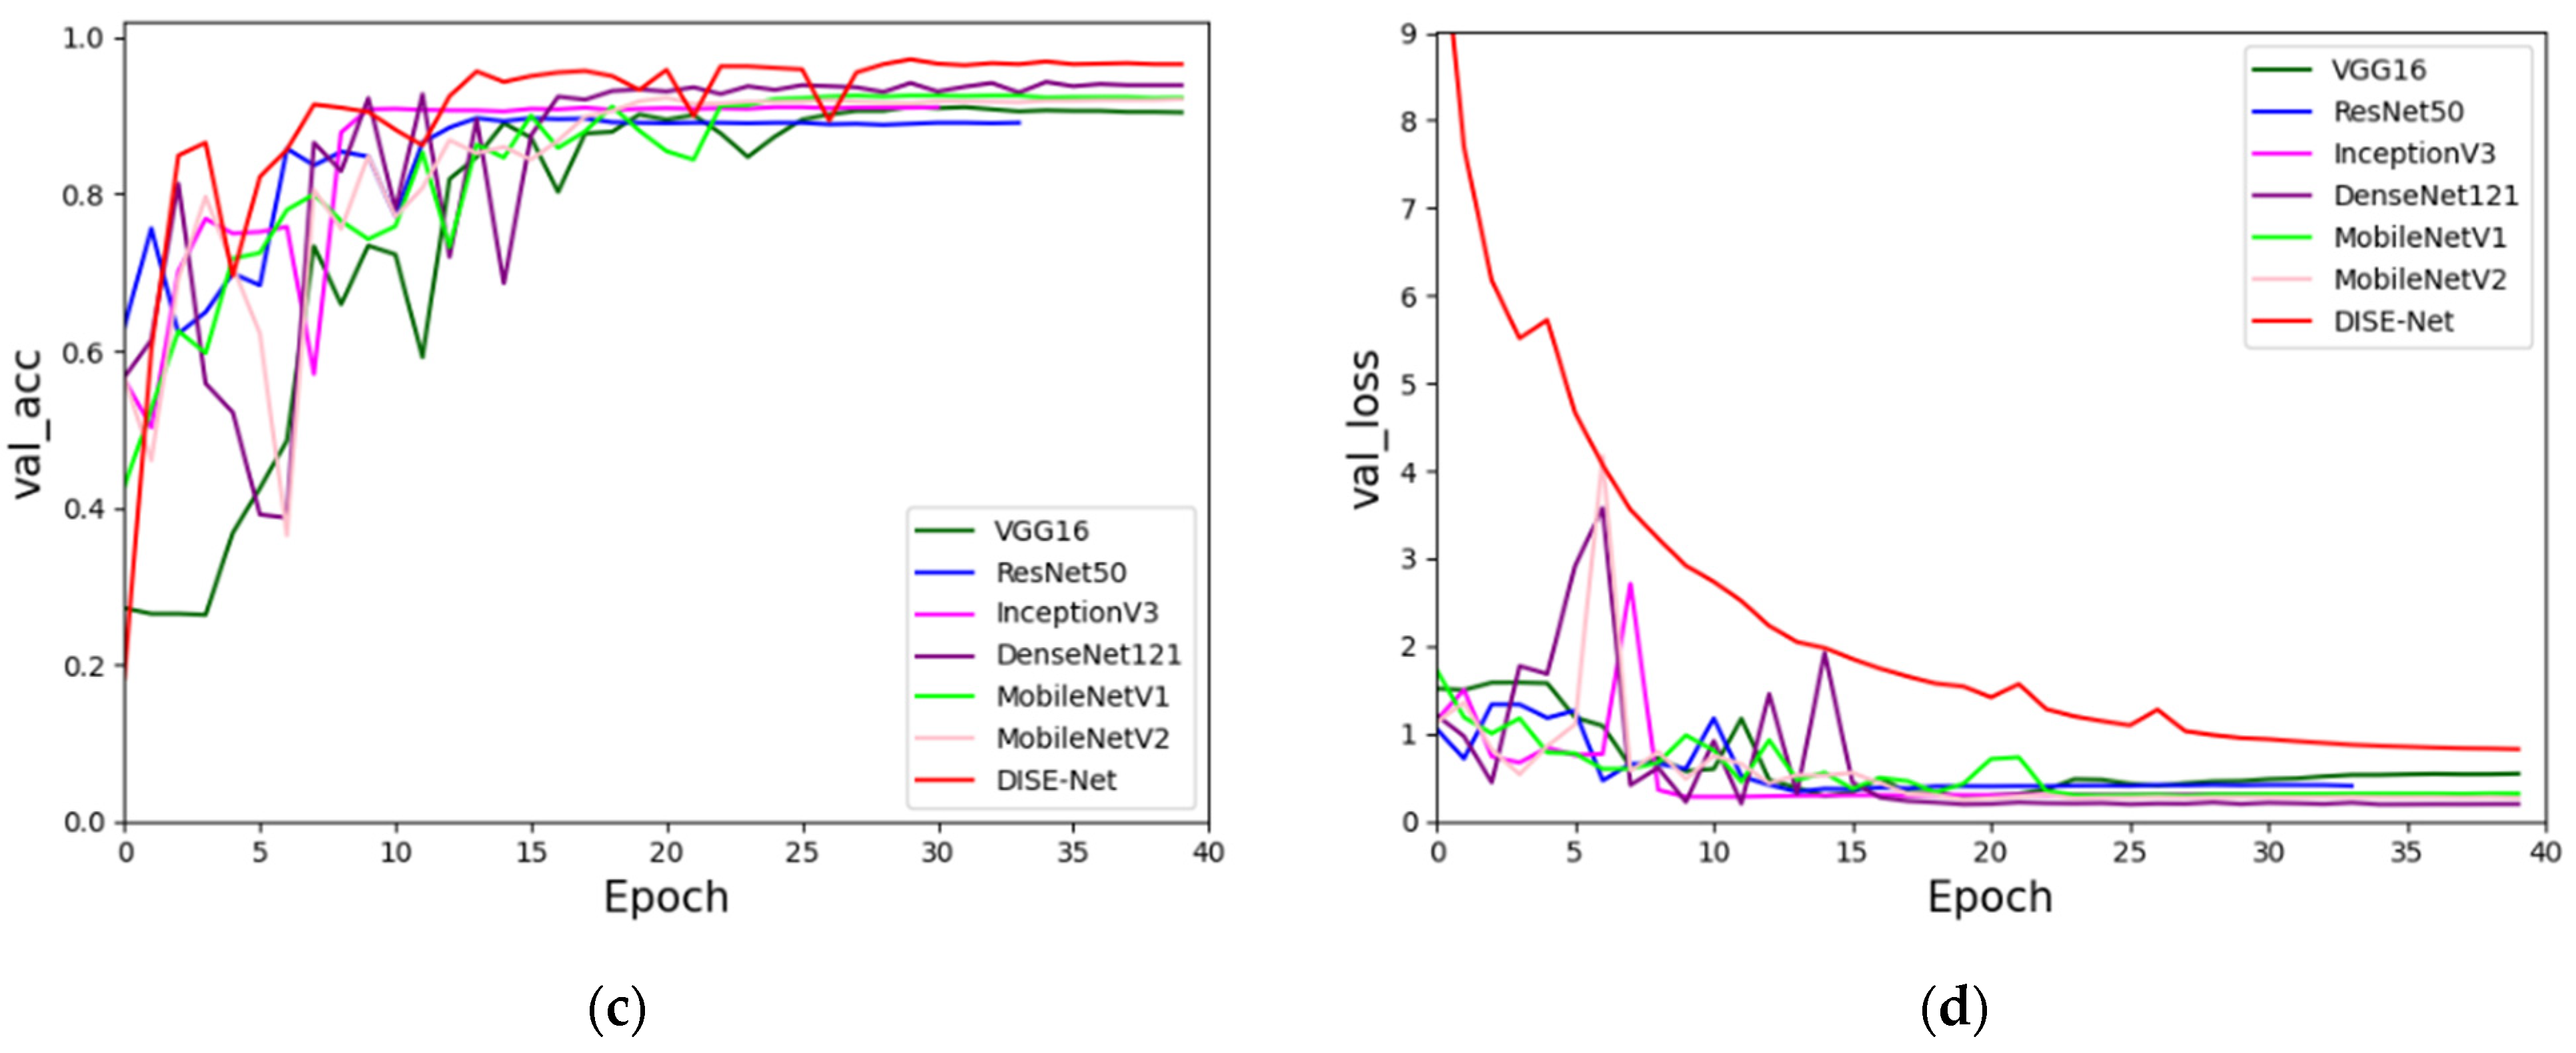
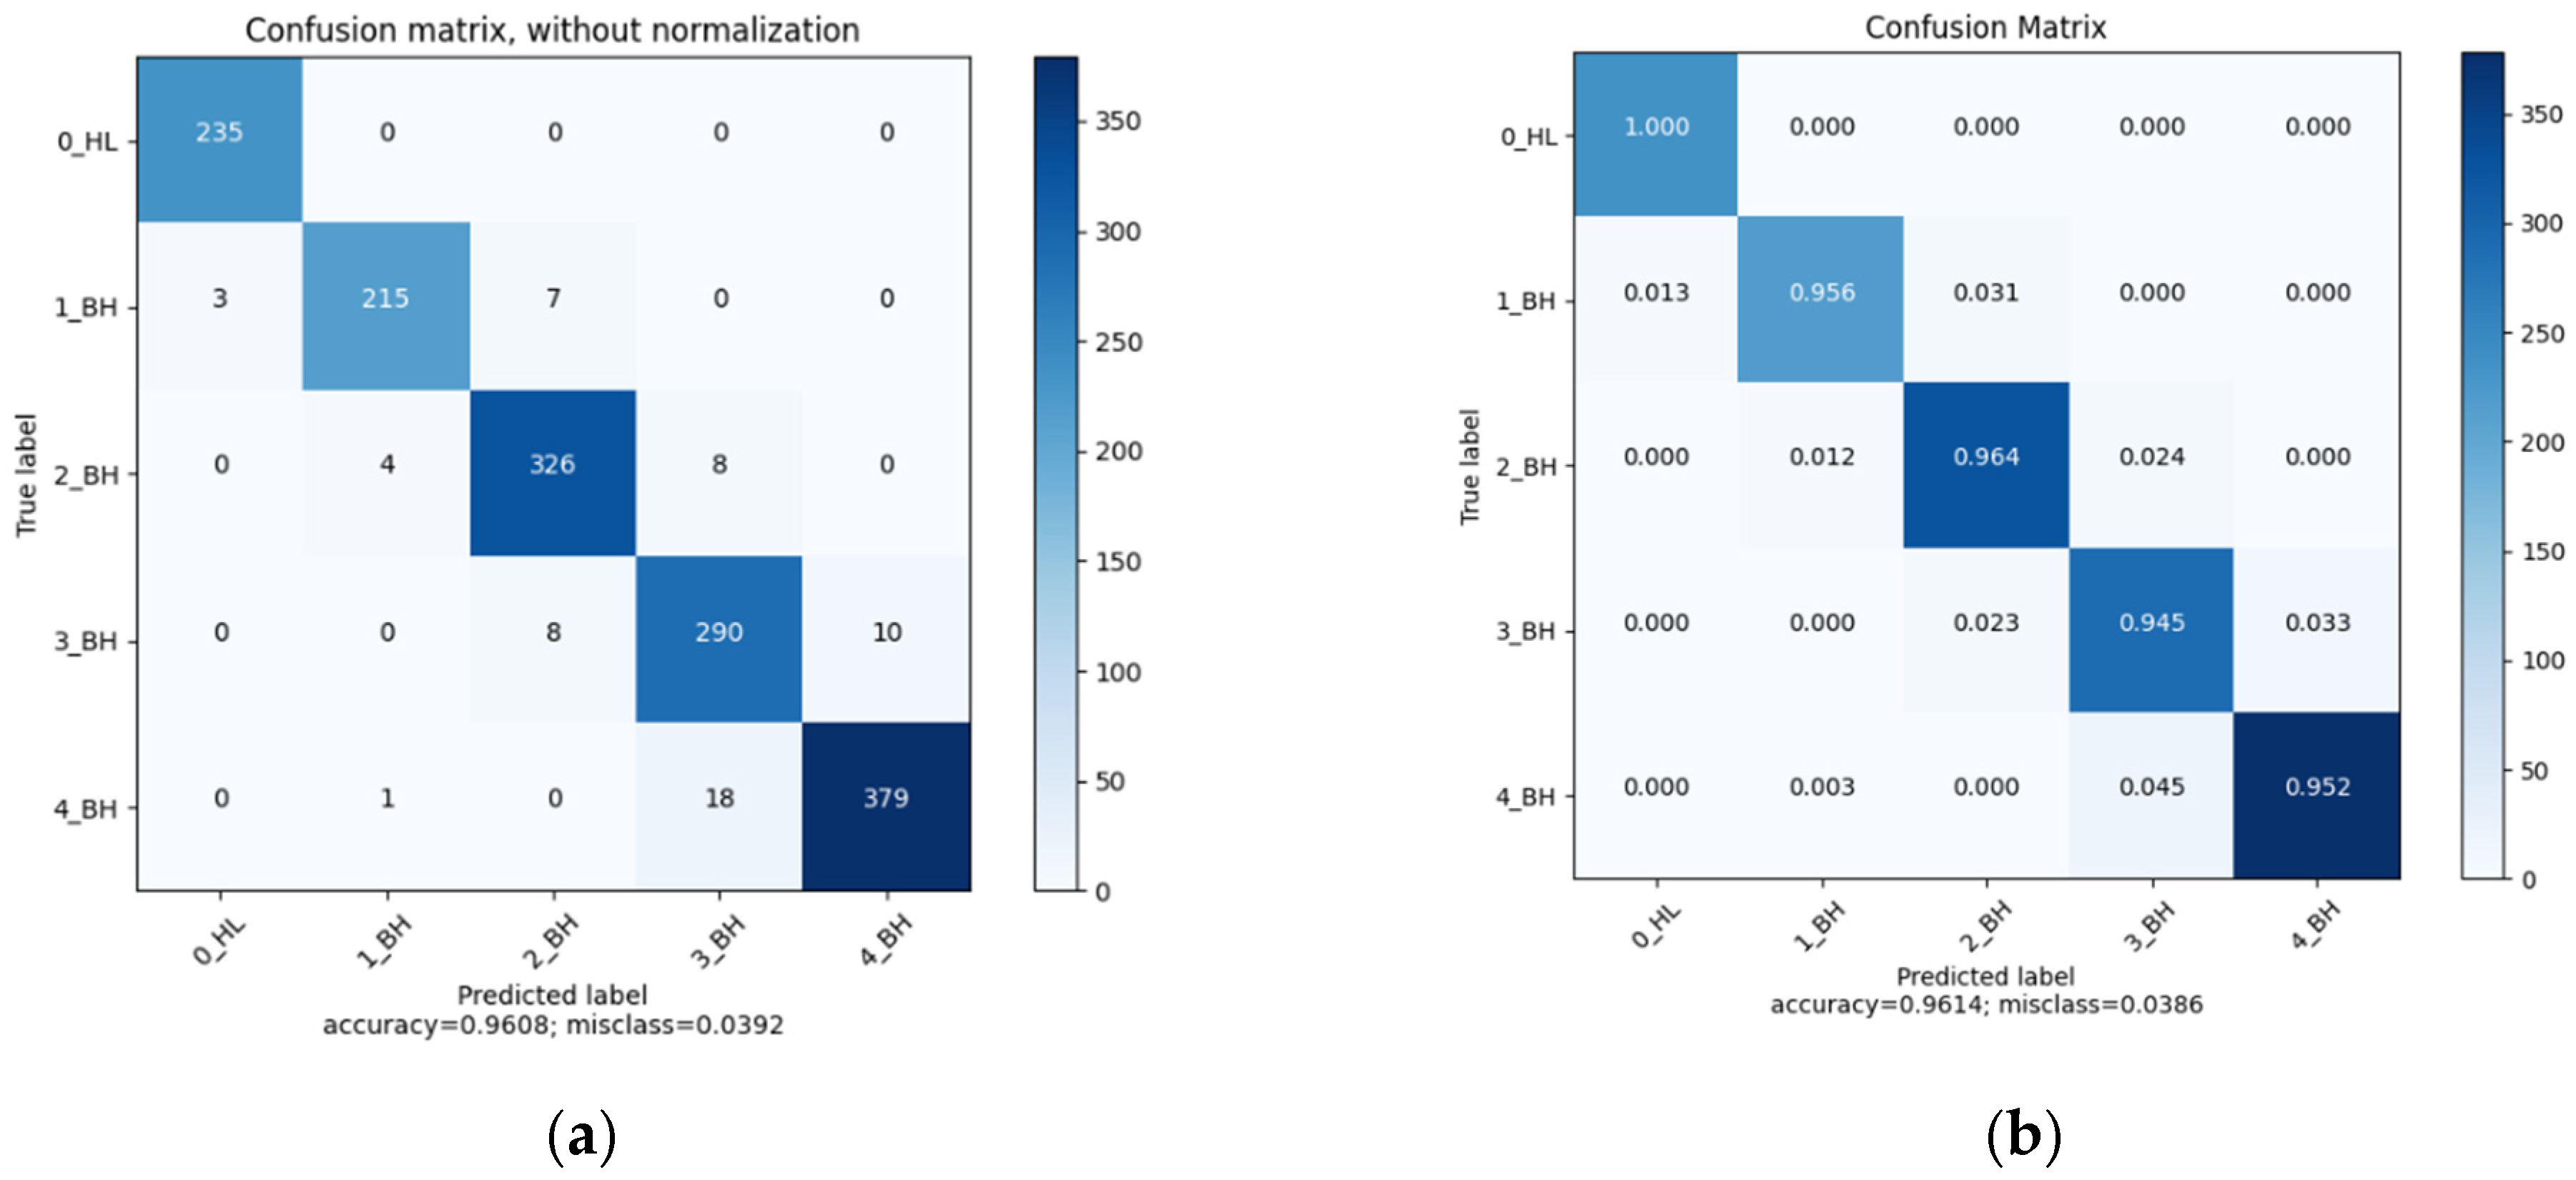
3.2. Performance Comparison of Different Models
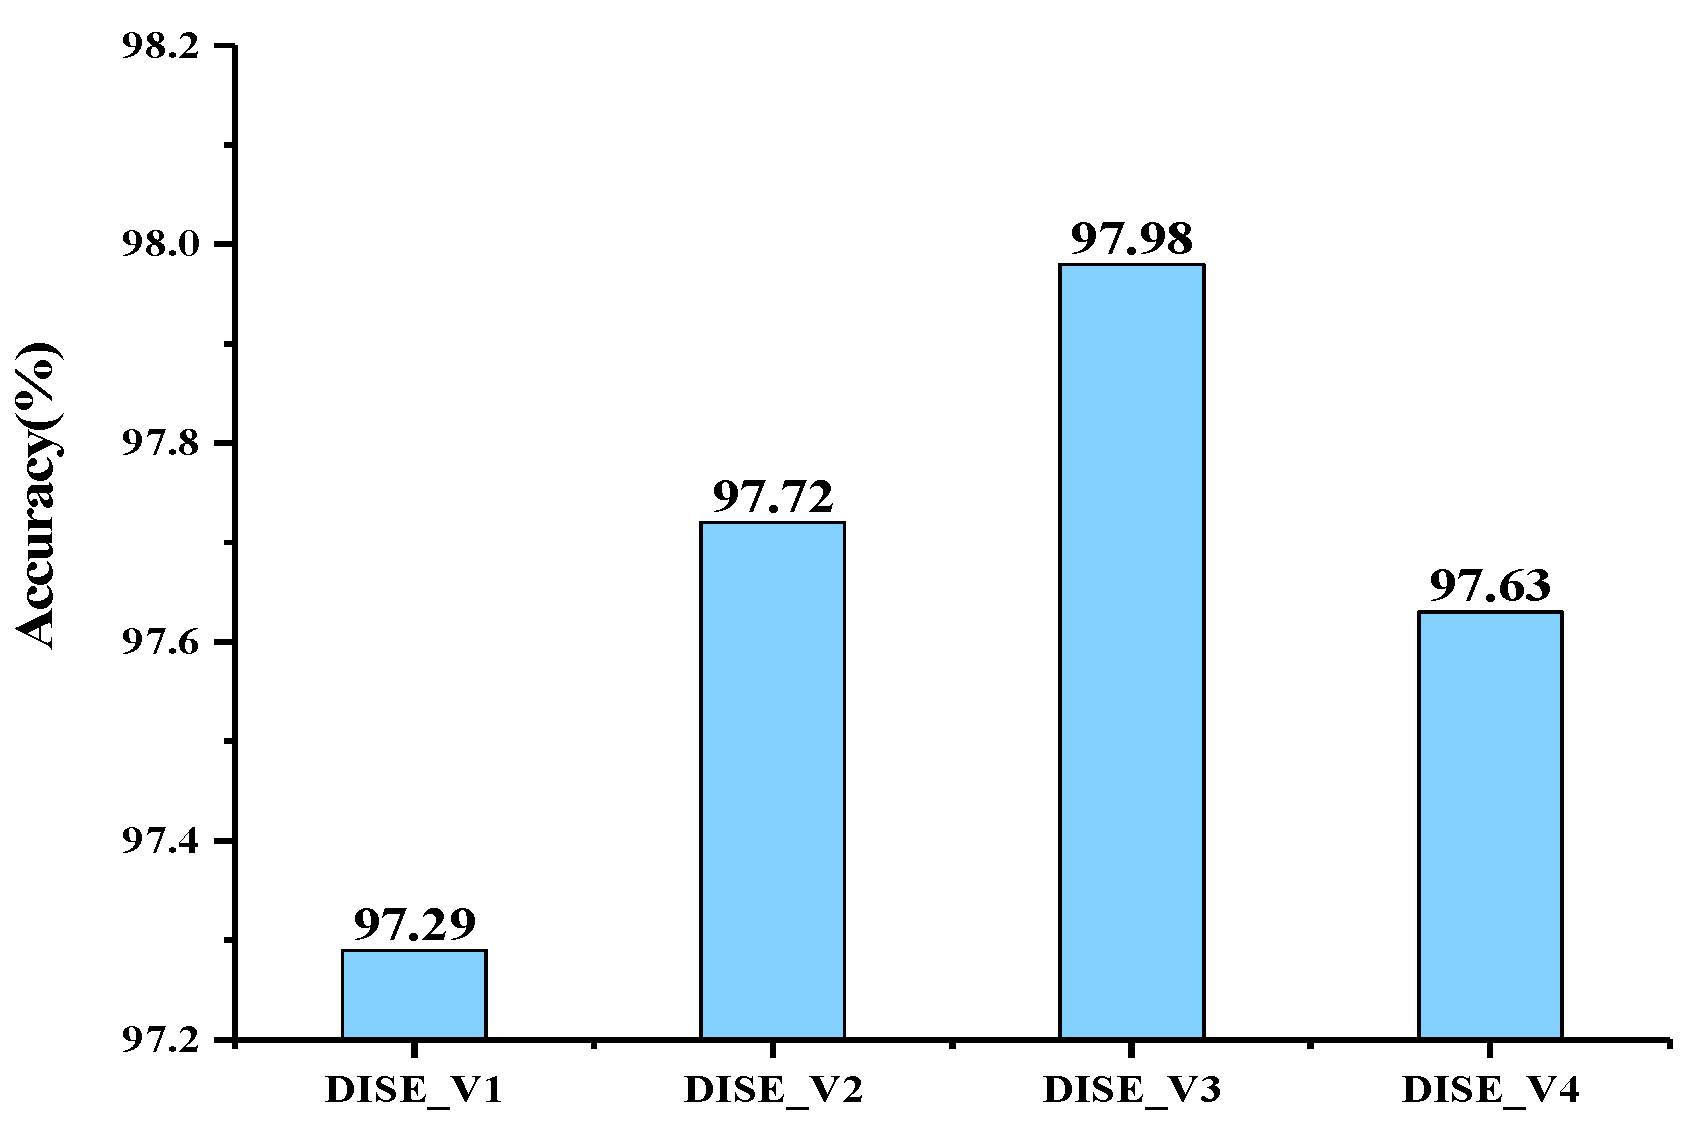
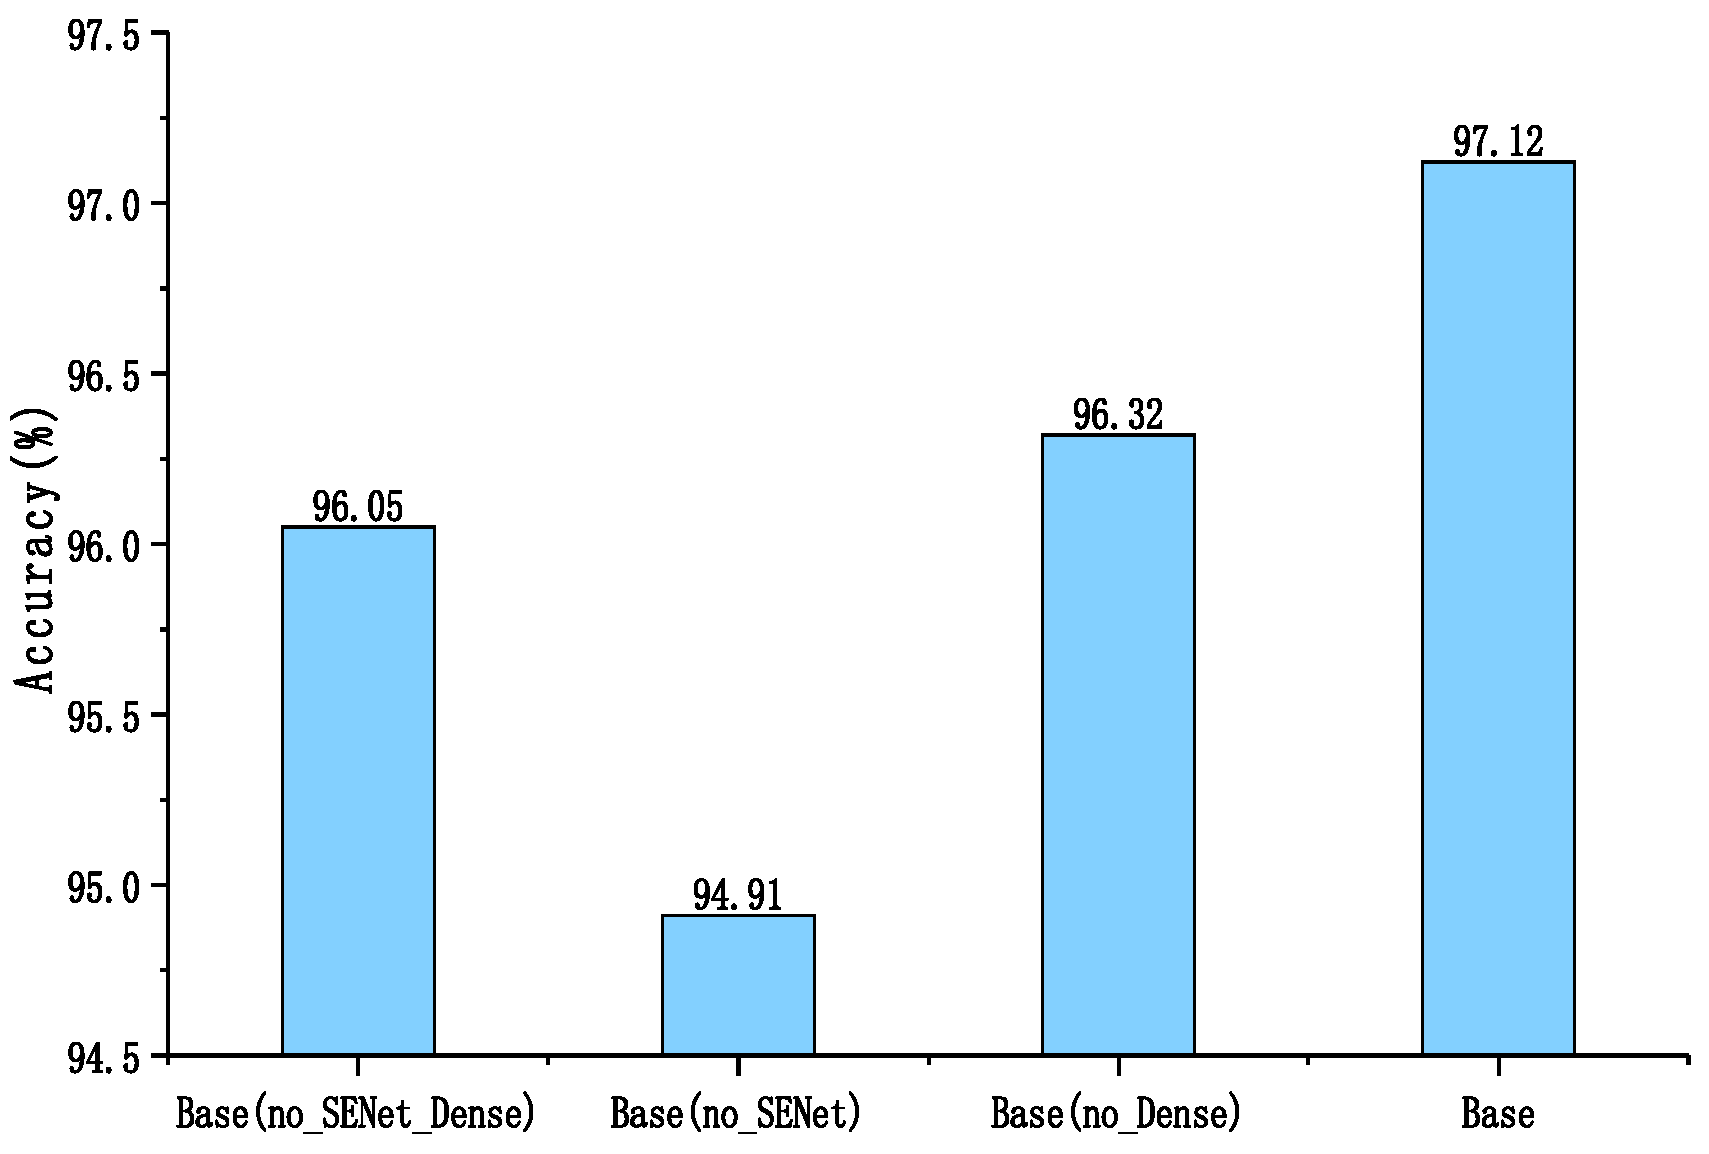
3.3. Ablation Experiments
3.4. Network Attention Visualization
4. Conclusions and Future Work
Author Contributions
Funding
Institutional Review Board Statement
Informed Consent Statement
Data Availability Statement
Acknowledgments
Conflicts of Interest
References
- Wang, Q.; Chen, Y. Advantages Analysis of Corn Planting in China. J. Agric. Sci. Tech. 2018, 20, 9. [Google Scholar]
- Gao, G. Discussion on Hazard Symptoms and Prevention Methods of Corn Southern Leaf Blight. J. Agric. Catas 2016, 6, 3. [Google Scholar]
- Jensen, H.; Jacobsen, L.B.; Pedersen, S.M.; Tavella, E. Socioeconomic Impact of Widespread Adoption of Precision Farming and Controlled Traffic Systems in Denmark. Precis. Agric. 2012, 13, 661–677. [Google Scholar] [CrossRef]
- Singh, V.; Misra, A.K. Detection of Plant Leaf Diseases Using Image Segmentation and Soft Computing Techniques. Inf. Process. Agric. 2017, 4, 41–49. [Google Scholar] [CrossRef] [Green Version]
- Lu, J.; Tan, L.; Jiang, H. Review on Convolutional Neural Network (CNN) Applied to Plant Leaf Disease Classification. Agriculture 2021, 11, 707. [Google Scholar] [CrossRef]
- Mondal, D.; Kole, D.K.; Roy, K. Gradation of Yellow Mosaic Virus Disease of Okra and Bitter Gourd Based on Entropy Based Binning and Naive Bayes Classifier after Identification of Leaves. Comput. Electron. Agric. 2017, 142, 485–493. [Google Scholar] [CrossRef]
- Thaiyalnayaki, K.; Joseph, C. Classification of Plant Disease Using SVM and Deep Learning. Mater. Today Proc. 2021, 47, 468–470. [Google Scholar] [CrossRef]
- Tian, K.; Li, J.; Zeng, J.; Evans, A.; Zhang, L. Segmentation of Tomato Leaf Images Based on Adaptive Clustering Number of K-Means Algorithm. Comput. Electron. Agric. 2019, 165, 104962. [Google Scholar] [CrossRef]
- Aravind, K.R.; Raja, P.; Mukesh, K.V.; Aniirudh, R.; Ashiwin, R.; Szczepanski, C. Disease Classification in Maize Crop Using Bag of Features and Multiclass Support Vector Machine. In Proceedings of the 2018 2nd International Conference on Inventive Systems and Control (ICISC), Coimbatore, India, 19–20 January 2018; pp. 1191–1196. [Google Scholar]
- Hossain, E.; Hossain, M.F.; Rahaman, M.A. A Color and Texture Based Approach for the Detection and Classification of Plant Leaf Disease Using KNN Classifier. In Proceedings of the 2019 International Conference on Electrical, Computer and Communication Engineering (ECCE), Cox’s Bazar, Bangladesh, 7–9 February 2019; pp. 1–6. [Google Scholar]
- Kahar, M.A.; Mutalib, S.; Abdul-Rahman, S. Early Detection and Classification of Paddy Diseases with Neural Networks and Fuzzy Logic. In Proceedings of the 17th International Conference Computational and Mathematical Methods in Science and Engineering, CMMSE 2017, Rota, Spain, 4–8 July 2017; pp. 248–257. [Google Scholar]
- Abade, A.; Ferreira, P.A.; de Barros Vidal, F. Plant Diseases Recognition on Images Using Convolutional Neural Networks: A Systematic Review. Comput. Electron. Agric. 2021, 185, 106125. [Google Scholar] [CrossRef]
- Nie, X.; Wang, L.; Ding, H.; Xu, M. Strawberry Verticillium Wilt Detection Network Based on Multi-Task Learning and Attention. IEEE Access 2019, 7, 170003–170011. [Google Scholar] [CrossRef]
- Rangarajan, A.K.; Purushothaman, R.; Pérez-Ruiz, M. Disease Classification in Aubergine with Local Symptomatic Region Using Deep Learning Models. Biosyst. Eng. 2021, 209, 139–153. [Google Scholar] [CrossRef]
- Waheed, A.; Goyal, M.; Gupta, D.; Khanna, A.; Hassanien, A.E.; Pandey, H.M. An Optimized Dense Convolutional Neural Network Model for Disease Recognition and Classification in Corn Leaf. Comput. Electron. Agric. 2020, 175, 105456. [Google Scholar] [CrossRef]
- Ramcharan, A.; Baranowski, K.; McCloskey, P.; Ahmed, B.; Legg, J.; Hughes, D.P. Deep Learning for Image-Based Cassava Disease Detection. Front. Plant Sci. 2017, 8, 1852. [Google Scholar] [CrossRef] [Green Version]
- Haider, W.; Rehman, A.-U.; Durrani, N.M.; Rehman, S.U. A Generic Approach for Wheat Disease Classification and Verification Using Expert Opinion for Knowledge-Based Decisions. IEEE Access 2021, 9, 31104–31129. [Google Scholar] [CrossRef]
- Zeng, T.; Li, C.; Zhang, B.; Wang, R.; Fu, W.; Wang, J.; Zhang, X. Rubber Leaf Disease Recognition Based on Improved Deep Convolutional Neural Networks with a Cross-Scale Attention Mechanism. Front. Plant Sci. 2022, 13, 829479. [Google Scholar] [CrossRef]
- Mi, Z.; Zhang, X.; Su, J.; Han, D.; Su, B. Wheat Stripe Rust Grading by Deep Learning with Attention Mechanism and Images from Mobile Devices. Front. Plant Sci. 2020, 11, 558126. [Google Scholar] [CrossRef] [PubMed]
- Zhang, D.; Wang, D.; Gu, C.; Jin, N.; Zhao, H.; Chen, G.; Liang, H.; Liang, D. Using Neural Network to Identify the Severity of Wheat Fusarium Head Blight in the Field Environment. Remote Sens. 2019, 11, 2375. [Google Scholar] [CrossRef] [Green Version]
- Fang, T.; Chen, P.; Zhang, J.; Wang, B. Crop Leaf Disease Grade Identification Based on an Improved Convolutional Neural Network. J. Electron. Imaging 2020, 29, 013004. [Google Scholar] [CrossRef]
- Wang, C.; Du, P.; Wu, H.; Li, J.; Zhao, C.; Zhu, H. A Cucumber Leaf Disease Severity Classification Method Based on the Fusion of DeepLabV3+ and U-Net. Comput. Electron. Agric. 2021, 189, 106373. [Google Scholar] [CrossRef]
- Buda, M.; Maki, A.; Mazurowski, M.A. A Systematic Study of the Class Imbalance Problem in Convolutional Neural Networks. Neural Netw. 2018, 106, 249–259. [Google Scholar] [CrossRef] [Green Version]
- Dyrmann, M.; Karstoft, H.; Midtiby, H.S. Plant Species Classification Using Deep Convolutional Neural Network. Biosyst. Eng. 2016, 151, 72–80. [Google Scholar] [CrossRef]
- Yu, F.; Koltun, V. Multi-Scale Context Aggregation by Dilated Convolutions. arXiv 2016, arXiv:1511.07122. [Google Scholar]
- Shi, W.; Jiang, F.; Zhao, D. Single Image Super-Resolution with Dilated Convolution Based Multi-Scale Information Learning Inception Module. In Proceedings of the 2017 24th IEEE International Conference on Image Processing (ICIP), Beijing, China, 17–20 September 2017; IEEE: New York, NY, USA, 2017; pp. 977–981. [Google Scholar]
- Szegedy, C.; Liu, W.; Jia, Y.; Sermanet, P.; Reed, S.; Anguelov, D.; Erhan, D.; Vanhoucke, V.; Rabinovich, A. Going Deeper with Convolutions. In Proceedings of the 2015 IEEE Conference on Computer Vision and Pattern Recognition (CVPR), Boston, MA, USA, 7–12 June 2015; pp. 1–9. [Google Scholar]
- Tang, Z.; Yang, J.; Li, Z.; Qi, F. Grape Disease Image Classification Based on Lightweight Convolution Neural Networks and Channelwise Attention. Comput. Electron. Agric. 2020, 178, 105735. [Google Scholar] [CrossRef]
- Chen, J.; Wang, W.; Zhang, D.; Zeb, A.; Nanehkaran, Y.A. Attention Embedded Lightweight Network for Maize Disease Recognition. Plant Pathol. 2021, 70, 630–642. [Google Scholar] [CrossRef]
- Xingyan, L.; Dan, Q. Joint Bottleneck Feature and Attention Model for Speech Recognition. In Proceedings of the 2018 International Conference on Mathematics and Artificial Intelligence (ICMAI 2018), New York, NY, USA, 20–22 April 2018; Assoc Computing Machinery: New York, NY, USA, 2018; pp. 46–50. [Google Scholar]
- Mi, H.; Sankaran, B.; Wang, Z.; Ittycheriah, A. Coverage Embedding Models for Neural Machine Translation. arXiv 2016, arXiv:1605.03148. [Google Scholar]
- Hu, J.; Shen, L.; Sun, G. Squeeze-and-Excitation Networks. In Proceedings of the 2018 IEEE/Cvf Conference on Computer Vision and Pattern Recognition (CVPR), Salt Lake City, UT, USA, 18–23 June 2018; IEEE: New York, NY, USA, 2018; pp. 7132–7141. [Google Scholar]
- Huang, G.; Liu, Z.; van der Maaten, L.; Weinberger, K.Q. Densely Connected Convolutional Networks. In Proceedings of the 30th IEEE Conference on Computer Vision and Pattern Recognition (CVPR 2017), Honolulu, HI, USA, 21–26 July 2016; IEEE: New York, NY, USA, 2017; pp. 2261–2269. [Google Scholar]


| Disease Grade | Symptoms |
|---|---|
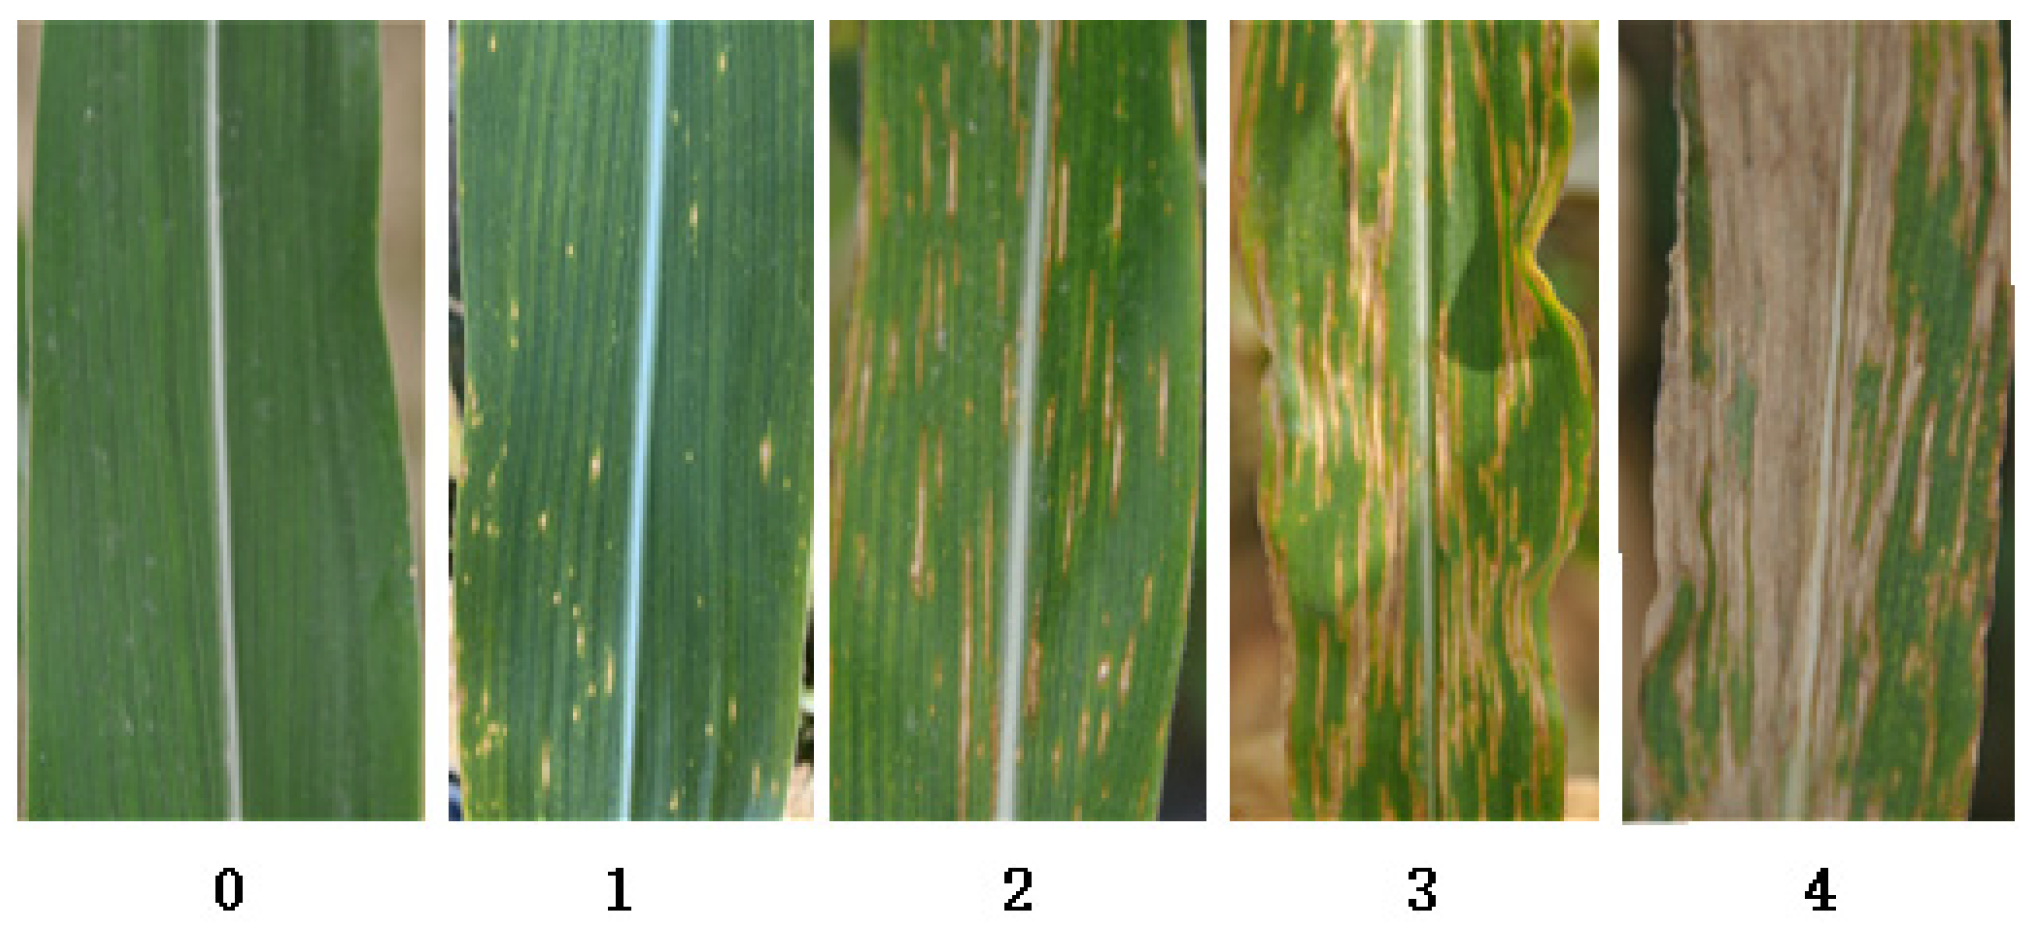
| 0 | No obvious symptoms |
| 1 | The leaves appear chlorosis and scattered oval lesions () |
| 2 | The leaf spots became larger and some of them were spindle shaped and densely distributed () |
| 3 | The adjacent leaf spots overlap and wither at the edge () |
| 4 | More than 1/2 of the leaves showed wilting symptoms () |
| Disease Grade | Images | Images (Augmentation) | Training Images | Validation Images | Testing Images |
|---|---|---|---|---|---|
| 0 | 112 | 1172 | 702 | 235 | 235 |
| 1 | 125 | 1139 | 689 | 225 | 225 |
| 2 | 328 | 1689 | 1013 | 338 | 338 |
| 3 | 348 | 1540 | 924 | 308 | 308 |
| 4 | 355 | 1987 | 1027 | 480 | 480 |
| Layer | Patch Size/Stride | Output Tensor |
|---|---|---|
| Input | Augmented images | 224 × 224 × 3 |
| Convolution | 7 × 7/2 | 112 × 112 × 96 |
| Max_pooling | 3 × 3/2 | 56 × 56 × 96 |
| Convolution | 3 × 3/1 | 56 × 56 × 192 |
| DISE Block1 | 3 × 3/dilated 3, 2, 1 | 56 × 56 × 288 |
| Max_pooling | 2 × 2/2 | 28 × 28 × 288 |
| DISE Block2 | 3 × 3/dilated 3, 2, 1 | 28 × 28 × 360 |
| DISE Block3 | 3 × 3/dilated 3, 2, 1 | 28 × 28 × 360 |
| Max_pooling | 2 × 2/2 | 14 × 14 × 360 |
| Convolution | 3 × 3/2 | 7 × 7 × 256 |
| Average_Pooling | - | 1 × 1 × 256 |
| Softmax | - | 5 |
| Parameter | Value |
|---|---|
| Optimizer | Stochastic Gradient Descent |
| Loss function | Categorical crossentropy |
| Batch size | 16 |
| Epoch | 40 |
| Initial learning rate | 0.1 |
| Momentum | 0.9 |
| Patience (ReduceLROnPlateau) | 3 |
| Factor (ReduceLROnPlateau) | 0.5 |
| Models | Size (MB) | Parameters (M) | Precision (%) | Recall (%) | F1_Score (%) | Accuracy (%) |
|---|---|---|---|---|---|---|
| VGG16 | 1000 | 134 | 88.01 | 87.94 | 87.99 | 91.11 |
| ResNet50 | 180 | 23.6 | 90.37 | 90.33 | 90.60 | 89.77 |
| InceptionV3 | 167 | 21.8 | 89.88 | 89.91 | 89.97 | 90.97 |
| MobileNetv1 | 24.8 | 3.23 | 92.56 | 92.92 | 92.78 | 92.51 |
| MobileNetv2 | 17.8 | 2.28 | 92.28 | 92.41 | 92.11 | 92.17 |
| DenseNet121 | 54.6 | 54.6 | 95.34 | 95.48 | 95.34 | 94.25 |
| DISE-Net | 14 | 1.69 | 96.25 | 96.28 | 96.08 | 97.12 |
| Precision (%) | Recall (%) | F1_Score (%) | Support | |
|---|---|---|---|---|
| 0_HL | 0.99 | 1.00 | 0.99 | 235 |
| 1_BH | 0.98 | 0.96 | 0.97 | 228 |
| 2_BH | 0.96 | 0.96 | 0.96 | 337 |
| 3_BH | 0.92 | 0.94 | 0.93 | 307 |
| 4_BH | 0.97 | 0.95 | 0.96 | 397 |
| Macro avg | 0.96 | 0.96 | 0.96 | 1504 |
| Weighted avg | 0.96 | 0.96 | 0.96 | 1504 |
| Accuracy | - | - | 0.96 | 1504 |
| Models | Network Architecture | Size (MB) | Parameters (M) | FLOPs (M) | Accuracy (%) |
|---|---|---|---|---|---|
| DISE_V1 | Dilation rate = 1 | 17.5 | 2.27 | 5.08 | 97.29 |
| DISE_V2 | Dilation rate = 2 | 20.3 | 2.63 | 6.01 | 97.72 |
| DISE_V3 | Dilation rate = 3 | 23.1 | 2.98 | 6.93 | 97.98 |
| DISE_V4 | Dilation rate = 4 | 25.9 | 3.34 | 7.86 | 97.63 |
| Models | Size (MB) | Parameters (M) | Precision (%) | Recall (%) | F1_Score (%) | Accuracy (%) |
|---|---|---|---|---|---|---|
| Base(no_SENet_Dense) | 11.3 | 1.44 | 95.13 | 95.54 | 95.22 | 96.05 |
| Base(no_SENet) | 13.9 | 1.79 | 95.42 | 95.67 | 95.42 | 94.91 |
| Base(no_Dense) | 11.3 | 1.44 | 95.67 | 95.88 | 95.55 | 96.32 |
| Base | 14 | 1.69 | 96.25 | 96.28 | 96.08 | 97.12 |
| Disease Grade | Input Image | DenseNet121 | MobileNetv2 | ResNet50 | DISE-Net |
|---|---|---|---|---|---|
| 1 |  |  |  |  |  |
| 2 |  |  |  |  |  |
| 3 |  |  |  |  |  |
| 4 |  |  |  |  |  |
Publisher’s Note: MDPI stays neutral with regard to jurisdictional claims in published maps and institutional affiliations. |
© 2022 by the authors. Licensee MDPI, Basel, Switzerland. This article is an open access article distributed under the terms and conditions of the Creative Commons Attribution (CC BY) license (https://creativecommons.org/licenses/by/4.0/).
Share and Cite
Yin, C.; Zeng, T.; Zhang, H.; Fu, W.; Wang, L.; Yao, S. Maize Small Leaf Spot Classification Based on Improved Deep Convolutional Neural Networks with a Multi-Scale Attention Mechanism. Agronomy 2022, 12, 906. https://doi.org/10.3390/agronomy12040906
Yin C, Zeng T, Zhang H, Fu W, Wang L, Yao S. Maize Small Leaf Spot Classification Based on Improved Deep Convolutional Neural Networks with a Multi-Scale Attention Mechanism. Agronomy. 2022; 12(4):906. https://doi.org/10.3390/agronomy12040906
Chicago/Turabian StyleYin, Chenghai, Tiwei Zeng, Huiming Zhang, Wei Fu, Lei Wang, and Siyu Yao. 2022. "Maize Small Leaf Spot Classification Based on Improved Deep Convolutional Neural Networks with a Multi-Scale Attention Mechanism" Agronomy 12, no. 4: 906. https://doi.org/10.3390/agronomy12040906