Article

Phytic Acid Content of Faba Beans (Vicia faba)—Annual and Varietal Effects, and Influence of Organic Cultivation Practices

1
Institute for Food Chemistry, Hamburg School of Food Science, University Hamburg, Grindelallee 117, 20146 Hamburg, Germany
2
Landesbetrieb Landwirtschaft Hessen, Kölnische Str. 48, 34117 Kassel, Germany
3
Institute of Food and Environmental Research (ILU) e. V., Papendorfer Weg 3, 14806 Bad Belzig, Germany
4
Department of Food Chemistry and Analysis, Institute of Food Technology and Food Chemistry, Technische Universität Berlin, TIB 4/3-1, Gustav-Meyer-Allee 25, 13355 Berlin, Germany
*
Author to whom correspondence should be addressed.
Agronomy 2022, 12(4), 889; https://doi.org/10.3390/agronomy12040889
Submission received: 2 March 2022 / Revised: 28 March 2022 / Accepted: 4 April 2022 / Published: 6 April 2022

Abstract

:
Legumes such as faba beans (Vicia faba) are once again gaining popularity, especially in Europe. This is due to the fact that they are an important source of plant-based proteins for human as well as animal nutrition. In addition to a high protein content, faba beans have a wide range of secondary plant metabolites (SPMs). Some of them, such as phytic acid (PA, inositol hexakisphosphate), are discussed controversially with regard to their role as dietary compounds. As ecophysiological conditions and agronomical practices are well known to alter SPMs in (food) plants, it is hypothesized that the farming system has an impact on the overall SPMs content in plants and there might be a correlation between organically grown bean samples and PA content. Consequently, this study aimed at characterizing the German-wide variation in the PA content of faba beans produced under real cultivation conditions. Influencing factors such as cultivar and use of organic or conventional cultivation have been evaluated in order to reveal dependencies of PA in legumes. All bean samples were obtained from different conventional and organic farms from eleven German federal states over three consecutive cultivation years (2016–2018). However, beans did not show annual effects in PA content. As expected, there were dependencies related to the cultivar. Furthermore, significant differences between conventionally and organically grown beans were found, independent of fungicide or insecticide use.

1. Introduction

Faba beans (Vicia faba) represent an important source of food for securing the protein supply for humans and animals, accompanying the demand for vegan, sustainable, regional, and GMO (genetically modified organism)-free alternatives to meat and soy products. They provide a variety of different secondary plant metabolites (SPMs) such as tannins, protease-inhibitors, saponins, and phytic acid (PA, inositol hexakisphosphate).
Of these compounds, PA accounts for the largest proportion with 0.5–1.8% of the total dry weight of common faba beans [1]. It is the main storage source of phosphorus in plants and accounts for about 85% of the total phosphorus content in cereals and legumes [2]. Depending on the plant family, PA is localized in different plant compartments. In legumes, it is present in the cotyledons and in cereals, predominantly in the aleurone layer [3]. When the seeds are irrigated, germination starts and naturally occurring phytases are activated [4]. These hydrolyze the PA stored in the seeds, releasing phosphate and complexed minerals, making them available to the seedling. Despite this elemental function for the plant as an early nutrient source for the seedling, a high PA content is discussed controversially, especially with regard to the nutritional quality of legume products for consumption by various animal species. This is due to the fact that PA can interact with minerals, trace elements, and proteins and consequently diminish the uptake of these indispensable compounds. In particular, divalent cations like zinc, iron, calcium, and magnesium form stable chelate complexes with PA that pass through the gastrointestinal tract and are excreted without nutrient utilization [5]. PA–protein interactions are primarily problematic in the inhibition of digestive enzymes, as this can hinder the absorption of further nutrients as well [6]. Ruminants, due to their special gut microbiota, are able to cleave PA and PA–protein complexes, allowing the released phosphate to be utilized by the animal. In contrast, in monogastric animals (e.g., pigs, poultry, humans), the bioavailability of phosphate from PA is almost non-existent and it may be excreted with the complexation of minerals or proteins [7]. In addition to the possible loss of minerals and proteins in animals, phosphate enrichment takes place in the excreta and thus, in soils and water. To counteract these phenomena, bacterially produced phytases are used more and more frequently in animal nutrition. These are usually added to the feed as a powder and activated after contact with body fluids (e.g., saliva, gastric juice) [7].
However, a reduction in PA content does not necessarily need to be forced, as recent studies showed that PA consumption can also provide beneficial properties. These include possible protection against several types of cancer due to its antioxidant properties, the interruption of cellular signal transduction pathways, and the enhancement of natural killer cells [1]. Additionally, the key functions of PA and its precursors (myo-inositol and lower inositol phosphates) for the plant itself must be considered. PA is a cofactor for phytohormone (e.g., jasmonic acid, auxin) receptors and a cofactor of the mRNA nuclear export [8,9]. Disruption of the phytate pathway has been reported to alter plant responses to biotic and abiotic stress (e.g., osmotic, drought, freezing temperature, oxidative stress) [10].
In this context, dependence on the cultivation method represents a factor that has not yet been comprehensively assessed. Conflicting results are described in the literature. An overview of the impact of the farming system (conventional vs. organic) on the SPM profile and their contents is provided by Winter and Davis [11]. SPM-like PAs are generally compounds that are not directly involved in plant growth, development, or reproduction, but usually offer some benefits (e.g., increased plant defense against predators). Most of the studies suggest that organic farming practices promote the formation of SPMs, because they may potentially be grown under more or less stressful conditions [12,13,14]. However, most of these studies focused primarily on polyphenols. As PA is kind of bipolar in its biochemical function (cofactor vs. defense) as well as its nutritional properties (phosphate supply vs. complexation of minerals), its formation under certain influencing factors needs to be revaluated.
The evaluation of such influencing factors requires large sample sets for the identification and a potential assignment of certain responsibilities and dependencies. In the nationwide German project Demonstrationsnetzwerk Erbse-Bohne (DemoNetErBo, Exemplary demonstration network for expanding and improving the cultivation and utilization of peas and beans) funded by the German Federal Ministry of Food and Agriculture (BMEL) and the German Federal Office for Agriculture and Food (BLE), the aim was to close the gap between scientific studies and recommendations for farmers. Thus, the network DemoNetErBo provided a unique sample set of faba beans grown under non-designed real cultivation conditions all over Germany for an evaluation of selected quality parameters such as PA.
The aim of this present study was to correlate the PA content of faba beans with significant influence factors and pre-requisites of certain cultivation sites in Germany. Besides this, the genotype-associated traits, correlations, and cultivation conditions (conventional vs. organic) were also investigated.

2. Materials and Methods

2.1. Bean Samples

The present set of samples was part of the German national project Demonstrationsnetzwerk Erbse-Bohne (DemoNetErBo, Exemplary demonstration network for expanding and improving cultivation and utilization of peas and beans). Farmers involved in the project provided a sample set of 162 faba bean samples (Vicia faba) over three different cultivation years (2016, 2017, and 2018). Whole legume seeds were obtained from 75 different conventional and organic farms from all over Germany. Bean pods were harvested with machines, and seed samples were selected randomly from the harvester’s storage tank. The sample material was cultivated under authentic growth conditions without any specific field trial design. Within DemoNetErBo, official agricultural advisors from each federal state supervised and accompanied each farm, and, in the case of ecologically cultivated samples, special advisers from major well-known international associations for organic agriculture provided their support as well. Farmers were asked to provide additional information with a questionnaire for the specific sample. Here, farmers recorded information about cultivars and cultivation conditions such as the name of the cultivar, cultivation practice, and geographical coordinates. Additional data (e.g., usage of fungicides/insecticides) were provided voluntarily by the farmers. In some cases, detailed information was not or could not be provided, and no precise information can be given on which chemicals were used as fungicides and insecticides in detail; it was only possible to assess whether or not treatment took place. This was also with regard to any possible treatment, i.e., fertilizers that are allowed for organic farming in Germany.
Whole dry bean seeds were milled to a fine flour (particle size < 500 µm) using an analysis mill A11 basic (IKA-Werke GmbH & Co. KG, Staufen, Germany). The dry mass of the flour was estimated with a moisture analyzer HR73 (Mettler Toledo International Inc., Columbus, OH, USA). In Germany, all quality values are calculated with a regard to a dry matter basis of 86%.

2.2. Chemicals

The enzymes phytase (12,000 U/mL) and alkaline phosphatase (ALP; 80 U/mL) as well as a phosphate standard solution were supplied as part of the commercially available Total Phosphorus and Phytic Acid Assay Kit (Cat. No. K-PHYT) obtained from Megazyme International Ltd. (Bray, Ireland).
Ammonium molybdate, ascorbic acid, glycine, magnesium chloride hexahydrate, sodium acetate trihydrate, and zinc sulphate heptahydrate were obtained from Sigma-Aldrich Chemie GmbH (Taufkirchen, Germany). Hydrochloric acid (37%), trichloroacetic acid and sodium hydroxide pellets were obtained from Carl Roth GmbH & Co. KG (Karlsruhe, Germany). Sulfuric acid (95%) was purchased by Grüssing GmbH (Filsum, Germany).

2.3. Determination of the PA Content

A colorimetric method was used to perform the quantitative analysis of PA in the bean samples [15]. The assay is based on a reaction of phosphorus and ammonium molybdate. The deviation of phosphorus released by enzymatic hydrolysis and total phosphorus content represents the phosphorus solely released by PA (and related inositol phosphate derivatives). The original photometric analysis for single samples was optimized for a high throughput analysis using a plate-reader photometer. Basically, solution volumes were reduced, but with consideration given to retaining the pH value and reaction solution/color reagent ratio.
Color reagent (sulfuric ascorbic acid and ammonium molybdate solution), ALP assay buffer (400 mM glycine, 4 mM magnesium chloride, and 0.4 mM zinc sulphate, pH 10.4), and phytase assay buffer (200 mM sodium acetate, pH 5.5) were prepared according to McKie (2016). Phosphorus stock solution (50 µg/mL) was diluted to obtain seven standard solutions (0.625, 1.25, 2.50, 3.75, 5.00, 6.25, and 7.50 µg/mL) for external photometric calibration.

2.3.1. Sample Extraction

For the extraction, 1 mL hydrochloric acid (0.66 M) was added to 40–50 mg of the bean flour and mixed with vigorously stirring for 2 h at ambient temperature. Afterwards, samples were centrifuged at 10,000× g for 10 min. A total of 0.5 mL of the supernatant was transferred to a fresh 2-mL tube and neutralized by the addition of 0.5 mL sodium hydroxide (0.75 M).

2.3.2. Photometric Determination of Total and Free Phosphorus

To consider the natural occurring free phosphorus, each sample extract was applied to a “total phosphorus” reaction and a “free phosphorus” reaction. The total phosphorus reaction contained phytase assay buffer (200 µL), sample extract (50 µL), and phytase at 12,000 U/mL (20 µL). The free phosphorus reaction contained phytase assay buffer (200 µL), distilled water (20 µL), and sample extract (50 µL). Reaction solutions were mixed thoroughly and incubated at 40 °C for 10 min, while shaking at low intensity (250 rpm). After incubation, ALP assay buffer (200 µL) was added to all samples and, subsequently, 20 µL ALP (80 U/mL) for the total phosphorus reaction or 20 µL distilled water for the free phosphorus reaction. All solutions were mixed thoroughly and incubated at 40 °C for 15 min while shaking at low intensity (250 rpm). All reactions were terminated by the addition of 150 µL trichloroacetic acid (50%, w/v) and thoroughly mixing using a vortex mixer, followed by centrifugation at 10,000× g for 10 min. A quantity of 100 µL supernatant was transferred into a well of a 96-well plate. A total of 200 µL color reagent was added to each well and incubated in the dark at 40 °C for 1 h. Photometric determination was carried out at 655 nm with a Synergy™ HT microplate reader (Biotek Instruments Inc., Winooski, VT, USA). The results of the PA analysis are listed in Supplementary Table S1.

2.4. Statistical Analysis and Processing

The calculated phytic acid content (PA) in the bean flour was standardized for a dry mass (DM) of 86% which is a usual value for marketing legumes. The statistical analysis was carried out by SPSS® Statistics software (IBM, version 26). Here, the unpaired t-test and ANOVA were used as the data were parametric. For the statistical evaluation, a significance level of p < 0.05 was set.

3. Results

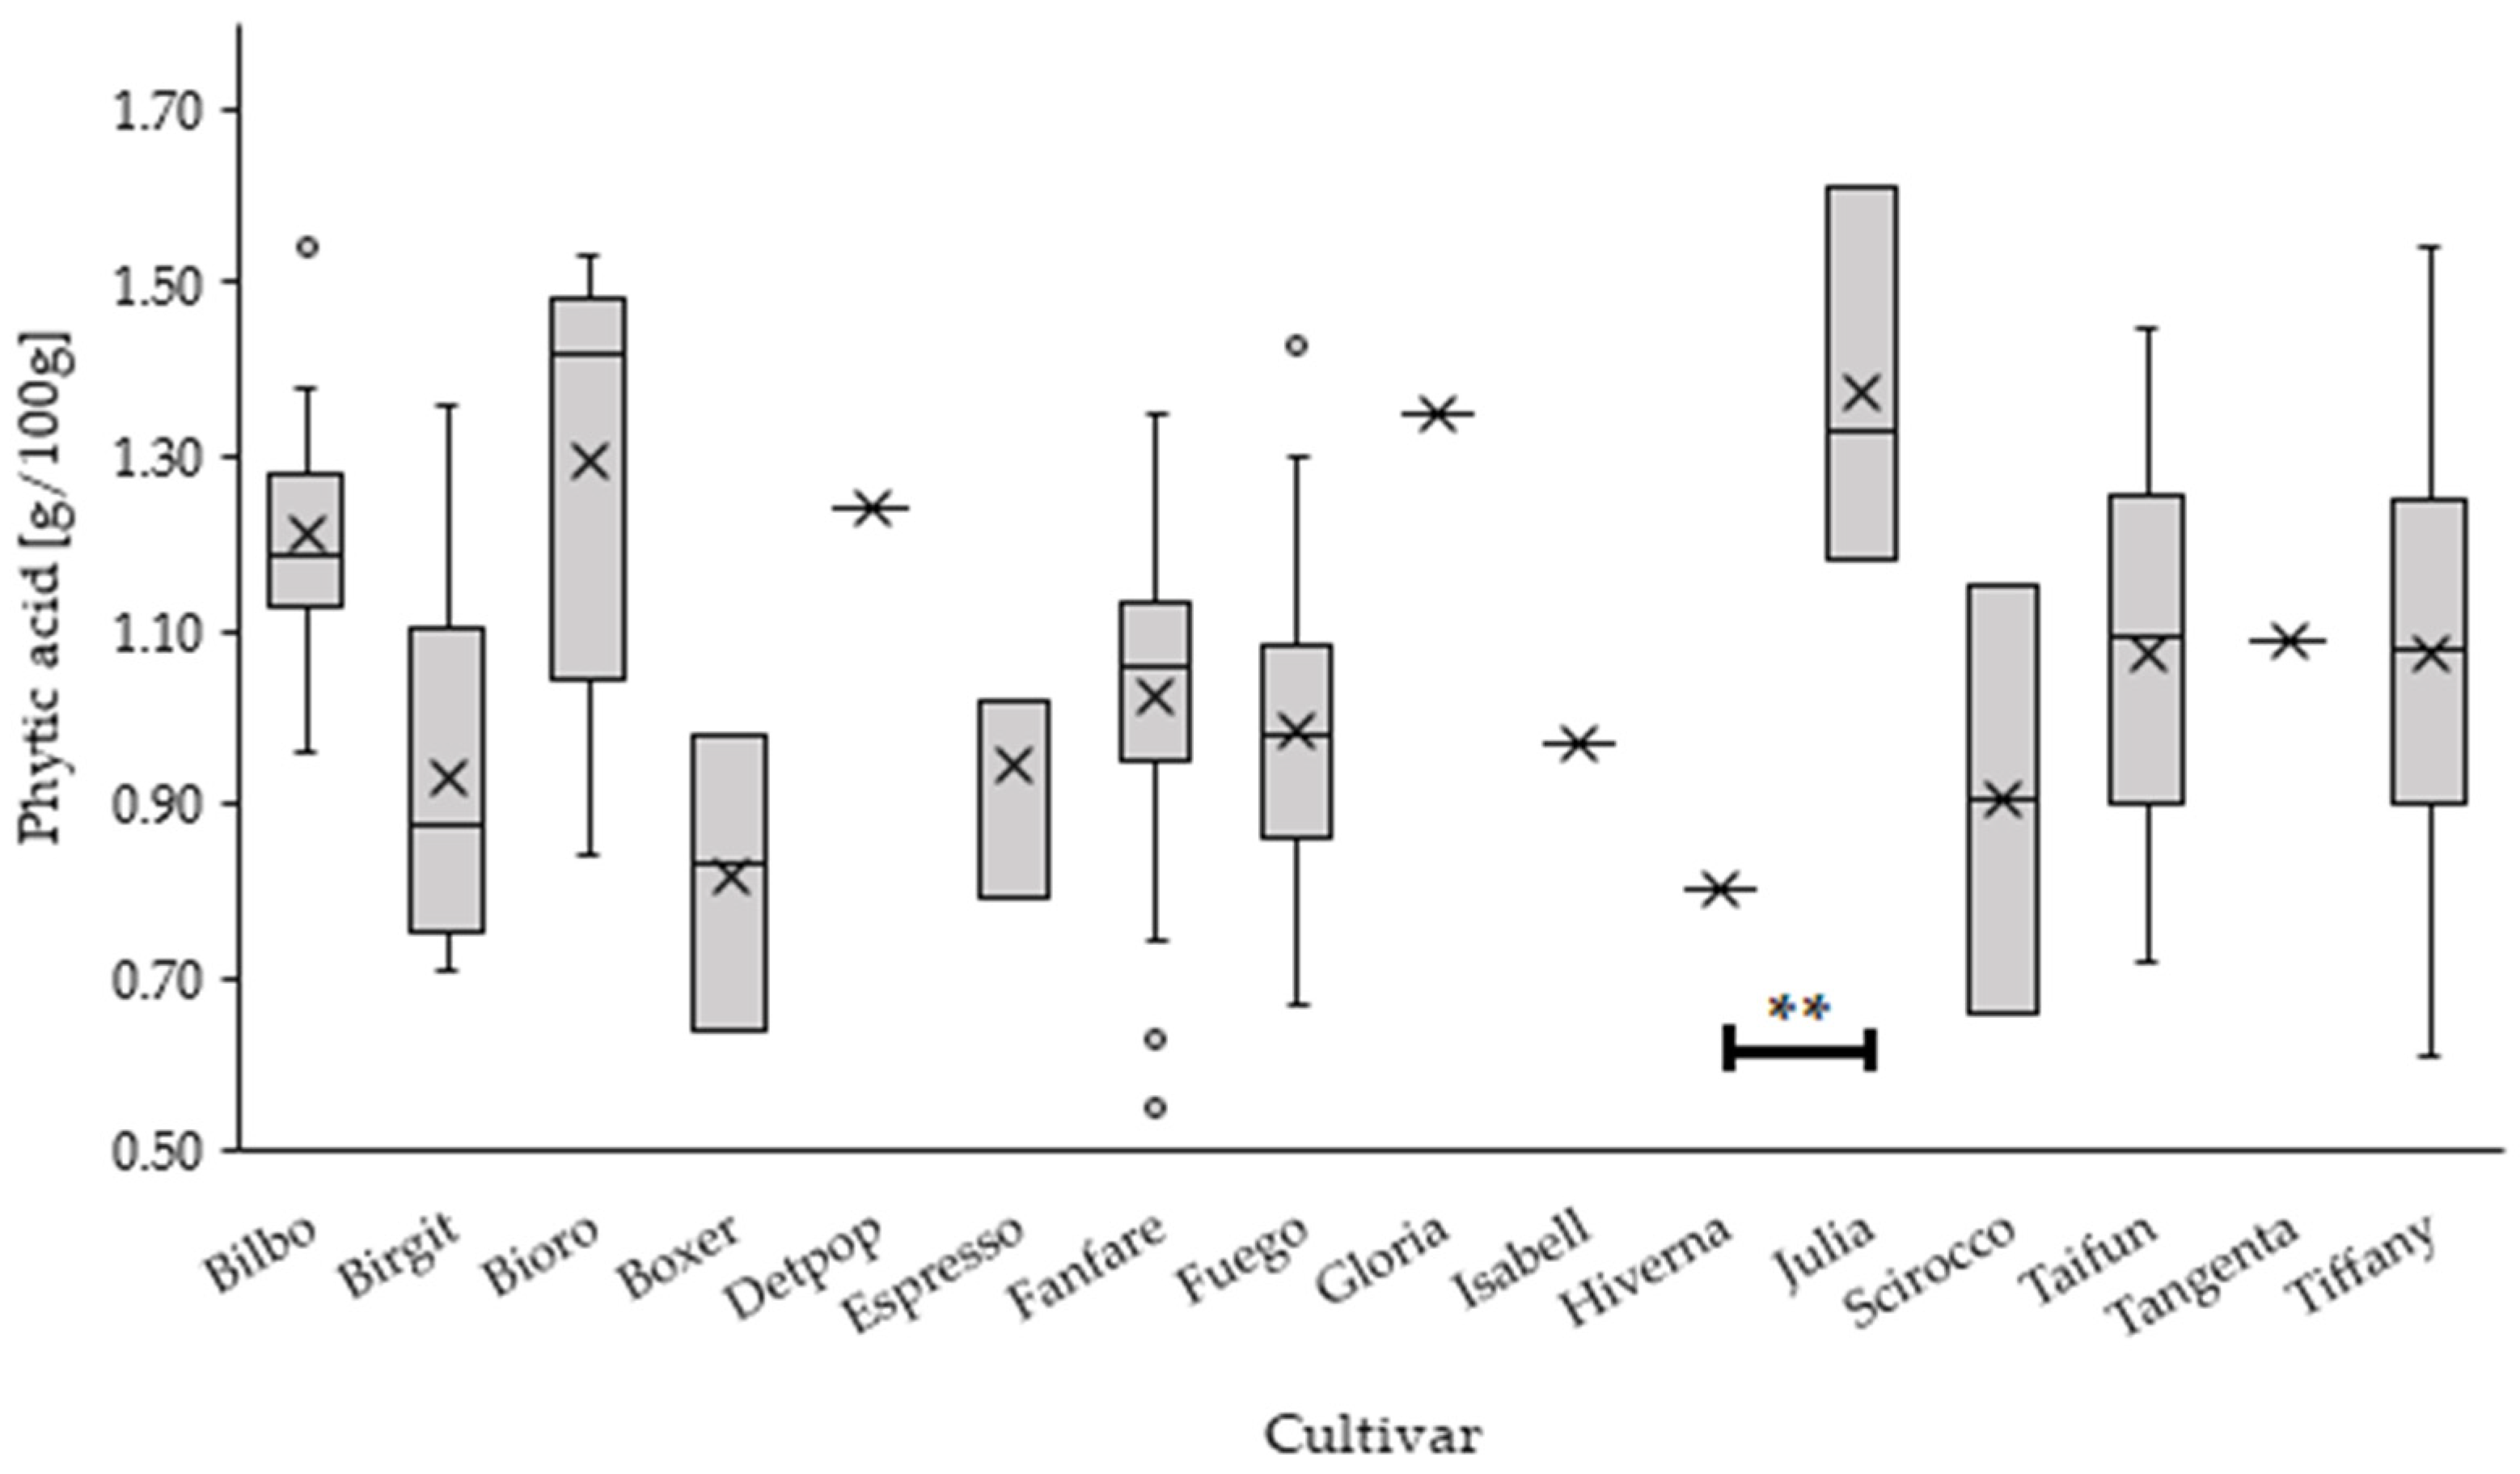
3.1. Influence of the Cultivar on the PA Content

First, the faba bean samples were analyzed with regard to cultivar, as genotype is a main influencing factor for the composition of metabolites in a plant. Over the three cultivation years (2016, 2017, and 2018) under observation, a total of 16 different bean cultivars were grown in Germany (Figure 1; Table 1). While the cultivars Julia (1.37 g/100 g), Gloria (1.35 g/100 g), and Bioro (1.30 g/100 g) showed the highest average of PA contents, Hiverna (0.80 g/100 g), Boxer (0.82 g/100 g), and Scirocco (0.91 g/100 g) provided generally the lowest values.

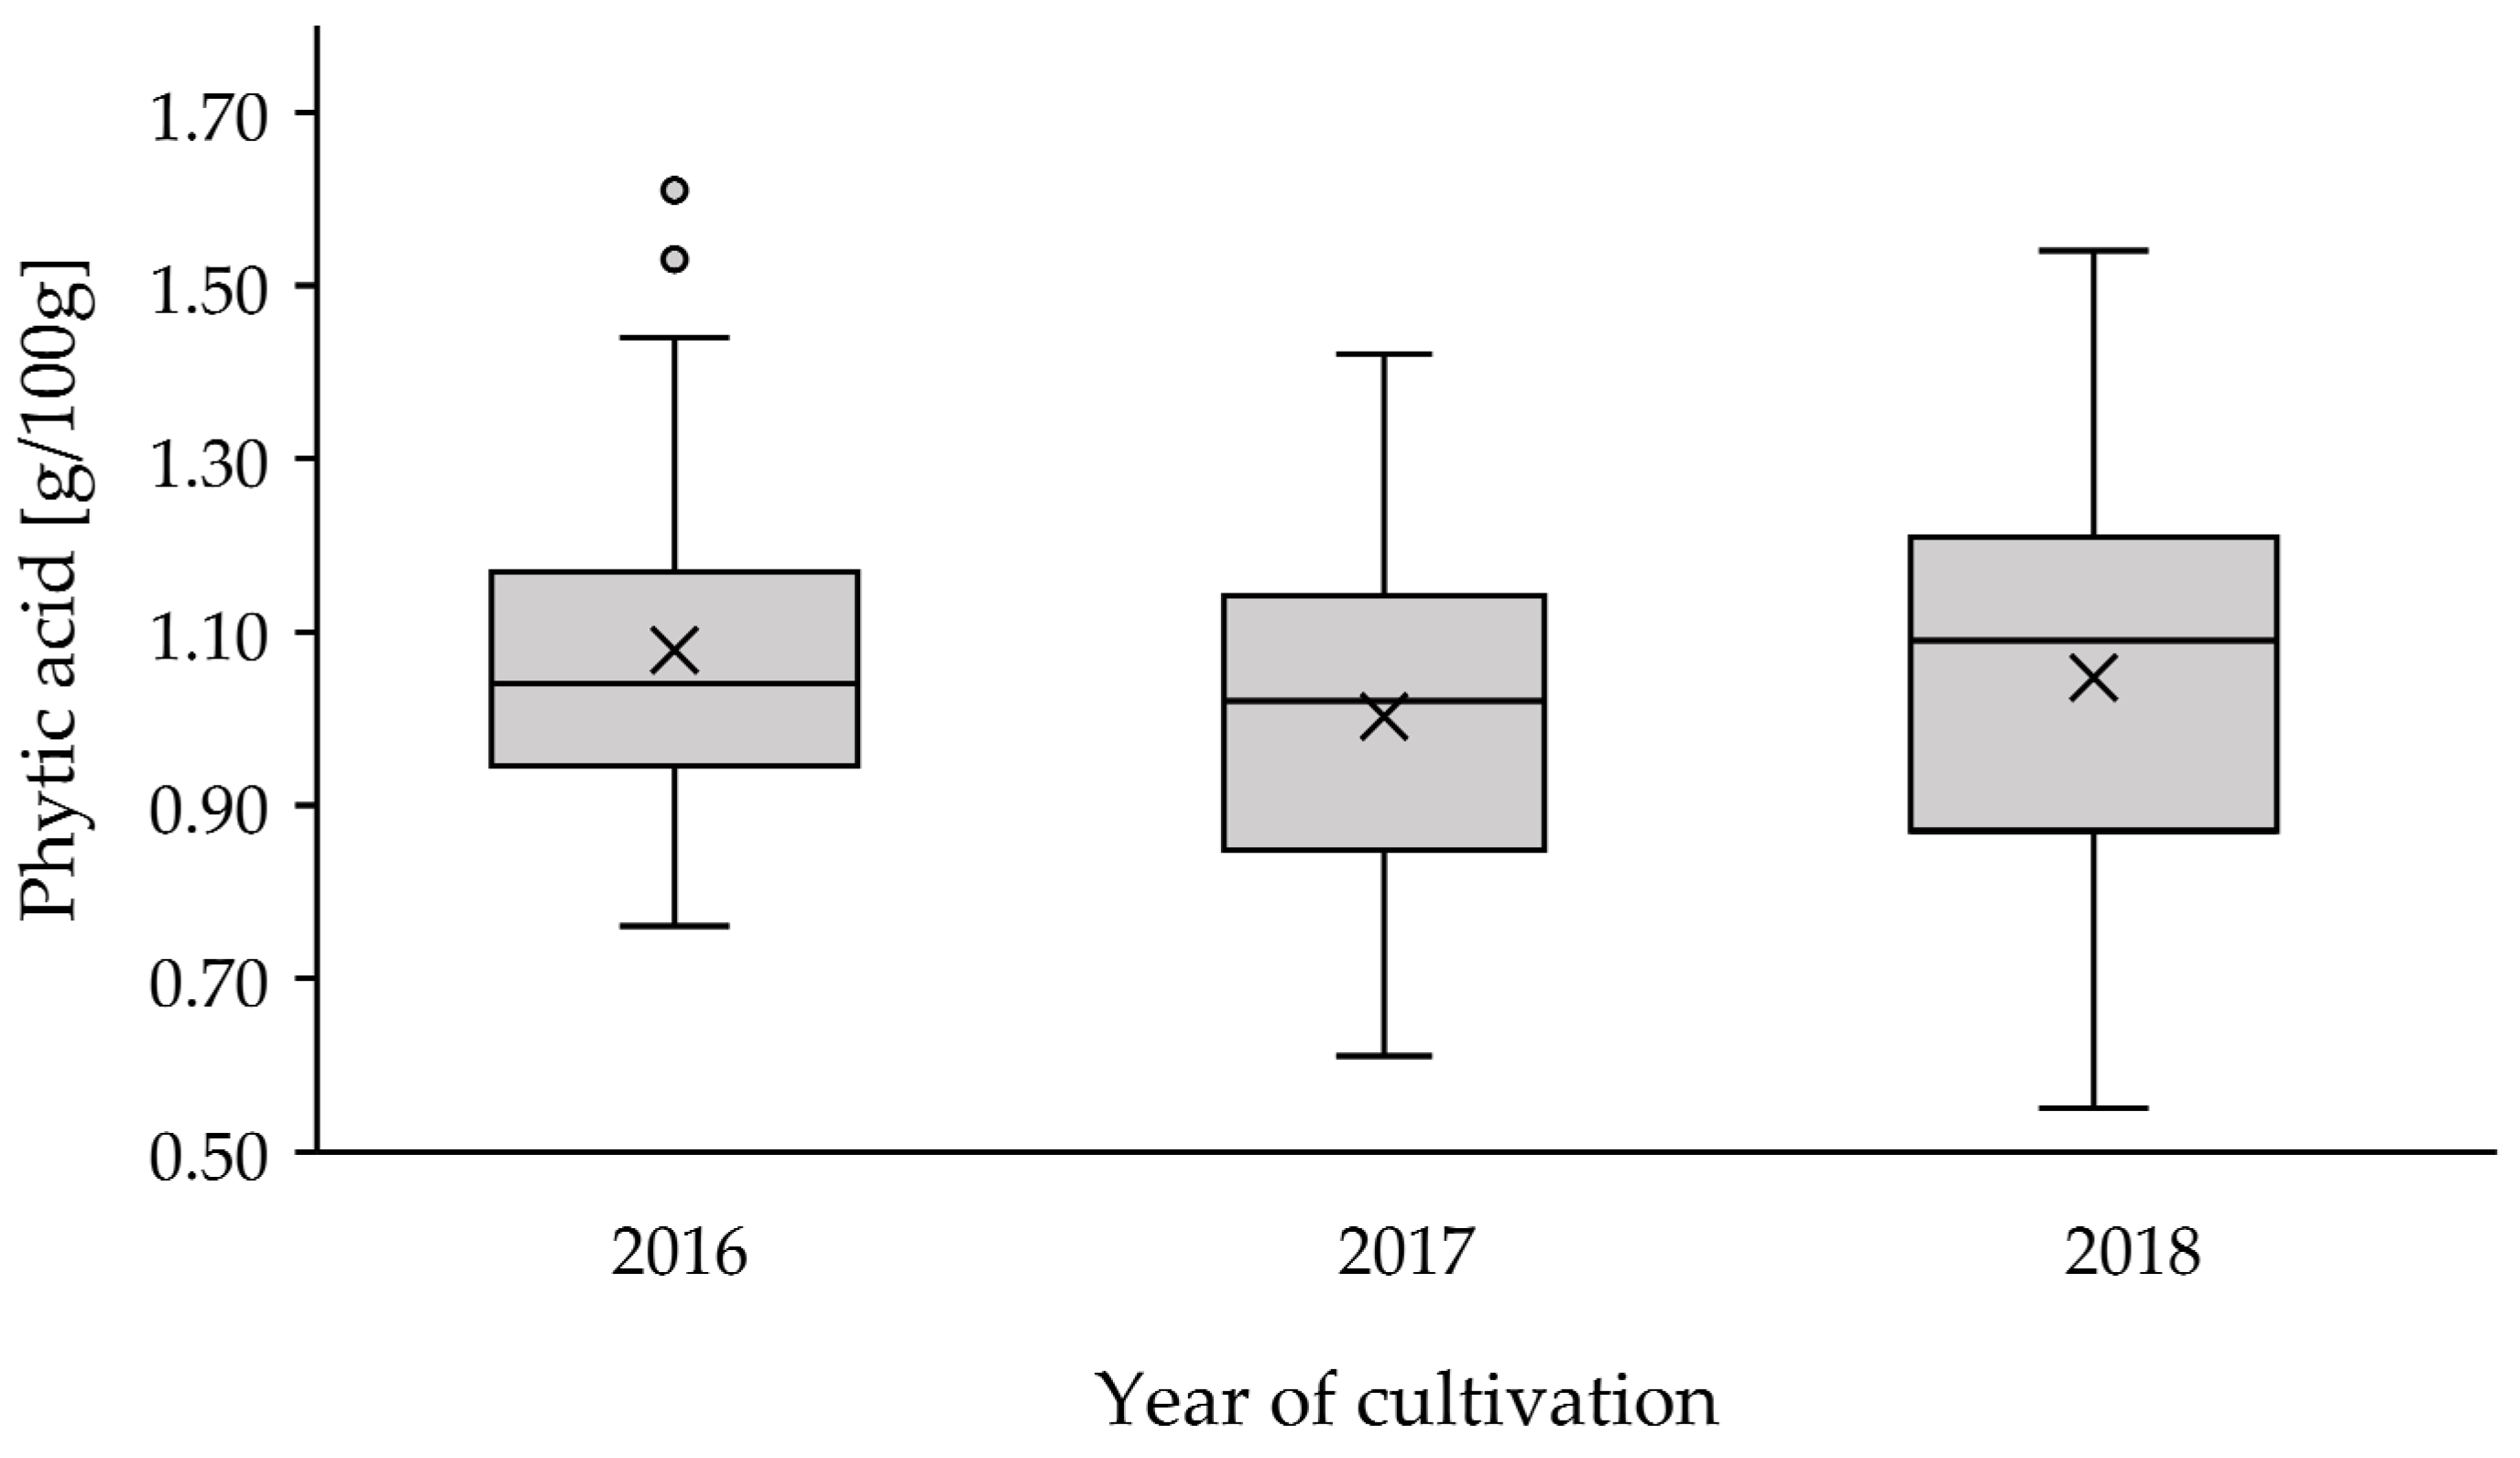
3.2. Annual Effects on PA Content

Besides genotype, ecophysiological factors play a dominant role for influencing the composition, especially that of secondary plant metabolites, of crops. This consequently might result in annual effects, due to a different extent of temperature and precipitation, but also a change in soil composition, when different cultivation sites are used, as is obviously done in crop rotation. Further factors might be the use of fertilizers and crop protection agents. However, results of the present study showed no significant differences (p = 0.138) in the year-to-year comparison (Figure 2; Table 2). The year 2016 showed slightly higher levels of PA (1.08 ± 0.20 g/100 g) than the other two years. The year 2017 showed marginally lower PA contents (1.00 ± 0.21 g/100 g). In 2018, despite the lowest number of samples and the reduced cultivar diversity, the ranges were the largest.

3.3. Influence of the Cultivation System (Conventional vs. Organic) on the PA Content

Organic farming has become increasingly important in recent years. Consumers are paying more and more attention to sustainable cultivation and short transport routes. The use of pesticides is generally not appreciated as well. This development is leading to changed growth conditions for the plant, especially with regard to parameters such as the application of crop protection agents and fertilization. These parameters allow a categorization into conventional vs. organic cultivation conditions.
In the present study, a very significant difference in PA content was shown between conventional and organic cultivation (Table 3). Significantly lower PA contents were found for conventional cultivation than organic cultivation (p < 0.01).

3.4. Influence of Fungicide Treatment on Phytic Acid Content

One of the treatments often differing between conventional vs. organic cultivation conditions is the use of certain fungicides. In the present study, a very significant difference in PA levels within all crop years between fungicide-treated and non-fungicide-treated faba beans was shown (Table 4). Significantly lower PA levels were found in fungicide-treated samples compared to the non-fungicide-treated samples (p < 0.01).

3.5. Influence of Insecticide Treatment on Phytic Acid Content

Similarly to fungicide treatment, treatments with insecticides might also point at organic cultivation. A very significant difference in the PA content of faba beans within all crop years between insecticide-treated and non-insecticide-treated beans was shown (Table 5). A significantly lower PA content was found in insecticide-treated samples compared to non-insecticide-treated.

3.6. Cross-Correlations of Farming System and Fungicide-/Insecticide-Usage

To test the interaction between the different parameters the following cross-correlations were performed. Selected criteria were ‘conventional cultivation,’ ‘organic cultivation,’ and whether a fungicide treatment (fungicide used/no fungicide used) or insecticide treatment (insecticide used/no insecticide used) took place or not. An overview of the combination of these criteria is given in Table 6. The question arose to what extent the results came from surveyed parameters (such as fungicide/insecticide use) or from the parameters of the respective cropping systems that could not be surveyed within the course of the project (e.g., tillage, hummus thickness, fertilization, field rotation).
It became apparent that depending on the criteria, the selection of samples overlaps to a large extent. This results from the fact that almost no fungicide or insecticide use took place in organic farming (Table 6; correlations Nos. 3 and 4; n = 1). To allow an assessment of the farming system without the influence of fungicide and insecticide treatment, only bean samples that were not treated by the farmers were included in that next comparison. As a result, there are still significant differences in PA content between organic and conventional cultivation in fungicide-untreated bean samples (Table 6; correlation No. 1; n = 77). For insecticide-untreated samples, there is again a significant difference between organic and conventional cultivation (Table 6; correlation No. 2; n = 83). Taking the remaining filter criteria constellations into consideration, samples solely grown conventionally were now also closely studied for an influence of fungicide (Table 6; correlation No. 5; n = 105) or insecticide treatment (Table 6; correlation No. 6; n = 111). Here, a trend could be observed, but there were no significant differences (p > 0.05). This again underlines that the fungicide and insecticide treatments did not affect the PA content in beans significantly.

4. Discussion

4.1. Influence of Cultivation Year and Cultivar

The results show that the PA content in beans apparently depends on several factors. The partially inhomogeneous overall sample composition due to the real samples set makes it difficult to clearly attribute the results to a specific influencing factor. However, there were significant differences in several cases, which allow a certain degree of discussion.
The average PA content over three years in the present study was 1.04 ± 0.21 g/100 g (Table 1). Schlemmer et al. provided an overview of PA content in various legumes, with values ranging from 0.51 to 1.77 g/100 g (100% dry weight) for faba beans [1]. The current study showed a range of 0.51 to 1.61 g/100 g and, thus, it is in line with data from the literature. The annual mean values and the deviation ranges differed only slightly. This could indicate that annual factors (precipitation, solar radiation, temperature) play only a minor role in the formation of PA. It is generally assumed that the biosynthesis of phytate occurs in the cytoplasm [16]. When phosphorus enters the storage cells, there are two biosynthetic pathways for the formation of PA. These are the lipid-dependent and the lipid-independent pathway [17]. The lipid-independent pathway is more prominent in seeds during seed development, while the lipid-dependent pathway is predominant in all other plant organs [18]. The synthesized PA is transported by the ATP-binding cassette of the multidrug resistance-associated protein 5 (MRP5) and stored in the vacuole as phytates (salts of calcium, potassium, and magnesium) [19]. Raboy et al. detected PA in early embryogenesis of soybean seeds and linear PA accumulation throughout the seed development process [20]. Similar accumulation patterns were found in rice [21]. Compared to soybeans, the genes responsible for PA synthesis are differentially expressed in wheat and rice in the late stage of PA biosynthesis [22]. There are numerous examples for biosynthesis being affected by exogenous factors [23]. Bloot et al. assumed that PA biosynthesis is influenced by factors such as soil, fertilizer, plant hormones, climate, irrigation, temperature, environmental conditions, plant genotype, geographical location, and germination time [24]. It can therefore be expected that these factors have an influence on the biosynthesis of PA and, thus, on the total PA content in bean seeds. However, this effect seems to have been marginal here or these factors might have compensated for each other.
As expected, significant differences were found between the different bean cultivars [2,3,25]. However, genotype determines phenotype and, thus, PA formation. The cultivar Hiverna is of particular interest, as it was the only winter-grown bean cultivar in the present sample set. It provided the lowest PA content (0.80 g/100 g; Table 2) of all 162 samples. Unfortunately, only a single sample was available here, which is not very indicative in terms of possible variation ranges and influencing factors. However, if this sample had been representative, it would have contradicted the plant defense hypothesis (c.f. Section 4.2), as winter cultivars are exposed to possible stress factors much longer than summer cultivars, due to the longer residence time in the field. Thus, a higher PA content could have been expected.
When peas’ (Pisum sativum) cultivation period and nitrogen fixation were compared during a single season, it was shown that peas sown in the winter (‘winter peas’) had a higher protein content than summer pea cultivars [26,27]. Winter-sowing (or autumn-sowing) generally results in earlier initiation and a longer duration of development stages than summer-sowing (or spring-sowing) [28]. Additionally, nitrogen fixation and accumulation can be higher with earlier planting dates as shown for several legume genera [29,30].

4.2. Influence of Farming System (Conventional vs. Organic Cultivation)

The bean samples showed significant differences in PA content, depending on cultivation system. Regardless of whether the total number of samples (Table 3) or only the fungicide-/insecticide-untreated samples (Table 6; correlations Nos. 1 and 2) were included, PA content was always significantly higher in organically grown beans. The fact that insecticide/fungicide treatment does not have a remarkable effect could also be the result of the physiological characteristics of legumes. In the present study, only seeds were studied; the pod as a natural protective shell or the plant itself could be more affected as the seeds are not directly exposed to these agrochemicals.
It is widely believed that organic farming practices are generally beneficial for increasing the levels of SPMs in plants and fruits. For example, in a 10-year comparison of organically and conventionally grown tomatoes, flavonoid content nearly doubled (79% increase quercetin and 97% kaempferol) in the organic tomatoes compared to conventionally grown fruits [31]. The authors attribute the higher levels of secondary metabolites mainly to two basic ideas: plant stress and resource availability [32]. When not using synthetic pesticides in organic farming systems, plants are exposed to a number of biotic stress factors. These include, for example, parasites, bacteria, fungi, and insect infestations. These initiators of stress, which are more likely to occur in organic than in conventional cultivation, stimulate the production of natural defense substances such as phenolic compounds [11]. Feeding trials in chickens showed increased immune reactivity and a better response to immune system challenges compared to chickens fed conventional beans [33]. The authors suggest that immune-related resilience in humans is also increased, as the immune system is stimulated by high SPM levels, but quickly returns to homeostasis. Baranski et al. even estimates that a switch to only organically grown crops instead of conventionally grown crops could increase SPM intake by 20–60% (without an increase in caloric intake). However, these extrapolations are based on polyphenol content [34].
The role of PA in the plant defense system is unclear. Although it is generally classified as an SPM, its function remains primarily storing bound phosphate as a stock for the future seedling. At the same time, its antinutritional properties remain and already lead to the death of certain insect species in doses of around 1% [35].
Furthermore, it is partly difficult to compare studies of the influence of an organic cultivation system beyond national borders, because there are large differences in the individual cultivation systems themselves. The division into ‘only’ the two groups ‘organic’ and ‘conventional’ results in a wide range of possible treatment methods, especially depending on the crop and the country of cultivation. For example, according to European council regulation (EC) No 834/2007, the use of a few, approved fungicides and insecticides is permitted in organic farming for the cultivation of faba beans. In the present study, only one out of a total of 78 organically grown bean samples was treated with insecticides (Table 6; correlation No. 3; n = 1) and none with a fungicide (Table 6; correlation No. 4; n = 0). It seems that in Germany, the extensive use of pesticides within the given governmental framework in organic farming is not fully exploited. However, this could change in the next few years in the course of climate change and the associated increase in the number of pests and diseases.
As stated at the beginning of the discussion, the factors of insecticide and fungicide usage can be excluded as distinguishing criteria in the present study, because non-treated bean samples still show significant differences in PA content after excluding the treated bean samples (Table 6; correlations Nos. 1 and 2). The question remains which influencing factor causes a significant difference in conventionally and organically grown beans. A major impact of the factors precipitation, solar radiation, and temperature would result in significant deviations between the annual mean values and variation. They are therefore excluded, as annual effects were non-significant (c.f. Section 3.2).
It has been reported in the literature that high phosphate contents in the soil result in high PA levels [36]. Conventional farming methods are usually characterized by the high availability of selected growth resources (fertilization with N, P, and K). Unfortunately, in the present study no data were available for the phosphate content of the soil. Even though no specific data on fertilization were collected, it can be assumed that less fertilizer is used in an organic farming system than in a conventional farming system. After all, organic farming focuses on the conservation of resources and the environment. Assuming that conventionally grown crops are fertilized more intensely (in parts excessively), i.e., receive an enhanced phosphorus supply, it might be expected that the PA content in conventional crops is higher than in organically grown crops, which is in contrast to the results of the present study. When considering fertilization, the soil microbiome must also be considered. There are studies that indicate that the addition of organic matter (compost or cow dung), especially in combination with lower amounts of mineral fertilizer, resulted in better nodulation and crop yields compared to all mineral fertilizers [37,38]. This is attributed to the increased phosphate solubility carried out by the microorganisms from the rhizosphere [39]. On the other hand, it is also argued that N2-fixing organisms consume more phosphate than non-N2-fixing organisms and, thus, less phosphate is available for the legume plant [40]. Nevertheless, inferring dependence on the soil microbiome was not part of the project. Following the carbon/nutrient balance hypothesis (CNBH), the amount of C-based defending compounds increases in low-nutrient environments and decreases in nutrient-rich environments (e.g., fertilized soils) [41]. On the other hand, Berger et al. (1999) indicated that CNBH is not applicable to legumes, as legumes host atmospheric fixing bacteria (rhizobia) and an increase in C-fixation would concurrently increase the N-fixation rate [42].
In contrast to the plant defense hypothesis, no differences in PA content were found between organic, conventional, and fertilizer-free cultivation in wheat trials [43]. However, the focus there was only on the different fertilizer types (low, high, farmyard manure, all mineral) as crop rotation, varieties, and tillage were the same in all systems [44]. Unfortunately, there are no studies to date on the influence of cultivation system on the PA content in beans. It is questionable whether the results from wheat can be transferred to pulses, as PA is located in different seed compartments. Grain legumes such as faba bean (V. faba), peas (P. sativum), and soybean (Glycine max.) form globoids in the protein storage vacuole of the cotyledons [44]. Globoids are spherical inclusions with a high phytate content. These globoids are—compared to those found in the aleurone layer of grain cereals—small and rare [44]. Legumes store phytates in the cotyledons, occupying the largest volume of the seed, whereas in cereals like wheat it is predominantly located in the aleurone layer [45]. The total content of PA and phosphate is very similar in legumes and cereals. Starting from the same content, globoids are more widely distributed and less abundant in legumes than in cereals.
The bean samples of the present study are biologically closer to soybeans than to rice and wheat, as both are legumes with a similar distribution of PA in the same seed compartment (cotyledons). In combination with the previously mentioned differences (c.f. Section 4.1) in gene expression in the late phase of biosynthesis in wheat and rice, it is difficult to draw a comparison with beans. Soybean seemed to be more suitable as a reference plant [22].
However, with a trend towards higher PA levels in organically grown crops, it must be emphasized that this does not necessarily make diets based on legumes unhealthier. It has been suggested to co-administrate PA for improving the bioavailability of further bioactive SPMs. Matsumoto et al. studied the effects of PA on blackcurrant anthocyanin absorption [46]. As a result, anthocyanin’s absorption improved in rats as well as humans. The authors suggest that this effect may be due to a prolonged transition time caused by a reduced gastrointestinal motility [46]. Other flavonoids such as kaempferol, quercetin, and isorhamnetin showed similar improved absorption effects. Xie et al. administrated these flavonoids together orally with PA to rats [47]. The authors base the results on the possible influence of PA on membrane fluidity, due to PA forming chelate metal ions. Alternatively, increased hydrophilicity due to interactions between PA’s phosphate groups and the carbonyl groups of flavonoids was also suggested [48]. In relation to the already cited study by Mitchell et al. with an almost doubling of the flavonoid content of organically grown tomatoes, the intake of these positively associated substances in the diet can be further increased [31].
Yang et al. reported that perturbations of the PA pathway alter plant response to environmental stimuli. For instance, heterologous expression of AtIPK2β in tobacco leads to improved tolerance to diverse abiotic stresses (oxidative stress, drought, freezing temperature) [10]. Similar observations have been made by Zhai et al. by over-expressing the IbMIPS1 gene in sweet potato (Ipomoea batatas L.) whereby transgenic plants showed significantly enhanced salt and drought tolerance as well as nematode resistance [48]. However, it is not clear whether PA can play a regulatory role in stress tolerance at early developmental stages. There are reports of PA incorporation into the nucleus of proteins which have functions in hormone signaling [9]. It is possible that during seed development they contribute to biotic and abiotic stress responses through indirect PA-mediated signal transduction mechanisms [49,50].
PA and its precursors play diverse roles in gene regulation (e.g., chromatin modification, phosphate homeostasis) [51], signal transduction, membrane biogenesis, and trafficking [52]. Furthermore, positive effects have been shown in the prevention and treatment of diabetes mellitus, atherosclerosis, coronary heart disease, kidney stone formation, HIV-1, and heavy metal-induced toxicity [53]. In recent years, a variety of low phytate mutants made by seed biofortification have been experimented with [50,54]. In addition to a low PA content, numerous negative effects occur. These modified plants showed disadvantages such as a reduced plant growth, low germination rates, and a low resistance to stress [55,56,57,58]. Sustained reductions in total PA content could therefore lead to generally poorer germination, growth, susceptibility to pests, and lower crop yields [17].

5. Conclusions

PA can hinder mineral absorption in the organism and is considered an adverse compound for human as well as animal nutrition. At the same time, there are many positive aspects to consider. Especially in a balanced human diet, antinutritional effects seem to be less severe and preventive effects against many degenerative diseases come to the fore. The contribution of PA to the plant vitality should not to be underestimated, as low PA mutants have been shown to be less healthy and less efficient. It remains to be discussed whether the prospect of these serious deteriorations in plant health caused by various disturbed biosynthetic pathways is worth mitigating the potential antinutritional impact. Nevertheless, the problem of malnutrition in animal feed remains, when there is no supplementation of phytase to the feed. As an approach, varieties with a low PA content could be used mainly for animal nutrition, but the variety of cultivars for human nutrition should be preserved.
It is difficult to make a final judgement on the factors influencing the PA content in faba beans (V. faba). Organic farming seems to lead to higher PA levels compared to conventional farming, but the influence of the cultivation site (especially the soil composition) must be considered as well, as phosphate is fundamental for the formation of PA. The inclusion of the growing site also faces the problem of crop rotation in legumes. Additionally, no final conclusion can be reached as to whether PA serves as a defensive agent from the classical secondary metabolite point of view. PA seems to contradict the carbon/nutrient balance hypothesis, but acts similarly to other secondary metabolites when plants are exposed to exogenous influences. However, the fact that organically grown samples have significant higher PA levels could be an indication of just that role in the defense system.

Supplementary Materials

The following supporting information can be downloaded at: https://www.mdpi.com/article/10.3390/agronomy12040889/s1, Table S1: Bean sample set including meta data and results of phytic acid (PA) and dry mass analysis.

Author Contributions

Conceptualization, J.Z. and S.R.; methodology, J.Z.; formal analysis, J.Z.; investigation, J.Z.; resources, S.R. and U.Q.; writing—original draft preparation, J.Z., S.W. and S.R.; writing—review and editing, J.Z., K.Z. and S.R.; visualization, J.Z.; supervision, S.R.; project administration, S.R. and U.Q.; funding acquisition, S.R. and U.Q. All authors have read and agreed to the published version of the manuscript.

Funding

The present work was financially supported as part of the project Demonstrationsnetzwerk Erbse-Bohne (DemoNetErBo) funded by the Federal Ministry of Food and Agriculture (BMEL), Germany and the Federal Office for Agriculture and Food (BLE), Germany, under grant no. 2815EPS035.

Data Availability Statement

The data presented in this study are available on request from the authors.

Acknowledgments

The authors want to thank all members of the Demonstrationsnetzwerk Erbse-Bohne, especially the farmers that provided the bean samples.

Conflicts of Interest

The authors declare no conflict of interest.

References

  1. Schlemmer, U.; Frølich, W.; Prieto, R.M.; Grases, F. Phytate in Foods and Significance for Humans: Food Sources, Intake, Processing, Bioavailability, Protective Role and Analysis. Mol. Nutr. Food Res. 2009, 53, S330–S375. [Google Scholar] [CrossRef] [PubMed]
  2. Griffiths, D.W.; Thomas, T.A. Phytate and Total Phosphorus Content of Field Beans (Vicia faba L.). J. Sci. Food Agric. 1981, 32, 187–192. [Google Scholar] [CrossRef]
  3. Steiner, T.; Mosenthin, R.; Zimmermann, B.; Greiner, R.; Roth, S. Distribution of Phytase Activity, Total Phosphorus and Phytate Phosphorus in Legume Seeds, Cereals and Cereal By-Products as Influenced by Harvest Year and Cultivar. Anim. Feed Sci. Technol. 2007, 133, 320–334. [Google Scholar] [CrossRef]
  4. Reddy, N.R.P.; Sathe, S.K.; Salunkhe, D.K. Occurrence, Distribution, Content and Dietary Intake of Phytate; CRC Press: Boca Raton, FL, USA, 2001. [Google Scholar]
  5. Rickard, S.E.; Thompson, L.U. Interactions and Biological Effects of Phytic Acid. In Antinutrients and Phytochemicals in Food; American Chemical Society: Chicago, IL, USA, 1997; Volume 662, pp. 294–312. [Google Scholar]
  6. Selle, P.H.; Ravindran, V.; Caldwell, A.; Bryden, W.L. Phytate and Phytase: Consequences for Protein Utilisation. Nutr. Res. Rev. 2000, 13, 255–278. [Google Scholar] [CrossRef] [Green Version]
  7. Humer, E.; Schwarz, C.; Schedle, K. Phytate in Pig and Poultry Nutrition. J. Anim. Physiol. Anim. Nutr. 2015, 99, 605–625. [Google Scholar] [CrossRef] [PubMed]
  8. Sheard, L.B.; Tan, X.; Mao, H.; Withers, J.; Ben-Nissan, G.; Hinds, T.R.; Kobayashi, Y.; Hsu, F.F.; Sharon, M.; Browse, J.; et al. Jasmonate Perception by Inositol-Phosphate-Potentiated COI1-JAZ Co-Receptor. Nature 2010, 468, 400–405. [Google Scholar] [CrossRef] [PubMed]
  9. Tan, X.; Calderon-Villalobos, L.I.; Sharon, M.; Zheng, C.; Robinson, C.V.; Estelle, M.; Zheng, N. Mechanism of Auxin Perception by the TIR1 Ubiquitin Ligase. Nature 2007, 446, 640–645. [Google Scholar] [CrossRef] [PubMed]
  10. Yang, L.; Tang, R.; Zhu, J.; Liu, H.; Mueller-Roeber, B.; Xia, H.; Zhang, H. Enhancement of Stress Tolerance in Transgenic Tobacco Plants Constitutively Expressing AtIpk2beta, an Inositol Polyphosphate 6-/3-kinase from Arabidopsis thaliana. Plant Mol. Biol. 2008, 66, 329–343. [Google Scholar] [CrossRef] [Green Version]
  11. Winter, C.K.; Davis, S.F. Organic Foods. J. Food Sci. 2006, 71, R117–R124. [Google Scholar] [CrossRef]
  12. Asami, D.K.; Hong, Y.-J.; Barrett, D.M.; Mitchell, A.E. Comparison of the Total Phenolic and Ascorbic Acid Content of Freeze-Dried and Air-Dried Marionberry, Strawberry, and Corn Grown Using Conventional, Organic, and Sustainable Agricultural Practices. J. Agric. Food Chem. 2003, 51, 1237–1241. [Google Scholar] [CrossRef] [PubMed]
  13. Caris-Veyrat, C.; Amiot, M.-J.; Tyssandier, V.; Grasselly, D.; Buret, M.; Mikolajczak, M.; Guilland, J.-C.; Bouteloup-Demange, C.; Borel, P. Influence of Organic versus Conventional Agricultural Practice on the Antioxidant Microconstituent Content of Tomatoes and Derived Purees; Consequences on Antioxidant Plasma Status in Humans. J. Agric. Food Chem. 2004, 52, 6503–6509. [Google Scholar] [CrossRef]
  14. Ren, H.; Endo, H.; Hayashi, T. Antioxidative and Antimutagenic Activities and Polyphenol Content of Pesticide-Free and Organically Cultivated Green Vegetables Using Water-Soluble Chitosan as a Soil Modifier and Leaf Surface Spray. J. Sci. Food Agric. 2001, 81, 1426–1432. [Google Scholar] [CrossRef]
  15. McKie, V.A.M.; Barry, V. A Novel and Rapid Colorimetric Method for Measuring Total Phosphorus and Phytic Acid in Foods and Animal Feeds. J. AOAC Int. 2016, 99, 738–743. [Google Scholar] [CrossRef] [PubMed] [Green Version]
  16. Greenwood, J.S.; Bewley, J.D. Subcellular Distribution of Phytin in the Endosperm of Developing Castor Bean: A Possibility for Its Synthesis in the Cytoplasm Prior to Deposition within Protein Bodies. Planta 1984, 160, 113–120. [Google Scholar] [CrossRef]
  17. Cominelli, E.; Pilu, R.; Sparvoli, F. Phytic Acid and Transporters: What Can We Learn from low phytic acid Mutants? Plants 2020, 9, 69. [Google Scholar] [CrossRef] [PubMed] [Green Version]
  18. Kumar, A.; Singh, B.; Raigond, P.; Sahu, C.; Mishra, U.N.; Sharma, S.; Lal, M.K. Phytic acid: Blessing in Disguise, a Prime Compound Required for Both Plant and Human Nutrition. Food Res. Int. 2021, 142, 110193. [Google Scholar] [CrossRef] [PubMed]
  19. Mitsuhashi, N.; Ohnishi, M.; Sekiguchi, Y.; Kwon, Y.-U.; Chang, Y.-T.; Chung, S.-K.; Inoue, Y.; Reid, R.J.; Yagisawa, H.; Mimura, T. Phytic Acid Synthesis and Vacuolar Accumulation in Suspension-Cultured Cells of Catharanthus roseus Induced by High Concentration of Inorganic Phosphate and Cations. Plant Physiol. 2005, 138, 1607–1614. [Google Scholar] [CrossRef] [Green Version]
  20. Raboy, V.; Dickinson, D.B. The Timing and Rate of Phytic Acid Accumulation in Developing Soybean Seeds 1. Plant Physiol. 1987, 85, 841–844. [Google Scholar] [CrossRef] [Green Version]
  21. Iwai, T.; Takahashi, M.; Oda, K.; Terada, Y.; Yoshida, K.T. Dynamic Changes in the Distribution of Minerals in Relation to Phytic Acid Accumulation during Rice Seed Development. Plant Physiol. 2012, 160, 2007–2014. [Google Scholar] [CrossRef] [Green Version]
  22. Bhati, K.K.; Aggarwal, S.; Sharma, S.; Mantri, S.; Singh, S.P.; Bhalla, S.; Kaur, J.; Tiwari, S.; Roy, J.K.; Tuli, R.; et al. Differential Expression of Structural Genes for the Late Phase of Phytic Acid Biosynthesis in Developing Seeds of Wheat (Triticum aestivum L.). Plant Sci. 2014, 224, 74–85. [Google Scholar] [CrossRef]
  23. Thitisaksakul, M.; Jiménez, R.C.; Arias, M.C.; Beckles, D.M. Effects of Environmental Factors on Cereal Starch Biosynthesis and Composition. J. Cereal Sci. 2012, 56, 67–80. [Google Scholar] [CrossRef]
  24. Bloot, A.P.M.; Kalschne, D.L.; Amaral, J.A.S.; Baraldi, I.J.; Canan, C. A Review of Phytic Acid Sources, Obtention, and Applications. Food Rev. Int. 2021. [Google Scholar] [CrossRef]
  25. Kumar, V.; Sinha, A.K.; Makkar, H.P.S.; Becker, K. Dietary Roles of Phytate and Phytase in Human Nutrition: A Review. Food Chem. 2010, 120, 945–959. [Google Scholar] [CrossRef]
  26. Peksen, E.; Bozoglu, H.; Peksen, A.; Gülümser, A. Determination of the Effects of Different Row Spacings on Yield and Some Other Properties of Pea (Pisum sativum L.) Cultivars Sown in Spring and Autumn. In Proceedings of the II Balkan Symposium on Vegetables and Potatoes, Thessaloniki, Greece, 11–15 October 2000; Volume 579, pp. 313–318. [Google Scholar]
  27. Walter, S.; Zehring, J.; Mink, K.; Quendt, U.; Zocher, K.; Rohn, S. Protein Content of Peas (Pisum sativum) and Beans (Vicia faba)—Influence of Cultivation Conditions. J. Food Compos. Anal. 2022, 105, 104257. [Google Scholar] [CrossRef]
  28. Neugschwandtner, R.W.; Böhm, K.; Hall, R.M.; Kaul, H.-P. Development, Growth, and Nitrogen Use of Autumn-and Spring-Sown Facultative Wheat. Acta Agric. Scand. 2015, 65, 6–13. [Google Scholar] [CrossRef]
  29. Gselman, A.; Kramberger, B. Benefits of Winter Legume Cover Crops Require Early Sowing. Aust. J. Agric. Res. 2008, 59, 1156–1163. [Google Scholar] [CrossRef]
  30. McCauley, A.M.; Jones, C.A.; Miller, P.R.; Burgess, M.H.; Zabinski, C.A. Nitrogen Fixation by Pea and Lentil Green Manures in a Semi-arid Agroecoregion: Effect of Planting and Termination Timing. Nutr. Cycl. Agroecosyst. 2012, 92, 305–314. [Google Scholar] [CrossRef]
  31. Mitchell, A.E.; Hong, Y.-J.; Koh, E.; Barrett, D.M.; Bryant, D.E.; Denison, R.F.; Kaffka, S. Ten-Year Comparison of the Influence of Organic and Conventional Crop Management Practices on the Content of Flavonoids in Tomatoes. J. Agric. Food Chem. 2007, 55, 6154–6159. [Google Scholar] [CrossRef]
  32. Reeve, J.R.; Hoagland, L.A.; Villalba, J.J.; Carr, P.M.; Atucha, A.; Cambardella, C.; Davis, D.R.; Delate, K. Organic Farming, Soil Health, and Food Quality: Considering Possible Links. Adv. Agron. 2016, 137, 319–367. [Google Scholar] [CrossRef]
  33. Huber, M.; van de Vijver, L.; Parmentier, H.; Savelkoul, H.; Coulier, L.; Wopereis, S.; Verheij, E.; van der Greef, J.; Nierop, D.; Hoogenboom, R.A.P. Effects of Organically and Conventionally Produced Feed on Biomarkers of Health in a Chicken Model. Br. J. Nutr. 2010, 103, 663–676. [Google Scholar] [CrossRef]
  34. Baranski, M.; Srednicka-Tober, D.; Volakakis, N.; Seal, C.; Sanderson, R.; Stewart, G.B.; Benbrook, C.; Biavati, B.; Markellou, E.; Giotic, C.; et al. Higher Antioxidant and Lower Cadmium Concentrations and Lower Incidence of Pesticide Residues in Organically Grown Crops: A Systematic Literature Review and Meta-Analyses. Br. J. Nutr. 2014, 112, 794–811. [Google Scholar] [CrossRef] [PubMed] [Green Version]
  35. Wittstock, U.; Gershenzon, J. Constitutive Plant Toxins and Their Role in Defense against Herbivores and Pathogens. Curr. Opin. Plant Biol. 2002, 5, 300–307. [Google Scholar] [CrossRef]
  36. Mohammadi, M. Effect of Phosphate and Zinc Biofertilizers on Seed Yield and Molar Ratio of Phytic Acid to Zinc in Two Cultivars of Bean (Phaseolus vulgaris L.). Int. J. Agric. Biosyst. Eng. 2017, 11, 66–71. [Google Scholar]
  37. Chinthapalli, B. A Comparative Study on the Effect of Organic and Inorganic Fertilizers on Agronomic Performance of Faba Bean (Vicia faba L.) and Pea (Pisum sativum L.). Agric. For. Fish. 2015, 4, 263–268. [Google Scholar] [CrossRef] [Green Version]
  38. Cucci, G.; Lacolla, G.; Summo, C.; Pasqualone, A. Effect of Organic and Mineral Fertilization on Faba Bean (Vicia faba L.). Sci. Hortic. 2019, 243, 338–343. [Google Scholar] [CrossRef]
  39. Herencia, J.F.; García-Galavís, P.A.; Dorado, J.A.R.; Maqueda, C. Comparison of Nutritional Quality of the Crops Grown in an Organic and Conventional Fertilized Soil. Sci. Hortic. 2011, 129, 882–888. [Google Scholar] [CrossRef]
  40. Janati, W.; Benmrid, B.; Elhaissoufi, W.; Zeroual, Y.; Nasielski, J.; Bargaz, A. Will Phosphate Bio-Solubilization Stimulate Biological Nitrogen Fixation in Grain Legumes? Front. Agron. 2021, 3, 637196. [Google Scholar] [CrossRef]
  41. Bryant, J.P.; Chapin, F.S., III; Klein, D.R. Carbon/Nutrient Balance of Boreal Plants in Relation to Vertebrate Herbivory. Oikos 1983, 40, 357–368. [Google Scholar] [CrossRef] [Green Version]
  42. Berger, J.; Siddique, K.; Loss, S. Cool Season Grain Legumes for Mediterranean Environments: Species× Environment Interaction in Seed Quality Traits and Anti-nutritional Factors in the Genus Vicia. Aust. J. Agric. Res. 1999, 50, 389–402. [Google Scholar] [CrossRef]
  43. Langenkamper, G.; Zorb, C.; Seifert, M.; Mader, P.; Fretzdorff, B.; Betsche, T. Nutritional Quality of Organic and Conventional Wheat. J. Appl. Bot. Food Qual. 2006, 80, 150. [Google Scholar]
  44. Madsen, C.K.; Brinch-Pedersen, H. Globoids and Phytase: The Mineral Storage and Release System in Seeds. Int. J. Mol. Sci. 2020, 21, 7519. [Google Scholar] [CrossRef] [PubMed]
  45. Bohn, L.; Meyer, A.S.; Rasmussen, S.K. Phytate: Impact on Environment and Human Nutrition. A Challenge for Molecular Breeding. J. Zhejiang Univ. Sci. B 2008, 9, 165–191. [Google Scholar] [CrossRef] [PubMed] [Green Version]
  46. Matsumoto, H.; Ito, K.; Yonekura, K.; Tsuda, T.; Ichiyanagi, T.; Hirayama, M.; Konishi, T. Enhanced Absorption of Anthocyanins after Oral Administration of Phytic Acid in Rats and Humans. J. Agric. Food Chem. 2007, 55, 2489–2496. [Google Scholar] [CrossRef] [PubMed]
  47. Xie, Y.; Luo, H.; Duan, J.; Hong, C.; Ma, P.; Li, G.; Zhang, T.; Wu, T.; Ji, G. Phytic Acid Enhances the Oral Absorption of Isorhamnetin, Quercetin, and Kaempferol in Total Flavones of Hippophae rhamnoides L. Fitoterapia 2014, 93, 216–225. [Google Scholar] [CrossRef]
  48. Zhai, H.; Wang, F.; Si, Z.; Huo, J.; Xing, L.; An, Y.; He, S.; Liu, Q. A myo-inositol-1-phosphate Synthase Gene, IbMIPS1, Enhances Salt and Drought Tolerance and Stem Nematode Resistance in Transgenic Sweet Potato. Plant Biotechnol. J. 2016, 14, 592–602. [Google Scholar] [CrossRef]
  49. Murphy, A.M.; Otto, B.; Brearley, C.A.; Carr, J.P.; Hanke, D.E. A Role for Inositol Hexakisphosphate in the Maintenance of Basal Resistance to Plant Pathogens. Plant J. 2008, 56, 638–652. [Google Scholar] [CrossRef]
  50. Sharma, S.; AnandKumar, L.H.D.; Tyagi, A.; Muthumilarasan, M.; Kumar, K.; Gaikwad, K. An Insight into Phytic Acid Biosynthesis and Its Reduction Strategies to Improve Mineral Bioavailability. Nucleus 2021. [Google Scholar] [CrossRef]
  51. Zhang, Z.; Liao, H.; Lucas, W.J. Molecular Mechanisms Underlying Phosphate Sensing, Signaling, and Adaptation in Plants. J. Integr. Plant Biol. 2014, 56, 192–220. [Google Scholar] [CrossRef]
  52. Luo, Y.; Qin, G.; Zhang, J.; Liang, Y.; Song, Y.; Zhao, M.; Tsuge, T.; Aoyama, T.; Liu, J.; Gu, H.; et al. D-myo-inositol-3-Phosphate Affects Phosphatidylinositol-Mediated Endomembrane Function in Arabidopsis and Is Essential for Auxin-Regulated Embryogenesis. Plant Cell 2011, 23, 1352–1372. [Google Scholar] [CrossRef] [Green Version]
  53. Silva, V.M.; Putti, F.F.; White, P.J.; Reis, A.R.D. Phytic Acid Accumulation in Plants: Biosynthesis Pathway Regulation and Role in Human Diet. Plant Physiol. Biochem. 2021, 164, 132–146. [Google Scholar] [CrossRef]
  54. Raboy, V. The ABCs of Low-Phytate Crops. Nat. Biotechnol. 2007, 25, 874–875. [Google Scholar] [CrossRef] [PubMed]
  55. Sparvoli, F.; Cominelli, E. Seed Biofortification and Phytic Acid Reduction: A Conflict of Interest for the Plant? Plants 2015, 4, 728–755. [Google Scholar] [CrossRef] [PubMed] [Green Version]
  56. Lee, H.S.; Lee, D.H.; Cho, H.K.; Kim, S.H.; Auh, J.H.; Pai, H.S. InsP6-Sensitive Variants of the Gle1 mRNA Export Factor Rescue Growth and Fertility Defects of the ipk1 Low-Phytic-Acid Mutation in AR-Abidopsis. Plant Cell 2015, 27, 417–431. [Google Scholar] [CrossRef] [PubMed] [Green Version]
  57. Redekar, N.R.; Biyashev, R.M.; Jensen, R.V.; Helm, R.F.; Grabau, E.A.; Maroof, M.A. Genome-Wide Transcriptome Analyses of Developing Seeds from Low and Normal Phytic Acid Soybean Lines. BMC Genomics 2015, 16, 1074. [Google Scholar] [CrossRef] [Green Version]
  58. Raboy, V. Approaches and Challenges to Engineering Seed Phytate and Total Phosphorus. Plant Sci. 2009, 177, 281–296. [Google Scholar] [CrossRef]
Figure 1. Distribution of phytic acid content (g/100 g) of all three years depending on cultivar; all cultivars significant at p < 0.01. t-test between lowest (Hiverna) and highest (Julia) PA mean values (×) significant at p < 0.01 (**). ° = outlier values.
Agronomy 12 00889 g001
Figure 2. Distribution of phytic acid content (g/100 g) per year; n2016 = 57; n2017 = 66; n2018 = 39; ntotal = 162; all not significant (p > 0.05). PA mean values (×), ° = outlier values.
Agronomy 12 00889 g002
Table 1. Phytic acid content (g/100 g) of all three years depending on cultivar; all cultivars significant at p < 0.01.
CultivarnMean ± SDMinMax
Bilbo101.21 ± 0.160.961.54
Birgit80.93 ± 0.230.711.36
Bioro51.30 ± 0.270.841.53
Boxer30.82 ± 0.170.640.98
Detpop11.24--
Espresso30.94 ± 0.130.791.02
Fanfare431.02 ± 0.170.551.35
Fuego450.99 ± 0.180.671.43
Gloria11.35--
Isabell10.97--
Hiverna10.80--
Julia31.37 ± 0.221.181.61
Scirocco20.91 ± 0.350.661.15
Taifun121.07 ± 0.230.721.45
Tangenta11.09--
Tiffany231.07 ± 0.250.611.54
total1621.04 ± 0.210.551.61
Table 2. Phytic acid content (g/100 g) per year; all not significant (p > 0.05).
Yearn (Samples)n (Cultivars)Mean ± SDMinMax
201657111.08 ± 0.200.761.61
201766121.00 ± 0.210.611.42
20183981.05 ± 0.240.551.54
total162161.04 ± 0.210.551.61
Table 3. Phytic acid content (g/100 g) of all three years, depending on cultivation type; both groups significant at p < 0.01 (*) compared to each other.
Cultivation SystemnMean ± SDMinMax
Conventional *1150.99 ± 0.190.551.45
Organic *471.16 ± 0.230.661.61
total1621.04 ± 0.210.551.61
Table 4. Phytic acid content (g/100 g) of all three years, depending on fungicide usage; both groups significant at p < 0.01 (*) compared to each other.
Fungicide UsagenMean ± SDMinMax
yes *750.96 ± 0.180.551.45
no *771.11 ± 0.220.631.61
total1521.04 ± 0.220.551.61
Table 5. Phytic acid content (g/100 g) of all three years, depending on insecticide usage; both groups significant at p < 0.01 (*) compared to each other.
Insecticide UsagenMean ± SDMinMax
yes *750.97 ± 0.190.551.45
no *831.11 ± 0.210.661.61
total1581.04 ± 0.210.551.61
Table 6. Analysis of variance (t-test) concerning bean samples, farming system (conventional (con) vs. organic (org)) and fungicide/insecticide usage (no/used) of all three cultivation years; cross-correlations marked (×).
No.Factor/Criteria ndfPA
(Mean Squares)
Significance (p)
1no fungicide × both farming systems (conv vs. org)7710.2730.018 *
2no insecticide x both farming systems (conv vs. org)8310.3030.009 **
3organic × fungicide0///
4organic × insecticide11(0.005)(0.754 ns)
5conventional × fungicide10510.0850.087 ns
6conventional × insecticide11110.0760.114 ns
ns, * and **, respectively: non-significant, significant in 5% and 1% area; value in parentheses no validation due to low sample size; slash means no samples with fitting criteria.
Publisher’s Note: MDPI stays neutral with regard to jurisdictional claims in published maps and institutional affiliations.

