Article

No-Tillage Promotes Wheat Seedling Growth and Grain Yield Compared with Plow–Rotary Tillage in a Rice–Wheat Rotation in the High Rainfall Region in China

1
Jiangsu Key Laboratory of Crop Genetics and Physiology, Jiangsu Key Laboratory of Crop Cultivation and Physiology, Agricultural College of Yangzhou University, Yangzhou 225009, China
2
Co-Innovation Center for Modern Production Technology of Grain Crops, Wheat Research Institute, Yangzhou University, Yangzhou 225009, China
*
Authors to whom correspondence should be addressed.
Agronomy 2022, 12(4), 865; https://doi.org/10.3390/agronomy12040865
Submission received: 26 January 2022 / Revised: 27 February 2022 / Accepted: 30 March 2022 / Published: 31 March 2022
(This article belongs to the Topic Plant-Soil Interactions)

Abstract

:
Optimizing soil properties to match ecological conditions can alleviate stress damage and promote crop growth. However, the suitable soil conditions for wheat growth in an integrated rice–wheat breeding scheme under high rainfall and the mechanisms that affect yield production are not well known. Field experiments were carried out at two sites, which were all located in Jiangsu Province, China, a subtropical monsoon climate zone during two wheat growing seasons, to assess the effects of plow tillage followed by rotary tillage (PR) and no-tillage (NT) on soil physical and chemical properties, wheat seedling growth, grain yield, and spike amounts and quality. The finding indicates that with the reduction in soil mixing, soil bulk density was higher in NT than in PR, which helped to maintain moisture in dry soil. In soils with high water content, in NT, when the wheat field was subjected to waterlogging stress, the drainage decreased to deeper soil possibly due to reduced infiltration and a higher evaporation of surface water. The diurnal variation in soil temperature decreased in NT, and when the soil was cold, NT helped to insulate soils at 0–25 cm. Compared with PR, the contents of available nitrogen and phosphorus increased at 0–20 cm in NT. Root biomass and root activity of wheat seedlings at 0–20 cm were also greater in NT than in PR. Compared with PR, wheat also had more culms at the beginning of the overwintering stage, more spikes, and higher grain yield in NT, but the differences were not significant under excessive soil moisture. Therefore, the soil hydrothermal environment and spatial distributions of nutrients in NT promoted shallow root growth and tiller development in the early phase of wheat growth, which led to higher amounts of spikes per plant that resulted in high-yielding wheat crops.

1. Introduction

The rice–wheat rotation system (RWRS) covers 24 to 26 million hectares in Asia, mainly in the Indo-Gangetic Plains in South Asia and South China, and is the largest agricultural production system worldwide [1,2]. The RWRS provides the primary source of energy to ensure the survival of local communities [3]. In China, the RWRS is used on 90% of the total arable land in the Yangtze River basin (YRB), including Jiangsu and Sichuan provinces, the southern parts of Anhui, and Henan provinces, and the northern part of Hubei Province [4].
In the RWRS, planting techniques and breeding schemes applied in the preceding rice season may affect the growth of subsequent wheat [5]. Soils are commonly saturated with water due to the prolonged period of growing rice under flooded conditions [6], and because of long-term soil puddling before rice transplanting, soils become stickier and heavier [1,7,8]. In addition, as rice yields have increased, the amounts of rice straw incorporated into soils have also increased and seriously affected wheat seedling emergence and growth [5]. Furthermore, following the harvest of rice, temperature and solar radiation decrease [9], and, as a result, it takes longer to reduce soil moisture [10]. However, the appropriate planting period for wheat is normally only two weeks after rice harvest, even though soil conditions may worsen with excessive precipitation or drought [11]. Thus, many factors can suppress wheat seedling growth.
Seedling growth has important effects on the later growth and yield of wheat. Root traits of young plants may regulate above-ground architecture and crops maturity to increase yields [12,13,14]. A higher tiller density in the early stages of winter wheat growth ensures the formation of sufficient spikes at maturity [4,15]. In addition, the accumulation of photosynthetic products in the early growth stages provides the foundation for nutrient uptake and utilization in the middle and late stages of wheat growth [16]. Therefore, good seedling growth helps to increase yield.
Seedling growth needs adequate terms of nutrient contents, temperature, etc. [17]. Plant seedlings have morpho-physiological responses to changes in soil microbial community structure caused by physical and chemical changes in soil properties [18,19,20]. Soil temperature and moisture also have significant effects on wheat growth, photosynthesis, and respiration [21,22]. The tillage method affects the form and amount of residue cover and also regulates important processes related to soil texture, including water distribution, gas composition, heat circulation, and nutrient availability [23,24,25]. The varying effects of tillage may explain why there are conflicting responses in seedling growth and yield.
Studies on changes in soil due to differences in tillage regime, soil, and crops have focused on dry or rain-fed areas, and the results suggest that soils under no-tillage (NT) have relatively high water retention capacity that is relatively stable in both wet and dry conditions [26,27]. In those areas, NT promotes crop nutrient uptake and growth because of insulation and increased water use capacity [28,29,30]. Studies in high soil moisture conditions also show that NT can improve wheat grain yield [31]. Moreover, elevated yields in NT are related to early plant vigor under different soil moisture conditions [4,32]. However, the way that soil properties under NT affect seedling growth in the RWRS in areas with high rainfall is unclear.
Sufficient rainfall amounts during the wheat growing season is uncertain in the middle and lower reaches of the YRB [33]. Winter crops usually suffer drought and waterlogging stress during the growing season, especially during seedling emergence and establishment [34,35]. Furthermore, wheat seedlings are mostly grown in environments with relatively high soil moisture, which is inappropriate for wheat growth [36,37]. Innovative sowing strategies in the SWRS could reduce waterlogging stress and improve the root morphology to bolster wheat seedling establishment, and stem and tiller development [11,38]. Therefore, how different types of tillage can improve wheat seedling growth in high-moisture soils deserves further exploration. In the present study, NT and plow tillage followed by rotary tillage (PR) were compared in two wheat growing seasons of an RWRS at two experimental sites in Jiangsu Province, China. The objectives of the study were the following: (1) to quantify the effects of tillage practices on soil physical and chemical properties, seedling growth at the beginning of the overwintering stage, and grain yield and its components, (2) to analyze seedling growth in different soil properties, and (3) to explore how effects on seedling growth affect grain yield.

2. Materials and Methods

2.1. Sites of Study

The experiment was conducted during the wheat growing seasons of 2017–2018 (2018) and 2018–2019 (2019) at the Modern Agricultural Science and Technology Integrated Demonstration Station in Jintan (31°39′ N, 119°28′ E) and Sihong (33°22′ N, 118°16′ E) in Jiangsu Province, China (Figure 1). Rice–wheat rotation is typical in the areas of both experimental sites. Jintan has a clay loam soil, and Sihong has a clay soil. Basic soil properties in 0–20 cm depth are shown in Figure S1 and Table S1.
Figure 2 shows the daily mean temperature and precipitation amounts during the two wheat growing seasons at both sites. At Jintan, in the 30 days before wheat seeding, the precipitation reached 30.8 mm in 2018 and 17.7 mm in 2019, resulting, respectively, in suitable soil moisture (relative soil water content was 74%) and low soil moisture (relative soil water content was 58.67%) during the tillage and sowing periods. At Sihong, in the 30 days before seeding, the precipitation was 46.3 mm in 2018 and 0.6 mm in 2019, resulting, respectively, in a high moisture soil (relative soil water content was 92.2%) and suitable soil moisture (relative soil water content was 78.5%) during the tillage and sowing periods.

2.2. Experimental Design

Rice was planted as the previous crop in the two experimental fields using long-term cultivation techniques such as puddling, transplanting, and flooding, and the full amount of straw was returned to the fields in the last decade. The annual amount of rice residue incorporated was 9.4 t ha−1 in Jintan and 8.2 t ha−1 in Sihong. Rice was harvested with a head-feeding type combine harvester with straw cutter and separating system, which crushed straw into 5-cm segments that were spread evenly. There was approximately 5 cm of rice stubble remaining above the ground.
Moldboard plow tillage followed by rotary tillage (PR) and no-tillage (NT) are two typical tillage practices in Jiangsu Province, and they were randomly distributed among plots as treatments, with three replicates of each. The individual plots were 600 m2 (20 m × 30 m). In the PR treatment, moldboard plowing was combined with two rotary tillage passes before planting. The depth of plow tillage was ~20 cm and that of rotary tillage was ~10 cm. Rice straw and stubble were evenly mixed into the soil in the PR tillage layer. In the NT treatment, rice residue was retained on the soil surface without any tillage. Wheat seeds were sown with a seeder (2BFGK-10(8)230 type, Taicang Xiangshi Agricultural Machinery Co., Ltd., Taicang, Jiangsu, China). The seeding machinery combined the functions of fertilization, surface stubble plowing (shallow inverse rotary tillage to ~5 cm), sowing in line at 18-cm row spacing, mulching seeds (with soil thrown by inverse rotary tillage), drainage ditching (20-cm depth and 20-cm width), and roll compaction. The bottom plow, rotary cultivator, and seeding machinery were pulled using 85-horsepower tractors. In both experimental sites wheat variety, amount of seed, planting density, and sowing and harvest date are shown in Table 1. High-yielding winter wheat varieties widely grown locally were used. The wheat seedlings were manually removed or transplanted at the three-leaf stage to achieve planting density. The time, types, and dosage of fertilizer are shown in Table S2. Fertilizers were applied manually to accurately control the quantity. Herbicides, pesticides, and fungicides were sprayed according to standard growing practices to avoid yield loss.

2.3. Measurements of Soil Properties

We determined the properties of the original soils using mixed five-point soil samples from the 0–20 cm soil layer. Soil physical and chemical properties were analyzed at three times in the wheat growing season: (1) between completion of tillage and before wheat was sown (0 days after tillage, 0 DAT), (2) the three-leaf stage of wheat growth (36 (2018) and 42 (2019) DAT at Jintan, and 42 (2018) and 36 (2019) DAT at Sihong), and (3) the overwintering of wheat (70 DAT at the two sites in 2018, and 83 and 87 DAT at Jintan and Sihong, respectively, in 2019).
The soil physical properties determined were bulk density (BD), relative soil water content (RWC), and temperature. To determine BD, RWC, and soil nutrients, a five-point sampling method was used to collect soil samples at 0–10 and 10–20-cm depths. The BD and field capacity was measured using undistributed soil samples collected in a 100-cm3 volume cylinder [39]. Gravimetric moisture was the weight difference after oven-drying soil [40]. The RWC was equal to 100 times the ratio of gravimetric moisture to field moisture capacity.
A set of mercury-in-glass and right-angle geothermometers were installed at 5, 10, 15, 20, and 25-cm depths at three points in each plot. Soil temperature was recorded every two hours for three consecutive days at the trifoliate stage and during the overwintering periods in 2019. The temperature was recorded between 8:00 and 18:00 in Jintan and between 6:00 and 18:00 in Sihong. Differences in measurement time were limited by site and by inconvenient transportation.
Soil temperature and nutrients were measured only in 2019. Before chemical analyses, soil samples were air-dried and passed through a 2-mm sieve. The methods used to determine total nitrogen content, available nitrogen, available phosphorus, available potassium, and soil organic matter were derived from Lu [41].

2.4. Measurements of the Seedling Shoot and Root Growth

To determine shoot and root growth, 20 plants in two rows were selected from each plot during the overwintering period. Roots in the 0–20 cm layer were dug out and washed free of soil. Shoot and root samples were collected separately. The number of culms per plant was counted. To determine the leaf area of individual plants in each tillage treatment, the area of leaves was measured using a leaf area meter (LI-3000, Li-Cor Inc., Lincoln, NE, USA). Root weight and biomass per plant were determined after first heating material at 105 °C for 1 h and then oven drying at 80°C to constant weight. After weighting, the dried aboveground samples were ground and mixed, and 0.25 g of dried sample powder was digested with H2SO4-H2O2. Nitrogen concentration was determined by the indophenol blue method [42]. Nitrogen accumulation was calculated on the basis of dry mass and N concentration. Fresh roots of five plants in each plot were randomly selected to measure seedling root activity using 2, 3, 5-triphenyl tetrazolium chloride (TTC) [43].

2.5. Measurements of Spikes per Plant and Single Spike and Grain Yields

Twenty plants were collected at maturity to determine the number of spikes per plant and the single spike yield. Plant samples in 6 rows of 1 m (1.08 m2) in each plot were randomly selected to measure grain yield at maturity. Grain moisture was measured with a grain Analyzer (Infratec™ 1241, Foss, Hillerod, Denmark). Grain yield was adjusted to 13% moisture.

2.6. Statistical Analysis

Data Processing System 15.10 (DPS, Hangzhou, China) was used for all statistical analyses. To analyze the effects of tillage type, soil layer, and their interaction on BD, RWC, and soil nutrients, a two-way split-plot (ANOVA) was used. In the split-plot, soil layer was the within-subjects factor and tillage type was the between-subjects factor. One-way ANOVA was used to analyze differences in soil temperature, seedling root and shoot growth, spikes per plant and single spike yield, and grain yield between tillage practices in each year and each site. The least significant difference (LSD) test was used to detect significant differences between treatments at p = 0.05.

3. Results

3.1. Physical Characteristics of the Soil

3.1.1. Soil Bulk Density

According to the split-plot ANOVA, soil bulk density (BD) was affected by tillage methods, soil layers and their interactions (Table S3). BD was lower in plow tillage followed by rotary tillage (PR) than in no-tillage (NT) at 0–20 cm. In addition, soil BD at 0–10 cm was significantly lower than that at 10–20 cm in PR (p < 0.05) except 0 DAT in Figure 3b, 42 DAT in Figure 3c, and 36 and 87 DAT in Figure 3d. In NT, the BD at 0–10 cm was also significantly lower than that at 10–20 cm under 70 DAT in Figure 3a, 42 and 83 DAT in Figure 3b, 0 and 70 DAT in Figure 3c (p < 0.05). The result of NT is possibly due to the surface soil (~5 cm) being agitated and loosened by the rotary tillage of the seeder. The differences in BD between tillage treatments and between layers were detected until the beginning of the overwintering stage.

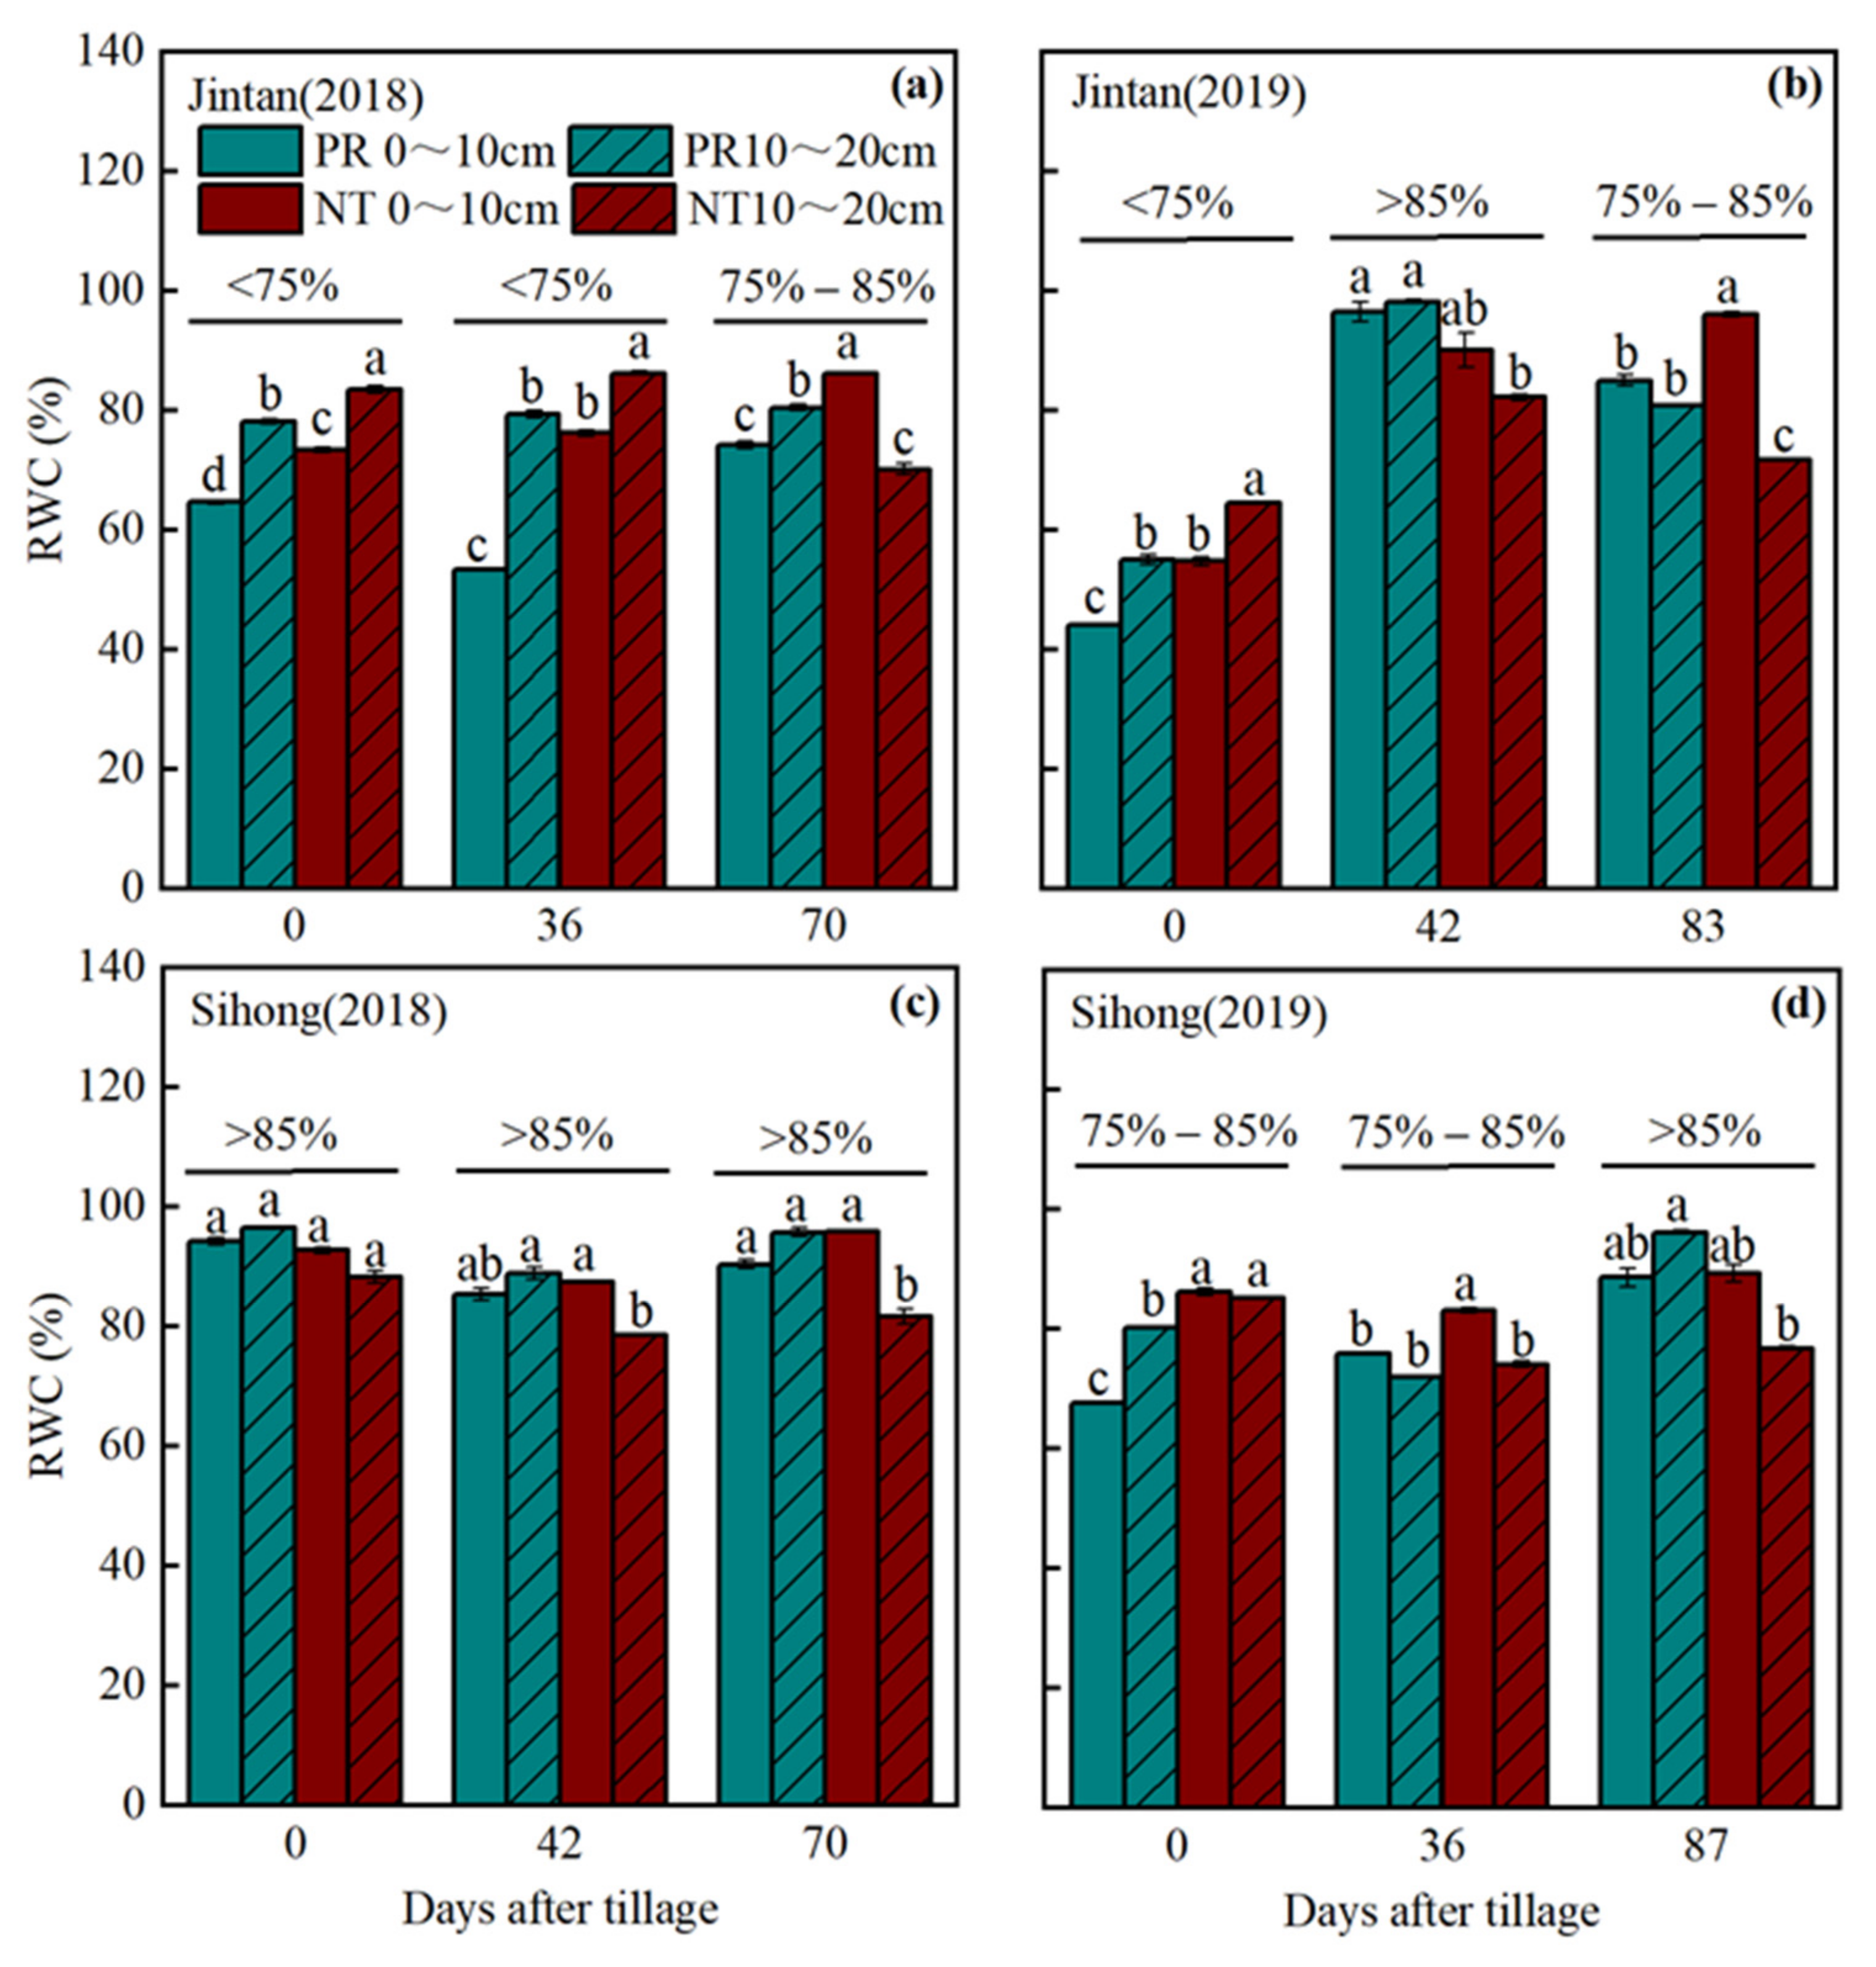
3.1.2. Soil Relative Water Content

According to the split-plot ANOVA, the interaction between tillage methods and soil layers significantly (p Jintan, 2018, 36 DAT = 0.001, p Jintan, 2018, 70 DAT = 0.004, p Jintan, 2019, 83 DAT = 0.004, p Sihong, 2018, 0 DAT = 0.017, p Sihong, 2018, 42 DAT < 0.001, p Sihong, 2018, 70 DAT = 0.009, p Sihong, 2019, 0 DAT = 0.004, p Sihong, 2019, 36 DAT = 0.002, p Sihong, 2019, 87 DAT = 0.007) affected soil relative water content (RWC) under most conditions (Table S3). In addition, soil RWC was different between-soil layers, but the differences depended on the soil moisture (Figure 4).
When the soil RWC (the average value of different treatments and soil layers) was less than 75% (0 and 36 DAT in Figure 4a and 0 DAT in Figure 4b), RWC was significantly higher (p < 0.05) under NT than under PR and also at 10–20 cm than at 0–10 cm.
When the soil RWC ranged from 75% to 85% (70 DAT in Figure 4a; 83 DAT in Figure 4b; 0 and 36 DAT in Figure 4d), RWC at 0–10 cm was significantly higher (p < 0.05) in NT than in PR, but the effects of tillage on RWC at 10–20 cm were likely dependent on soil type. In the clay soil at Sihong, RWC at 10–20 cm was higher in NT than in PR at 0 DAT and the two values are similar at 36 DAT. In the clay loam soil at Jintan, RWC at 10–20 cm was lower in NT than in PR. In PR, RWC at 10–20 cm was higher or similar to that at 0–10 cm, whereas in NT, RWC at 0–10 cm was higher or similar to that at 10–20 cm.
When the soil RWC was above 85% (42 DAT in Figure 4b; 0, 42, and 70 DAT in Figure 4c; 87 DAT in Figure 4d), there was little difference in RWC at 0–20 cm between the tillage practices. However, the differences between soil layers depended on tillage. In PR, RWC was similar between soil layers, but in NT, RWC at 10–20 cm was lower than that at 0–10 cm, with the exception of 0 DAT.
These results indicate that tillage practices affect soil RWC in dry or moist soil but have little effect in excessively moist soil. Furthermore, NT helps to maintain soil moisture in dry soil and to lower soil moisture in deep layers in high water-content soil.

3.1.3. Soil Temperature

The changes in temperature with soil depth were different depending on the site and the ambient temperature (Figure 5). In Jintan, soil temperature decreased from 5 to 10 cm but then generally increased from 10 to 25 cm (Figure 5a,b). In Sihong, when the soil was warm, soil temperature was higher at 5 cm than in deeper soil, with little change in temperature from 10 to 25 cm (Figure 5c). However, when the soil was cold in Sihong, soil temperature increased from 5 to 15 cm and then stabilized at 20 and 25-cm depths (Figure 5d).
Tillage significantly affected temperature in shallow soil (p Jintan, 42 DAT, 5cm = 0.015, p Jintan, 42 DAT, 10cm = 0.010, p Jintan, 42 DAT, 15cm = 0.010, p Jintan, 42 DAT, 20cm = 0.047, p Jintan, 83 DAT, 5cm = 0.017, p Jintan, 83 DAT, 10cm = 0.022, p Jintan, 83 DAT, 15cm = 0.010, p Jintan, 83 DAT, 20cm = 0.004, p Sihong, 36 DAT, 5cm = 0.010, p Sihong, 36 DAT, 10cm = 0.001, p Sihong, 36 DAT, 15cm = 0.038, p Sihong, 87 DAT, 5cm = 0.038, p Sihong, 87 DAT, 10cm = 0.001, p Sihong, 87 DAT, 15cm = 0.022), but effects depended on soil depth and temperature conditions (Table S4). When the soil was warm at both sites (Figure 5a,c), the surface soil temperatures were significantly higher (p < 0.05) in PR than in NT (5 and 10-cm depths on 42 DAT in Jintan and the 5-cm depth on 36 DAT in Sihong). By contrast, when the soil was cold at both sites (Figure 5b,d), the surface soils were significantly warmer (p < 0.05) in NT than in PR. In addition, temperatures were also higher in NT at 15–25 cm.
The diurnal variation in soil temperature was generally different between PR and NT (Table S5, Figure S2). However, temperatures increased and then tended to decrease in both treatments over the diurnal period. The magnitude of the daily variation in soil temperature gradually decreased with the soil depth. The highest temperatures occurred at 12:00 or 14:00 at 5 cm but occurred later at 14:00 or 16:00 at 15 and 25-cm.
Soil temperatures at 5 cm were significantly higher (p < 0.05) in PR than in NT from 12:00 to 16:00 (Figure S2a,g,j), except on 83 DAT in Jintan (Figure S2d). However, early in the day, the soil temperature in NT was higher than or similar to that in PR, except on 42 DAT in Jintan. At 15 and 25 cm, soil temperatures were higher, in some cases significantly higher (p < 0.05), in NT than in PR. Therefore, there was less daily variation in soil temperatures, and soil surface temperatures were lower in NT than in PR.

3.2. Chemical Characteristics of Soil

According to the split-plot ANOVA, the available nitrogen and available phosphorus contents at 0–20 cm were significantly higher (p Jintan, Available nitrogen = 0.001, p Jintan, Available phosphorus = 0.032, p Sihong, Available nitrogen = 0.016) in NT than in PR, with the exception of available nitrogen in Jintan at 0–10cm (Figure 6a,b, Table S6). The available potassium and soil organic matter contents were less affected by tillage (Figure 6c,d, Table S6). The tillage method greatly affected the vertical distribution of soil nutrients. In PR, because of the mixing of soil and fertilizers, there was little difference in nutrient contents between depths. However, in NT, nutrient contents were significantly higher (p < 0.05) at 0–10 cm than at 10–20 cm, except for soil organic matter at Sihong. Thus, compared with PR, soil nutrient contents were higher at 0–10 cm in NT, while minor or no differences were observed between 10–20 cm.

3.3. Seedling Growth and Grain Yield

3.3.1. Root Biomass and Root Activity

In Jintan, wheat seedling root biomass (Figure 7a,b) and root activity (Figure 7c,d) were significantly higher (p Jintan, 2018, root biomass = 0.011, p Jintan, 2019, root biomass = 0.032, p Jintan, 2018, root activity = 0.004, p Jintan, 2019, root activity = 0.047) in NT than in PR in both 2018 and 2019 (Table S7). However, in Sihong, tillage practice did not significantly (p Sihong, 2018, root biomass = 0.101, p Sihong, 2018, root activity = 0.077) affect root biomass or activity in 2018 (Table S7), likely because of excessive soil moisture during most of the seedling growth period. In 2019, in Sihong, root biomass but not root activity was significantly higher (p Sihong, 2019, root biomass = 0.001, p Sihong, 2019, root activity = 0.051) in NT than in PR (Table S7).

3.3.2. Culm Number, Leaf Area, Shoot Biomass, and Shoot Nitrogen Accumulation per Plant

The culm number per wheat seedling was significantly higher (p Jintan, 2018, culm number = 0.043, p Jintan, 2019, culm number = 0.034, p Sihong, 2019, culm number = 0.026) in NT than in PR in Jintan in 2018 and 2019 and Sihong in 2019 (Figure 7e,f, Table S7). In 2018, tillage practice did not significantly (p Jintan, 2018, leaf area = 0.249, p Jintan, 2018, shoot biomass = 0.295, p Jintan, 2018, shoot nitrogen accumulation = 0.410, p Sihong, 2018, leaf area = 0.132, p Sihong, 2018, shoot biomass = 0.210, p Sihong, 2018, shoot nitrogen accumulation = 0.219) affect leaf area (Figure 7g), shoot biomass (Figure 7i), or shoot nitrogen accumulation (Figure 7k) at either site (Table S7). However, in 2019, the leaf area (Figure 7h), shoot biomass (Figure 7j), and shoot nitrogen accumulation (Figure 7l) were significantly higher (p Jintan, 2019, leaf area = 0.0.05, p Jintan, 2019, shoot biomass = 0.045, p Jintan, 2019, shoot nitrogen accumulation = 0.028, p Sihong, 2019, leaf area = 0.022, p Sihong, 2019, shoot biomass = 0.022, p Sihong, 2019, shoot nitrogen accumulation = 0.007) in NT than in PR at both sites (Table S7).

3.3.3. Spikes per Plant, Single Spike Yield, and Grain Yield

Spikes per plant were significantly higher (p Jintan, 2018, spikes per plant = 0.042, p Jintan, 2019, spikes per plant = 0.016, p Sihong, 2018, spikes per plant = 0.015, p Sihong, 2019, spikes per plant = 0.012) in NT than in PR at both sites in both years (Figure 8a,b, Table S7). Although the single spike yield was lower in NT than in PR at both sites in both years, the differences were not significant (p Jintan, 2018, single spike yield = 0.208, p Jintan, 2019, single spike yield = 0.597, p Sihong, 2018, single spike yield = 0.112, p Sihong, 2019, single spike yield = 0.105) (Figure 8c,d, Table S7). Because of the higher number of spikes, grain yield was significantly higher (p Jintan, 2019, grain yield = 0.022, p Sihong, 2018, grain yield = 0.001, p Sihong, 2019, grain yield < 0.001) in NT than in PR, except in Jintan in 2018 when grain yields were similar (p Jintan, 2018, grain yield = 0.175) (Figure 8e,f, Table S7).

4. Discussion

The studies on crop response to tillage have mostly focused on low or suitable soil moisture conditions [23,24,29]. It was confirmed that no-tillage (NT) is helpful to maintain soil porosity and promote water, nutrient, and heat cycling, which in turn increases crop yield [25,44,45]. The present study was conducted in a high rainfall region. The results indicated that compared to plow tillage followed by rotary tillage (PR), NT maintained higher soil bulk density (BD); however, the temperature of cold soil and the surface soil nutrients are both higher. These improvements in the soil environment are beneficial for seedling growth and yield improvement.

4.1. No-Tillage Buffering the Changes of Soil Hydrothermal Environment and Facilitating Wheat Seedling Root Growth

In this study, soil BD was significantly higher (p < 0.05) in NT than in PR (Figure 3, Table S3). Tillage reduces soil BD because it destroys the original structure of the cultivated layer [5]. Large amounts of crop residues mixed in shallow soil also decrease contact between roots and soil [46]. By contrast, in NT, straw and soil are spatially segregated, which expands the amount of soil available for wheat root growth and reduced the negative effects of microbial decomposition of straw on wheat roots [11,47].
Conservation tillage, such as minimum tillage and NT combined with straw mulch, is considered an appropriate practice in dryland conditions [48,49]. Soil disturbance is minimized with conservation tillage, and, because soil water infiltration decrease and water retention increase, wheat root growth is promoted, which contributes to sustainable crop production [44,50,51]. Although the current experiment was conducted in a high-rainfall region, when the soil was dry (relative water content <75%, RWC <75%), soil water at 0–20 cm was also higher in NT than in PR. In addition, when in a suitable range (75% < RWC < 85%), soil moisture at 0–10 cm was higher in NT than in PR, but the difference at 10–20 cm may depend on the soil type. According to previous studies [27,46,52,53], straw mulch on the soil surface increases water retention capacity because the original soil structure and thus the continuity of the soil macropores are maintained. By contrast, tillage causes soil water rapid evaporation because soil structure is disrupted [54,55]. However, when the soil was wet (RWC >85%) in this study, soil moisture at 0–10 cm was similar between NT and PR, whereas at 10–20 cm it was generally lower in NT. Notably, in NT, the water content at 0–10 cm was higher than that at 10–20 cm, possibly because there was less water infiltration as a result of the higher surface soil BD. This indicates that water is retained less in the NT soil compared with PR under high rainfall conditions, implying rapid surface drainage in the low-disturbance soil. According to Lipiec et al. [56], tilled soil has poor drainage rates because much of the water is adsorbed in large flow-active pores. These results suggest that waterlogging stress and the associated hypoxia, which constrain root and shoot growth, are more likely to occur under tillage than under NT.
The dynamics of soil temperature are highly affected by air temperature and soil moisture. From sowing to overwintering stages during wheat seasons, the air temperature is decreasing, as well as the soil temperature. In this study, tillage treatment greatly affected soil temperature, but the effect depended on ambient temperature. When it was warm (Figure 5a,c and Figure S2a,d,g,j), surface soil temperatures were higher in PR than in NT. This result could be explained because the loose soil resulting from tillage is easily heated and because straw incorporation in tilled soil facilitates surface warming at relatively high temperatures [57,58]. Notably, subsoil temperatures were lower in PR than in NT, indicating that heat was not transferred to the subsoil. By contrast, when it was cold, subsoil temperatures were higher in NT than in PR. A similar result was obtained by Abu-Hamdeh et al. [59], who concluded that thermal conductivity and subsoil temperatures increase in NT because of improved soil porosity and compaction. In addition, soil water has a moderating effect on soil temperature [22,60]. The soil-specific heat capacity would increase with the increased soil moisture, and the soil temperature with high soil moisture would decrease slowly than the soil temperature with low soil moisture [25,61]. In this study, the high moisture in shallow soil in NT might act as a buffer, resulting in more moderate intersoil and daily variation in soil temperatures.

4.2. No-Tillage Promoting Seedling Growth by Synergizing Nutrient Supply with Rhizogenesis

Available nitrogen, phosphorus, potassium, and soil organic matter content at 0–10 cm were higher in NT than in PR (Figure 6). In PR, large amounts of straw were uniformly distributed in the plow horizon, which increased straw and soil contact. High levels of straw-derived carbon can greatly stimulate soil microbial growth, and because of nitrogen immobilization in soil microorganisms, intense competition for nitrogen can develop between wheat roots and microorganisms [62]. By contrast, the addition of crop residues to the soil surface and minimization of soil disturbance increases the soil carbon to nitrogen ratio, which ensures the accumulation and utilization of total organic carbon and available nitrogen, phosphorus, and potassium [63]. In this study, nutrients were also enriched in shallow surface soil in NT compared with PR, whereas in PR, nutrients were distributed evenly from 0 to 20 cm. The basic fertilizers were applied before tillage in the experiment, and, thus, in the relatively undisturbed soil of NT, fertilizers were enriched in the surface layer. Nutrients were also higher in surface soil than in deeper layers after rice harvest [64,65]. By contrast, because tillage disrupts soil structure, the soil specific surface area increases, and the dispersion path shortens, which facilitates the leaching of nitrate-nitrogen throughout the soil profile with the infiltration of water [66]. Therefore, a moderately compact soil structure reduces nutrient infiltration and loss due to water infiltration, and the remaining relatively high concentrations of nutrients in shallow soil [45] can be effectively used by root systems, especially in high rainfall regions.
In the present study, wheat root biomass and root activity at 0–20 cm were higher in NT than in PR (Figure 7a–d). Although root growth was not measured in the subsoil in this study because roots were difficult to sample in the hard soil, previous studies found that high mechanical resistance to root growth due to high soil bulk density in NT results in roots with a shallow distribution [67,68]. As a result of the compact soil structure, the soil water content was higher in surface soil under dry and suitable conditions in NT than in PR and could meet the water demand to maintain wheat growth. When soil moisture was high, rapid drainage in NT created a favorable vapor requirement for root growth and avoided the potential threat of waterlogging. High root biomass and activity are also important traits to improve the waterlogging tolerance of plants [69,70]. In this study, NT also increased insulation at low temperatures and produced a less variable soil thermal environment. Soil warming can increase soil enzyme and microbial activities and stimulate the physiological metabolism of root systems [71,72]. Moreover, the similar spatial distributions of wheat roots and soil nutrients in the NT surface soil likely increased nutrient uptake by roots. Therefore, in NT, the growth and physiology of the root system were promoted in surface soil, which could help to mitigate the waterlogging damage to wheat in high-rainfall regions.
Furthermore, high root biomass and root vigor synergize the nutrient supply with rhizogenesis and facilitate nutrient uptake and translocation to the aboveground, thereby promoting shoot growth [73,74]. In the present study, compared with PR, NT promoted the early and fast growth of wheat tillers and leaves and increased the accumulation of photosynthetic products at the two sites in 2019, likely because of greater shoot nitrogen accumulation resulting from the vigorous roots (Figure 7). However, in 2018 at both sites, tillage practice did not significantly affect leaf area, shoot biomass, or shoot nitrogen accumulation (Figure 7, Table S7). The most likely explanation for this result was high precipitation during pre-sowing and seedling stages that resulted in a long wet period with associated waterlogging damage. The potential hypoxia stress caused by high soil moisture can inhibit seedling growth and offset differences between tillage treatments [70]. Notably, the possibility of waterlogging stress was slight in Jintan, and, as a result, there was greater root biomass and activity and a higher culms number in NT than in PR. The difference in soil texture between the two sites might explain the differences in tillage effects. The clay loam soil in Jintan had better water permeability than the clay soil in Sihong. Thus, in NT, a relatively suitable soil environment was created that promoted seedling growth in a high-rainfall region, but the effects of NT depended on soil texture and level of soil moisture.

4.3. Robust Seedlings Boosting Grain Yield

Vigorous seedling establishment and rapid stem and tiller development encourage subsequent vegetative growth [12,13,75,76]. In this study, the high grain yield in NT was mainly attributable to a large increase in the number of spikes. The number of spikes produced increases with rapid stem and tiller development early in wheat establishment [38]. Ding et al. [4] found that a synergistic increase in spike number and weight per spike increases yield in NT. In this study, because of the strong tiller capacity in the early stage of wheat growth in NT, the subsequent increase in spike number, without reduction in yield per spike, resulted in a higher yield in NT than in PR. More generally, the results of this study indicate that improving seedling quality can increase yields. The present study reveals the effects of no-tillage on soil physical and chemical properties, seedling growth, and grain yield, and their relationships, but the mechanisms of seedling growth affecting the dynamic developments of morphology and physiology of wheat crops still need to be uncovered.

5. Conclusions

Compared with plow tillage followed by rotary tillage, the undisturbed soil in no-tillage provided an improved physical and chemical condition, including the coordinated ability of drainage in wet and water retention in dry, the insulation and decreased diurnal variation in soil temperatures in cold, and the rich nutrient content in the top layer. Therefore, the no-tillage soil hydrothermal and nutrient environment might have contributed to a larger and more active surface root system, and, by increasing seedling vigor and producing more early tillers in particular, the number of spikes and yield increased. The results of this study demonstrate that the no-tillage soil environment effectively promotes seedling growth and improves crop yield, suggesting that changes in tilling practices can improve wheat cropping strategies in the rice–wheat rotation system in regions with high rainfall.

Supplementary Materials

The following supporting information can be downloaded at: https://www.mdpi.com/article/10.3390/agronomy12040865/s1, Table S1: Basic soil chemical properties before the wheat seeding of 2017–2018 and 2018–2019 at Jintan and Sihong; Table S2: The time, types, and dosage of fertilizer application; Table S3: ANOVA of tillage methods on soil bulk density and relative water content (RWC) in two soil layers at different days after tillage at Jintan and Sihong in 2017–2018 (2018) and 2018–2019 (2019); Table S4: ANOVA of tillage methods on soil temperature in different depth soil at the 42nd and 83rd day after tillage at Jintan and the 36th and 87th day after tillage at Sihong in 2018–2019 (2019); Table S5: ANOVA of tillage methods on 5, 15, and 25 cm depth soil temperature temporal variation during the day time at the 42nd and 83rd day after tillage at Jintan and the 36th and 87th day after tillage at Sihong in 2018–2019 (2019); Table S6: ANOVA of tillage methods on the content of available nitrogen, available phosphorus, available potassium, and soil organic matter in two soil layers at Jintan and Sihong in 2018–2019; Table S7: ANOVA of tillage methods on seedling growth and grain yield at Jintan and Sihong in 2017–2018 (2018) and 2018–2019 (2019); Figure S1: Particle size distribution, field capacity of original soil at Jintan and Sihong; Figure S2: Temporal variation of 5, 15, and 25 cm depth soil temperature in the PR and NT during the day time at the 42nd (a, b, and c) and 83rd (d, e, and f) day after tillage at Jintan and the 36th (g, h, and i) and 87th (j, k, and l) day after tillage at Sihong in 2018–2019.

Author Contributions

Conceptualization, F.L., J.D., W.G., M.Z., C.L. and X.Z. (Xinkai Zhu); Investigation, F.L., X.Z. (Xinbo Zhang), D.X., Q.M. and T.L.; Writing—original draft preparation, F.L.; Writing—review and editing, J.D. and W.G.; Supervision & Project administration, J.D. and W.G. All authors have read and agreed to the published version of the manuscript.

Funding

This work was supported by the National Natural Science Foundation of China (32172111; 32071953); the National Key Research and Development Program of China, (2016YFD0300405); and the Priority Academic Program Development of Jiangsu Higher Education Institutions.

Institutional Review Board Statement

Not applicable.

Informed Consent Statement

Not applicable.

Data Availability Statement

Not applicable.

Conflicts of Interest

The authors declare no conflict of interest.

References

  1. Ladha, J.K.; Dawe, D.; Pathak, H.; Padre, A.T.; Yadav, R.L.; Singh, B.; Singh Yadvinder; Singh, Y.; Kundu, A.L.; Sakal, R.; et al. How extensive are yield declines in long-term rice–wheat experiments in Asia? Field Crops Res. 2003, 81, 159–180. [Google Scholar] [CrossRef]
  2. Mahajan, A.; Gupta, R.D. The rice–wheat cropping system. In Integrated Nutrient Management (INM) in a Sustainable Rice-Wheat Cropping System; Mahajan, A., Gupta, R.D., Eds.; Springer-Verlag Press: Dordrecht, The Netherlands, 2009; pp. 109–117. [Google Scholar]
  3. Chauhan, B.S.; Mahajan, G.; Sardana, V.; Timsina, J.; Jat, M.L. Chapter six—Productivity and sustainability of the rice–wheat cropping system in the Indo-Gangetic plains of the Indian subcontinent: Problems, opportunities, and strategies. In Advances in Agronomy; Sparks, D.L.B.T.-A., Ed.; Academic Press: Philadelphia, PA, USA, 2012; pp. 315–369. [Google Scholar] [CrossRef]
  4. Ding, J.; Li, F.; Xu, D.; Wu, P.; Zhu, M.; Li, C.; Zhu, X.; Chen, Y.; Guo, W. Tillage and nitrogen managements increased wheat yield through promoting vigor growth and production of tillers. Agron. J. 2021, 113, 1–13. [Google Scholar] [CrossRef]
  5. Bhatt, R.; Kukal, S.S.; Busari, M.A.; Arora, S.; Yadav, M. Sustainability issues on rice–wheat cropping system. Int. Soil Water Conserv. Res. 2016, 4, 64–74. [Google Scholar] [CrossRef] [Green Version]
  6. McDonald, A.J.; Riha, S.J.; Duxbury, J.M.; Steenhuis, T.S.; Lauren, J.G. Soil physical responses to novel rice cultural practices in the rice–wheat system: Comparative evidence from a swelling soil in Nepal. Soil Tillage Res. 2006, 86, 163–175. [Google Scholar] [CrossRef]
  7. Aggarwal, G.C.; Sidhu, A.S.; Sekhon, N.K.; Sandhu, K.S.; Sur, H.S. Puddling and N management effects on crop response in a rice-wheat cropping system. Soil Tillage Res. 1995, 36, 129–139. [Google Scholar] [CrossRef]
  8. Gathala, M.K.; Ladha, J.K.; Saharawat, Y.S.; Kumar, V.; Kumar, V.; Sharma, P.K. Effect of Tillage and crop establishment methods on physical properties of a medium-textured soil under a seven-year rice−wheat rotation. Soil Sci. Soc. Am. J. 2011, 75, 1851–1862. [Google Scholar] [CrossRef]
  9. Naveen, G.; Eberbach, P.L.; Humphreys, E.; Balwinder, S.; Sudhir, Y.; Kukal, S.S. Estimating soil evaporation in dry seeded rice and wheat crops after wetting events. Agric. Water Manag. 2019, 217, 98–106. [Google Scholar] [CrossRef]
  10. Mahmood, R.; Hubbard, K.G. Assessing bias in evapotranspiration and soil moisture estimates due to the use of modeled solar radiation and dew point temperature data. Agric. For. Meteorol. 2005, 130, 71–84. [Google Scholar] [CrossRef]
  11. Yang, H.; Zhai, S.; Li, Y.; Zhou, J.; He, R.; Liu, J.; Xue, Y.; Meng, Y. Waterlogging reduction and wheat yield increase through long-term ditch-buried straw return in a rice–wheat rotation system. Field Crops Res. 2017, 209, 189–197. [Google Scholar] [CrossRef]
  12. Liu, X.; Li, R.; Chang, X.; Jing, R. Mapping QTLs for seedling root traits in a doubled haploid wheat population under different water regimes. Euphytica 2013, 189, 51–66. [Google Scholar] [CrossRef]
  13. Ge, Y.; Hawkesford, M.J.; Rosolem, C.A.; Mooney, S.J.; Ashton, R.W.; Evans, J.; Whalley, W.R. Multiple abiotic stress, nitrate availability and the growth of wheat. Soil Tillage Res. 2019, 191, 171–184. [Google Scholar] [CrossRef] [PubMed]
  14. Vijaya, V.B.; Baresel, J.P.; Weedon, O.; Finckh, M.R. Effects of ten years organic and conventional farming on early seedling traits of evolving winter wheat composite cross populations. Sci. Rep. 2019, 9, 1–12. [Google Scholar] [CrossRef]
  15. Bian, C.; Ma, C.; Liu, X.; Gao, C.; Liu, Q.; Yan, Z.; Ren, Y.; Li, Q. Responses of winter wheat yield and water use efficiency to irrigation frequency and planting pattern. PLoS ONE 2016, 11, 1–13. [Google Scholar] [CrossRef] [PubMed] [Green Version]
  16. Guo, J.; Jia, Y.; Chen, H.; Zhang, L.; Yang, J.; Zhang, J.; Hu, X.; Ye, X.; Li, Y.; Zhou, Y. Growth, photosynthesis, and nutrient uptake in wheat are affected by differences in nitrogen levels and forms and potassium supply. Sci. Rep. 2019, 9, 1248. [Google Scholar] [CrossRef] [Green Version]
  17. Lehmann, A.; Zheng, W.; Rillig, M.C. Soil biota contributions to soil aggregation. Nat. Ecol. Evol. 2017, 1, 1828–1835. [Google Scholar] [CrossRef]
  18. Aman, M.S.; Jafari, M.; Reihan, M.K.; Motesharezadeh, B.; Zare, S. Assessing the effect of industrial wastewater on soil properties and physiological and nutritional responses of Robinia pseudoacacia, Cercis siliquastrum, and Caesalpinia gilliesii seedlings. J. Environ. Manag. 2018, 217, 718–726. [Google Scholar] [CrossRef] [Green Version]
  19. Hu, D.; Zhang, S.; Baskin, J.M.; Baskin, C.C.; Wang, Z.; Liu, R.; Du, J.; Yang, X.; Huang, Z. Seed mucilage interacts with soil microbial community and physiochemical processes to affect seedling emergence on desert sand dunes. Plant Cell Environ. 2019, 42, 591–605. [Google Scholar] [CrossRef]
  20. Zhao, R.; Wu, J.; Jiang, C.; Liu, F. Effects of biochar particle size and concomitant nitrogen fertilization on soil microbial community structure during the maize seedling stage. Environ. Sci. Pollut. Res. 2020, 27, 13095–13104. [Google Scholar] [CrossRef]
  21. Kuroyanagi, T.; Paulsen, G.M. Mediation of high-temperature injury by roots and shoots during reproductive growth of wheat. Plant Cell Environ. 1988, 11, 517–523. [Google Scholar] [CrossRef]
  22. Pramanik, P.; Chakrabarti, B.; Bhatia, A.; Singh, S.D.; Maity, A.; Aggarwal, P.; Krishnan, P. Effect of elevated temperature on soil hydrothermal regimes and growth of wheat crop. Environ. Monit. Assess. 2018, 190, 217. [Google Scholar] [CrossRef]
  23. Xue, J.F.; Ren, A.X.; Li, H.; Gao, Z.Q.; Du, T.Q. Soil physical properties response to tillage practices during summer fallow of dryland winter wheat field on the Loess Plateau. Environ. Sci. Pollut. Res. 2018, 25, 1070–1078. [Google Scholar] [CrossRef] [PubMed]
  24. Kraut-Cohen, J.; Zolti, A.; Shaltiel-Harpaz, L.; Argaman, E.; Rabinovich, R.; Green, S.J.; Minz, D. Effects of tillage practices on soil microbiome and agricultural parameters. Sci. Total Environ. 2020, 705, 135791. [Google Scholar] [CrossRef] [PubMed]
  25. Du, K.; Li, F.; Qiao, Y.; Leng, P.; Li, Z.; Ge, J.; Yang, G. Influence of no-tillage and precipitation pulse on continuous soil respiration of summer maize affected by soil water in the North China Plain. Sci. Total Environ. 2021, 766, 144384. [Google Scholar] [CrossRef]
  26. Gao, W.; Whalley, W.R.; Tian, Z.; Liu, J.; Ren, T. A simple model to predict soil penetrometer resistance as a function of density, drying and depth in the field. Soil Tillage Res. 2016, 155, 190–198. [Google Scholar] [CrossRef]
  27. Huang, X.; Wang, H.; Zhang, M.; Horn, R.; Ren, T. Soil water retention dynamics in a Mollisol during a maize growing season under contrasting tillage systems. Soil Tillage Res. 2021, 209, 104953. [Google Scholar] [CrossRef]
  28. Ren, Y.; Gao, C.; Han, H.; Li, Q. Response of water use efficiency and carbon emission to no-tillage and winter wheat genotypes in the North China Plain. Sci. Total Environ. 2018, 635, 1102–1109. [Google Scholar] [CrossRef]
  29. Kan, Z.R.; Liu, Q.Y.; He, C.; Jing, Z.H.; Virk, A.L.; Qi, J.Y.; Zhao, X.; Zhang, H.L. Responses of grain yield and water use efficiency of winter wheat to tillage in the North China Plain. Field Crops Res. 2020, 249, 107760. [Google Scholar] [CrossRef]
  30. Yin, W.; Chai, Q.; Guo, Y.; Fan, H.; Fan, Z.; Hu, F.; Zhao, C.; Yu, A.; Coulter, J.A. No Tillage with plastic re-mulching maintains high maize productivity via regulating hydrothermal effects in an arid region. Front. Plant Sci. 2021, 12, 649684. [Google Scholar] [CrossRef]
  31. Ding, J.; Li, F.; Le, T.; Xu, D.; Zhu, M.; Li, C.; Zhu, X.; Guo, W. Tillage and seeding strategies for wheat optimizing production in harvested rice fields with high soil moisture. Sci. Rep. 2021, 11, 1–12. [Google Scholar] [CrossRef]
  32. Yang, H.; Xu, M.; Li, Y.; Xu, C.; Zhai, S.; Liu, J. The impacts of ditch-buried straw layers on the interface soil physicochemical and microbial properties in a rice-wheat rotation system. Soil Tillage Res. 2020, 202, 104656. [Google Scholar] [CrossRef]
  33. Xu, X.; Gao, P.; Zhu, X.; Guo, W.; Ding, J.; Li, C. Estimating the responses of winter wheat yields to moisture variations in the past 35 years in Jiangsu Province of China. PLoS ONE 2018, 13, 1–20. [Google Scholar] [CrossRef] [PubMed]
  34. Ding, J.; Huang, Z.; Zhu, M.; Li, C.; Zhu, X.; Guo, W. Does cyclic water stress damage wheat yield more than a single stress? PLoS ONE 2018, 13, 1–15. [Google Scholar] [CrossRef] [Green Version]
  35. Ding, J.; Liang, P.; Wu, P.; Zhu, M.; Li, C.; Zhu, X.; Gao, D.; Chen, Y.; Guo, W. Effects of waterlogging on grain yield and associated traits of historic wheat cultivars in the middle and lower reaches of the Yangtze River, China. Field Crops Res. 2020, 246, 107695. [Google Scholar] [CrossRef]
  36. Li, C.; Jiang, D.; Wollenweber, B.; Li, Y.; Dai, T.; Cao, W. Waterlogging pretreatment during vegetative growth improves tolerance to waterlogging after anthesis in wheat. Plant Sci. 2011, 180, 672–678. [Google Scholar] [CrossRef] [PubMed]
  37. Wu, X.; Tang, Y.; Li, C.; McHugh, A.D.; Li, Z.; Wu, C. Individual and combined effects of soil waterlogging and compaction on physiological characteristics of wheat in southwestern China. Field Crops Res. 2018, 215, 163–172. [Google Scholar] [CrossRef]
  38. Du, X.; He, W.; Wang, Z.; Xi, M.; Xu, Y.; Wu, W.; Gao, S.; Liu, D.; Lei, W.; Kong, L. Raised bed planting reduces waterlogging and increases yield in wheat following rice. Field Crops Res. 2021, 265, 108119. [Google Scholar] [CrossRef]
  39. Blake, G.R.; Hartge, K.H. Bulk Density in Klute: Methods of Soil Analysis; American Society of Agronomy Press: Madison, WI, USA, 1986. [Google Scholar]
  40. Gardner, W.H. Water Content: Methods of Soil Analysis; American Society of Agronomy Press: Madison, WI, USA, 1986. [Google Scholar]
  41. Lu, R.K. Soil and Agricultural Chemical Analysis Methods; Chinese Agriculture and Sciences Press: Beijing, China, 1999. [Google Scholar]
  42. Scheiner, D. Determination of ammonia and Kjeldahl nitrogen by indophenol method. Water Res. 1976, 10, 31–36. [Google Scholar] [CrossRef]
  43. Li, H.S. Principles and Techniques of Plant Physiological Experiment; Higher Education Press: Beijing, China, 2000; pp. 112–119. [Google Scholar]
  44. Li, Y.; Li, Z.; Chang, S.X.; Cui, S.; Jagadamma, S.; Zhang, Q.; Cai, Y. Residue retention promotes soil carbon accumulation in minimum tillage systems: Implications for conservation agriculture. Sci. Total Environ. 2020, 740, 140147. [Google Scholar] [CrossRef]
  45. Dai, Z.; Hu, J.; Fan, J.; Fu, W.; Wang, H.; Hao, M. No-tillage with mulching improves maize yield in dryland farming through regulating soil temperature, water and nitrate-N. Agric. Ecosyst. Environ. 2021, 309, 107288. [Google Scholar] [CrossRef]
  46. Li, Y.M.; Duan, Y.; Wang, G.L.; Wang, A.Q.; Shao, G.Z.; Meng, X.H.; Hu, H.Y.; Zhang, D.M. Straw alters the soil organic carbon composition and microbial community under different tillage practices in a meadow soil in Northeast China. Soil Tillage Res. 2021, 208, 104879. [Google Scholar] [CrossRef]
  47. Kuzyakov, Y.; Xu, X. Competition between roots and microorganisms for nitrogen: Mechanisms and ecological relevance. New Phytol. 2013, 198, 656–669. [Google Scholar] [CrossRef] [PubMed]
  48. Hou, X.Q.; Li, R.; Jia, Z.K.; Han, Q.F.; Wang, W.; Yang, B.P. Effects of rotational tillage practices on soil properties, winter wheat yields and water-use efficiency in semi-arid areas of north-west China. Field Crops Res. 2012, 129, 7–13. [Google Scholar] [CrossRef]
  49. Wang, L.F.; Shangguan, Z.P. Water-use efficiency of dryland wheat in response to mulching and tillage practices on the Loess Plateau. Sci. Rep. 2015, 5, 12225. [Google Scholar] [CrossRef] [PubMed]
  50. Lu, Y.; Zhang, X.; Chen, S.; Shao, L.; Sun, H. Changes in water use efficiency and water footprint in grain production over the past 35 years: A case study in the North China Plain. J. Clean. Prod. 2016, 116, 71–79. [Google Scholar] [CrossRef]
  51. Zhang, Y.J.; Wang, R.; Wang, S.L.; Wang, H.; Xu, Z.G.; Jia, G.C.; Wang, X.L.; Li, J. Effects of different sub-soiling frequencies incorporated into no-tillage systems on soil properties and crop yield in dryland wheat-maize rotation system. Field Crops Res. 2017, 209, 151–158. [Google Scholar] [CrossRef]
  52. Aziz, I.; Mahmood, T.; Islam, K.R. Effect of long term no-till and conventional tillage practices on soil quality. Soil Tillage Res. 2013, 131, 28–35. [Google Scholar] [CrossRef]
  53. Schwen, A.; Bodner, G.; Scholl, P.; Buchan, G.D.; Loiskandl, W. Temporal dynamics of soil hydraulic properties and the water-conducting porosity under different tillage. Soil Tillage Res. 2011, 113, 89–98. [Google Scholar] [CrossRef]
  54. Debaeke, P.; Aboudrare, A. Adaptation of crop management to water-limited environments. Eur. J. Agron. 2004, 21, 433–446. [Google Scholar] [CrossRef]
  55. Vizioli, B.; Cavalieri-Polizeli, K.M.V.; Tormena, C.A.; Barth, G. Effects of long-term tillage systems on soil physical quality and crop yield in a Brazilian Ferralsol. Soil Tillage Res. 2021, 209, 104935. [Google Scholar] [CrossRef]
  56. Lipiec, J.; Kuś, J.; Słowińska-Jurkiewicz, A.; Nosalewicz, A. Soil porosity and water infiltration as influenced by tillage methods. Soil Tillage Res. 2006, 89, 210–220. [Google Scholar] [CrossRef]
  57. Chauhan, Y.S.; Ryan, M.; Chandra, S.; Sadras, V.O. Accounting for soil moisture improves prediction of flowering time in chickpea and wheat. Sci. Rep. 2019, 9, 7510. [Google Scholar] [CrossRef]
  58. Yang, H.; Wu, G.; Mo, P.; Chen, S.; Wang, S.; Xiao, Y.; Ma, H.; Wen, T.; Guo, X.; Fan, G. The combined effects of maize straw mulch and no-tillage on grain yield and water and nitrogen use efficiency of dry-land winter wheat (Triticum aestivum L.). Soil Tillage Res. 2020, 197, 104485. [Google Scholar] [CrossRef]
  59. Abu-Hamdeh, N.H. Effect of tillage treatments on soil thermal conductivity for some Jordanian clay loam and loam soils. Soil Tillage Res. 2000, 56, 145–151. [Google Scholar] [CrossRef]
  60. Hillel, D. Soil temperature. In Fundamentals of Soil Physics; Academic Press: New York, NY, USA, 1980; p. 413. [Google Scholar]
  61. She, B.; Huang, J.F.; Guo, R.F.; Wang, H.B.; Wang, J. Assessing winter oilseed rape freeze injury based on Chinese HJ remote sensing data. J. Zhejiang Univ. Sci. B. 2015, 16, 131–144. [Google Scholar] [CrossRef] [PubMed] [Green Version]
  62. Yadvinder, S.; Bijay, S.; Ladha, J.K.; Khind, C.S.; Khera, T.S.; Bueno, C.S. Effect of residue decomposition on productivity and soil fertility in rice-wheat rotation. Soil Sci. Soc. Am. J. 2004, 68, 854–864. [Google Scholar] [CrossRef]
  63. Topa, D.; Cara, I.G.; Jităreanu, G. Long term impact of different tillage systems on carbon pools and stocks, soil bulk density, aggregation and nutrients: A field meta-analysis. CATENA 2021, 199, 105102. [Google Scholar] [CrossRef]
  64. Oladele, S.O.; Adeyemo, A.J.; Awodun, M.A. Influence of rice husk biochar and inorganic fertilizer on soil nutrients availability and rain-fed rice yield in two contrasting soils. Geoderma 2019, 336, 1–11. [Google Scholar] [CrossRef]
  65. Sharma, S.; Singh, P.; Choudhary, O.P.; Neemisha. Nitrogen and rice straw incorporation impact nitrogen use efficiency, soil nitrogen pools and enzyme activity in rice-wheat system in north-western India. Field Crops Res. 2021, 266, 108131. [Google Scholar] [CrossRef]
  66. Matthews, A.M.; Armstrong, A.C.; Leeds-Harrison, P.B.; Harris, G.L.; Catt, J.A. Development and testing of a model for predicting tillage effects on nitrate leaching from cracked clay soils. Soil Tillage Res. 2000, 53, 245–254. [Google Scholar] [CrossRef]
  67. Wulfsohn, D.; Gu, Y.; Wulfsohn, A.; Mojlaj, E.G. Statistical analysis of wheat root growth patterns under conventional and no-tillage systems. Soil Tillage Res. 1996, 38, 1–16. [Google Scholar] [CrossRef]
  68. Martínez, E.; Fuentes, J.-P.; Silva, P.; Valle, S.; Acevedo, E. Soil physical properties and wheat root growth as affected by no-tillage and conventional tillage systems in a Mediterranean environment of Chile. Soil Tillage Res. 2008, 99, 232–244. [Google Scholar] [CrossRef]
  69. Hayashi, T.; Yoshida, T.; Fujii, K.; Mitsuya, S.; Tsuji, T.; Okada, Y.; Hayashi, E.; Yamauchi, A. Maintained root length density contributes to the waterlogging tolerance in common wheat (Triticum aestivum L.). Field Crops Res. 2013, 152, 27–35. [Google Scholar] [CrossRef]
  70. Sundgren, T.K.; Uhlen, A.K.; Lillemo, M.; Briese, C.; Wojciechowski, T. Rapid seedling establishment and a narrow root stele promotes waterlogging tolerance in spring wheat. J. Plant Physiol. 2018, 227, 45–55. [Google Scholar] [CrossRef] [PubMed]
  71. Zogg, G.P.; Zak, D.R.; Ringleberg, D.B.; MacDonald, N.W.; Pregitzer, K.S.; White, D.C. Compositional and functional shifts in microbial communities due to soil warming. Soil Sci. Soc. Am. J. 1997, 61, 475–481. [Google Scholar] [CrossRef] [Green Version]
  72. Clarke, S.J.; Lamont, K.J.; Pan, H.Y.; Barry, L.A.; Hall, A.; Rogiers, S.Y. Spring root-zone temperature regulates root growth, nutrient uptake and shoot growth dynamics in grapevines. Aust. J. Grape Wine Res. 2015, 21, 479–489. [Google Scholar] [CrossRef]
  73. Liao, M.; Fillery, I.; Palta, J.A. Early vigorous growth is a major factor influencing nitrogen uptake in wheat. Funct. Plant Biol. 2004, 31, 121–129. [Google Scholar] [CrossRef]
  74. Jiang, S.; Sun, J.; Tian, Z.; Hu, H.; Michel, E.J.S.; Gao, J.; Jiang, D.; Cao, W.; Dai, T. Root extension and nitrate transporter up-regulation induced by nitrogen deficiency improves nitrogen status and plant growth at the seedling stage of winter wheat (Triticum aestivum L.). Environ. Exp. Bot. 2017, 141, 28–40. [Google Scholar] [CrossRef]
  75. Xie, Q.; Fernando, K.M.C.; Mayes, S.; Sparkes, D.L. Identifying seedling root architectural traits associated with yield and yield components in wheat. Ann. Bot. 2017, 119, 1115–1129. [Google Scholar] [CrossRef]
  76. Wang, X.; Shen, J.; Hedden, P.; Phillips, A.L.; Thomas, S.G.; Ge, Y.; Ashton, R.W.; Whalley, W.R. Wheat growth responses to soil mechanical impedance are dependent on phosphorus supply. Soil Tillage Res. 2021, 205, 104754. [Google Scholar] [CrossRef]
Figure 1. Distribution of test sites in Jiangsu Province, China.
Agronomy 12 00865 g001
Figure 2. Daily mean temperature and precipitation amount at the experimental sites of Jintan (a,b) and Sihong (c,d) during the wheat growing seasons of 2017–2018 (a,c) and 2018–2019 (b,d). Emrg.: seedling emergence, ThrLf.: three-leaf stage, Ovrw.: overwintering stage, Jntn.: jointing stage, Btng.: booting stage, Mtrt.: maturity stage.
Agronomy 12 00865 g002
Figure 3. Effect of tillage methods on soil bulk density (BD) at 0–10 cm and 10–20 cm soil layers at different days after tillage at Jintan (a,b) and Sihong (c,d) in 2017–2018 (a,c) and 2018–2019 (b,d). Tillage methods included plow tillage followed by rotary tillage (PR) and no-tillage (NT). All values are presented as mean ± SE (3 replicates) with one standard error. For the same time after tillage, bars labeled with different letters indicate significant differences among different tillage methods and soil layers at the p < 0.05 level.
Agronomy 12 00865 g003
Figure 4. Effects of tillage methods on relative water content (RWC) in 0–10 cm and 10–20 cm soil at different days after tillage (DAT) at the experimental sites of Jintan (a,b) and Sihong (c,d) in 2017–2018 (a,c) and 2018–2019 (b,d). Tillage methods included plow tillage followed by rotary tillage (PR) and no-tillage (NT). All values are presented as mean ± SE (3 replicates) with one standard error. For the same time after tillage, bars labeled with different letters indicate significant differences among different tillage methods and soil layers at the p < 0.05 level. The value above each set of bars is the range of the average RWC of different treatments and soil layers.
Agronomy 12 00865 g004
Figure 5. Effects of tillage methods on soil temperature in different depths of soil at the 42nd and 83rd day after tillage at Jintan (a,b) and the 36th and 87th day after tillage at Sihong (c,d) in 2018–2019. Tillage methods included plow tillage followed by rotary tillage (PR) and no-tillage (NT). All values are presented as mean ± SE (3 replicates) with one standard error. * indicates significant differences among different tillage methods at the p < 0.05 level.
Agronomy 12 00865 g005
Figure 6. Effects of tillage methods on the content of available nitrogen (a), available phosphorus (b), available potassium (c), and soil organic matter (d) in 0–10 cm and 10–20 cm soil at Jintan and Sihong in 2018–2019. Tillage methods included plow tillage followed by rotary tillage (PR) and no-tillage (NT). All values are presented as mean ± SE (3 replicates) with one standard error. Bars labeled with different letters indicate significant differences at the p < 0.05 level.
Agronomy 12 00865 g006
Figure 7. Effects of tillage practices on root biomass (a,b), root activity (c,d), culm number (e,f), leaf area (g,h), shoot biomass (i,j) and shoot nitrogen accumulation (k,l) of wheat seedlings at Jintan and Sihong in 2017–2018 and 2018–2019. Tillage methods included plow tillage followed by rotary tillage (PR) and no-tillage (NT). All values are presented as mean ± SE (3 replicates) with one standard error. Bars labeled with different letters indicate significant differences between tillage practices at the p < 0.05 level.
Agronomy 12 00865 g007
Figure 8. Effects of tillage practices on spikes per plant (a,b), single spike yield (c,d), and grain yield (e,f) of wheat at Jintan and Sihong in 2017–2018 and 2018–2019. Tillage methods included plow tillage followed by rotary tillage (PR) and no-tillage (NT). All values are presented as mean ± SE (3 replicates) with one standard error. Bars labeled with different letters indicate significant differences in tillage practices at the p < 0.05 level.
Agronomy 12 00865 g008
Table 1. Wheat variety, amount of seed, planting density, and sowing and harvest date of 2017–2018 and 2018–2019 at Jintan and Sihong.
SiteYearWheat VarietyAmount of Seed (kg ha−1)Planting Density (Plants m−2)Sowing Date (Day/Month/Year)Harvest Date (Day/Month/Year)
Jintan2018Sumai 188210.02256 November 201727 May 2018
2019Sumai 188210.03002 November 201831 May 2019
Sihong2018Yangmai 23292.52257 November 20171 June 2018
2019Qianmai 088292.530022 October 20181 June 2019
Publisher’s Note: MDPI stays neutral with regard to jurisdictional claims in published maps and institutional affiliations.

