Article

Genome-Wide Association Studies of Plant Architecture-Related Traits in the Chinese Soybean Mini Core Collection

1
National Center for Soybean Improvement, Key Laboratory of Biology and Genetics and Breeding for Soybean, Ministry of Agriculture, State Key Laboratory for Crop Genetics and Germplasm Enhancement, College of Agriculture, Nanjing Agricultural University, Nanjing 210095, China
2
Institute of Crop and Nuclear Technology Utilization, Zhejiang Academy of Agricultural Sciences, Hangzhou 310021, China
*
Authors to whom correspondence should be addressed.
Agronomy 2022, 12(4), 817; https://doi.org/10.3390/agronomy12040817
Submission received: 18 February 2022 / Revised: 19 March 2022 / Accepted: 25 March 2022 / Published: 28 March 2022
(This article belongs to the Special Issue Frontier Studies in Legumes Genetic Breeding and Production)

Abstract

:
Plant architecture traits are closely related to plant biomass, lodging, and photosynthetic efficiency, which in turn affect soybean yield. In this study, we investigated a Chinese soybean mini core collection consisting of 224 germplasm accessions for four plant architecture-related traits (plant height (PH), number of nodes on main stem (NN), branch number (BN), and stem diameter (DI)) under three environments and conducted a genome-wide association study (GWAS) based on 1514 single nucleotide polymorphisms (SNPs). A total of 41 SNPs were found to be significantly associated with PH, NN, BN, and DI in two or more environments. Among these SNPs, 15 were located in regions in which plant architecture-related QTLs had been reported in previous studies, and 26 were new genetic loci. In addition, 18 potential candidate genes for plant architecture-related traits were obtained by predicting the genes in the interval of four large-effect markers (BARC-017097-02199, Map-2213, BARC-014639-01604, and Map-2223). This research will help to illuminate the genetic basis of soybean plant architecture-related traits and accelerate the process of plant architecture breeding by molecular marker-assisted selection in soybean.

1. Introduction

Soybean (Glycine max (L.) Merr.) is one of the most important oil seed crops in the world, providing high-quality vegetable oil and protein for human beings and playing a vital role in solving the problem of insufficient protein supply [1,2]. It is therefore particularly important to improve soybean yield. Ideotype breeding of soybean can increase yield by reducing the strong intragroup competition between soybean reproductive and vegetative growth and fleshy pods [3,4]. This could improve the adaptability of crops to the environment by preventing lodging, optimizing canopy architecture, determining light distribution, and enhancing photosynthesis [5,6]. The plant height (PH), number of nodes on main stem (NN), branch number (BN), and stem diameter (DI) are important plant architecture-related traits of soybean that are highly important for improving biological yield [7]. Therefore, ideotype breeding is an effective way to achieve a breakthrough in soybean yield.
Plant architecture-related traits are complex quantitative traits affected by multiple quantitative trait loci (QTLs) and environmental factors, and combining dense molecular markers and genomic information is an effective method for genetic research [8,9,10]. Although some progress in traditional QTL linkage mapping has been made in soybean plant architecture, there are certain limitations in biparental segregation populations, including the limited allelic variation in each cross, time consumption for mapping population construction, and limited mapping resolution resulting in large confidence intervals for the detected loci [11,12]. In addition, well-established genome sequences will increase the understanding of the genetic basis of these traits, thereby promoting the development of soybean marker-assisted breeding [13].
Genome-wide association analysis (GWAS) overcomes the limitations of traditional biparental QTL mapping to enable more accurate and effective QTL mapping. Based on the linkage disequilibrium relationship between the loci within the population and the identification of the association between genetic markers and the target trait phenotype [14], its wide application has benefited from the development of next-generation sequencing (NGS) and high-density molecular markers.
In recent years, GWAS has been applied to the analysis of complex quantitative traits of model organisms and crops [15,16,17,18]. Currently, GWAS has been successfully applied to research on plant architecture-related traits in soybean, and a large number of high-precision loci have been identified. For example, 27 loci associated with plant height have been identified from 309 early maturing soybean germplasms, and a major effect locus on Gm 19, PH24, explained 10% of phenotypic variation [19]. Fang et al. (2017) used 809 soybean accessions to perform GWAS on 84 agronomic traits and identified 245 important loci, of which 95 genetically interacted with other loci, revealing the genetic network of associated loci among different soybean traits [18]. At different developmental stages of the soybean, 34 and 30 quantitative trait nucleotides (QTNs) were found to be associated with PH and NN, respectively, using the mrMLM model [20]. Five QTNs have been shown to be related to BN, and the TCP transcription factor GmBRC1 in the LD block of qtnBR6-1 may regulate the branches’ development [21]. Chen et al. (2020) detected 114 SNPs associated with NN on chromosomes 1, 3, 6, and 14 as well as 39 SNPs related to DI on chromosomes 4, 9, and 19 under well-watered and drought conditions [22]. Based on a restricted two-stage multilocus genome-wide association study (RTM-GWAS), 76 QTLs and 183 alleles of NN were found in 306 soybean materials [23]. Using RILs consisting of 427 lines, 89 NN QTLs were detected with a phenotypic contribution of 84.50%, of which 58 were new QTLs [24]. In total, 12, 12, 4, and 4 SNPs associated with PH, NN, BN, and DI, respectively, were repeatedly detected in at least two environments through 133 soybean landraces, among which seven SNPs had particularly strong effects [7]. Although a large number of soybean plant architecture-related loci have been identified, the genetic basis of plant architecture regulation has not been fully elucidated due to the complexity of its genetic mechanism. Therefore, there may be new loci and genes for plant architecture-related traits that have not been discovered in soybean. Ideotype is an important way to improve soybean yield. Therefore, elucidating the genetic mechanism of soybean plant architecture-related traits can lay the foundation for molecular design breeding of soybean ideotype and genetic improvement of varieties.
In this study, we used a Chinese soybean mini core collection of 224 germplasm accessions, which has been used in the study of soybean phytophthora root and stem rot (PRR) [25], seed hardness [26], and yield-related traits at the R6 stage of soybean [27]. This study is a supplement to the research on plant architecture-related traits in these collections and enriches the research scope of this population. Combined with 1514 high-quality SNPs, GWAS was carried out for four plant architecture-related traits (PH, NN, BN, and DI) under three environments for two consecutive years. This study aims to exploit more new loci and genes to expand the regulatory loci of architecture-related traits in soybean, and this will be used to reveal the genetic mechanism of soybean plant architecture-related traits more comprehensively.

2. Materials and Methods

2.1. Plant Materials

The plant materials in this study were 224 soybean mini core accessions selected from 23,587 soybean germplasm resources in the Chinese National Soybean GeneBank (CNSGB), which has abundant genetic diversity [25]. According to the geographical source of the materials, the 224 soybean mini core collections originated from four soybean ecological regions in China: the northeast soybean ecological region, the northern soybean ecological region, the Huanghuaihai region, and the southern soybean ecoregion. These were the origin of 39, 37, 48, and 100 materials, respectively. This set of materials was widely distributed in many provinces and autonomous regions in China.

2.2. Field Trials and Trait Measurement

The field trials were conducted at the Jiangpu Experimental Station of Nanjing Agricultural University (32°12′ N, 118°37′ E) in 2016 and 2017 and at the Anhui Dangtu Experimental Station (31°55′ N, 118°49′ E) in 2017. The three environments were identified as 2016JP, 2017JP, and 2017DT. The field trial was designed in a completely randomized block design with three blocks in each environment. Each material was planted in a row with a length of 4 m and a row spacing of 0.5 m. The seedlings were planted as 40 plants per row, with a plant spacing of 10 cm. A mixture of 2.25 L of 48% Trifluralin EC and 525 kg water was applied per hectare, sprayed evenly on the soil surface, and mixed in the soil for 1–3 cm to suppress weed growth after land consolidation. Before sowing, the special compound fertilizer was applied for soybean (the rate of N-P2O5-K2O was 13:25:12), the application rate was 375 kg/hm2, and no more topdressing was performed. There were few pests in the three environments, therefore, we added 150 mL of 20% Chlorantraniliprole SC into 450 kg water per hectare according to the pest situation in the field and sprayed only once at the pod stage. Other field management measures were consistently performed during soybean growth to minimize test error.
Five plants were randomly selected from each block under the three environments 2016JP, 2017JP, and 2017DT to examine plant height, number of nodes on main stem, branch number, and stem diameter at the maturity period. For soybean plant architecture, plant height is the length from the cotyledon node to the top of the main stem (PH, measured in cm); the nodes of the main stem indicate the number of nodes from the cotyledonary node to the top of the main stem (NN); the branch numbers indicate the effective branches of the main stem (BN) [28]; and stem diameter is measured at the third internode diameter on the main stem from the cotyledon node with a micrometer (DI, measured in mm) [10].

2.3. Phenotypic Data Analysis

IBM SPSS Statistics v20.0 was used to perform descriptive statistical analysis on the four plant architecture-related traits, and the GLM process in SAS 9.4 [29] was used to perform joint variance analysis on the phenotype data under three environment conditions. Based on the average of the four plant architecture-related traits under the three environments, the CORR process was used to calculate the Pearson correlation coefficient between plant architecture-related traits. The PROC VARCOMP method was used to calculate the variance components of the four plant architecture-related traits in genotype, environment, and genotype–environment interaction, and the estimated heritability calculation formula was as follows [30]:
h 2 = σ g 2 ( σ g 2 + σ g e 2 n + σ e 2 r n )
where σ g 2 represents the genotype variance, σ e 2 represents the error, σ g e 2 represents the genotype and environment interaction variance, r represents the number of repeats, and n represents the number of environments.

2.4. Genotyping and Linkage Disequilibrium (LD) Analysis

The SNP markers used in this study included 554 SNPs related to genetic diversity in wild and cultivated soybeans and 1536 SNPs for fatty acid composition in soybean grains [31,32]. Through the integration of the two groups, 1654 SNPs were obtained. To improve the efficiency of association analysis, TASSEL v5.2 was used to screen and filter with minor allele frequency (MAF < 0.05) and heterozygosity (H > 0.15) to obtain 1514 high quality SNP markers. These markers have been used to analyze the association between soybean resistance to Phytophthora sojae root rot and soybean mature grain hardness [25,26].
The LD degree r2 between SNP markers was calculated with TASSEL v5.2. The LD decay trend line is shown in Figure S1. When r2 is 0.04, the average LD decay distance of the population on 20 chromosomes is 544.01 kb [25].

2.5. Population Structure and Kinship

The kinship in this study was calculated based on the pairwise IBS method in TASSEL v5.2. The calculated K matrix represents the kinship between different materials (Figure S2). The K matrix has the same effect as the Q matrix in the association analysis. It is used as a covariate in association analysis to reduce false positives [33]. STRUCTURE 2.2 was used to estimate the population structure of 224 soybean mini core collection, and the population structure analysis showed that when K was equal to 2, the Δk value was the largest, allowing the population to be divided into two subgroups [25] (Figure S3).

2.6. Genome-Wide Association Analysis

This study is based on TASSEL v5.2, using population structure (Q) as a covariate and kinship (K) as a covariate. The MLM (Q + K) model was used to perform GWAS on the values of the four plant architecture traits of the soybean mini core collection under three environments and the average of the phenotypes in the three environments. To fully exploit the valuable genetic information in the soybean mini core collection, the threshold for significant association between the marker and the target trait was set to p ≤ 0.01 (−log10(p) ≥ 2), which has been used in the study of soybean fatty acid content [32], mature grain hardness [26], and R6 stage yield-related traits [27] association analysis loci. Manhattan Plot and Q-Q Plot were drawn based on the results of association analysis by the R (V4.0.0) package“qqman” (V0.1.8, Stephen Turner, VA, USA, https://github.com/stephenturner/qqman) [34,35].

2.7. Prediction and Annotation of Candidate Genes

According to the LD decay distance (±554.01 kb), SNP markers that were significantly correlated in at least two environments and had the highest rate of phenotypic variation were selected for candidate gene searches. The SoyBase database (https://www.soybase.org/, accessed on 24 December 2021) and Phytozome (https://phytozome-next.jgi.doe.gov/, accessed on 24 December 2021) functional annotation of genes and different tissue expression data were combined to predict candidate genes for target traits. The soybean reference genome was Wm82.a2.v1.

3. Results

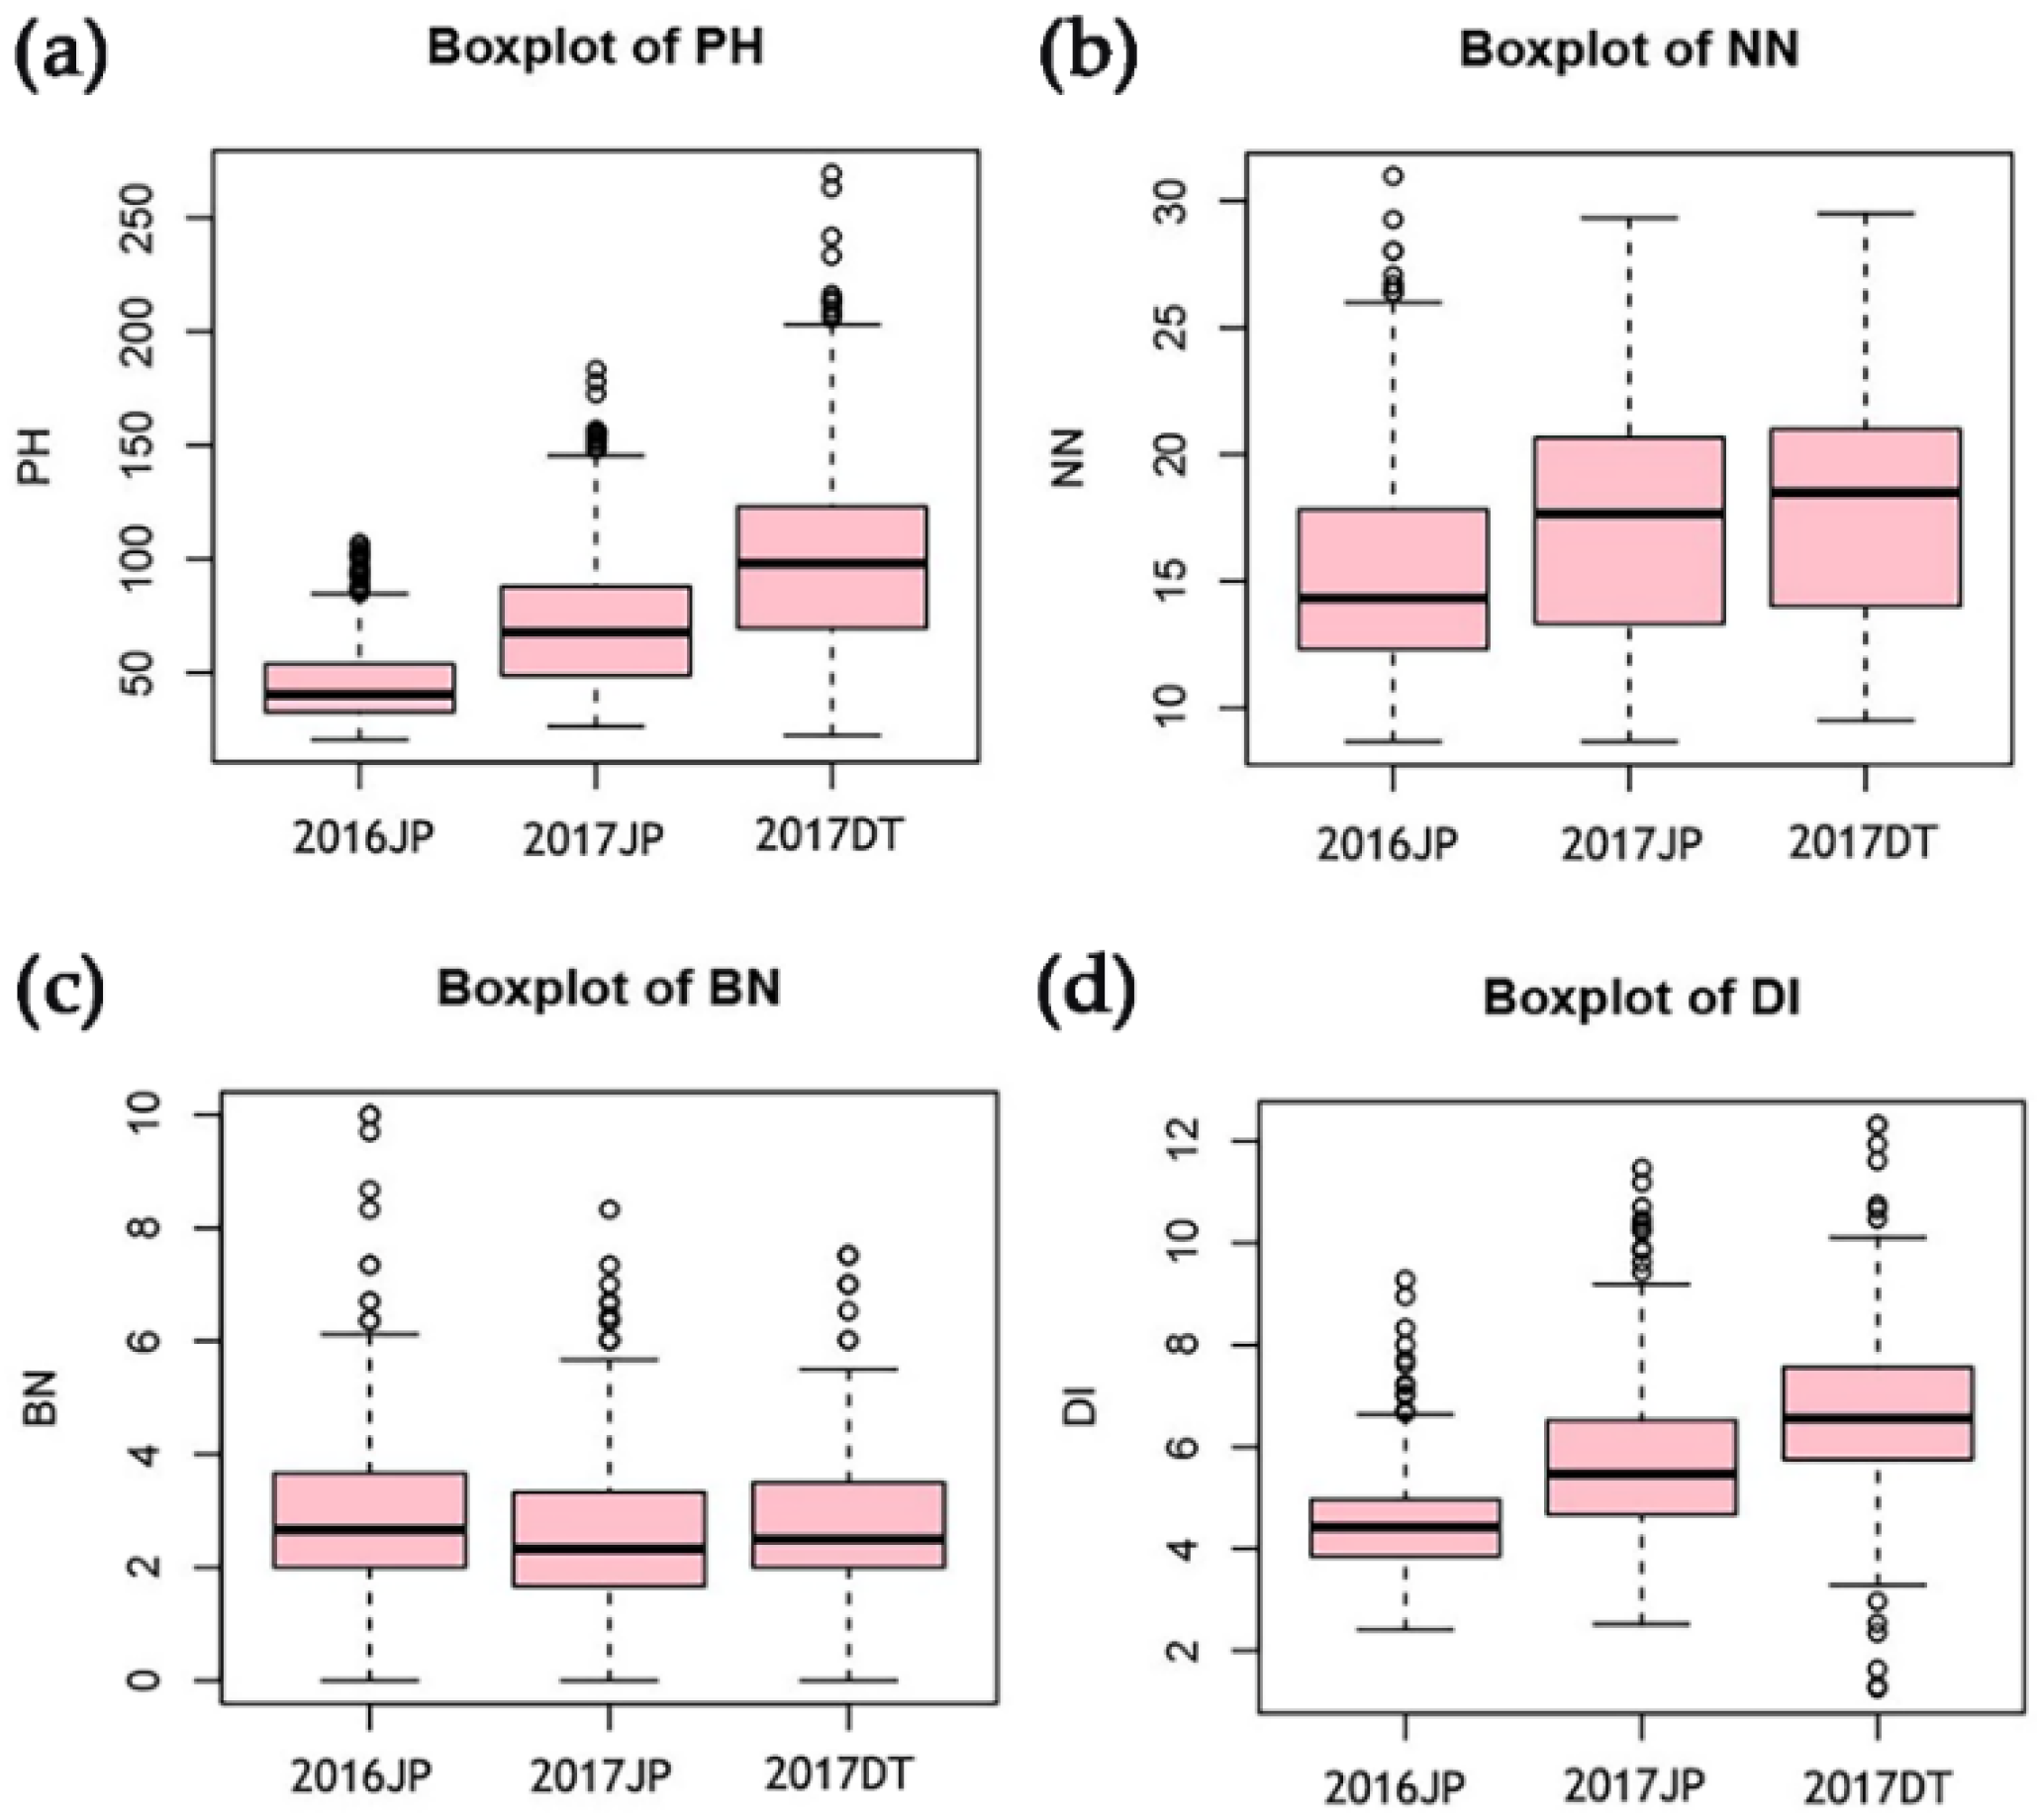
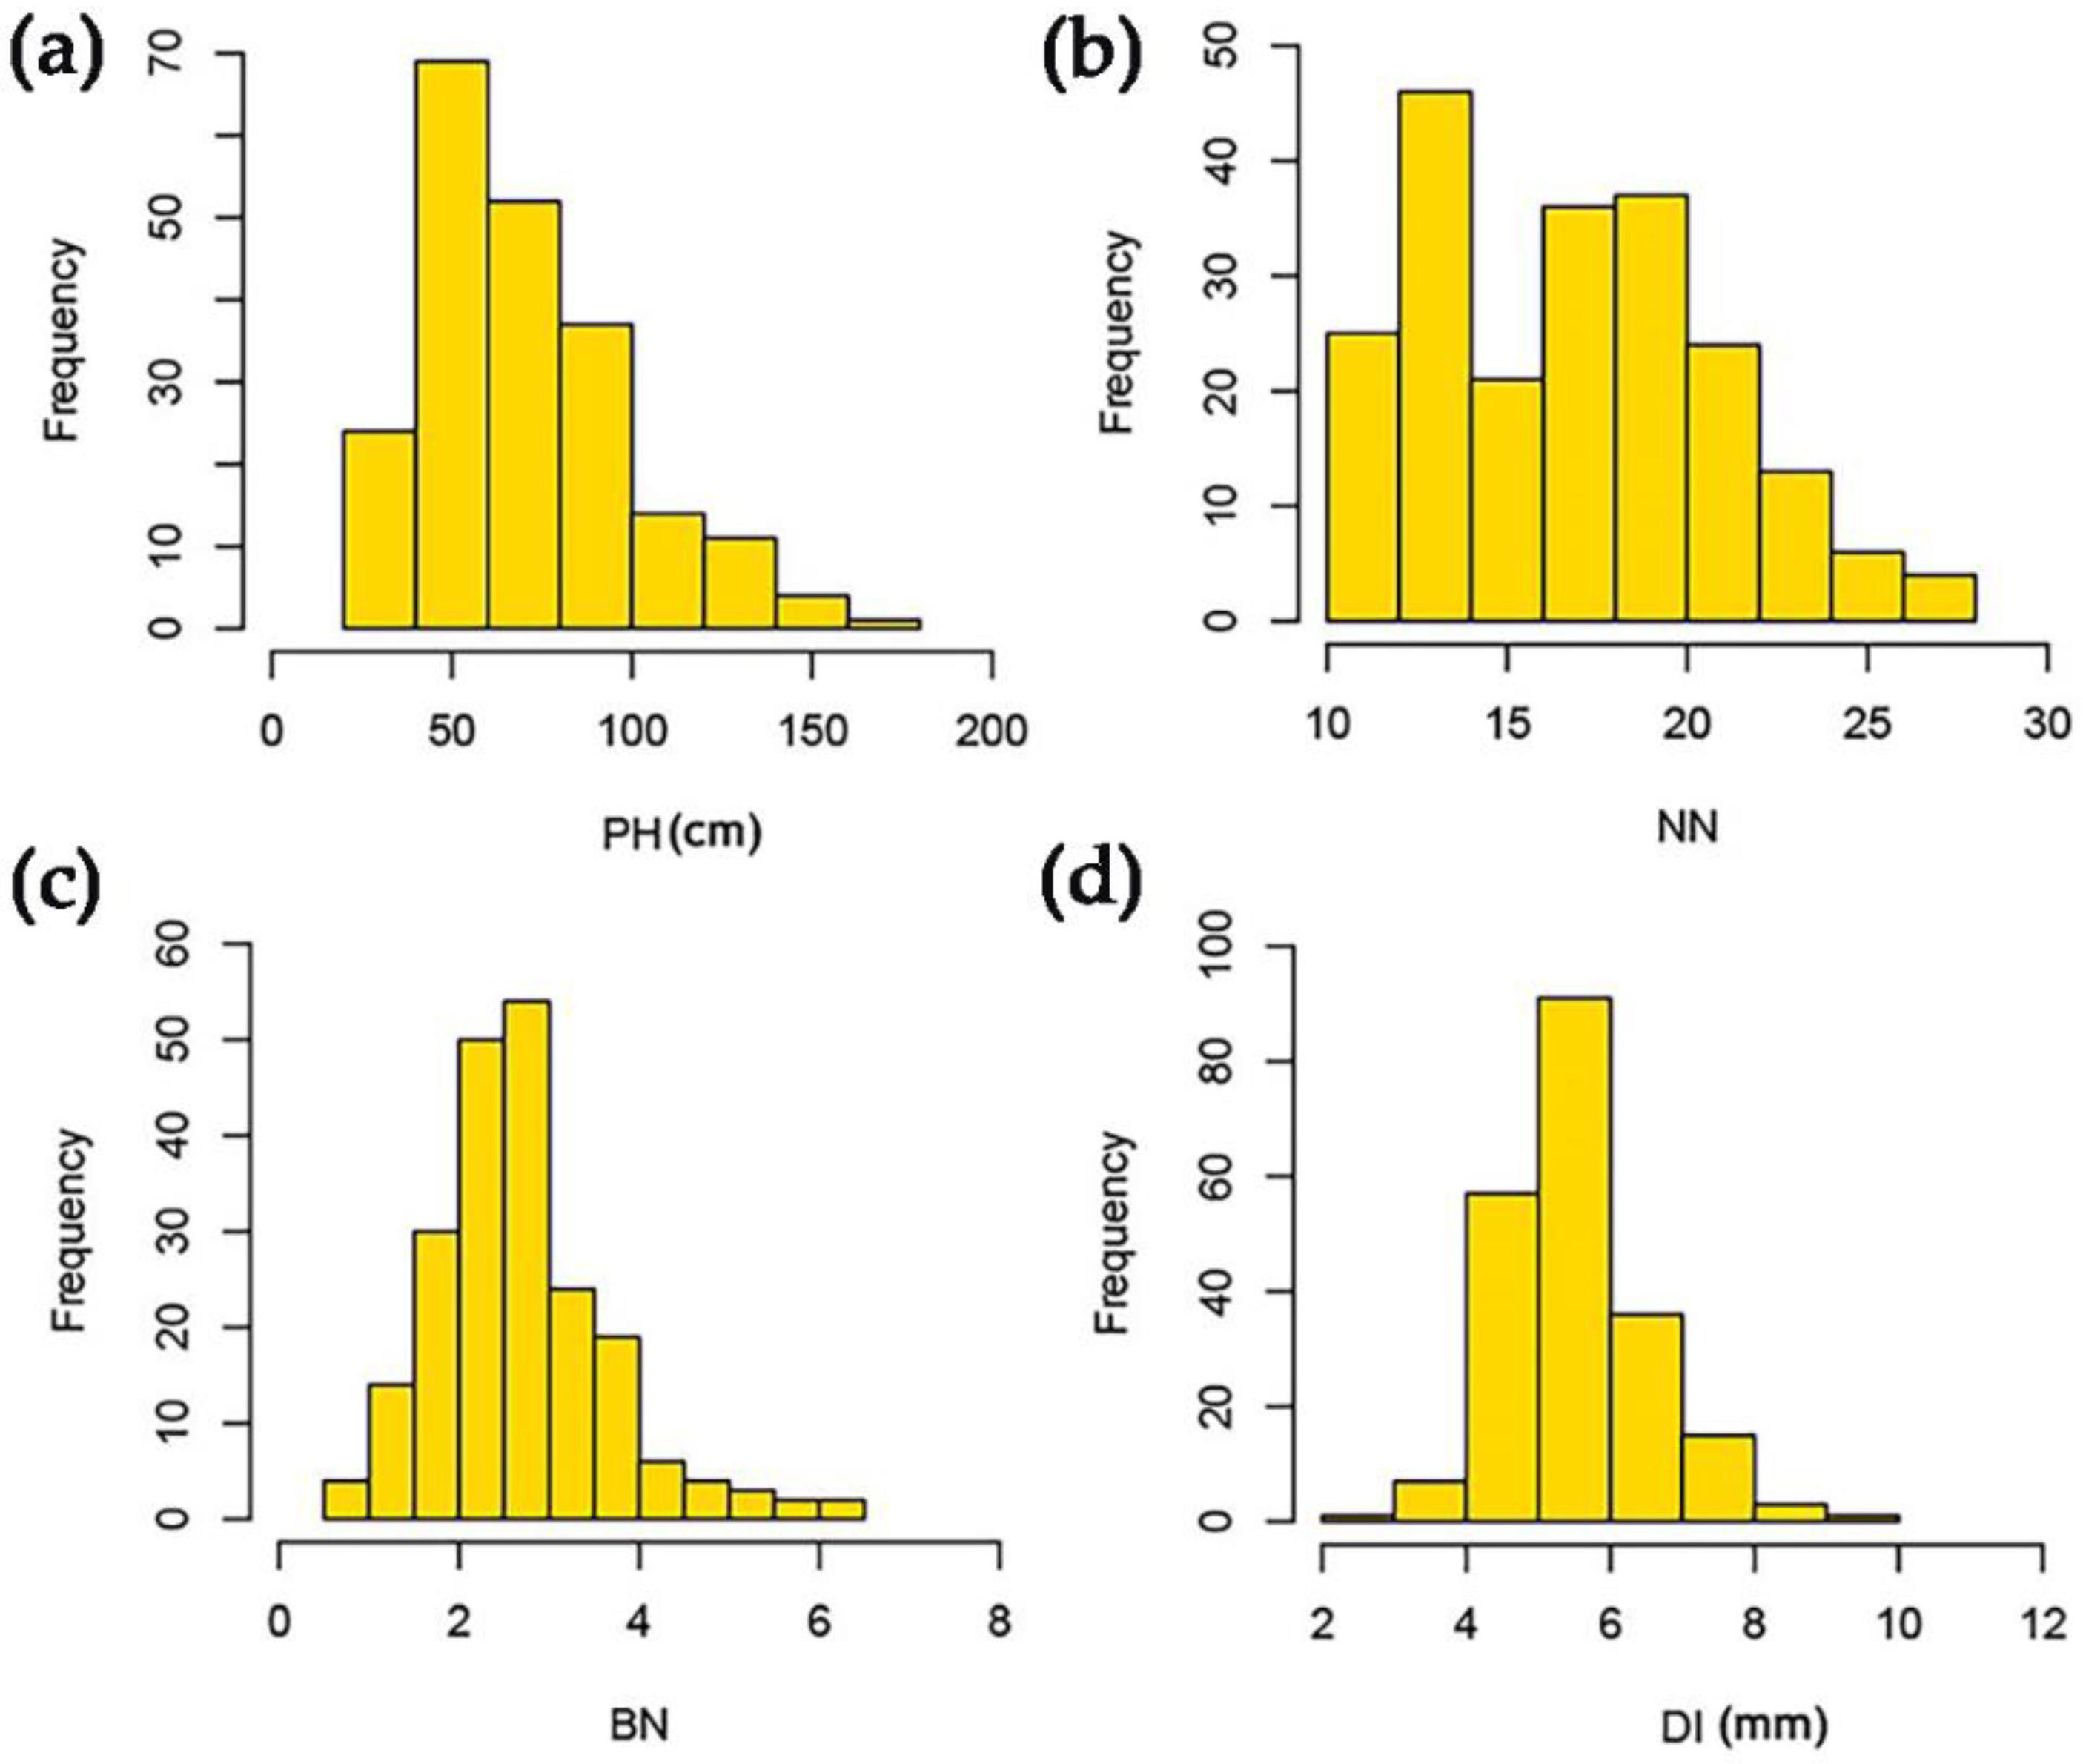
3.1. Phenotypic Variation in the Four Plant Architecture-Related Traits

A two-year survey of four plant architecture-related traits of 224 diverse soybean mini core accessions was conducted in Jiangpu, Nanjing, and Dangtu, Anhui. The results showed that PH, NN, BN, and DI had extensive phenotypic variation in the soybean mini core collection in all three environments (2016JP, 2017JP, and 2017DT) (Table 1). The variation ranges of PH, NN, BN, and DI in the three environments were 28.06–165.52 cm, 10.15–27.6, 0.67–6.28, and 2.94–9.29 mm, respectively. The distributions of PH, NN, and DI in 2016JP were significantly lower than in 2017JP and 2017DT, while the distribution of BN in the three environments was basically the same (Figure 1). The results of the analysis of variance showed that the four plant architecture-related traits had extremely significant differences in genotype, environment, and genotype–environment interactions (Table 1), indicating that these plant architecture traits may be quantitative traits controlled by multiple genes and easily affected by environmental factors. The heritability of PH, NN, BN, and DI in these collections was 89.25%, 93.92%, 69.97%, and 73.05%, respectively. Among them, the heritability of PH and NN was higher, while the heritability of BN and DI was lower, indicating that BN and DI are greatly affected by the environment and other factors.
In addition, the four plant architecture-related traits of the soybean mini core collection were continuously distributed and approximately normally distributed, consistent with the characteristics of quantitative traits (Figure 2). The correlation analysis based on the phenotypic mean values of the four traits was computed, and the results are shown in Table 2. There were highly significant positive correlations among PH, NN, BN, and DI (r = 0.422–0.878, p ≤ 0.01). The correlation analysis showed positive correlations between soybean plant architecture-related traits.

3.2. Genetic Diversity, Linkage Disequilibrium, and Population Structure

The analysis of SNP data, linkage disequilibrium, and population structure of 224 soybean mini core collections in this study has been reported by Huang et al. [25]. The population was genotyped using the 1645 SNPs obtained by integration, from which 1514 high-quality SNPs with missing data < 15%, minor allele frequency MAF ≥ 5%, and heterozygous alleles ≤ 15% [36] were selected for subsequent analysis. The average LD decay of the collections on 20 chromosomes was 554.01 kb at r2 < 0.04, as calculated using TASSEL v5.2 [25] (Figure S1). The kinship coefficients were mostly concentrated from 0.3 to 0.4 using the pairwise IBS method, indicating that the pairwise kinship relatedness among different soybean materials was weak [25] (Figure S2). Estimation of the population structure by STRUCTURE 2.2 showed that the maximum Δk value was obtained when the K value was two, thus the Chinese soybean mini core collection could be divided into two subgroups [25] (Figure S3).

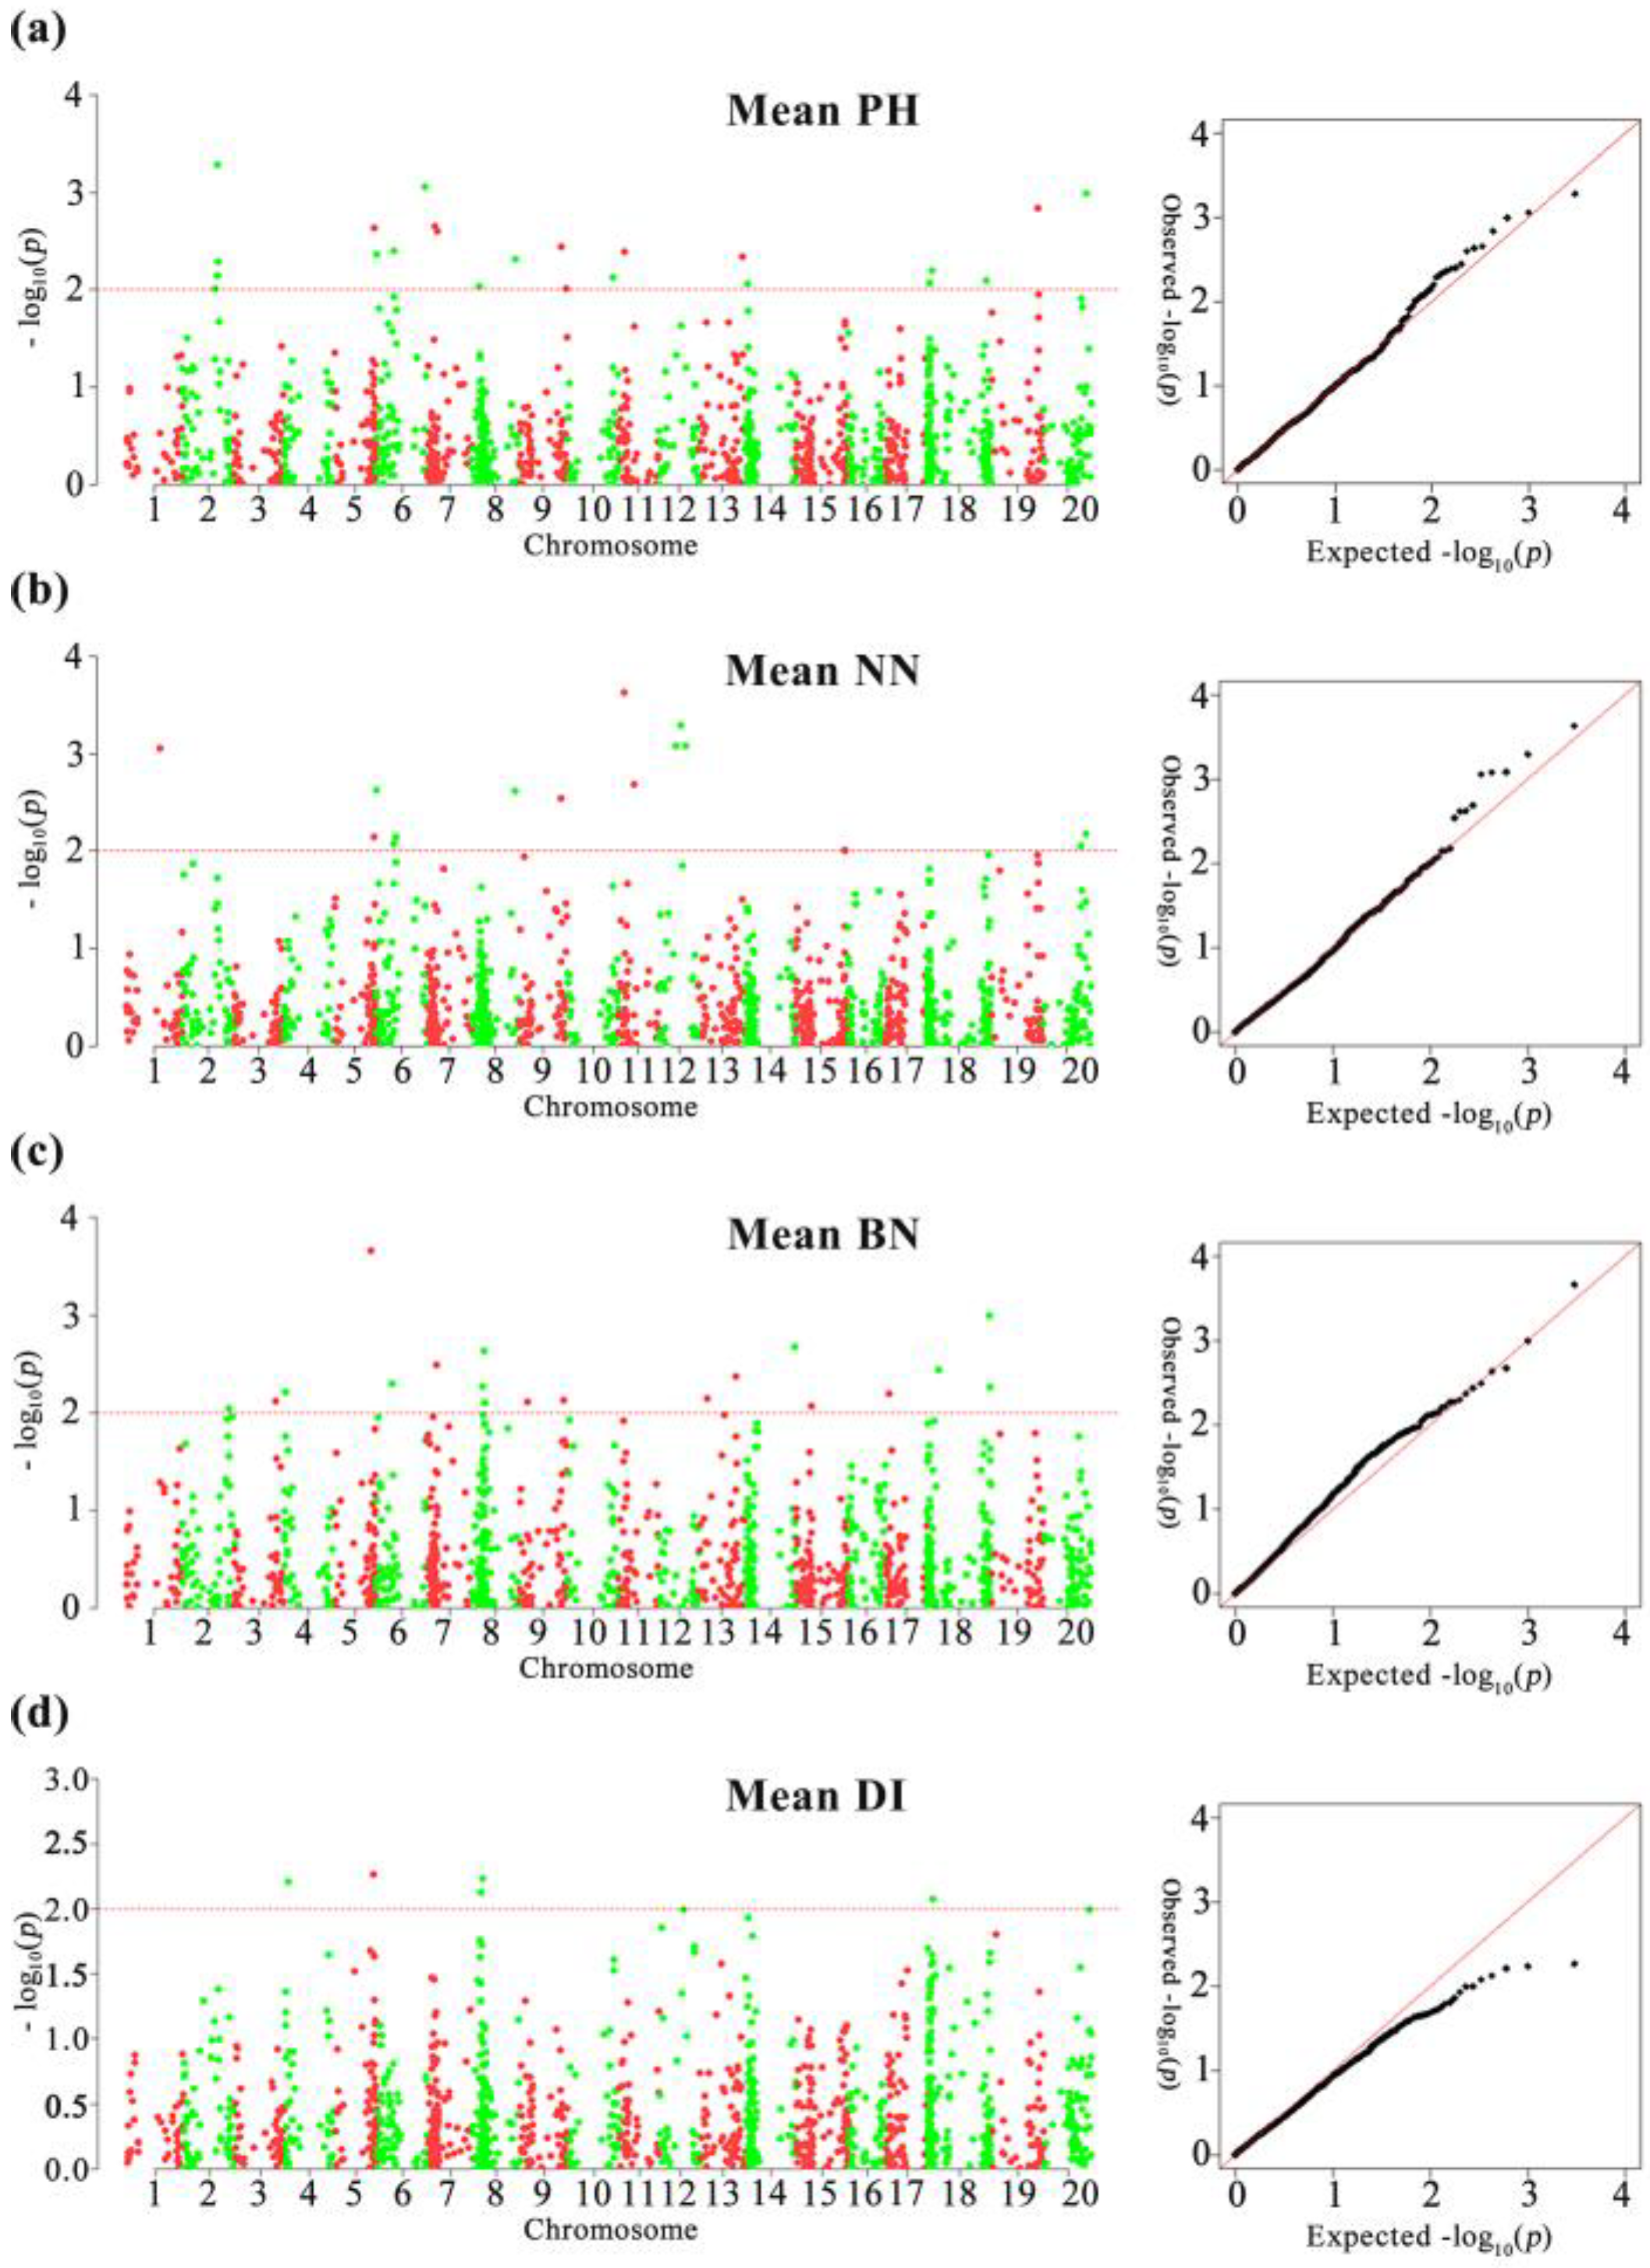
3.3. GWAS of the Four Plant Architecture-Related Traits

In this study, 1514 high-quality SNP markers were used to perform the GWAS based on the MLM (Q + K) model for plant architecture-related traits (PH, NN, BN, DI) of 224 soybean mini core collections using the values for three environments: 2016JP, 2017JP, and 2017DT, and for the phenotypic means in the three environments. A total of 41 SNP loci (−log10(p) ≥ 2) were significantly associated with four traits in at least two environments, of which 19, 15, 8, and 6 SNPs were significantly associated with PH, NN, BN, and DI, respectively. Among the 19 PH SNPs, five co-localized with NN and two co-located with DI at the same time. (Figure 3 and Figures S4–S7). Among the markers that are significantly associated with PH, three markers could be repeatedly detected in all environments, namely, markers Q-02-0159217, BARC-041421-07980, and BARC-017097-02199 on chromosomes 2, 9, and 11, and the contribution of BARC-017097-02199 with larger effects on the observed phenotypic variation was 5.08–10.48% (Table 3). Three of the markers significantly associated with NN were detected in all environments, including the marker Map-2026 on chromosome 11 and the markers Map-2211 and Map-2213 on chromosome 12. Among them, Map-2213 had the highest interpretation rate of phenotypic variation under the four environments, at 7.76%, 7.41%, 6.2%, and 7.62%, respectively.
In addition, four markers (BARC-014527-01571, Q-06-0128380, BARC-041421-07980, and BARC-017097-02199) were significantly associated with PH and were located on chromosomes 6, 9, and 11. A total of eight SNP loci were significantly associated with BN in at least two environments, and the phenotypic variation interpretation rate ranged from 3.65% to 10.10%. Among them, BARC-014639-01604, which is located on chromosome 5, had the highest phenotypic variation explanation rate in the 2017JP and mean environments, at 10.10% and 8.42%, respectively. With a total of six SNPs significantly associated with DI in at least two environments, the phenotypic variation interpretation rate for individual SNP markers ranged from 3.52% to 7.09%, with Map-2223, located on chromosome 12, showing the highest phenotypic variation interpretation rates of 4.98% and 7.09% in 2017JP and 2017DT, respectively (Table 3). According to the SNPs that are stably and significantly associated with a high phenotypic variation interpretation rate in different environments [7], four SNP markers BARC-017097-02199, Map-2213, BARC-014639-01604, and Map-2223 were found to be remarkably related to PH, NN, BN, and DI in at least two environments with large effects on subsequent candidate genes prediction.

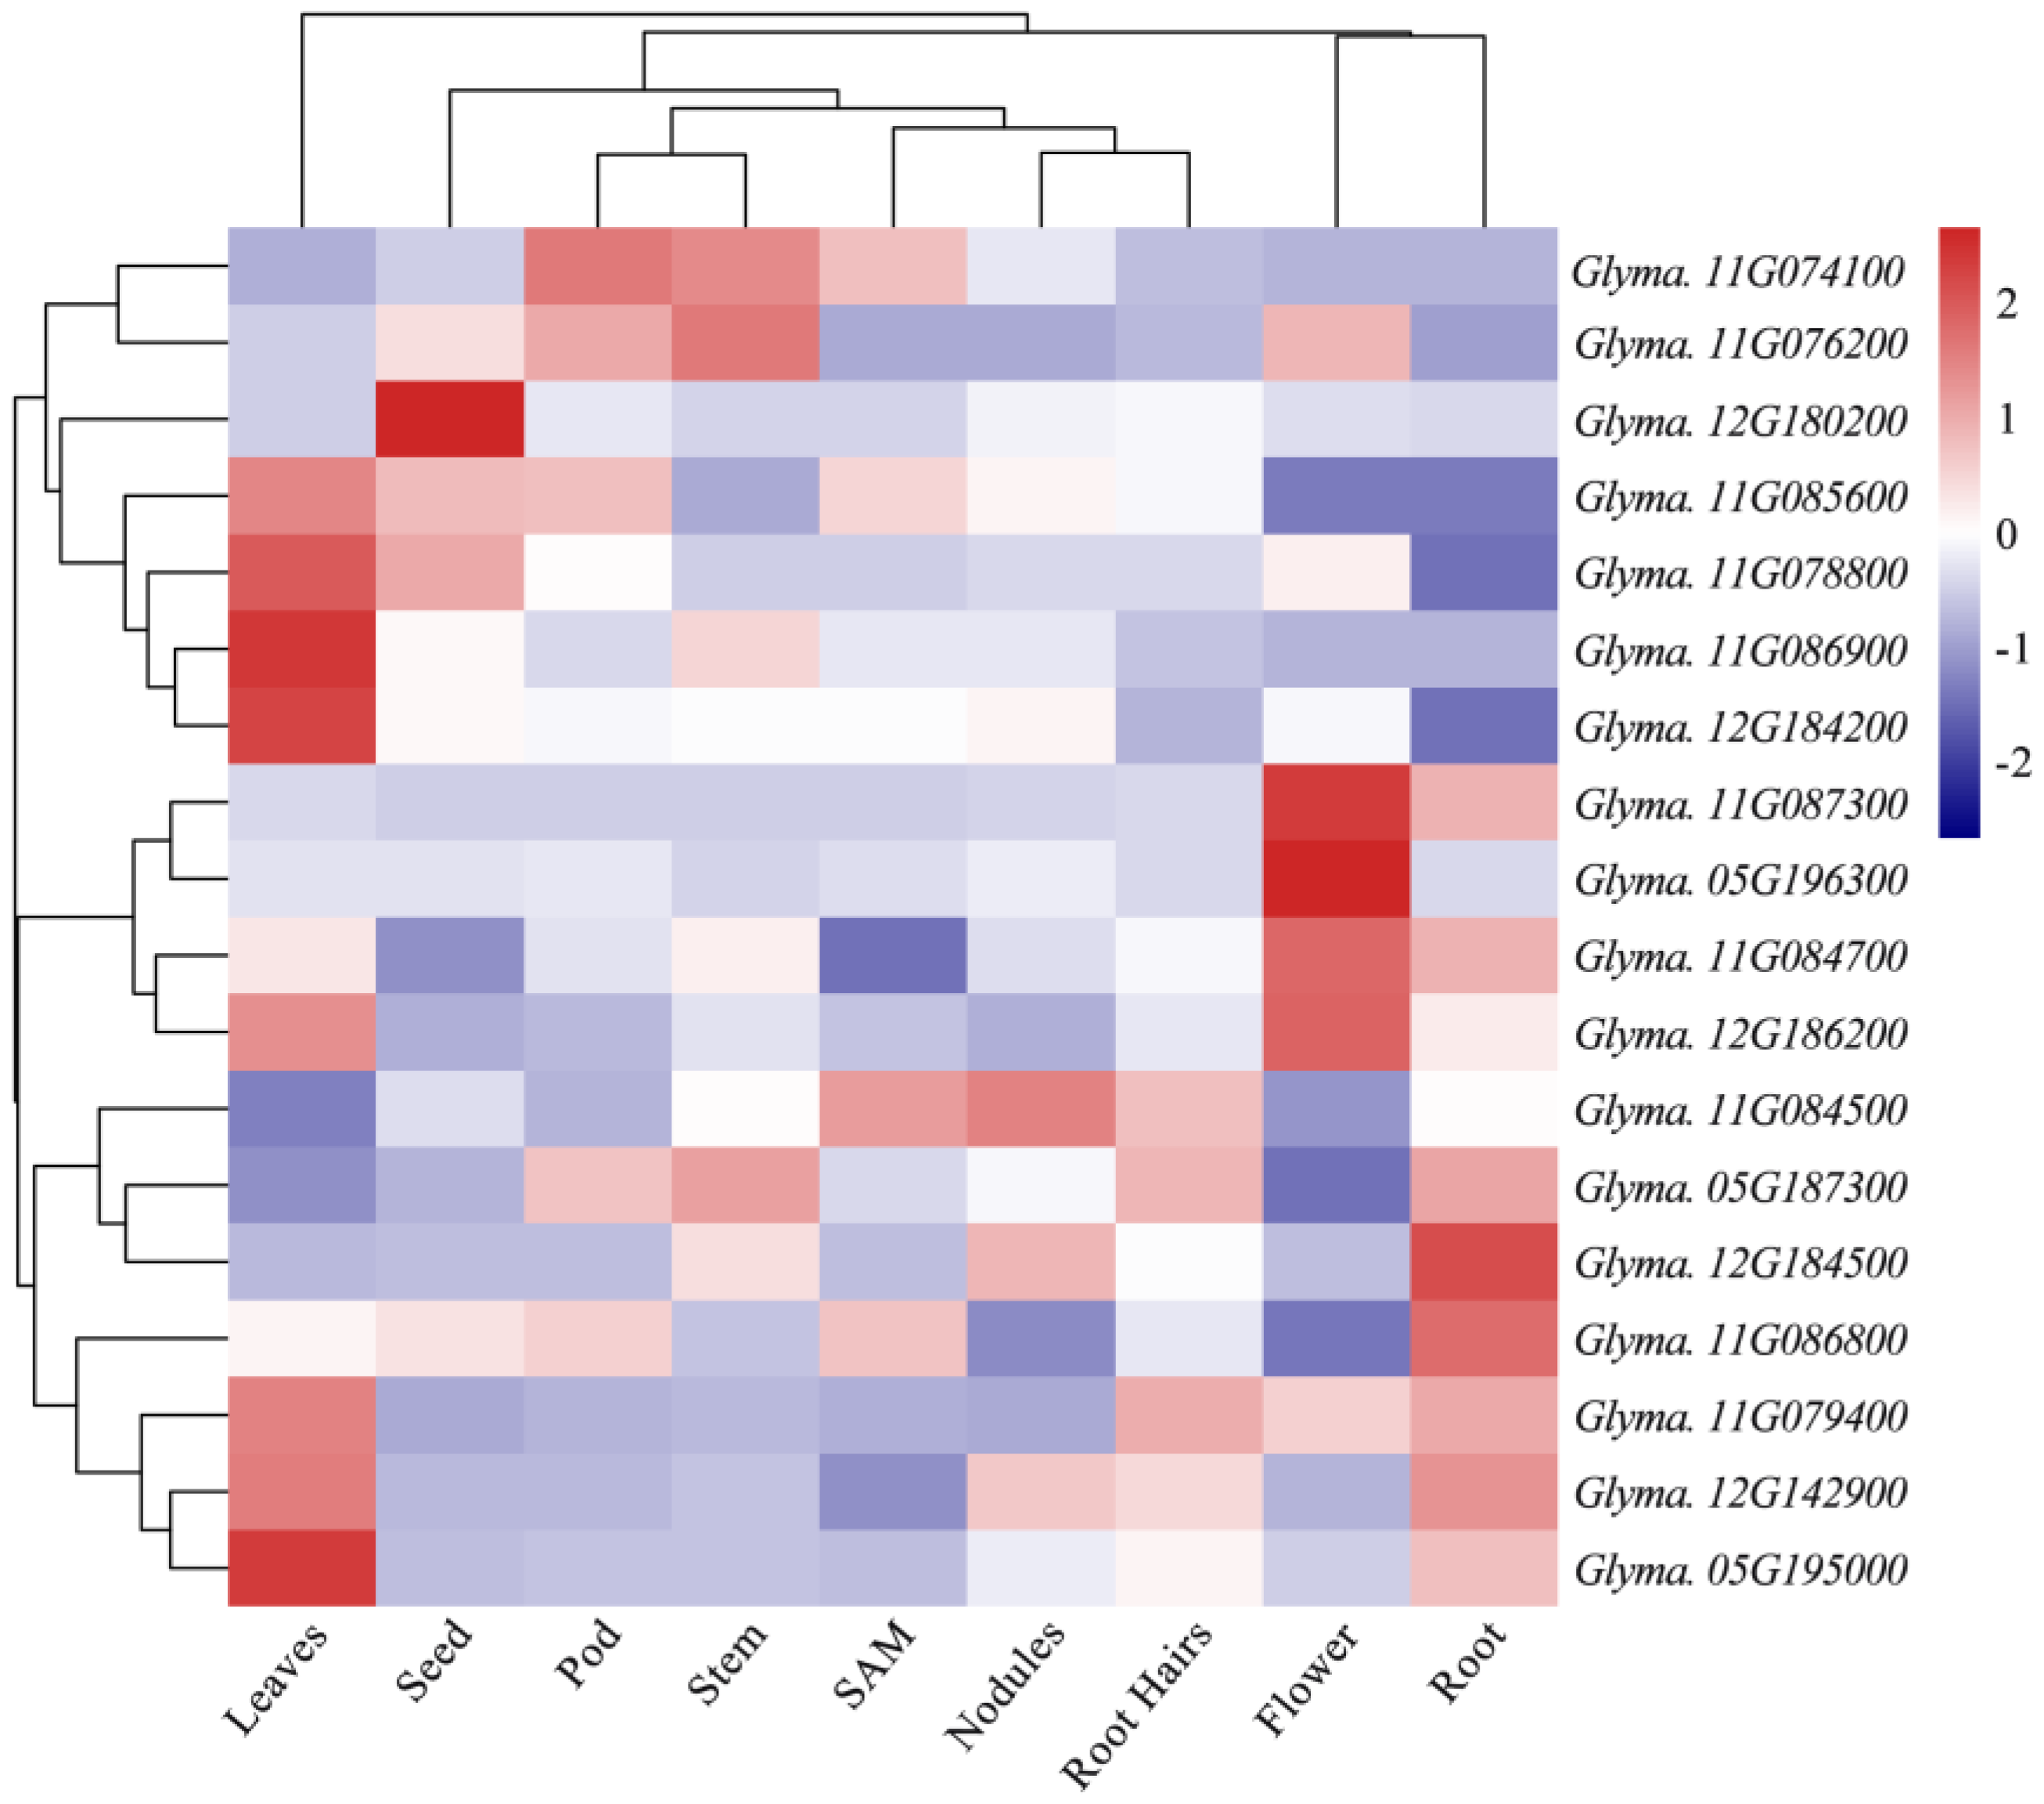
3.4. Functional Annotation of Candidate Genes

According to the four SNP markers BARC-017097-02199, Map-2213, BARC-014639-01604, and Map-2223, which have been determined to have great effects on phenotypic variation, and combined with the average LD decay distance of 544.01 kb, candidate genes were detected in the candidate intervals near four markers. In this study, candidate genes were predicted for PH, NN, BN, and DI, and a total of 18 candidate genes were obtained. According to homologous gene and function annotation, these candidate genes encode the pentatricopeptide repeat (PPR) superfamily protein, cytochrome P450 family proteins, SAUR auxin-responsive protein and auxin efflux carrier protein, GDSL lipase, cyclin and ubiquitin proteins, ubiquitin family protein, calcium-binding proteins, cellulose synthase, bZIP transcription factor family proteins, SAUR-like auxin-responsive protein, and NAC domain family proteins (Table 4).
The expression patterns of these candidate genes were downloaded from the Phytozome database, and comparative analysis found that: the PH candidate gene Glyma.11G74100 is specifically and highly expressed in stems, shoot apical meristems (SAM), and pods, while Glyma.11G084500 is in SAMs, nodules, and root hairs. In addition, Glyma.11G076200 is specifically expressed in stems. Furthermore, the candidate gene Glyma.12G142900 for NN is expressed in the node. The BN candidate gene Glyma.05G187300 has higher expression in the stem, and the DI candidate gene Glyma.12G184500 has higher expression in the stem and nodules. These genes are expressed significantly differentially in specific tissues, such as stems, SAMs, nodules, and leaves during soybean plant architecture development (Figure 4). Therefore, these genes may be potential candidate genes for plant architecture-related traits and may be involved in the process of regulating soybean plant architecture morphogenesis.

4. Discussion

Population size is an important factor in GWAS that affects the accuracy of association analysis. Increasing the number of samples in the population will broaden the genetic variation of the population and thus improve the power of the associations [50], thus generally using natural populations with wide genetic variation. Research has shown that a population of more than 300 materials may have high-precision association results [51,52,53,54]. However, in actual research, the population cannot expand indefinitely. The core collection uses the minimum set of accessions to represent the maximum genetic diversity of the entire germplasm resources [55,56], which is a favorable sampling population for GWAS mapping between target traits and markers [57,58]. There is abundant genetic variation in the Chinese soybean mini core collection utilized in this study, which is an ideal population for mining excellent loci or genes for complex traits.
In this study, field phenotype identification of four plant architecture-related traits in the soybean mini core collection was performed in three environments. There were extensive phenotypic variations in the four plant architecture traits in this collection. In addition, the heritability of PH and NN was higher, 93.92% and 89.25%, respectively. The heritability of BN and DI was lower, 69.97% and 73.05%, respectively (Table 1). This result is basically consistent with the heritability calculated by Zhang et al. [10]. Compared with PH and NN, BN and DI were easily affected by environmental factors, which is consistent with the ANOVA results. The NN of soybeans was positively correlated with PH [20], which is consistent with the results of our study (Table 2). Previous studies have confirmed that PH, NN, BN, and DI play a crucial role in soybean yield [59,60]. Therefore, the co-ordination and balance of soybean plant architecture-related traits could guarantee a high soybean yield.
The MLM (Q + K) model was used to analyze the association of four plant architecture traits in the soybean mini core collection. A total of 41 SNP markers that were significantly associated with the target traits identified under at least two environments, among which 19, 15, 8, and 6 were associated with PH, NN, BN, and DI, respectively. Among the 19 PH SNPs, five markers (BARC-014527-01571, Q-06-0128380, BARC-041421-07980, BARC-028861-06032, and BARC-017097-02199) co-located with NN, and two markers (Map-1899 and Q-18-0040883) co-located with DI at the same time. Among the 41 stable and significantly associated markers identified in total, 15 were located in the QTLs of the related traits reported, and 26 were new loci identified in this study (Table 3). Among these markers, BARC-017097-02199 and the co-localization marker Q-05-0207994 with NN are located within the QTL for PH and NN identified by an F2:10 RIL population [28]. In addition, four markers (Q-06-0128380, BARC-021425-04104, Q-18-0016625, and Q-18-0040883) overlapped with the reported plant height QTLs [37,38,41,42,43,44,45,47]. Among the eight SNP markers with a significant association with BN, the marker BARC-014639-01604 was located in the BN QTL detected using 236 F2 populations derived from the cross between Jiyu 50 and Jinong 18 [9]. In addition, PH and NN were significantly correlated, and the five co-localization markers for PH and NN indicated that there was a greater possibility of QTLs for PH and NN in the region where these markers were located.
The 18 candidate genes of plant architecture-related traits were preliminarily predicted based on the candidate intervals of four SNP markers (BARC-017097-02199, Map-2213, BARC-014639-01604, and Map-2223). Among them, the four PH candidate genes Glyma.11g078800, Glyma.11g085600, Glyma.11g086800, and Glyma.11g086900 and the DI candidate genes Glyma.12g184200 encode proteins belonging to members of the pentatricopeptide repeat (PPR) protein family. PPR proteins are at the core of post-transcriptional RNA modification [61]. In maize, ZmSMK9 encodes a P-type PPR protein, and Zmsmk9 mutants show not only delayed endosperm and embryo development but also upright leaf architecture [62]. These candidate genes encoding PPR proteins may be involved in the embryo development process, thereby affecting PH and DI. In addition, Glyma.11g074100 encodes a protein belonging to a member of the cytochrome P450 family. Cytochrome P450 plays important roles in biosynthesis pathways [63]. The cytochrome P450 gene, CYP85A2, was significantly associated with soybean plant architecture and yield traits, and the CC genotype of this locus was an excellent genotype for designing ideotypes and increasing yield [64]. In addition, tissue expression analysis showed that Glyma.11g074100 expressed specifically in stems and SAM (Figure 4). These results suggest that Glyma.11g074100 is a potential candidate gene for PH. The BN and PH candidate genes Glyma.05g196300 and Glyma.11g076200 both encode SAUR auxin response proteins. SAURs belong to the primary auxin response gene families [65]. SAUR39 acts as a negative regulator of auxin synthesis and transportation, regulating the growth rate, and increasing leaf and tiller angles in rice [66]. The PH candidate gene Glyma.11g084500 encodes a cyclin protein. Cyclin genes regulate the cell cycle of plants during growth and development. Ectopic overexpression of the Arabidopsis cyclinD2;1 (Arath; CYCD2;1) gene resulted in leaf curling, decreased fruiting branch number, and increased plant height in cotton [67].
Among NN candidate genes, Glyma.12g142900 encodes proteins belonging to the calcium-binding proteins family, which is an important component of the plant calcium signal transduction pathway. The overexpression of StCaM2, a potato calcium-binding protein, promotes plant growth and improves stress tolerance in tobacco [68]. For BN, the candidate gene Glyma.05g187300 encodes cellulose synthetase, and Glyma.05g195000 and the DI candidate gene Glyma.12g186200 both encode NAC transcription regulators. NAC transcription factors are involved in mediating auxin signaling to promote the formation of SAM and for regulating secondary wall synthesis in fibers [69,70]. The overexpression of OsmiR164b-resistant OsNAC2, which showed better plant architecture, produced more grains and significantly upregulated the grain number and plant architecture-related genes IPA1 and DEP1 [71]. The DI candidate gene Glyma.12g184500 encodes a bZIP transcription factor family protein. The rice transcription factor OsbZIP49 determines plant architecture by influencing the local homeostasis of the auxin [72]. Plant architecture-related traits are complex in the growth and development of soybean plants. The above candidate genes may be involved in growth and development, auxin synthesis and transportation, glycosylation reactions, cellulose synthesis, and other processes. These candidate genes will provide information for cloning ideotype genes of soybean.
At present, the trend of molecular breeding research all over the world is clarifying the genetic mechanism of important traits and mine-related genes for breeding and utilization. These new loci and candidate genes found in the Chinese soybean mini core collection could both enrich the gene network’s regulation of soybean plant architecture and be used to develop molecular markers to provide new gene resources for plant architecture molecular design breeding. The results of this study lay a foundation for the cloning and functional verification of ideotype genes, as well as provide a reference for the study of plant architecture of other crops.

5. Conclusions

In this study, a total of 41 stable and significant SNPs for plant architecture-related traits were found using 224 Chinese soybean mini core germplasm via GWAS, of which 26 were novel loci. In addition, four large-effect markers BARC-017097-02199, Map-2213, BARC-014639-01604, and Map-2223 were identified for PH, NN, BN, and DI, respectively. Based on gene annotation and tissue expression analysis, 18 promising candidate genes related to soybean plant architecture were predicted in the candidate interval where the large-effect markers were located. This study provides a reference for the genetic mechanism of soybean plant architecture-related traits, which has been the basis of molecular design breeding of the soybean ideotype.

Supplementary Materials

The following supporting information can be downloaded at: https://www.mdpi.com/article/10.3390/agronomy12040817/s1, Figure S1: Scatter plots and LD decay against physical distance among co-chromosomes. Figure S2: Distributions of pairwise relative kinship estimates between mini core collections. Figure S3: Population structure of soybean mini core collection. Figures S4–S7: Manhattan plots and Q-Q plots of GWAS for PH, NN, BN, and DI in three environments.

Author Contributions

Conceptualization, W.D., X.Z. and J.Z.; investigation, X.Z. and C.W.; formal analysis, W.D., X.Z. and D.L.; data curation, C.L. and R.S.; methodology, N.G.; Software, W.D. and X.J.; funding acquisition, J.Z. and H.X.; writing—original draft, W.D.; writing—review and editing, J.Z. and H.X. All authors have read and agreed to the published version of the manuscript.

Funding

This work was supported by China Agriculture Research System of MOF and MARA (CARS-04), National Natural Science Foundation of China (32072082), Program for Changjiang Scholars and Innovative Research Team in University (PCSIRT_17R55), Jiangsu Collaborative Innovation Center for Modern Crop Production (JCIC-MCP202101), Cyrus Tang Innovation Center for Seed Industry (CTIC-SI201902), and the Key R&D project of Jiangsu Province (BE2019376).

Institutional Review Board Statement

Not applicable.

Informed Consent Statement

Not applicable.

Data Availability Statement

The datasets supporting the results of this article are included within the main text and the supplementary materials.

Conflicts of Interest

The authors declare no conflict of interest.

References

  1. Qin, J.; Zhang, J.A.; Liu, D.; Yin, C.C.; Wang, F.M.; Chen, P.Y.; Chen, H.; Ma, J.B.; Zhang, B.; Xu, J.; et al. iTRAQ-based analysis of developmental dynamics in the soybean leaf proteome reveals pathways associated with leaf photosynthetic rate. Mol. Genet. Genomics 2016, 291, 1595–1605. [Google Scholar] [CrossRef]
  2. Kim, S.W.; Less, J.F.; Wang, L.; Yan, T.H.; Kiron, V.; Kaushik, S.J.; Lei, X.G. Meeting Global Feed Protein Demand: Challenge, Opportunity, and Strategy. Annu. Rev. Anim. Biosci. 2019, 7, 221–243. [Google Scholar] [CrossRef]
  3. Donald, C.M. The breeding of crop ideotypes. Euphytica 1968, 17, 385–403. [Google Scholar] [CrossRef]
  4. Huyghe, C. Genetics and genetic modifications of plant architecture in grain legumes: A review. Agronomie 1998, 18, 383–411. [Google Scholar] [CrossRef]
  5. Sarlikioti, V.; de Visser, P.H.B.; Buck-Sorlin, G.H.; Marcelis, L.F.M. How plant architecture affects light absorption and photosynthesis in tomato: Towards an ideotype for plant architecture using a functional–structural plant model. Ann. Bot. 2011, 108, 1065–1073. [Google Scholar] [CrossRef] [Green Version]
  6. Pan, Q.C.; Xu, Y.C.; Li, K.; Peng, Y.; Zhan, W.; Li, W.Q.; Li, L.; Yan, J.B. The Genetic Basis of Plant Architecture in 10 Maize Recombinant Inbred Line Populations. Plant Physiol. 2017, 175, 858–873. [Google Scholar] [CrossRef] [Green Version]
  7. Zhang, X.L.; Ding, W.T.; Xue, D.; Li, X.N.; Zhou, Y.; Shen, J.C.; Feng, J.Y.; Guo, N.; Qiu, L.J.; Xing, H.; et al. Genome-wide association studies of plant architecture-related traits and 100-seed weight in soybean landraces. BMC Genom. Data 2021, 22, 1–14. [Google Scholar] [CrossRef]
  8. Hill, W.G. Understanding and using quantitative genetic variation. Philos. Trans. R. Soc. B 2010, 365, 73–85. [Google Scholar] [CrossRef] [Green Version]
  9. Yao, D.; Liu, Z.Z.; Zhang, J.; Liu, S.Y.; Qu, J.; Guan, S.Y.; Pan, L.D.; Wang, D.; Liu, J.W.; Wang, P.W. Analysis of quantitative trait loci for main plant traits in soybean. GMR Genet. Mol. Res. 2015, 14, 6101–6109. [Google Scholar] [CrossRef]
  10. Zhang, H.R.; Hao, D.R.; Sitoe, H.M.; Yin, Z.T.; Hu, Z.B.; Zhang, G.Z.; Yu, D.Y. Genetic dissection of the relationship between plant architecture and yield component traits in soybean (Glycine max) by association analysis across multiple environments. Plant Breed. 2015, 134, 564–572. [Google Scholar] [CrossRef]
  11. Gupta, P.K.; Rustgi, S.; Kulwal, P.L. Linkage disequilibrium and association studies in higher plants: Present status and future prospects. Plant Mol. Biol. 2005, 57, 461–485. [Google Scholar] [CrossRef]
  12. Sehgal, D.; Singh, R.; Rajpal, V.R. Quantitative trait loci mapping in plants: Concepts and approaches. In Molecular Breeding for Sustainable Crop Improvement; Rajpal, V.R., Rao, S.R., Raina, S.N., Eds.; Springer International Publishing: Cham, Switzerland, 2016; Volume 2, pp. 31–59. [Google Scholar]
  13. Wang, Z.; Tian, Z.X. Genomics progress will facilitate molecular breeding in soybean. Sci. China Life Sci. 2015, 58, 813–815. [Google Scholar] [CrossRef] [Green Version]
  14. Flint-Garcia, S.A.; Thuillet, A.C.; Yu, J.M.; Pressoir, G.; Romero, S.M.; Mitchell, S.E.; Doebley, J.; Kresovich, S.; Goodman, M.M.; Buckler, E.S. Maize association population: A high-resolution platform for quantitative trait locus dissection. Plant J. 2005, 44, 1054–1064. [Google Scholar] [CrossRef]
  15. Atwell, S.; Huang, Y.S.; Vilhjalmsson, B.J.; Willems, G.; Horton, M.; Li, Y.; Meng, D.Z.; Platt, A.; Tarone, A.M.; Hu, T.T.; et al. Genome-wide association study of 107 phenotypes in Arabidopsis thaliana inbred lines. Nature 2010, 465, 627–631. [Google Scholar] [CrossRef]
  16. Chen, W.; Gao, Y.Q.; Xie, W.B.; Gong, L.; Lu, K.; Wang, W.S.; Li, Y.; Liu, X.Q.; Zhang, H.Y.; Dong, H.X.; et al. Genome-wide association analyses provide genetic and biochemical insights into natural variation in rice metabolism. Nat. Genet. 2014, 46, 714–721. [Google Scholar] [CrossRef]
  17. Guo, Z.F.; Chen, D.J.; Alqudah, A.M.; Roder, M.S.; Ganal, M.W.; Schnurbusch, T. Genome-wide association analyses of 54 traits identified multiple loci for the determination of floret fertility in wheat. New Phytol. 2017, 214, 257–270. [Google Scholar] [CrossRef]
  18. Fang, C.; Ma, Y.M.; Wu, S.W.; Liu, Z.; Wang, Z.; Yang, R.; Hu, G.H.; Zhou, Z.K.; Yu, H.; Zhang, M.; et al. Genome-wide association studies dissect the genetic networks underlying agronomical traits in soybean. Genome Biol. 2017, 18, 161. [Google Scholar] [CrossRef]
  19. Zhang, J.P.; Song, Q.J.; Cregan, P.B.; Nelson, R.L.; Wang, X.Z.; Wu, J.X.; Jiang, G.L. Genome-wide association study for flowering time, maturity dates and plant height in early maturing soybean (Glycine max) germplasm. BMC Genom. 2015, 16, 1–11. [Google Scholar] [CrossRef] [Green Version]
  20. Chang, F.G.; Guo, C.Y.; Sun, F.L.; Zhang, J.S.; Wang, Z.L.; Kong, J.J.; He, Q.Y.; Sharmin, R.A.; Zhao, T.J. Genome-Wide Association Studies for Dynamic Plant Height and Number of Nodes on the Main Stem in Summer Sowing Soybeans. Front. Recent Dev. Plant Sci. 2018, 9, 1184. [Google Scholar] [CrossRef] [Green Version]
  21. Shim, S.; Ha, J.; Kim, M.Y.; Choi, M.S.; Kang, S.T.; Jeong, S.C.; Moon, J.K.; Lee, S.H. GmBRC1 is a Candidate Gene for Branching in Soybean (Glycine max (L.) Merrill). Int. J. Mol. Sci. 2019, 20, 135. [Google Scholar] [CrossRef] [Green Version]
  22. Chen, L.M.; Fang, Y.H.; Li, X.Y.; Zeng, K.; Chen, H.F.; Zhang, H.B.; Yang, H.L.; Cao, D.; Hao, Q.N.; Yuan, S.L.; et al. Identification of soybean drought-tolerant genotypes and loci correlated with agronomic traits contributes new candidate genes for breeding. Plant Mol. Biol. 2020, 102, 109–122. [Google Scholar] [CrossRef] [PubMed]
  23. Fu, M.M.; Wang, Y.P.; Ren, H.X.; Du, W.G.; Yang, X.Y.; Wang, D.L.; Cheng, Y.X.; Zhao, J.M.; Gai, J.Y. Exploring the QTL–allele constitution of main stem node number and its differentiation among maturity groups in a Northeast China soybean population. Crop Sci. 2020, 60, 1223–1238. [Google Scholar] [CrossRef]
  24. Fahim, A.M.; Pan, L.Y.; Li, C.Y.; He, J.B.; Xing, G.N.; Wang, W.B.; Zhang, F.K.; Li, N.; Gai, J.Y. QTL-allele system of main stem node number in recombinant inbred lines of soybean (Glycine max) using association versus linkage mapping. Plant Breed. 2021, 140, 870–883. [Google Scholar] [CrossRef]
  25. Huang, J.; Guo, N.; Li, Y.H.; Sun, J.T.; Hu, G.J.; Zhang, H.P.; Li, Y.F.; Zhang, X.; Zhao, J.M.; Xing, H.; et al. Phenotypic evaluation and genetic dissection of resistance to Phytophthora sojae in the Chinese soybean mini core collection. BMC Genet. 2016, 17, 85. [Google Scholar] [CrossRef] [PubMed] [Green Version]
  26. Zhang, X.; Zhao, J.M.; Bu, Y.P.; Xue, D.; Liu, Z.X.; Li, X.N.; Huang, J.; Guo, N.; Wang, H.T.; Xing, H.; et al. Genome-Wide Association Studies of Soybean Seed Hardness in the Chinese Mini Core Collection. Plant Mol. Biol. Rep. 2018, 36, 605–617. [Google Scholar] [CrossRef]
  27. Li, X.N.; Zhou, Y.; Bu, Y.P.; Wang, X.F.; Zhang, Y.M.; Guo, N.; Zhao, J.M.; Xing, H. Genome-wide association analysis for yield-related traits at the R6 stage in a Chinese soybean mini core collection. Genes Genom. 2021, 43, 897–912. [Google Scholar] [CrossRef]
  28. Chen, Q.S.; Zhang, Z.C.; Liu, C.Y.; Xin, D.W.; Qiu, H.M.; Shan, D.P.; Shan, C.Y.; Hu, G.H. QTL Analysis of Major Agronomic Traits in Soybean. Agric. Sci. China 2007, 6, 399–405. [Google Scholar] [CrossRef]
  29. SAS Institute. Base SAS 9.4 Procedures Guide: Statistical Procedures; SAS Institute: Cary, NC, USA, 2013. [Google Scholar]
  30. Nyquist, W.E.; Baker, R.J. Estimation of heritability and prediction of selection response in plant populations. Crit. Rev. Plant Sci. 1991, 10, 235–322. [Google Scholar] [CrossRef]
  31. Li, Y.H.; Li, W.; Zhang, C.; Yang, L.A.; Chang, R.Z.; Gaut, B.S.; Qiu, L.J. Genetic diversity in domesticated soybean (Glycine max) and its wild progenitor (Glycine soja) for simple sequence repeat and single-nucleotide polymorphism loci. New Phytol. 2010, 188, 242–253. [Google Scholar] [CrossRef]
  32. Li, Y.H.; Reif, J.C.; Ma, Y.S.; Hong, H.L.; Liu, Z.X.; Chang, R.Z.; Qiu, L.J. Targeted association mapping demonstrating the complex molecular genetics of fatty acid formation in soybean. BMC Genom. 2015, 16, 841. [Google Scholar] [CrossRef] [Green Version]
  33. Zhang, D.; Kan, G.Z.; Hu, Z.B.; Cheng, H.; Zhang, Y.; Wang, Q.; Wang, H.; Yang, Y.M.; Li, H.Y.; Hao, D.R.; et al. Use of single nucleotide polymorphisms and haplotypes to identify genomic regions associated with protein content and water-soluble protein content in soybean. Theor. Appl. Genet. 2014, 127, 1905–1915. [Google Scholar] [CrossRef] [PubMed]
  34. Turner, S.D. qqman: An R package for visualizing GWAS results using Q-Q and manhattan plots. bioRxiv 2014. in preprint. [Google Scholar]
  35. Cichy, K.A.; Wiesinger, J.A.; Mendoza, F.A. Genetic diversity and genome-wide association analysis of cooking time in dry bean (Phaseolus vulgaris L.). Theor. Appl. Genet. 2015, 128, 1555–1567. [Google Scholar] [CrossRef]
  36. Liu, K.J.; Muse, S.V. PowerMarker: An integrated analysis environment for genetic marker analysis. Bioinformatics 2005, 21, 2128–2129. [Google Scholar] [CrossRef] [Green Version]
  37. Rossi, M.E.; Orf, J.H.; Liu, L.J.; Dong, Z.M.; Rajcan, I. Genetic basis of soybean adaptation to North American vs. Asian mega-environments in two independent populations from Canadian × Chinese crosses. Theor. Appl. Genet. 2013, 126, 1809–1823. [Google Scholar] [CrossRef] [PubMed]
  38. Sun, D.S.; Li, W.B.; Zhang, Z.C.; Chen, Q.S.; Ning, H.L.; Qiu, L.J.; Sun, G.L. Quantitative trait loci analysis for the developmental behavior of Soybean (Glycine max L. Merr.). Theor. Appl. Genet. 2006, 112, 665–673. [Google Scholar] [CrossRef]
  39. Kim, K.S.; Diers, B.W.; Hyten, D.L.; Mian, M.A.R.; Shannon, J.G.; Nelson, R.L. Identification of positive yield QTL alleles from exotic soybean germplasm in two backcross populations. Theor. Appl. Genet. 2012, 125, 1353–1369. [Google Scholar] [CrossRef] [Green Version]
  40. Guzman, P.S.; Diers, B.W.; Neece, D.J.; Martin, S.K.S.; Leroy, A.R.; Grau, C.R.; Hughes, T.J.; Nelson, R.L. QTL Associated with Yield in Three Backcross-Derived Populations of Soybean. Crop Sci. 2007, 47, 111–122. [Google Scholar] [CrossRef]
  41. Orf, J.H.; Chase, K.; Jarvik, T.; Mansur, L.M.; Cregan, P.B.; Adler, F.R.; Lark, K.G. Genetics of Soybean Agronomic Traits: I. Comparison of Three Related Recombinant Inbred Populations. Crop Sci. 1999, 39, 1642–1651. [Google Scholar] [CrossRef] [Green Version]
  42. Kabelka, E.A.; Diers, B.W.; Fehr, W.R.; LeRoy, A.R.; Baianu, I.C.; You, T.; Neece, D.J.; Nelson, R.L. Putative Alleles for Increased Yield from Soybean Plant Introductions. Crop Sci. 2004, 44, 784–791. [Google Scholar] [CrossRef]
  43. Palomeque, L.; Liu, L.J.; Li, W.B.; Hedges, B.; Cober, E.R.; Rajcan, I. QTL in mega-environments: II. Agronomic trait QTL co-localized with seed yield QTL detected in a population derived from a cross of high-yielding adapted × high-yielding exotic soybean lines. Theor. Appl. Genet. 2009, 119, 429–436. [Google Scholar] [CrossRef] [PubMed]
  44. Gai, J.Y.; Wang, Y.J.; Wu, X.L.; Chen, S.Y. A comparative study on segregation analysis and QTL mapping of quantitative traits in plants—with a case in soybean. Front. Agric. China 2007, 1, 1–7. [Google Scholar] [CrossRef]
  45. Liu, W.X.; Kim, M.Y.; Van, K.; Lee, Y.-H.; Li, H.; Liu, X.H.; Lee, S.H. QTL Identification of Yield-Related Traits and their Association with Flowering and Maturity in Soybean. J. Crop Sci. Biotechnol. 2011, 14, 65–70. [Google Scholar] [CrossRef]
  46. Wang, D.; Graef, G.L.; Procopiuk, A.M.; Diers, B.W. Identification of putative QTL that underlie yield in interspecific soybean backcross populations. Theor. Appl. Genet. 2004, 108, 458–467. [Google Scholar] [CrossRef]
  47. Reinprecht, Y.; Poysa, V.W.; Yu, K.F.; Rajcan, I.; Ablett, G.R.; Pauls, K.P. Seed and agronomic QTL in low linolenic acid, lipoxygenase-free soybean (Glycine max (L.) Merrill) germplasm. Genome 2006, 49, 1510–1527. [Google Scholar] [CrossRef] [PubMed]
  48. Mansur, L.M.; Lark, K.G.; Kross, H.; Oliveira, A. Interval mapping of quantitative trait loci for reproductive, morphological, and seed traits of soybean (Glycine max L.). Theor. Appl. Genet. 1993, 86, 907–913. [Google Scholar] [CrossRef]
  49. Lee, S.H.; Bailey, M.A.; Mian, M.A.R.; Shipe, E.R.; Ashley, D.A.; Parrott, W.A.; Hussey, R.S.; Boerma, H.R. Identification of quantitative trait loci for plant height, lodging, and maturity in a soybean population segregating for growth habit. Theor. Appl. Genet. 1996, 92, 516–523. [Google Scholar] [CrossRef]
  50. Korte, A.; Farlow, A. The advantages and limitations of trait analysis with GWAS: A review. Plant Methods 2013, 9, 29. [Google Scholar] [CrossRef] [Green Version]
  51. Wang, X.L.; Wang, H.W.; Liu, S.X.; Ferjani, A.; Li, J.S.; Yan, J.B.; Yang, X.H.; Qin, F. Genetic variation in ZmVPP1 contributes to drought tolerance in maize seedlings. Nat. Genet. 2016, 48, 1233–1241. [Google Scholar] [CrossRef]
  52. Wang, M.; Li, W.Z.; Fang, C.; Xu, F.; Liu, Y.C.; Wang, Z.; Yang, R.; Zhang, M.; Liu, S.L.; Lu, S.J.; et al. Parallel selection on a dormancy gene during domestication of crops from multiple families. Nat. Genet. 2018, 50, 1435–1441. [Google Scholar] [CrossRef]
  53. Li, N.; Lin, B.; Wang, H.; Li, X.M.; Yang, F.F.; Ding, X.H.; Yan, J.B.; Chu, Z.H. Natural variation in ZmFBL41 confers banded leaf and sheath blight resistance in maize. Nat. Genet. 2019, 51, 1540–1548. [Google Scholar] [CrossRef] [PubMed]
  54. Lu, S.J.; Dong, L.D.; Fang, C.; Liu, S.L.; Kong, L.P.; Cheng, Q.; Chen, L.Y.; Su, T.; Nan, H.Y.; Zhang, D.; et al. Stepwise selection on homeologous PRR genes controlling flowering and maturity during soybean domestication. Nat. Genet. 2020, 52, 428–436. [Google Scholar] [CrossRef] [PubMed]
  55. Frankel, O.H.; Brown, A.H.D. Current plant genetic resources—A critical appraisal. In Genetics: New Frontiers; Oxford & IBH Publishing: New Delhi, India, 1984; Volume IV, pp. 1–11. [Google Scholar]
  56. Brown, A.H.D. Core collections: A practical approach to genetic resources management. Genome 1989, 31, 818–824. [Google Scholar] [CrossRef]
  57. Zhang, P.; Zhong, K.Z.; Shahid, M.Q.; Tong, H.H. Association Analysis in Rice: From Application to Utilization. Front. Recent Dev. Plant Sci. 2016, 7, 1202. [Google Scholar] [CrossRef] [Green Version]
  58. Schlappi, M.R.; Jackson, A.K.; Eizenga, G.C.; Wang, A.J.; Chu, C.C.; Shi, Y.; Shimoyama, N.; Boykin, D.L. Assessment of Five Chilling Tolerance Traits and GWAS Mapping in Rice Using the USDA Mini-Core Collection. Front. Plant Sci. 2017, 8, 957. [Google Scholar] [CrossRef] [Green Version]
  59. Oz, M.; Karasu, A.; Goksoy, A.T.; Turan, Z.M. Interrelationships of Agronomical Characteristics in Soybean (Glycine max) Grown in Different Environments. Int. J. Agric. Biol. 2009, 11, 85–88. [Google Scholar]
  60. Asanome, N.; Ikeda, T. Effect of Branch Direction’s Arrangement on Soybean Yield and Yield Components. J. Agron. Crop Sci. 1998, 181, 95–102. [Google Scholar] [CrossRef]
  61. Guillaumot, D.; Lopez-Obando, M.; Baudry, K.; Avon, A.; Rigaill, G.; de Longevialle, A.F.; Broche, B.; Takenaka, M.; Berthome, R.; De Jaeger, G.; et al. Two interacting PPR proteins are major Arabidopsis editing factors in plastid and mitochondria. Proc. Natl. Acad. Sci. USA 2017, 114, 8877–8882. [Google Scholar] [CrossRef] [Green Version]
  62. Pan, Z.Y.; Liu, M.; Xiao, Z.Y.; Ren, X.M.; Zhao, H.L.; Gong, D.M.; Liang, K.; Tan, Z.D.; Shao, Y.Q.; Qiu, F.Z. ZmSMK9, a pentatricopeptide repeat protein, is involved in the cis-splicing of nad5, kernel development and plant architecture in maize. Plant Sci. 2019, 288, 110205. [Google Scholar] [CrossRef]
  63. Schuler, M.A.; Werck-Reichhart, D. Functional Genomics of P450S. Annu. Rev. Plant Biol. 2003, 54, 629–667. [Google Scholar] [CrossRef]
  64. Yang, C.M.; Yan, J.; Jiang, S.Q.; Li, X.; Min, H.W.; Wang, X.F.; Hao, D.Y. Resequencing 250 soybean accessions: New insights into genes associated with agronomic traits and genetic networks. bioRxiv 2021, in press. [Google Scholar] [CrossRef] [PubMed]
  65. Hagen, G.; Guilfoyle, T. Auxin-responsive gene expression: Genes, promoters and regulatory factors. Plant Mol. Biol. 2002, 49, 373–385. [Google Scholar] [CrossRef] [PubMed]
  66. Kant, S.; Bi, Y.M.; Zhu, T.; Rothstein, S.J. SAUR39, a Small Auxin-Up RNA Gene, Acts as a Negative Regulator of Auxin Synthesis and Transport in Rice. Plant Physiol. 2009, 151, 691–701. [Google Scholar] [CrossRef] [PubMed] [Green Version]
  67. Liu, G.Z.; Jin, S.X.; Liu, X.Y.; Tan, J.F.; Yang, X.Y.; Zhang, X.L. Overexpression of Arabidopsis cyclin D2;1 in cotton results in leaf curling and other plant architectural modifications. Plant Cell, Tissue Organ Cult. 2012, 110, 261–273. [Google Scholar] [CrossRef]
  68. Raina, M.; Kumar, A.; Yadav, N.; Kumari, S.; Yusuf, M.A.; Mustafiz, A.; Kumar, D. StCaM2, a calcium binding protein, alleviates negative effects of salinity and drought stress in tobacco. Plant Mol. Biol. 2021, 106, 85–108. [Google Scholar] [CrossRef] [PubMed]
  69. Zimmermann, R.; Werr, W. Pattern Formation in the Monocot Embryo as Revealed by NAM and CUC3 Orthologues from Zea mays L. Plant Mol. Biol. 2005, 58, 669–685. [Google Scholar] [CrossRef]
  70. Zhong, R.Q.; Richardson, E.A.; Ye, Z.H. Two NAC domain transcription factors, SND1 and NST1, function redundantly in regulation of secondary wall synthesis in fibers of Arabidopsis. Planta 2007, 225, 1603–1611. [Google Scholar] [CrossRef]
  71. Jiang, D.G.; Chen, W.T.; Dong, J.F.; Li, J.; Yang, F.; Wu, Z.C.; Zhou, H.; Wang, W.S.; Zhuang, C.X. Overexpression of miR164b-resistant OsNAC2 improves plant architecture and grain yield in rice. J. Exp. Bot. 2018, 69, 1533–1543. [Google Scholar] [CrossRef] [Green Version]
  72. Ding, C.H.; Lin, X.H.; Zuo, Y.; Yu, Z.L.; Baerson, S.R.; Pan, Z.Q.; Zeng, R.S.; Song, Y.Y. Transcription factor OsbZIP49 controls tiller angle and plant architecture through the induction of indole-3-acetic acid-amido synthetases in rice. Plant J. 2021, 108, 1346–1364. [Google Scholar] [CrossRef]
Figure 1. Boxplots of four plant architecture-related traits in soybean mini core collection in three environments. (ad) Boxplots of PH, NN, BN, and DI.
Agronomy 12 00817 g001
Figure 2. Frequency distribution of plant architecture-related traits in soybean mini core collection. (ad) Frequency distribution of PH, NN, BN, and DI.
Agronomy 12 00817 g002
Figure 3. Manhattan and Q-Q plots of the GWAS for the four plant architecture-related traits in soybean mini core collection. The horizontal red line indicates the genome-wide significance threshold (−log10(p) ≥ 2). (ad) Association mapping of PH, NN, BN, and DI based on the mean values of three environments, respectively.
Agronomy 12 00817 g003
Figure 4. Heatmap profiles of the candidate genes in tissues. The color scale represents increased (red) and decreased (navy blue) fold change in the levels of candidate genes transcripts. The horizontal axis represents different soybean tissues (leaves, seed, pod, stem, SAM, nodules, root hairs, flower, and root), and the vertical axis stands for different candidate genes.
Agronomy 12 00817 g004
Table 1. Descriptive statistic, analysis of variance, and heritability (h2) of plant architecture-related traits in soybean mini core collection.
TraitsEnvironmentsMeanSDMinMaxSignificanceh2 (%)
FGFEFG×E
PH2016JP45.4316.5821.64101113.37 **7305.66 **13.19 **89.25
2017JP73.1730.6627.5177.67
2017DT100.7240.3424249.33
Mean69.728.0628.06165.52
NN2016JP15.363.989.1129.482.87 **627.76 **5.39 **93.92
2017JP17.434.419.3327.67
2017DT184.231028.83
Mean16.75410.1527.6
BN2016JP2.821.270.339.8913.62 **20.63 **4.22 **69.97
2017JP2.541.2307.33
2017DT2.681.180.176.67
Mean2.680.990.676.28
DI2016JP4.510.832.98.8522.41 **1797.21 **4.87 **73.05
2017JP5.721.243.3610.66
2017DT6.691.422.3711.8
Mean5.5612.949.29
PH: plant height; NN: number of nodes on main stem; BN: branch number; DI: stem diameter; FG represents the genotype effect; FE represents the environment effect; FG×E represents the interaction effect of genotype and environment; ** represents significant at p ≤ 0.01.
Table 2. Correlation analysis of plant architecture-related traits in soybean.
TraitsPHNNBNDI
PH1
NN0.878 **1
BN0.487 **0.507 **1
DI0.542 **0.522 **0.422 **1
** Represents significant at p ≤ 0.01; PH: plant height; NN: number of nodes on main stem; BN: branch number; DI: stem diameter.
Table 3. Significantly associated SNPs of plant architecture-related traits in soybean mini core collection.
TraitMarkersChromosomePosition (bp)AllelicEnvironments−log10(p)R2 (%)References
PHQ-02-0147081229,025,631A/C2016JP/2017JP/Mean2.01–3.153.22–6.04[37,38,39]
Q-02-0158174231,120,457A/C2016JP/2017JP/Mean2.14–3.073.39–5.54
Q-02-0159217231,236,629A/G2016JP/2017JP/ 2017DT/Mean2.07–4.144.15–8.19
Q-02-0164155231,724,101A/G2016JP/2017JP/Mean2.29–3.273.68–5.72
Q-05-0207994540,057,732A/G2016JP/2017JP/Mean2.27–2.643.91–4.38[28]
BARC-014527-015716656,098C/T2016JP/2017DT/Mean2.13–2.695.18–5.97[40]
Q-06-0128380617,613,829A/C2016JP/2017JP/Mean2.08–2.44.54–5.3[37,41,42,43]
BARC-021425-04104648,403,137A/C2016JP/2017JP/Mean2.27–3.065.22–6.76[44,45]
Map-125577,190,281A/T2017JP/Mean2.66–3.464.42–6.6[46]
BARC-041421-07980944,020,453A/T2016JP/2017JP/ 2017DT/Mean2.02–3.444.89–7.96
BARC-028861-06032948,977,064A/G2017JP/2017DT/Mean2.01–2.24.24–5.23
Map-18991044,738,812A/C2016JP/2017DT2.25–2.313.62–4.75
BARC-017097-02199116,030,644A/G2016JP/2017JP/ 2017DT/Mean2.14–4.625.08–10.48[28]
Map-25161343,492,402A/C2016JP/Mean2.34–2.523.79–4.18[10]
Q-14-0026827143,164,755A/C2017JP/2017DT/Mean2.07–2.543.25–5.26
Q-18-0016625181,921,789A/T2017DT/Mean2.05–2.074.64–5.79[47]
Q-18-0040883184,329,135A/G2016JP/Mean2.2–2.33.5–3.71[38]
Map-39901945,340,653A/G2016JP/Mean2.25–2.845.12–6.34[48,49]
Q-20-02606302043,442,146A/C2017DT/Mean2.04–2.994.09–5.12
NNMap-0076133,989,570C/G2016JP/2017DT/Mean2.06–5.055.62–11.27
BARC-014287-0130654,279,362C/T2017JP/2017DT2.77–3.376.5–9.44
BARC-014527-015716656,098C/T2016JP/Mean2.63–2.885.88–6.35
Q-06-0128380617,613,829A/C2017JP/Mean2.08–2.614.55–5.96
Q-08-0277446843,136,899A/T2017JP/2017DT/Mean2.11–2.623.89–4.38
BARC-041421-07980944,020,453A/T2017DT/Mean2.22–2.545.75–6.19
BARC-028861-06032948,977,064A/G2017JP/2017DT2.08–2.264.59–4.84
BARC-017097-02199116,030,644A/G2016JP/2017JP/Mean2.23–3.635.21–8.23[28]
Map-20261125,164,685A/T2016JP/2017JP/ 2017DT/Mean2.12–3.043.57–6.56
Map-22111217,971,162A/G2016JP/2017JP/ 2017DT/Mean2.47–3.116.61–6.83
Map-22131218,455,502A/C2016JP/2017JP/ 2017DT/Mean2.2–3.46.2–7.76
Map-22181223,616,522C/G2017JP/Mean2.92–3.085.23–5.36
Q-15-03640551549,261,407A/T2017DT/Mean2.02–2.333.17–4.72
Q-15-03646291549,325,995A/C2017DT/Mean2–2.333.14–4.73
BARC-030259-068402038,262,189A/G2016JP/2017JP/Mean2.06–2.083.31–3.51
BNBARC-014639-01604537,602,081A/T2017JP/Mean3.67–4.28.42–10.1[9]
Q-07-008810178,771,610A/G2016JP/Mean2.25–2.493.85–4.34
BARC-013587-01169810,563,212C/G2017JP/Mean2.02–2.284.74–5.15
Q-08-0094591812,454,445A/G2017DT/Mean2.01–2.643.65–4.48
Map-24911337,273,176A/T2016JP/Mean2.37–2.414.09–4.11
BARC-039561-075081448,880,009C/T2017JP/Mean2.68–3.994.64–7.82
BARC-016029-020401515,125,233A/G2017JP/Mean2.07–2.194.7–5.23
BARC-018645-03217174,097,240A/G2017JP/Mean2.2–2.365.04–5.67
DIQ-05-0193181542,009,549A/C2017DT/Mean2.08–2.273.61–3.81
Q-08-005970888,402,455A/G2017JP/Mean2.13–2.334.66–5.29
Map-18991044,738,812A/C2016JP/2017JP2.16–2.33.52–3.8
Map-22231234,510,897A/G2017JP/2017DT2.24–2.784.98–7.09
Q-15-0012218151,858,944A/G2016JP/2017DT2.26–2.345.28–5.73
Q-18-0040883184,329,135A/G2017JP/Mean2.08–2.273.24–3.74
Table 4. Function annotation for candidate genes of plant architecture-related traits in soybean.
TraitsCandidate GenesHomologous GeneFunction Annotation
PHGlyma.11g074100AT4G36220Cytochrome P450 (CYP84A1, FAH1)
Glyma.11g076200AT4G38860SAUR-like auxin-responsive protein family
Glyma.11g078800AT1G80550Pentatricopeptide repeat (PPR) superfamily protein
Glyma.11g079400AT1G75900GDSL-like Lipase/Acylhydrolase superfamily protein
Glyma.11g084500AT1G20610Cyclin B2;3
Glyma.11g084700AT2G17200Ubiquitin family protein
Glyma.11g085600AT1G18485Pentatricopeptide repeat (PPR) superfamily protein
Glyma.11g086800AT2G17525Pentatricopeptide repeat (PPR) superfamily protein
Glyma.11g086900AT2G17525Pentatricopeptide repeat (PPR) superfamily protein
Glyma.11g087300AT5G65980Auxin efflux carrier family protein
NNGlyma.12g142900AT4G27280Calcium-binding EF-hand family protein
BNGlyma.05g187300AT5G64740Cellulose synthase 6
Glyma.05g195000AT1G01720NAC domain transcriptional regulator superfamily protein
Glyma.05g196300AT2G46690SAUR-like auxin-responsive protein family
DIGlyma.12g180200AT5G22810GDSL-like Lipase/Acylhydrolase superfamily protein
Glyma.12g184200AT3G62890Pentatricopeptide repeat (PPR) superfamily protein
Glyma.12g184500AT1G08320bZIP transcription factor family protein
Glyma.12g186200AT5G22380NAC domain containing protein 90
Publisher’s Note: MDPI stays neutral with regard to jurisdictional claims in published maps and institutional affiliations.

