1. Introduction
Water scarcity is one of the major challenges of our time that is expected to intensify as a result of climate change, and agriculture is both a major cause and casualty of it. On average, agriculture accounts for 70% of global freshwater withdrawals [
1]. Thus, to guarantee the sustainability of agrifood production systems, growing pressure is placed on agriculture to more sustainably use water.
The wine industry is among the most important industries for which sustainable production has become a goal [
2]. According to recent data, more than 7.3 million hectares are used for viticulture [
3], and water use is one of the main concerns of the wine industry about its environmental impact [
4].
Luckily, consumer awareness of the environmental impact of their food purchase decisions has significantly grown in the last few years [
5], and they are becoming decisive actors in implementing measurements that lead to more sustainable production. At the end of the production chain, and regardless of this chain’s length, consumers make a decision at points of sale whether to buy a product or not. This decision may be strongly influenced by the product credence attributes, i.e., all those characteristics related to health, production methods, environmental and social orientation, certification systems, etc. [
6] provided by the seller.
Labeling plays a key role in drawing consumers’ attention and providing information that may influence their purchase decisions [
7,
8,
9]. To the best of our knowledge, only two studies have investigated consumer preferences for wines produced with reduced water use [
10,
11]. The latter study focused on young Italian consumers, and reported that, on average, they are willing to pay higher prices for ‘low water footprint-’ labeled wines. The water footprint concept was developed by Hoekstra’s research group as an indicator to represent the freshwater resources needed to produce a product unit and corresponds to the volumetric measure of freshwater use and the impact of pollution [
12]. It is a very useful concept from a research point of view, but for the time being, it still seems like an unclear concept as far as consumers are concerned [
13]. As stated by Tait et al. [
14], more research efforts are required to assist the wine industry in developing communication strategies related to sustainability aspects by means of labeling.
One of the main strategies to save water and increase the production system’s sustainability of vineyards is to apply controlled deficit irrigation. Many studies have evaluated the response of vines to this practice from the agronomic and physico-chemical points of view [
15,
16]. However, there is no literature about consumer perceptions of wine produced by sustainable irrigation (SI) practices.
In today’s context, a profounder understanding of consumer attitudes and their buying motives as regards different sustainability attributes is necessary [
2], and sustainable irrigation is one of them. As stated by Sanchez-Bravo et al. [
17], further research is necessary to fully understand the commercial actions taken by consumers in relation to water-saving products.
As previously commented, labeling has a very strong impact on consumer purchase decisions. Label formats are decisive in the effectiveness of transmitting information to consumers, and label designs may significantly influence consumers’ interests and preferences [
18,
19,
20]. Oliveira et al. [
21] performed a study with probiotic milks and reported that consumers’ health-related associations were generated by graphic designs, and not by textual product descriptions (i.e., probiotic milk). Claims position may also influence consumers’ responses. There are reports that consumers attach more importance to front-labels than to back-labels when deciding on which wine to buy [
22]. Moreover, several studies support the notion that not all the information that customers are provided with on labels is read, and too much information can mean that consumers do not assimilate it all [
23,
24,
25].
By bearing all this in mind, the main objective of this study was to evaluate consumers’ responses to SI-labeled wines by paying special attention to the label design effect. Thus, our approach was to compare consumers’ responses to two SI-claims (logo vs. text), mainly about preferences and choice reasons, and then to capture and assimilate the provided information. This study was designed to answer the following questions: (1) Are consumers interested in SI-labeled wines and why? (2) Do consumers’ responses depend on the type of SI claim (logo-label vs. text-label)? (3) Is there a link between the attention paid to labels/claims and choice?; (4) Are consumers willing to pay an extra cost for SI-labeled wines? (5) Is the SI-claim position (front- vs. back-label) a determinant for consumers’ response?
2. Materials and Methods
2.1. Research Design
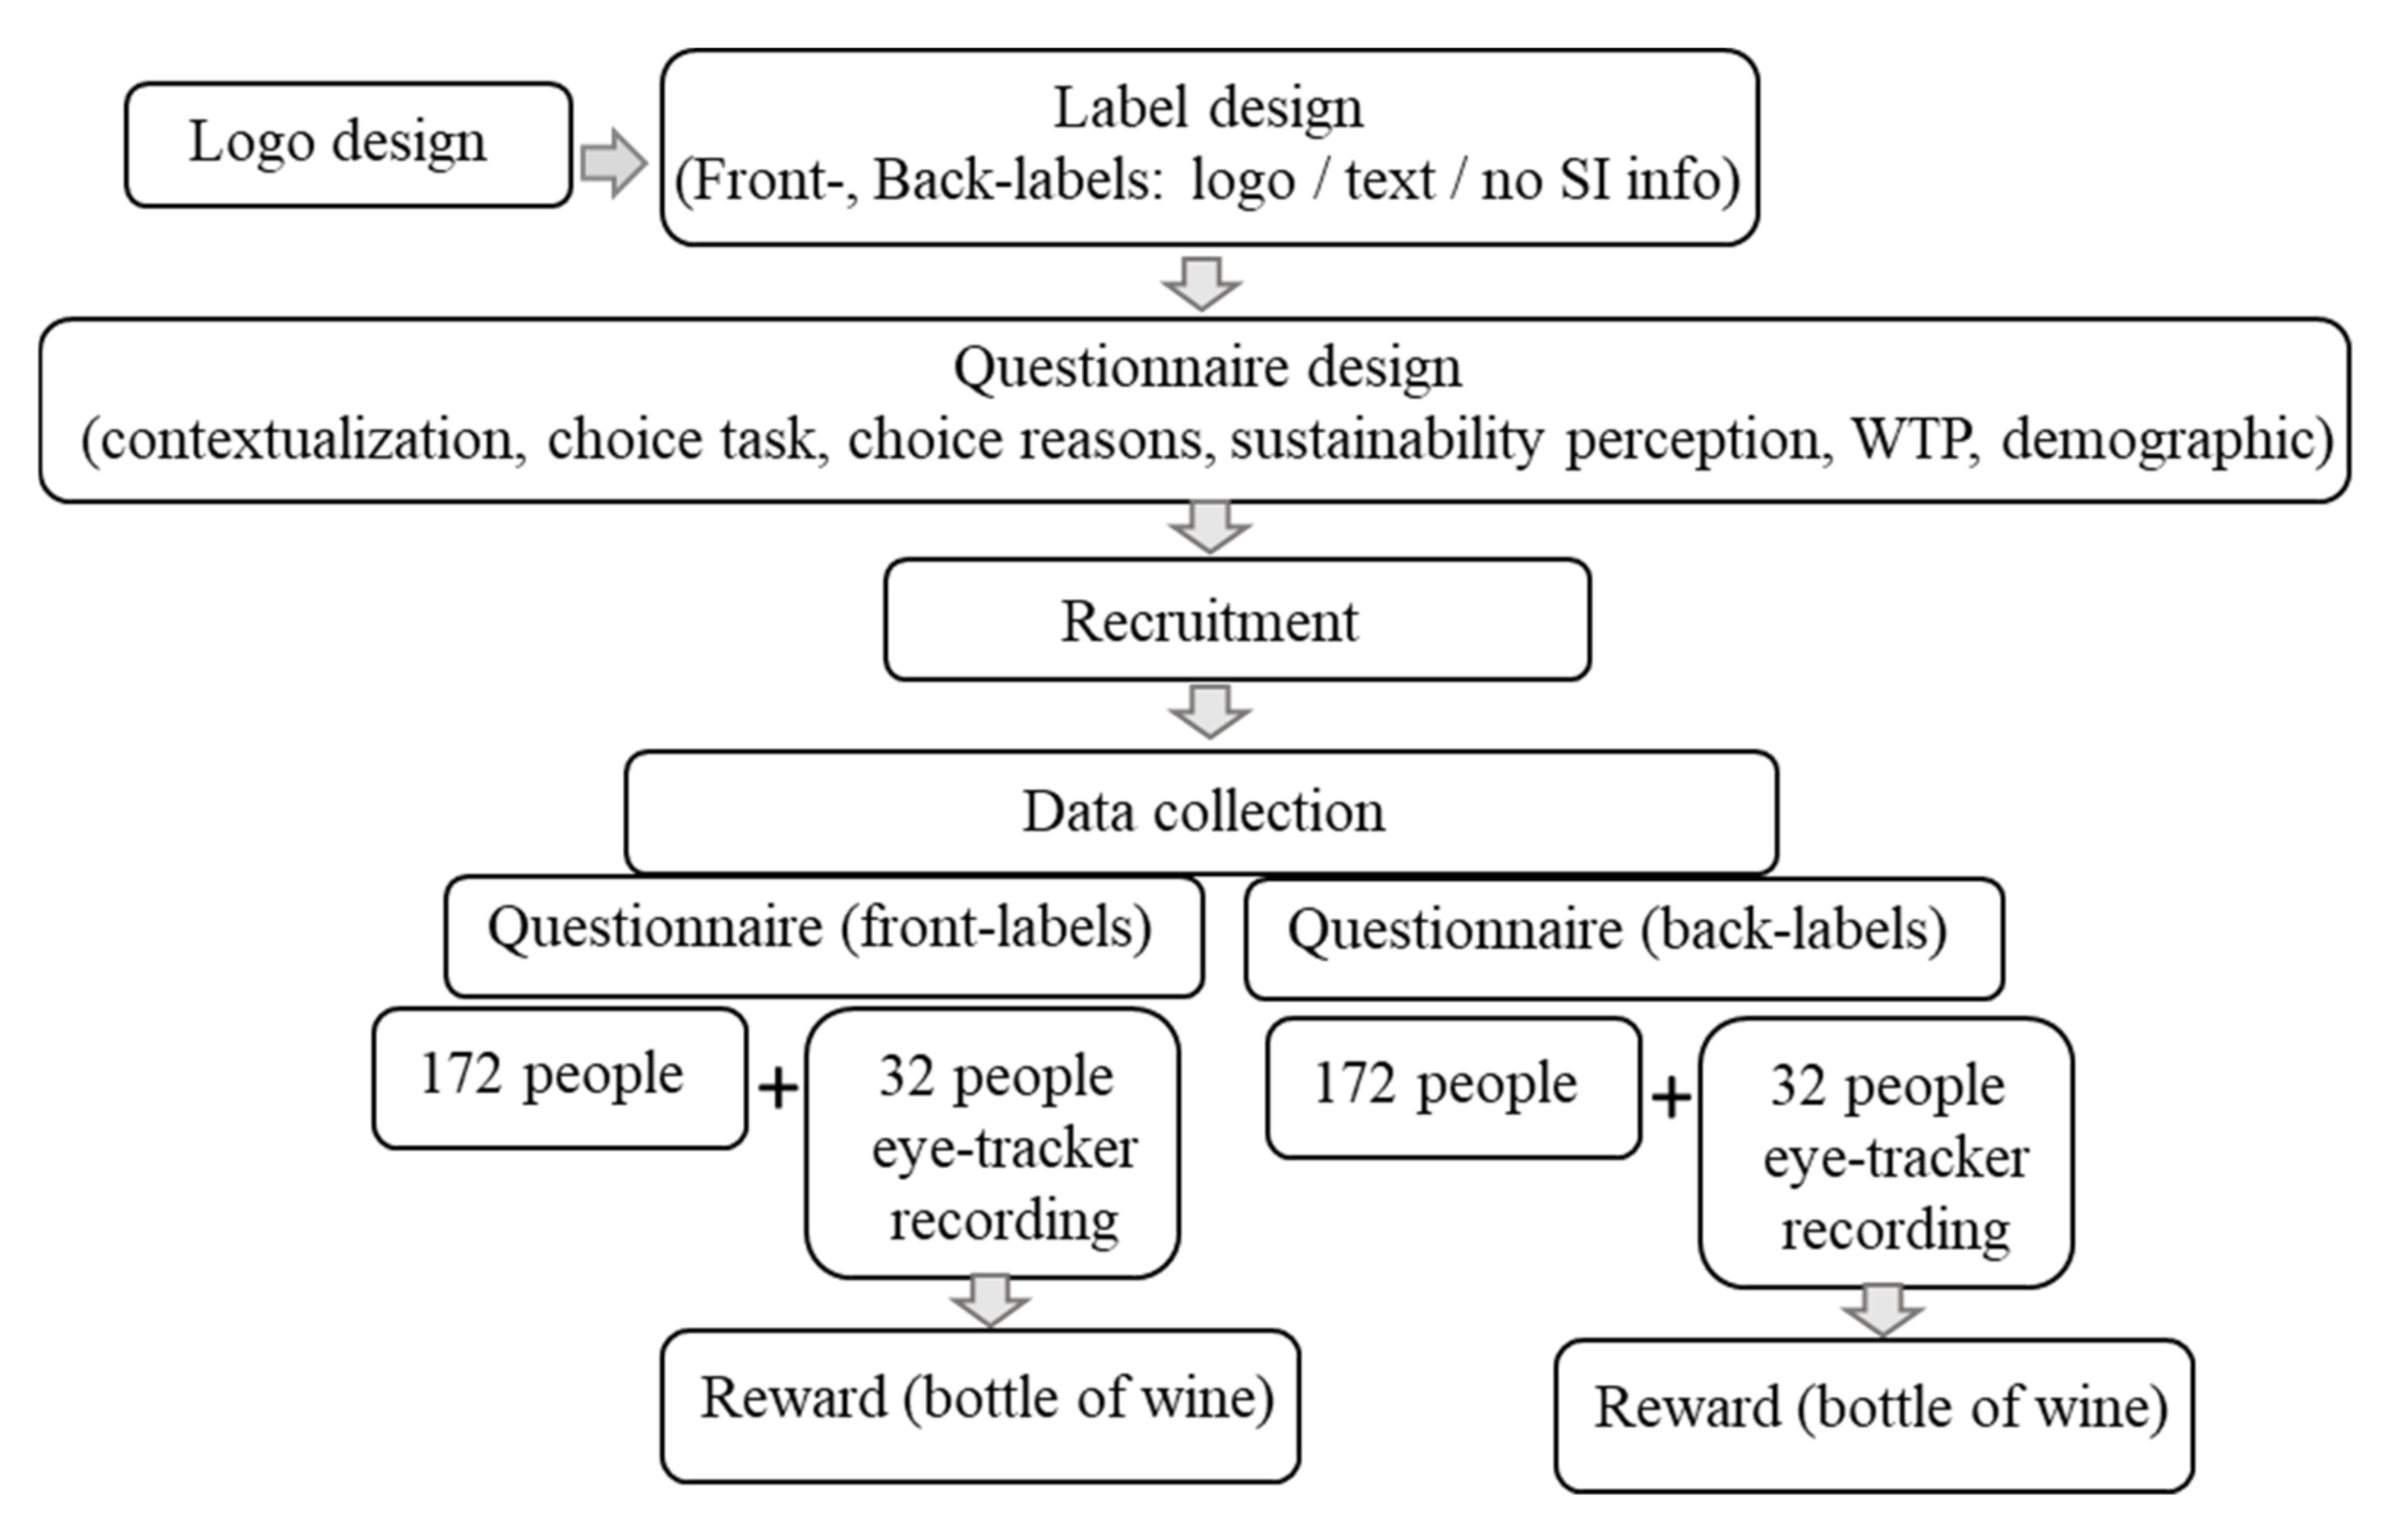
Figure 1 is an overview of the research design. The study was based on an online questionnaire that included different tasks intended to respond to all the above questions. The first questionnaire task involved choosing among wine bottles that differed as regards the following information about irrigation practices included on labels: no SI info, SI-logo, and SI-text. The first step of this study was to design the SI-logo, which was designed specifically for this end, and the wine labels.
The questionnaire also included multiple-choice questions, a sustainability evaluation, and WTP questions.
Wine-drinking people were recruited. All the participants were split into two groups. One group evaluated front-labels and the other back-labels. An eye-tracker device was used to record the choice tasks of one-sixth of the participants in each group, who were rewarded a bottle of wine after completing the entire questionnaire.
Eye-tracker devices allow the extent to which each label component captures consumers’ attention to be investigated and quantified [
26]. Its usefulness in evaluating the relationship between consumer behavior in choice experiments and their visual attention has been previously demonstrated [
27]. Our initial hypothesis about this was that consumer choice is directly linked with the attention paid to different SI claims (
Figure 2).
2.2. Participants
Four hundred and eight participants, all of legal age, participated in this study, 69% of whom were women. Convenience sampling was carried out with members of the Unió de Consumidors de la Comunitat Valenciana (Valencian Community Consumers Association). Word-of-mouth recruitment was also adopted using interpersonal relations and connections among consumers to reach a large number of participants. In order to not introduce bias due to word-of-mouth recruitment, the first 204 people were personally recruited, who covered both genders and a wide age range (18–63 years). This group of participants completed the questionnaire based on front-labels. All these participants were asked to invite one friend/family member to participate. This second group of participants (18–61 years old) answered the questionnaire based on back-labels.
Only the people who reported drinking wine at least once a month were invited to participate. They all signed an informed consent form before participation.
2.3. Labels Design
The effects of two label factors on consumer choice and willingness to pay (WTP) were evaluated as follows (
Table 1): (1) SI claims (No SI info, SI-logo, and SI-text) and (2) SI claims position (front- vs. back-labels). To this end, six wine labels were designed and used as stimuli. Three were front labels, which were evaluated by half the participants, i.e., 204 people. The other three were back-labels, which were evaluated by the other 204 participants. In both cases (front- and back-labels), one of the labels was designed for a conventional wine bottle without adding SI information and acted as a control (Ctl-label). The other two labels included information about production by sustainable irrigation (SI) practices. Two different SI-labels were designed, one in which information was given as text (text-label) and another by means of a logo (logo-label). The text included on the front text-label was “Sustainable Irrigation” and it was as follows on the back-label: “This wine was made by applying sustainable irrigation”. The logo placed on the front- and back-logo labels was the same and was specifically designed to this end. It showed a bunch of grapes with three drops of water at the bottom, and also included a shorter text “Sustainable Irrigation” at the top.
For the design of labels to be as realistic as possible, they included the most habitual information. The front-labels (
Figure S1) included the brand, grape variety, and protected designation of origin (PDO). The brand displayed on the label was fictitious (‘Pagos de Carrascosa’). However, variety and PDO were ‘Bobal’ and ‘PDO Utiel-Requena’, respectively. Bobal is a very common grape variety in the Valencia area, while ‘PDO Utiel-Requena’ is a well-known designation of origin in the same area. These two aspects were taken from real wine products so that the resulting labels would contain information that was familiar to the participants to a certain extent. Apart from the aforementioned information on the back-labels, further mandatory information was included (claim “contain sulfites”, data on the manufacturer’s origin, alcohol content, volume, bar code). In addition, some voluntary information, such as consumption recommendations (gastronomic combination, temperature drank at, storage conditions), and two logos (one about recycling and the other advising pregnant women not to drink wine), were added.
Sets of three bottles were created with the three front-label images. In the same way, sets were created by combining the three back-label images (
Figure S1). To contextualize, each label was shown as part of a wine bottle in all cases.
For each set of three labels, the position was randomized to avoid any order effect. As previously explained, 204 participants were presented with the front-labels set and the other 204 with the back-labels set.
2.4. Data Collection
The study was based on a questionnaire that included several sections.
First, to provide the participants with a real buying situation, they were asked how much they usually spent on buying wine in supermarkets. The provided options were the following: ‘less than €4′, ‘between €4 and €10′, ‘between €10 and €15′, ‘between €15 and €20′, and ‘more than €20′. This price range covers most wines offered in a standard supermarket for this PDO and variety;
Second, the participants performed a choice task. They were shown a set of three labels (front- or back-labels). They were asked to imagine that they were in the supermarket/winery and to choose the wine that they would prefer to purchase of the three they were offered by making a mouse click on it. They were asked to assume that the three wines cost the same price (the price they previously indicated as the price of the wines that they usually buy).
For 64 consumers, eye-tracking recordings were captured during the choice task performance to evaluate their visual behavior. Thirty-two corresponded to the consumers who had to choose from among the front-labels, and the other 32 to the participants who performed the same task among the back-labels. To thank them for their participation, these participants were given a bottle of wine after finishing the requested tasks.
- 3.
After completing the choice task, consumers were asked to answer a series of questions designed to assess different aspects, such as their choice reasons, sustainability perception, or WTP.
A multiple-choice question with nine options was used to evaluate choice reasons. Multiple-choice questions have been demonstrated to be a useful tool to understand consumer behavior regarding the products they consume [
28]. The question was formulated as follows: “What are the reasons for your choice? Check all the options you consider”. The list of possible answers included the following: I think it’ll be of a higher sensory quality; I think that the grower will have more benefits; I think it’s more environmentally friendly; I think less water has been used to produce it; The label is more attractive; I think it’s more handmade/crafted; I think it’s healthier; I think I’ll like it more; I don’t like novelties. A preliminary list was initially drawn up based on previous studies [
29,
30], and was then adapted to the present work objective by checking it with 10 consumers.
The participants could check all the options they considered that applied to their choice. They also had the chance to write down any other reasons by using the ‘others’ option.
- 4.
In the following section, the participants who had chosen any of the SI-labeled bottles (text- or logo-labels) were asked to indicate their WTP for the wine they had chosen and the Control wine. To this end, consumers were asked to assume that the control wine had a similar price to the wine that they normally bought (which they had indicated at the beginning of the survey). Then they were given the following four options to indicate the price that they were willing to pay for the SI wine that they had chosen: 0%, 15%, 30%, and ‘more than 30%’ of an extra cost in relation to the control wine. For example, the consumers who stated they normally spent between €4 and €10 on a bottle of wine were asked to assume that the control wine price was €7 (the mean value within this range). Then they had to select among €7, €8.05, €9.10, and ‘more than €9.10′ to indicate the price that they were willing to pay for the SI wine.
The extra cost percentages were set after performing a pretest with 10 consumers. Previous literature in this regard reported that consumers were willing to pay an extra cost of between 12.5% and 20% for organic [
29] and sustainable wines [
31]. These two values (12.5% and 20%) were initially used in the pretest. However, the pretest participants suggested using higher percentages, and we adapted the scale according to their suggestions.
After completing this task, they were shown the two wine images again. They were asked to indicate how sustainable they thought each wine was on a 9-point scale, where 1 corresponded to ‘Not sustainable at all’ and 9 to ‘Very sustainable’; this scale is an adaptation of the 4-point sustainability scale reported by Aerni [
32]. Half of the participants first scored the wine bottle that they had chosen and then the control bottle, while the other half viewed the images in the inverse order.
Finally in the demographic data section, they answered questions, such as their wine frequency consumption, gender, and age.
2.5. Eye-Tracking Procedure
Eye-tracker data collection took place in a room equipped with a screen-based eye tracker (Tobii Pro-Nano, Tobii Technology, Stockholm, Sweden) with daylight-type illumination, controlled temperature, and airflow conditions. The participants were asked to sit at a distance of 65 cm from the monitor and were instructed to move as little as possible while performing the task. Before starting data collection, they completed the 5-point calibration procedure from the Tobii Pro Lab-Full Edition software (Version 1.152, Tobii Technology, Stockholm, Sweden). During the task, participants’ eye movements were recorded at 60 Hz using the screen-based-eye tracker integrated into the monitor on which wine labels were presented. They were orally instructed to look at the image containing the three bottles of wine arranged side by side and were asked to make a mouse click on the wine that they would purchase. As there was no time limitation, each participant could observe the labels for as long as they wished once the image had appeared.
2.6. Data Analysis
The following areas of interest (AOIs) were defined on both the front- and back-labels: brand, variety, DOP, text, and logo. The last two areas were defined only for the SI-labeled wines. The AOI-label was also defined, which involved the whole label on each bottle. All these AOIs are exemplified in
Figure S2.
For each AOI, the following metrics were analyzed using the eye-tracker’s software: percentage of consumers who fixed their gaze on the AOI, total fixation duration (TFD: duration of all the fixations in an AOI), fixation count (FC: number of times that a participant fixed their gaze on an AOI), and the time to the first fixation (TTFF: time from the start of the label display until the participant fixed his/her gaze on the AOI for the first time) [
26,
27].
For brand, DOP, and variety, which were the AOIs present on the three labels evaluated by each participant, the TTFF selected for the statistical analysis was the minimum time spent on fixing one’s gaze on a specific AOI, irrespectively of the label on which this value was detected. In parallel with FC and total TFD, after evaluating these parameters for the AOIs on the three labels, the maximum value for each AOI was selected for the statistical analysis.
As previously explained, each participant could spend as long as they needed to make a decision because there was no time constraint to complete the eye-tracking task. In view of the wide variability in the time that each participant spent on completing the task, the data corresponding to TFD and FC were normalized. To this end, the TFD values from the three AOI-labels (Ctl-label, logo-label, and text-label) were added, and the same was performed with the FC values. In this way, a value associated with the total time spent by each consumer on looking at the three labels was obtained. Then the TFD and FC data for the specific AOIs were divided by their corresponding total value (
Table S1).
An analysis of variance (ANOVA) was carried out to evaluate eye-tracking metrics and sustainability perception data (LSD test, p-value<0.05). A z-test (multiple proportions) was performed to assess differences in the proportion of participants who chose each one of the three wines.
3. Results
The main objective of this study was to compare consumers’ responses to logo-label vs. text-label, mainly as regards consumer attention, and then to capture and assimilate the provided information. Therefore, the data about the preference of SI wines vs. the control wine should be cautiously considered because there could be some bias.
3.1. Consumer Choice
The results from the choice task revealed a similar choice pattern irrespectively of the task being performed with the front- or back-labels (
Table 2). The control wine was selected only by ≈ 12% of the consumers, the text-label by ≈ 36%, and the logo-label by the majority (≈ 52%).
3.2. Eye-Tracker Metrics and Its Relation to Consumer Choice
A similar pattern was observed after comparing the choice data of those consumers for whom the eye-tracker recordings were captured (64 participants) and those of the total dataset (408 participants). This implied that a few consumers with eye-tracker recordings chose the control wine (three participants with front-labels and one participant with back-labels). Therefore, in line with our study objective, the analysis of the eye-tracker data focused mainly on understanding the choice made between the two SI-labels (logo vs. text).
The eye-tracking metrics results obtained when whole labels were considered to be AOIs (Ctl-label, text-label, and logo-label) are shown in
Table 3. The ‘percentage of participants’ metrics indicated that all the consumers fixed their gaze at least once on each shown label they had to choose from. This result indicates correct participants’ performance because the three offered products were observed before the decision-making time. TTFF was not affected by label type, which can be explained by the balanced position of labels insofar as they were all shown the same number of times in each set position (left, central, right). Differences were, however, detected in FC and TFD because consumers spent longer looking at those labels with the SI information than the Ctl-label.
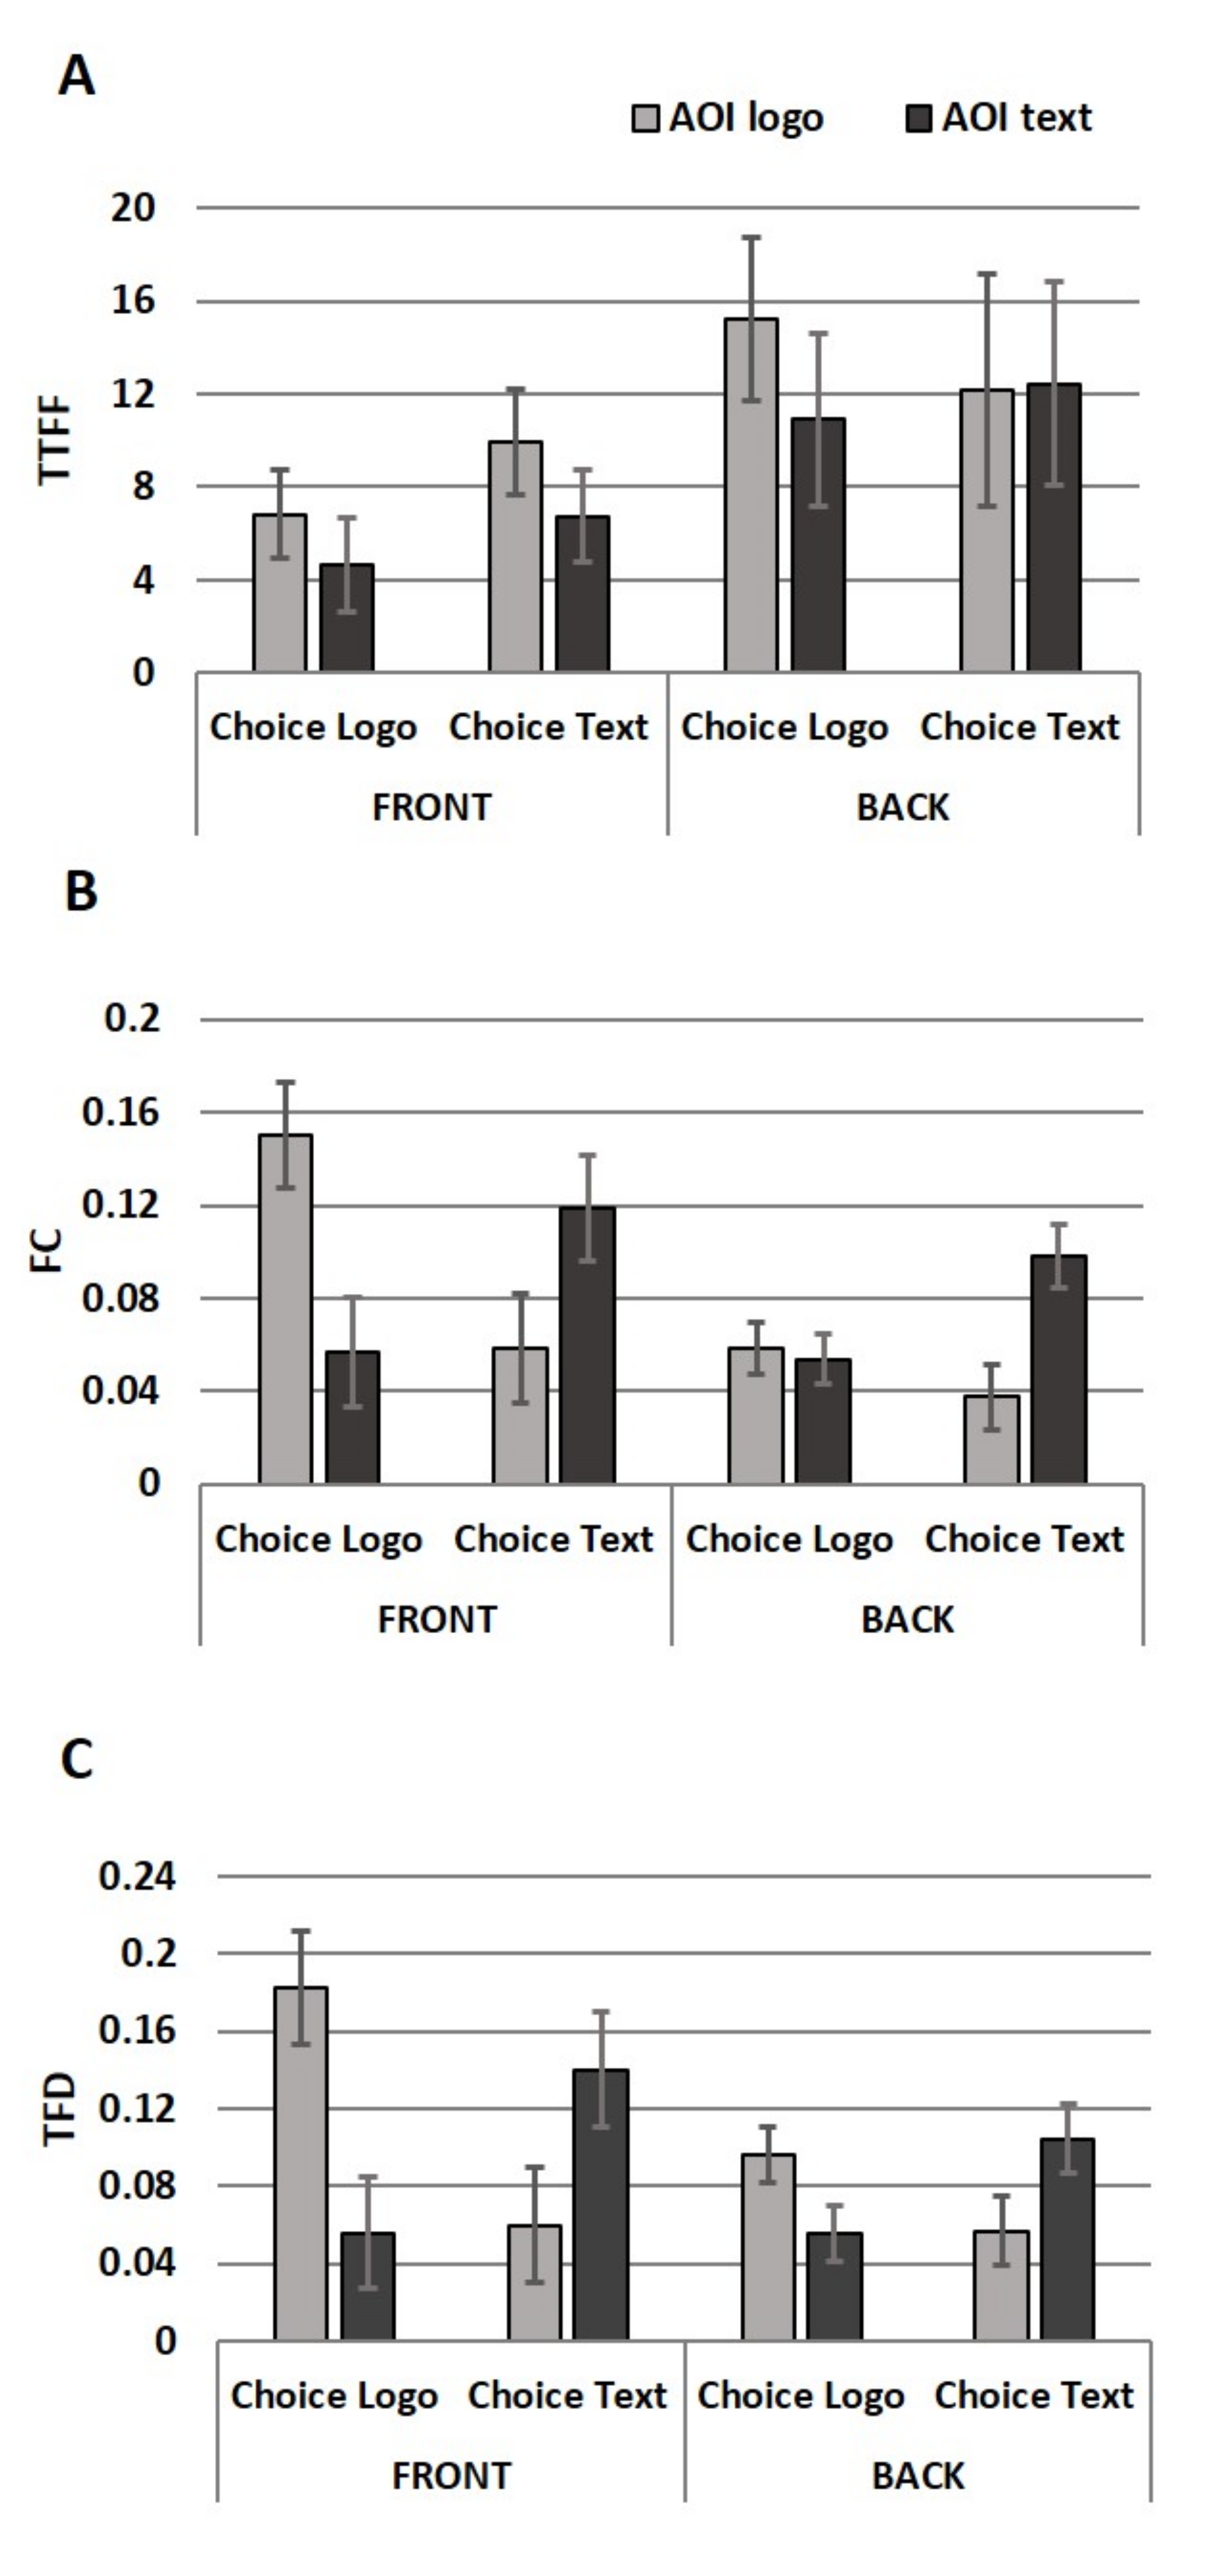
To well understand the relationship between paid attention and choice, besides attention paid to the whole label, we also investigated attention paid to SI-claims, i.e., if consumer choice was linked with the extent to which AOI-logo and AOI-text drew their visual attention (
Figure 3).
The TTFF in the AOIs logo and text was not a determining factor for the participants to choose among the front- or back-labels (
Figure 3A). However, our results revealed a clear effect of captured attention, determined as FC and TFD, on participants’ choices (
Figure 3B,C). This effect was more evident in the choosing task of front-labels. Thus, the relative FC and TFD values of the participants who chose the logo-label were much higher for AOI-logo than for AOI-text. In parallel, the participants who chose text-label fixed their gaze on AOI-text more, and for a longer time, than those who chose logo-label. To offer an intuitive visualization of these results,
Figure 4 shows heatmaps, which are the typical illustration of TFD in AOIs. As we can see in
Figure 4A, those consumers who chose logo-label spent longer looking at the AOI-logo than at the AOI-text. Conversely, AOI-text captured more attention of the consumers who chose text-label (
Figure 4B). In both cases, SI-claims were the AOIs on which consumers fixed their gaze longer, which suggests that they invested more time acquiring information from SI-claims than from any other AOI.
A similar visual attention and choice pattern were detected when the choosing task was performed with back-labels. In this case, the differences between the attention paid to the two AOIs were not so large (
Figure 3), but the link between choice probability and visual attention was corroborated.
We were also interested in evaluating consumers’ responses to SI-claims as regards the other information present on labels.
Table 4 shows the metrics for the text- and logo-AOIs compared to brand-, PDO-, and variety-AOIs.
On both label types (front and back), the order in which the different AOIs captured attention was the same. Thus, the participants first looked at brand information, followed by variety, PDO, text, and logo.
On front-labels, which did not provide any more information than the five AOIs, the time to the first fixation on brand was 0.40 sec. The time that elapsed until the other AOIs were viewed was around 2 s. On back-labels, which included much more information (gastronomic combination, allergens, bar code, etc.), the TTFF on brand was 1.8 s, followed closely by variety (2.12 s). TTFF was markedly longer for the following other AOIs: PDO, text, and logo.
When focusing specifically on the AOIs that provided information about sustainable irrigation (i.e., text- and logo-AOI), TTFF increased by approximately 6.5 s when information was provided on back-labels compared to front-labels.
With regards to FC and TFD metrics, during the front-labels choice task, brand, logo, and text were the AOIs that mostly captured the participants’ attention, as the higher relative FC and TTFD values reflect. For back-labels, the AOIs that informed about the sustainability of irrigation practices were those that drew the participants’ attention for a longer time, with slightly more fixations for text- than for logo-AOI.
It is worth mentioning that the relative FC and TTFD values were generally higher on front-labels than on back-labels for all the evaluated AOIs.
3.3. Reasons for Choice, Sustainability Perception, and Willingness to Pay
Figure S3 shows the main reasons for choice reported by consumers depending on the wine bottle that they selected. The given reasons depended on choice, and not on the fact that selection was made between front- and back-labels. Therefore, to more easily view the results,
Figure 5 shows the results obtained after combining the front- and back-label data.
Of the nine choice reasons that consumers received, the following three are highlighted as being the most mentioned ones by the consumers who selected either of the two labels with SI information (logo- and text-label): ‘I think it’s more environmentally friendly’, ‘I think less water has been used to produce it’, ‘The label is more attractive’. Of these three reasons, the main one given by those consumers who chose any of the SI claims was ‘I think it’s more environmentally friendly’. However, some differences were detected for the other two main reasons, depending on the SI-claim form. ‘I think less water has been used to produce it’, which is closely related to the environmental issue, was the second most mentioned reason reported by the participants who chose the text-label. However, for the logo-label selection, the second most reported reason was ‘The label is more attractive’. The impact of label appearance was much less important for text-label selection. All the other reasons were mentioned much less often, with percentages below 10% in all cases.
As previously mentioned, the Ctl-label was selected by a few consumers, and as shown in
Figure 5, there was no specific reason for their choice to highlight it from the others.
As for reasons for choice, the patterns observed for sustainability perception and WTP showed no differences between those consumers who evaluated front- and back-labels. For the consumers who chose either of the SI-labels (text- or logo-label), sustainability perception was significantly higher for the SI-labeled wines than for the control (
Table 5). They rated the SI-labeled wines with 6.7–6.8 sustainability scores on a 9-point scale, while the Ctrl-labels were rated with scores of 4.4–4.7.
Both reasons for choice and sustainability perception data indicated that most consumers assimilated the sustainability information provided by the logo and text claims. However, it is worth mentioning that the frequency of mention of ‘I think less water has been used to produce it’ was lower than that of ‘I think it’s more environmentally friendly’. Therefore, it would seem that a certain number of consumers perceived SI wines as being more sustainable but did not assimilate the specific sustainability aspect, i.e., water-saving.
For WTP, no differences were detected between both SI-claims or between front- and back-labels. The global results for the SI wine were the following: 27% of the consumers indicated that they would not pay an extra cost for the SI-wine; 38% were willing to pay a 15% extra cost, and 30% were willing to pay a 30% extra cost. Only 4.5% of the participants indicated their WTP was more than 30% extra cost. To summarize these data, our results revealed that more than 70% of the consumers stated that they would pay a 15% or a higher extra cost for wine produced by SI practices.
4. Discussion
The choice task results showed that almost 90% of the participants were interested in the SI-labeled wines. This result should be interpreted cautiously given the possible gap between declared intention and real behavior. However, it clearly indicates consumers’ interest in SI wines and corroborates previous results in this regard. After Tait et al. [
14], studied the influences of different sustainability attributes on consumers’ choice of Sauvignon Blanc, they reported that water resources management had a positive effect on choice and was among the attributes that consumers valued the most.
The eye-tracker technology allowed us to identify a link between paid attention and consumer choice. This result corroborated our initial hypothesis based on the previous literature [
18,
33]. When the eye-tracker data were analyzed after considering the whole label as the AOI, our results revealed that consumers paid more attention to the most preferred labels, i.e., consumers who chose any of the SI-labels had spent longer looking at them compared to the control. In our particular case, doubts may arise if this result is due to SI-labels including more information compared to the control. Therefore, to clarify this point, a data analysis was also performed that focused on the two SI-labels to evaluate choice in relation to the attention paid to AOI-logo and AOI-text. This analysis doubtlessly revealed that consumer choice was directly linked with the attention they paid to SI-claims as recorded by the FC and TFD parameters. Our data also revealed that the participants spent more time acquiring information from SI-claims than from any other AOI, which is likely related to top-down attention because SI-claims helped them make their choice decision. Top-down attention depends on consumers’ interests and goals, and it is drawn to signs that can help them categorize a product [
34,
35]. It involves consumers’ voluntarily searching for and paying attention to specific information [
20]. On the contrary, bottom-up attention occurs automatically and is related to stimuli such as color, size, or shape.
This is the first time a link between claim attention and choice is described for SI-claims. It confirms that the ‘attention-choice’ association found in previous studies about different claims and products actually exists. Ballco et al. [
18] reported a relationship between paying visual attention to nutritional claims on yogurt packaging and yogurt choice. This association has also been found in broader contexts. After Gidlöf et al. [
33] performed an experiment related to supermarket shelves to evaluate the influence of internal and external factors on consumer choice, they reported that visual attention was by far the most important predictor of choice. These authors described this relationship as “looking is buying”.
Despite this relation having been corroborated in different studies, in certain cases it simply does not apply. Thus, for example, Fenko et al. [
8] found no direct evidence for the influence of visual attention paid to health labels on healthy food choices. They suggested that paying attention to health labels might indicate an interest in an unfamiliar food label, but does not necessarily indicate a healthier food choice. Contrarily to this hypothesis, a marked relationship between attention and choice probability was observed in the present study, despite consumers not being familiar with SI-labels.
Of the three eye-tracker parameters herein evaluated (TTFF, FC, and TFD), TTFF was the only one that was not linked with choice. In line with previous studies [
21,
36], our results showed that, irrespectively of label type, brand was the label component that first captured consumers’ attention.
The eye-tracker device also allowed differences in captured attention between front- and back-labels to be investigated. TTFF increased by approximately 6.5 s when information was provided on back- vs. front-labels, and the relative FC and TFD values were generally higher on front- than on back-labels for all the evaluated AOIs. This result was not an unexpected one because back-labels contained much more information (gastronomic combination, allergens, bar code, symbols, etc.) than front-labels, and previous studies have described that consumer attention to specific label areas decreases as label information density increases [
27]. This effect has been related to time pressure feelings linked with modern lifestyles, where people feel that they do not have enough time to do all that they wish to do in one day [
37]. So, when too much information is provided, consumers adjust their attention process as follows: they accelerate information acquisition by reducing the duration of fixations on a stimulus [
8].
The quantification of attention herein presented is key for better understanding how consumers process label information, which may help the wine industry design market strategies to incorporate sustainability aspects. However, it is important to mention a limitation aspect of this study regarding the choice task because it was not a time constraint. As this was the first time that such ‘sustainable irrigation’ claims have been evaluated and consumers are not used to them, we considered it appropriate to offer consumers the chance to take all the time they needed to perform the task. However, as previously mentioned, consumer behavior is usually conditioned by time-pressure feelings [
19]. In order to overcome this limitation and to more accurately predict consumers’ responses, future studies should be performed in more ecological contexts, such as those associated with real-choice experiments [
38] or experimental auctions [
39].
Determining reasons for choice revealed that most consumers assimilated the provided information irrespectively of the SI-claim type (logo vs. text). Nevertheless, it would seem that a certain number of consumers did not assimilate the specific water-saving aspect. This result corroborates the need to run comprehension tests when a new claim is designed to provide consumers/users with information [
40].
The reason for choice questions also revealed that, apart from its purpose to provide SI information, the logo claim proved to be a more attractive label, which would explain why consumers preferred the logo- to the text-label.
Bearing in mind the two aforementioned results, i.e., assimilating information and claiming preferences, it would be interesting for future research to approach logo design improvements in order to make their meaning clear for all consumers.
Finally, the WTP results showed that more than 70% of the participants were willing to pay a 15% or higher extra cost for wine produced by SI practices. Despite this study focusing on a specific sustainability aspect (SI), our results corroborate a general trend of consumers’ WTP a premium for wine with sustainable production characteristics. This trend was detected by Schäufele and Hamm [
2] after reviewing the existing literature that covered studies from different countries.
However, it is worth mentioning that despite this tendency existing, significant differences may arise in specific results among available studies. In the present study, the statistical analysis of the WTP data revealed no significant differences in the results obtained from front- and back-labels. This particular result about the effect of the SI-claim position differs from that reported by Pomorici et al. [
11], who found that young Italian consumers were willing to pay 4.4% more for a water-saving wine labeled on the front compared to the back of bottles. Using a different methodology may be the reason for the differences in the results observed between both studies. Moreover, cultural differences among Spanish and Italian consumers and/or participants’ age ranges might also have an influence on the WTP results. Despite the existing differences between these two studies, both suggest that providing consumers with information about water management sustainability can help to increase market profits. This could be crucial for preserving farm profitability and, hence, for encouraging growers to adopt sustainable practices. Moreover, in the present study, preference for the SI wine (even for those consumers not willing to pay an extra cost) is
per se a commercial advantage.
5. Conclusions
This work explores consumers’ responses to ‘sustainable irrigation’ labels for the first time. To this end, a combined approach was followed to evaluate their responses to two SI claims (logo vs. text): the choice task, eye-tracking technology, and the determination of the main reasons for choice, sustainability perception, and WTP.
Our results showed marked consumer interest in SI wines, as reflected in their wine choice and their WTP. More than 70% of the participants stated that they would pay a 15% or higher extra cost for wine produced by SI practices. The eye-tracker technology revealed that both logo- and text-claims captured consumers’ attention, and a link between choice probability and paid attention was detected. The logo-label was the preferred one, mainly because consumers found it more attractive than the text-label. Consumers paid more attention to SI-claims when information appeared on front-labels, which was related to lower information density compared to back-labels.
The results of this study have relevant implications for the wine industry because they strongly suggest that producing and marketing SI-labeled wines can be an opportunity for the industry to differentiate the product in markets while taking actions to face the pressing need to preserve the environment. The herein proposed SI-logo proves to be a useful way to draw consumers’ attention to the sustainable character of wine, as most consumers adequately assimilate the specific water-saving aspect. However, there is still room to improve logo designs to guarantee that all consumers properly understand their meaning.


