Article

Comprehensive Analysis Revealed the Specific Soil Properties and Foliar Elements Respond to the Quality Composition Levels of Tea (Camellia sinensis L.)

1
Department of Soil and Environmental Sciences, National Chung Hsing University, Taichung 40227, Taiwan
2
Innovation and Development Center of Sustainable Agriculture, National Chung Hsing University, Taichung 40227, Taiwan
*
Author to whom correspondence should be addressed.
Agronomy 2022, 12(3), 670; https://doi.org/10.3390/agronomy12030670
Submission received: 8 February 2022 / Revised: 6 March 2022 / Accepted: 8 March 2022 / Published: 10 March 2022

Abstract

:
C. sinensis cv. Sijichun is a representative Taiwanese low-altitude tea cultivar native to central Taiwan. To enrich the taste of tea in a geographically disadvantaged area, soil management became necessary but was obscure. The purpose of this study was to screen the main soil factors that influence the quality composition levels of tea to optimize the efficiency of tea tree horticulture. Soil and tea leaf samples collected from 20 tea plantations determined thirteen soil properties, nine leaf element nutrients and aluminum, and five main extractable quality compositions, including polyphenols, catechins, flavones, free amino acids, and caffeine in tea infusion. Pearson’s correlation analysis and principal component correlation analysis showed that soil available nutrients cannot respond to the concentration of corresponding essential elements in tea leaves; nevertheless, adequate leaf macronutrients and Zn could enhance polyphenol, free amino acid, and caffeine contents, but decreased flavone contents, and showed their consistent effect by soil characteristics. Of note, soil pH, EC, exchangeable calcium, exchangeable magnesium, total concentration of manganese, and total concentration of copper were shown as significant impact factors on free amino acid content. In summary, regulating the pH of soil under 3.51–5.21 in our study and managing soil effective Ca, Mg, and Zn supply could help to obtain a greater umami taste of tea.

1. Introduction

The tea plant (Camellia sinensis (L.) O. Kuntze), which is a perennial crop with a high economic value, is well known for its infusion due to a pleasant aroma, delightful flavor, as well as health-promoting properties [1]. Tea is the most popular consumed beverage worldwide that has an increasing production with 9,553,548 and 10,008,383 tons in 2019 and 2020, respectively [2]. Its appearance and organoleptic properties are regarded as major indicators of tea quality and price [3,4]. Many previous studies have demonstrated that secondary metabolites in tea leaves, such as theanine, rutin, caffeine, and various catechins, were the key contributors to the flavor of tea and quality [5,6,7,8]. For instance, free amino acids were associated with the taste of umami, and caffeine and catechins were responsible for bitter and astringent flavors, respectively [9]. Moreover, the potential health benefits of tea have been pointed out to inhibit carcinogenic transcription factors, stabilize blood pressure, prevent cardiovascular diseases, diabetes, and reduce the intestinal absorption of lipids given the antioxidant capacity of phenolic compounds [10,11,12]. These content of quality components (secondary metabolites) depend on genes, variety, climate, altitude, soil and fertilizer management, harvest season, leaf age, and manufacturing process [13,14,15]. Among the above factors, season and climate have been already reported as the primary effects [16]. However, edaphic factors are still crucial since the biochemical properties determine the availability of essential nutrients, which is reported to not only play an important role in plant growth but also support the biosynthesis of chemical compositions and tea quality.
Tea tree is a leaf-harvest crop widely native to tropical and subtropical areas, especially in Asia, Africa, and Latin America. The optimal soil environment for tea growth is a pH of 4.0–5.5, well-drained, with more than 2% organic matter (OM) content, and suitable for sandy loam or sandy clay with rich humus in general [17]. As for a high nitrogen (N) requirement crop, it has been reported that applying NH4+-containing fertilizer can improve growth performance and strongly increase yield as well as enhance the level of free amino acids and caffeine while increasing or decreasing the polyphenol level [18]. Fertilizing with N, potassium (K), and magnesium (Mg) have been demonstrated to promote the synthesis of glutamic–pyruvic transaminase (GTP), glutamate dehydrogenase (GLD), and amine oxidase to amino acids and thus decrease the PP/AA ratio (polyphenol/amino acid ratio), which used to be an index for qualifying tea quality [18,19]. The results of earlier research have also highlighted that N and phosphorus (P) fertilizer could enhance the level of theanine, caffeine, and esterified catechins to improve the quality of tea infusion [20,21]. Moreover, most micronutrients act as electron transports, activators of enzymes, or cofactors in the physiological function of tea plants, such as iron (Fe), which is involved in the synthesis of chlorophyll protein complexes; polyphenol oxidase (PPO) in tea leaves has also been noted to be made up of copper (Cu) [22]. In addition, the characteristics of tea trees include aluminum (Al) and manganese (Mn) hyperaccumulation. It has been reported that Al may be the beneficial element for tea root growth and has a high tolerance under high Al availability conditions with low pH [23]. Therefore, the antioxidant properties having a strong influence on polyphenolic levels were altered to be in defense against oxidative stress [24].
However, the availability of element nutrient mainly depends on pH. The nutrient uptake is affected by soil texture, cation exchange capacity, and any physical and chemical properties, elemental antagonism, or synergism effect [25]. Therefore, soil conditions should be dominant in tea plantation management in this quality-driven agricultural industry. Although the studies in this decade that investigated single fertilizers applied to the soil for crop yield and tea quality were versatile, the integrative evaluation for soil management of the tea garden was few and far between. In an attempt to enhance the abundance of quality compositions in our representative Taiwanese low-altitude tea cultivar, Sijichun, against the elevation downside and optimize the efficiency of tea tree horticulture, we closely looked at the relationship among thirteen soil properties, ten foliar elements, and the five main quality compositions in tea infusion. This study aimed to screen the main soil factors influencing the quality component levels of tea. Multiple statistical analyses were conducted to (1) realize the coherently connecting relationship between nutrient uptake and metabolism as well as to (2) directly explore the multiple responses of specific soil properties to the quality component levels of tea.

2. Materials and Methods

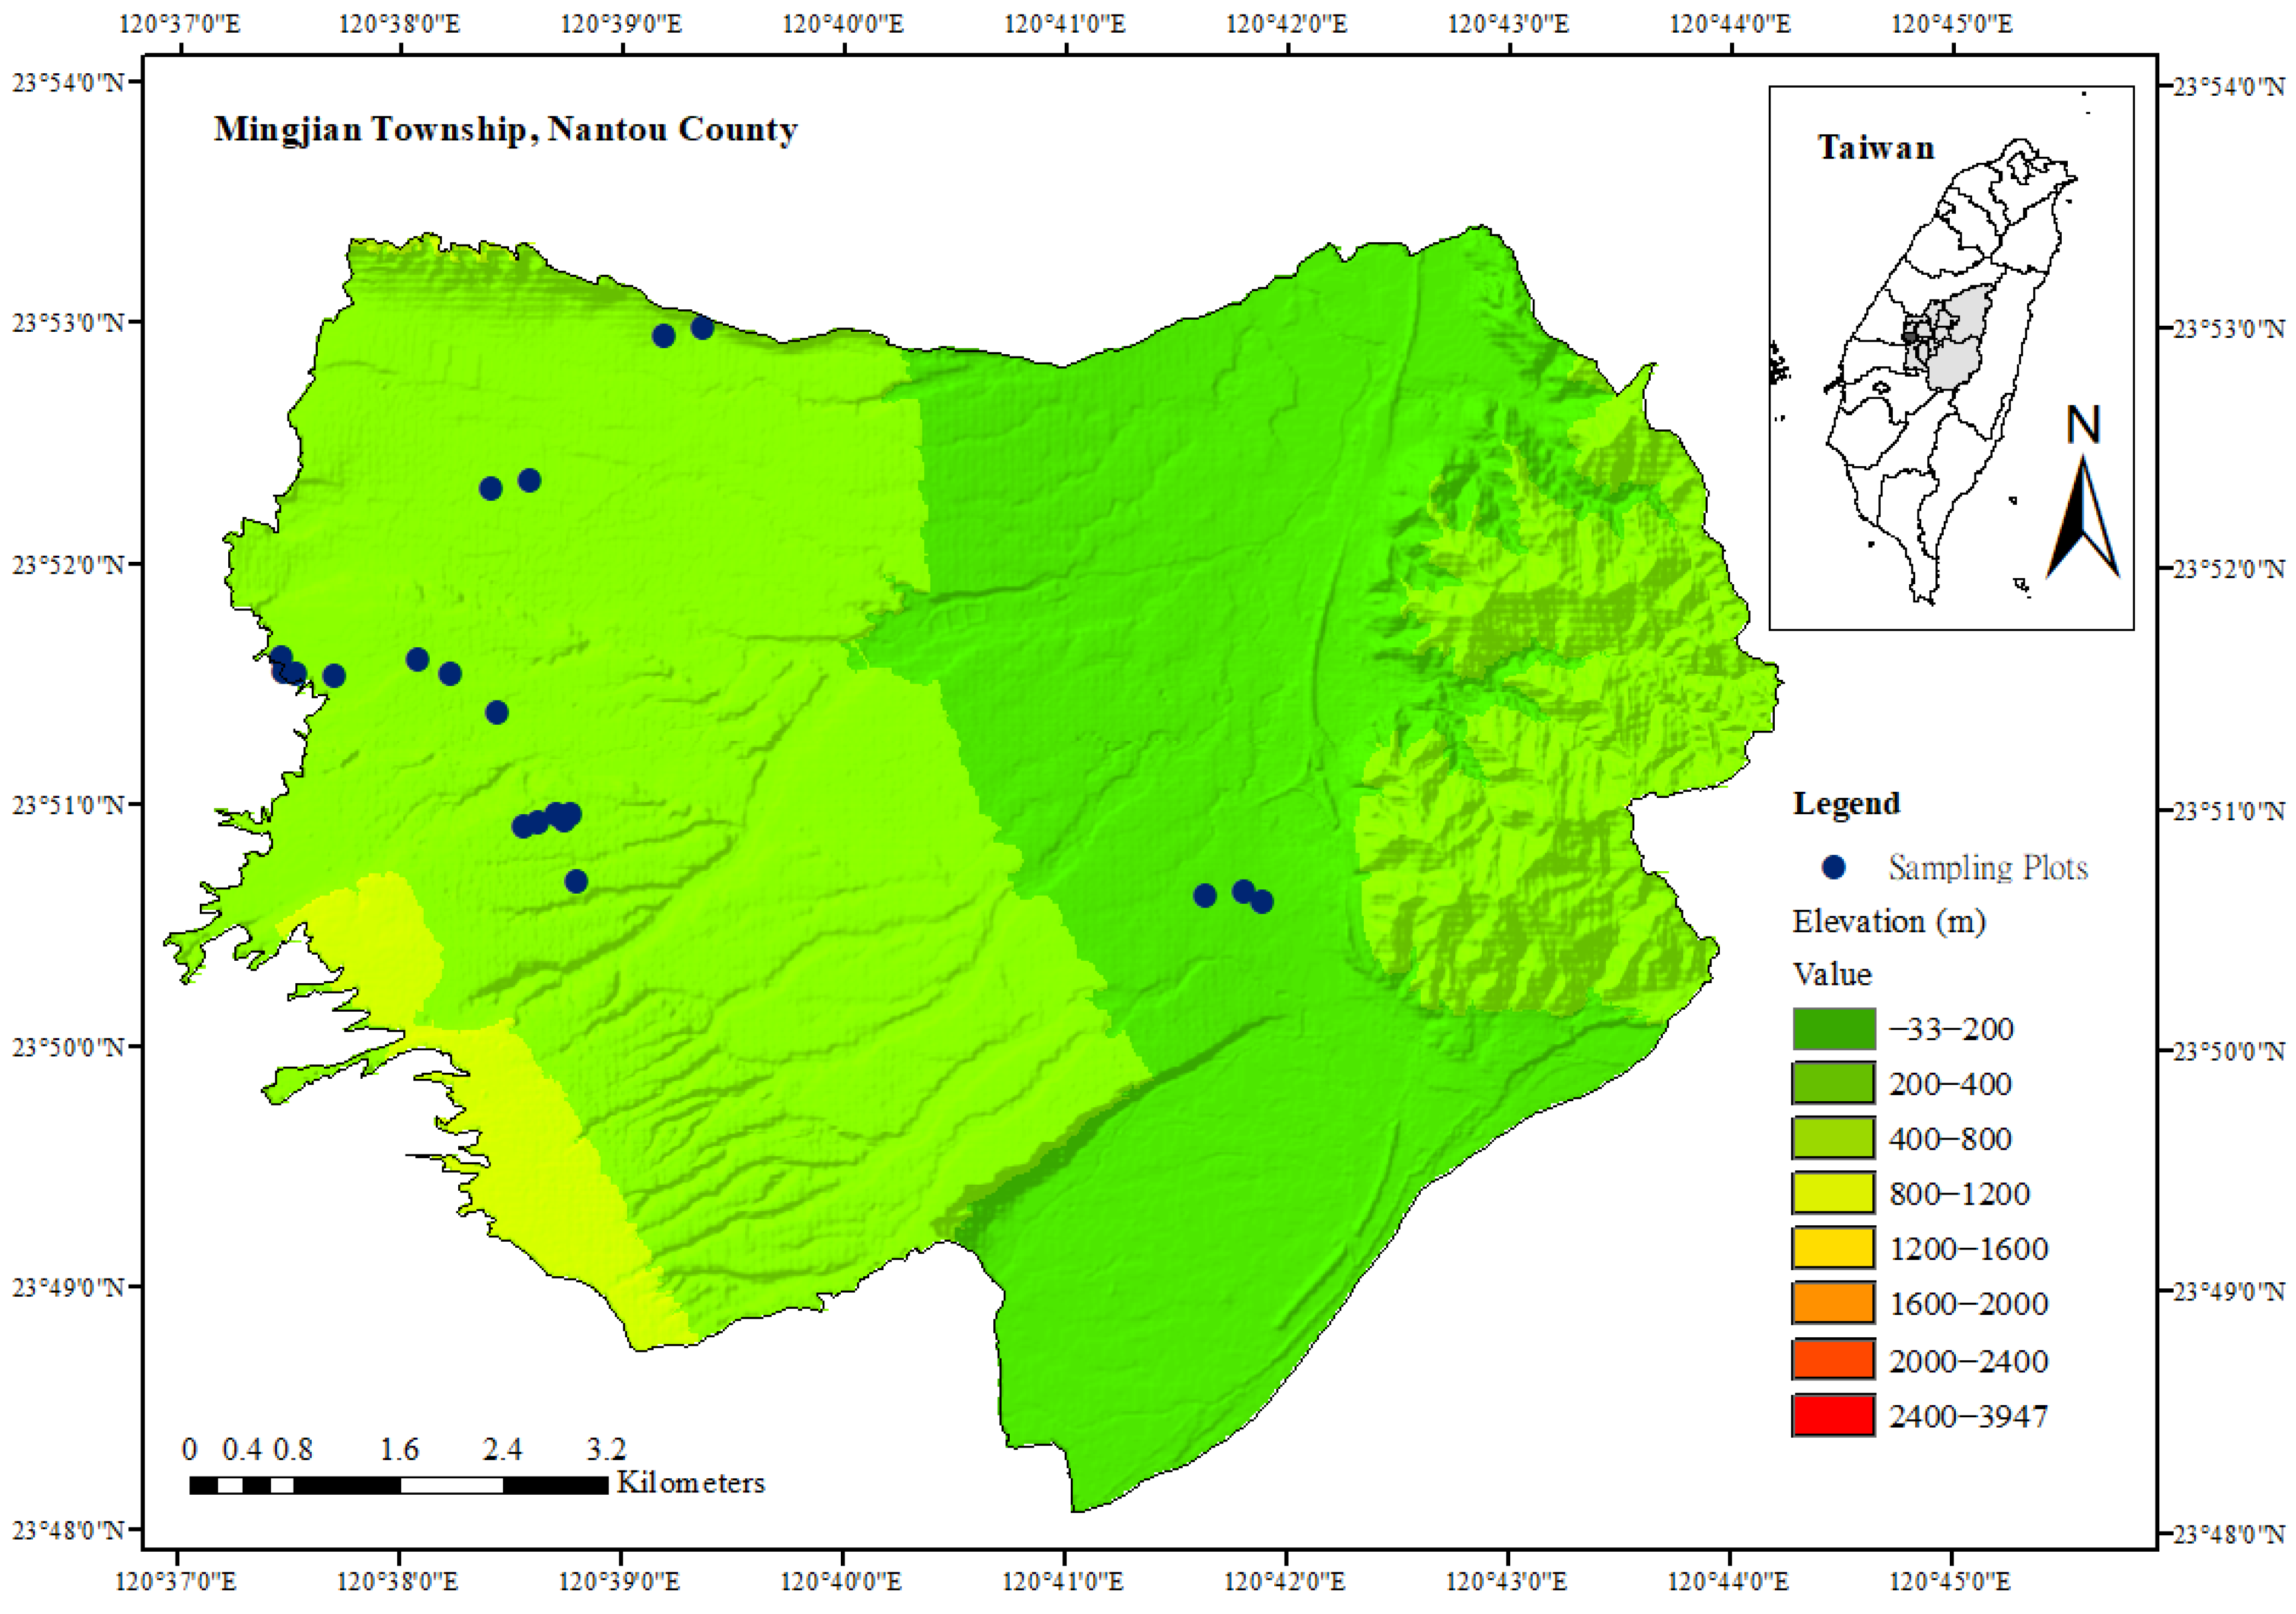
2.1. Soil and Tea Leaf Materials

Soil and fresh tea leaf samples were collected from twenty study plantations as shown in Figure 1. The age of tea trees was similar, ranging from 10 to 20 years. Soil sampling sites were randomly selected, triplicated in each plantation, and collected at the depths of 0–20 cm, 20–40 cm, and 40–60 cm under the canopy of tea trees by auger in 2019. Meanwhile, tea flushes (tea shoots with two leaves and a bud) were randomly picked from the same tea bush in selected plantations. Tea samples were stayed under the low temperature situation to keep them fresh and prevent physical damage before transferring to laboratory.

2.2. Soil Preparation and Analysis

The soil samples were air-dried, ground, and passed through 10-mesh stainless steel sieves for analysis preparation, and 80- and 100-mesh stainless steel sieves for particular properties analysis according to the protocol of soil property analysis. The basic characteristics include soil pH (Wsoil/Vwater = 1/5) [26]; electrical conductivity (EC; Wsoil/Vwater = 1/5) [27]; soil organic matter (SOM) that converted from soil organic carbon (SOC) by timing the coefficient 1.724 [28]; soil wet aggregate stability (WAS) [29]; 2 M KCl extractable N [30]; available P that extracted by Bray No. 1 protocol [31,32]; 1 M NH4OAc (pH 7.0) exchangeable cations [33], and the total concentration of Cu and Zn digested using aqua regia by the protocol published by Environmental Protection Administration (EPA), Taiwan [34] were analyzed by inductively coupled plasma atomic emission spectroscopy/optical emission spectroscopy (ICP-OES, PerkinElmer Avio200, Waltham, MA, USA).

2.3. Tea Leaf Sample Preparation and Analysis

Tea leaf sample analysis was conducted after washing the leaves three times by running water and deionized water (DI water) to remove adhered dust, oven-drying them at 65 °C for 72 h, and finely grinding them into powder. A total of 0.2000 g of dried samples were weighed and digested by H2SO4–H2O2 protocol described from Jones Jr. and Case [35].

2.3.1. Analysis of Elements in Tea Leaves

Kjeldahl N analysis according to the study by Mulvaney [30] was conducted to determine N concentration of tea samples. P concentration of tea samples was determined through the molybdenum blue method [32] via visible spectrophotometer (Genesys 30, Thermo, Waltham, MA, USA). K concentration in leaf samples was determined by a flame photometer (FA, Flame Photometer 410, Sherwood Cambridge, UK) using the external standard method under a 5–20 mg L−1 calibration curve. The concentration of Ca, Mg, Fe, Mn, Cu, Zn, and Al in leaf samples was determined using inductively coupled plasma (ICP-OES, Perkin Elmer Avio 200, Waltham, MA, USA) under a 0.1–40 mg L−1 multielemental calibration curve. For quantitative and data analysis, calibration curves were acceptable when r2 ≥ 0.99. The average element concentration and percent relative standard deviation were based on triplicates of each sample variable.

2.3.2. Analysis of Chemical Components in Tea Infusion

An aqueous infusion was extracted following the previous publication from Taiwan Tea Research and Extension Station (TRES) [36], which indicated the best extraction efficiency of total polyphenols was implemented with 1/100 (Wsample/Vwater) extraction ratio in 100 °C water bath for 60 min. Filtering and quantifying with DI water to a final volume of 100 mL were conducted. Next came storing the infusion of samples in a freezer at 4 °C for further analysis.

Determination of Total Polyphenols

The Folin–Ciocalteu colorimetric method, according to previously published methods [37] from TRES Taiwan, was conducted to determine the content of total polyphenols in tea infusions. Standard concentrations of gallic acid ranged from 0–0.3 mg mL−1 were prepared as calibration curves. A total of 1 mL of the diluted infusion sample was homogeneously mixed with 1 mL of Folin–Ciocalteu reagent and 2 mL of saturated Na2CO3 solution, and stayed quiescently for an hour and determined at a wavelength of 700 nm using Genesys 30 visible-spectrophotometer (Thermo, Waltham, MA, USA).

Determination of Total Catechins

The content of total catechins in the tea infusion was determined through the previously published colorimetric method [37]. Gallic acid was as standard. A total of 1 mL of infusion sample was reacted with 3 mL phosphate-buffered saline (pH = 7.5, 0.1 N) and 1 mL tartaric acid coloring agents made from 100 mg ferrous sulfate and 500 mg potassium sodium tartrate quantitative with DI water into 100 mL. Total catechin content of this reaction solution was determined at a wavelength of 540 nm through Genesys 30 visible-spectrophotometer (Thermo, Waltham, MA, USA) after mixing and quiescent for a half hour.

Determination of Total Flavones

The analysis of total flavone content was conducted following the methods of the previous study [10]. The absorbance of 1 mL infusion sample reacted with 9 mL 1% (w/w) aluminum chloride determined at 420 nm (A420) via Genesys 30 visible-spectrophotometer (Thermo, Waltham, MA, USA) and substituted into the following equation:
Flavones (mg mL−1) = (A420 × 320)/103

Determination of Total Amino Acids

The ninhydrin colorimetric method was carried out to determine the content of total free amino acids by a modified ninhydrin colorimetric assay based on the method of the previous study [38]. Standard concentrations of L-theanine ranged from 0 to 0.2 mg mL−1 were used as calibration curves. A total of 2 mL of infusion sample was reacted with 1 mL of ninhydrin spray reagent and 1 mL of stannous chloride solution prepared with citrate buffer solution (4 M, pH 5.2) as a solvent; afterward, it was heated in 80 °C water bath for 20 min. The reaction mixture was then cooled rapidly by adding 5 mL of isopropanol/water diluent (1/1, v/v) with vigorous mixing. The level of free amino acids was measured at a wavelength of 540 nm through Genesys 30 visible-spectrophotometer (Thermo, Waltham, MA, USA).

Determination of Caffeine

The caffeine content in tea infusion was determined by the spectrophotometric method [38]. The caffeine standard concentration range of 0–12 mg L−1 was prepared as a calibration curve. Tea infusion samples that were 50 to 100 times diluted to fit within the calibration range were measured directly at a wavelength of 276 nm through a UV-Vis spectrophotometer (T60, PG Instruments Ltd., Lutterworth, UK).

2.4. Statistical Analysis

Statistical analyses were conducted using SAS v9.4 software (Statistical Analysis System, SAS Institute Inc., Cary, NC, USA) to perform the basic statistical data of the soil properties and the level of components in tea. Pearson’s correlation analysis and principal component analysis (PCA) were carried out with a database through SAS software to perform the relevance among the soil characteristics, the mineral nutrients and Al, and the quality compositions of tea as well as to extract the main soil variation influence on leaf quality compositions. The results of correlation analysis were represented by the heat map produced by MATLAB 2018 version (The MathWorks, Inc., Portola Valley, MA, USA).

3. Results

3.1. Soil Properties in Different Depths

The results of basic soil properties in different depths are given in Table 1. Soil pH at the depth of 0–20 cm, 20–40 cm, and 40–60 cm was ranged within 3.5–5.3, 3.3–5.0, and 4.4–5.4, respectively. The soil of selected plantations belonged to strong or extremely acid soil, which are the optimum pH range for tea plant growth (Peng et al., 2018). Because the higher pH was addressed along with soil depth, the chemical fertilizer application at surface soil in conventional cultivation could be presumed as the reason. The OM contents at each soil sampling depth were 1.44 ± 0.4%, 1.21 ± 0.48%, and 1.18 ± 0.48%, respectively, which indicated a bit deficiency in the scale as a highly productive soil has a content of around 2%. The value of EC, OM, and WAS consociately decreased as the depth of soil went deeper. The concentration of available nutrients in selected plantations soil were varied. Nevertheless, the nutrient levels within the first quartile (Q1) and third quartile (Q3) in our dataset (Table 1) were regarded as a moderate and rich grade, as recommended by TRES Taiwan.

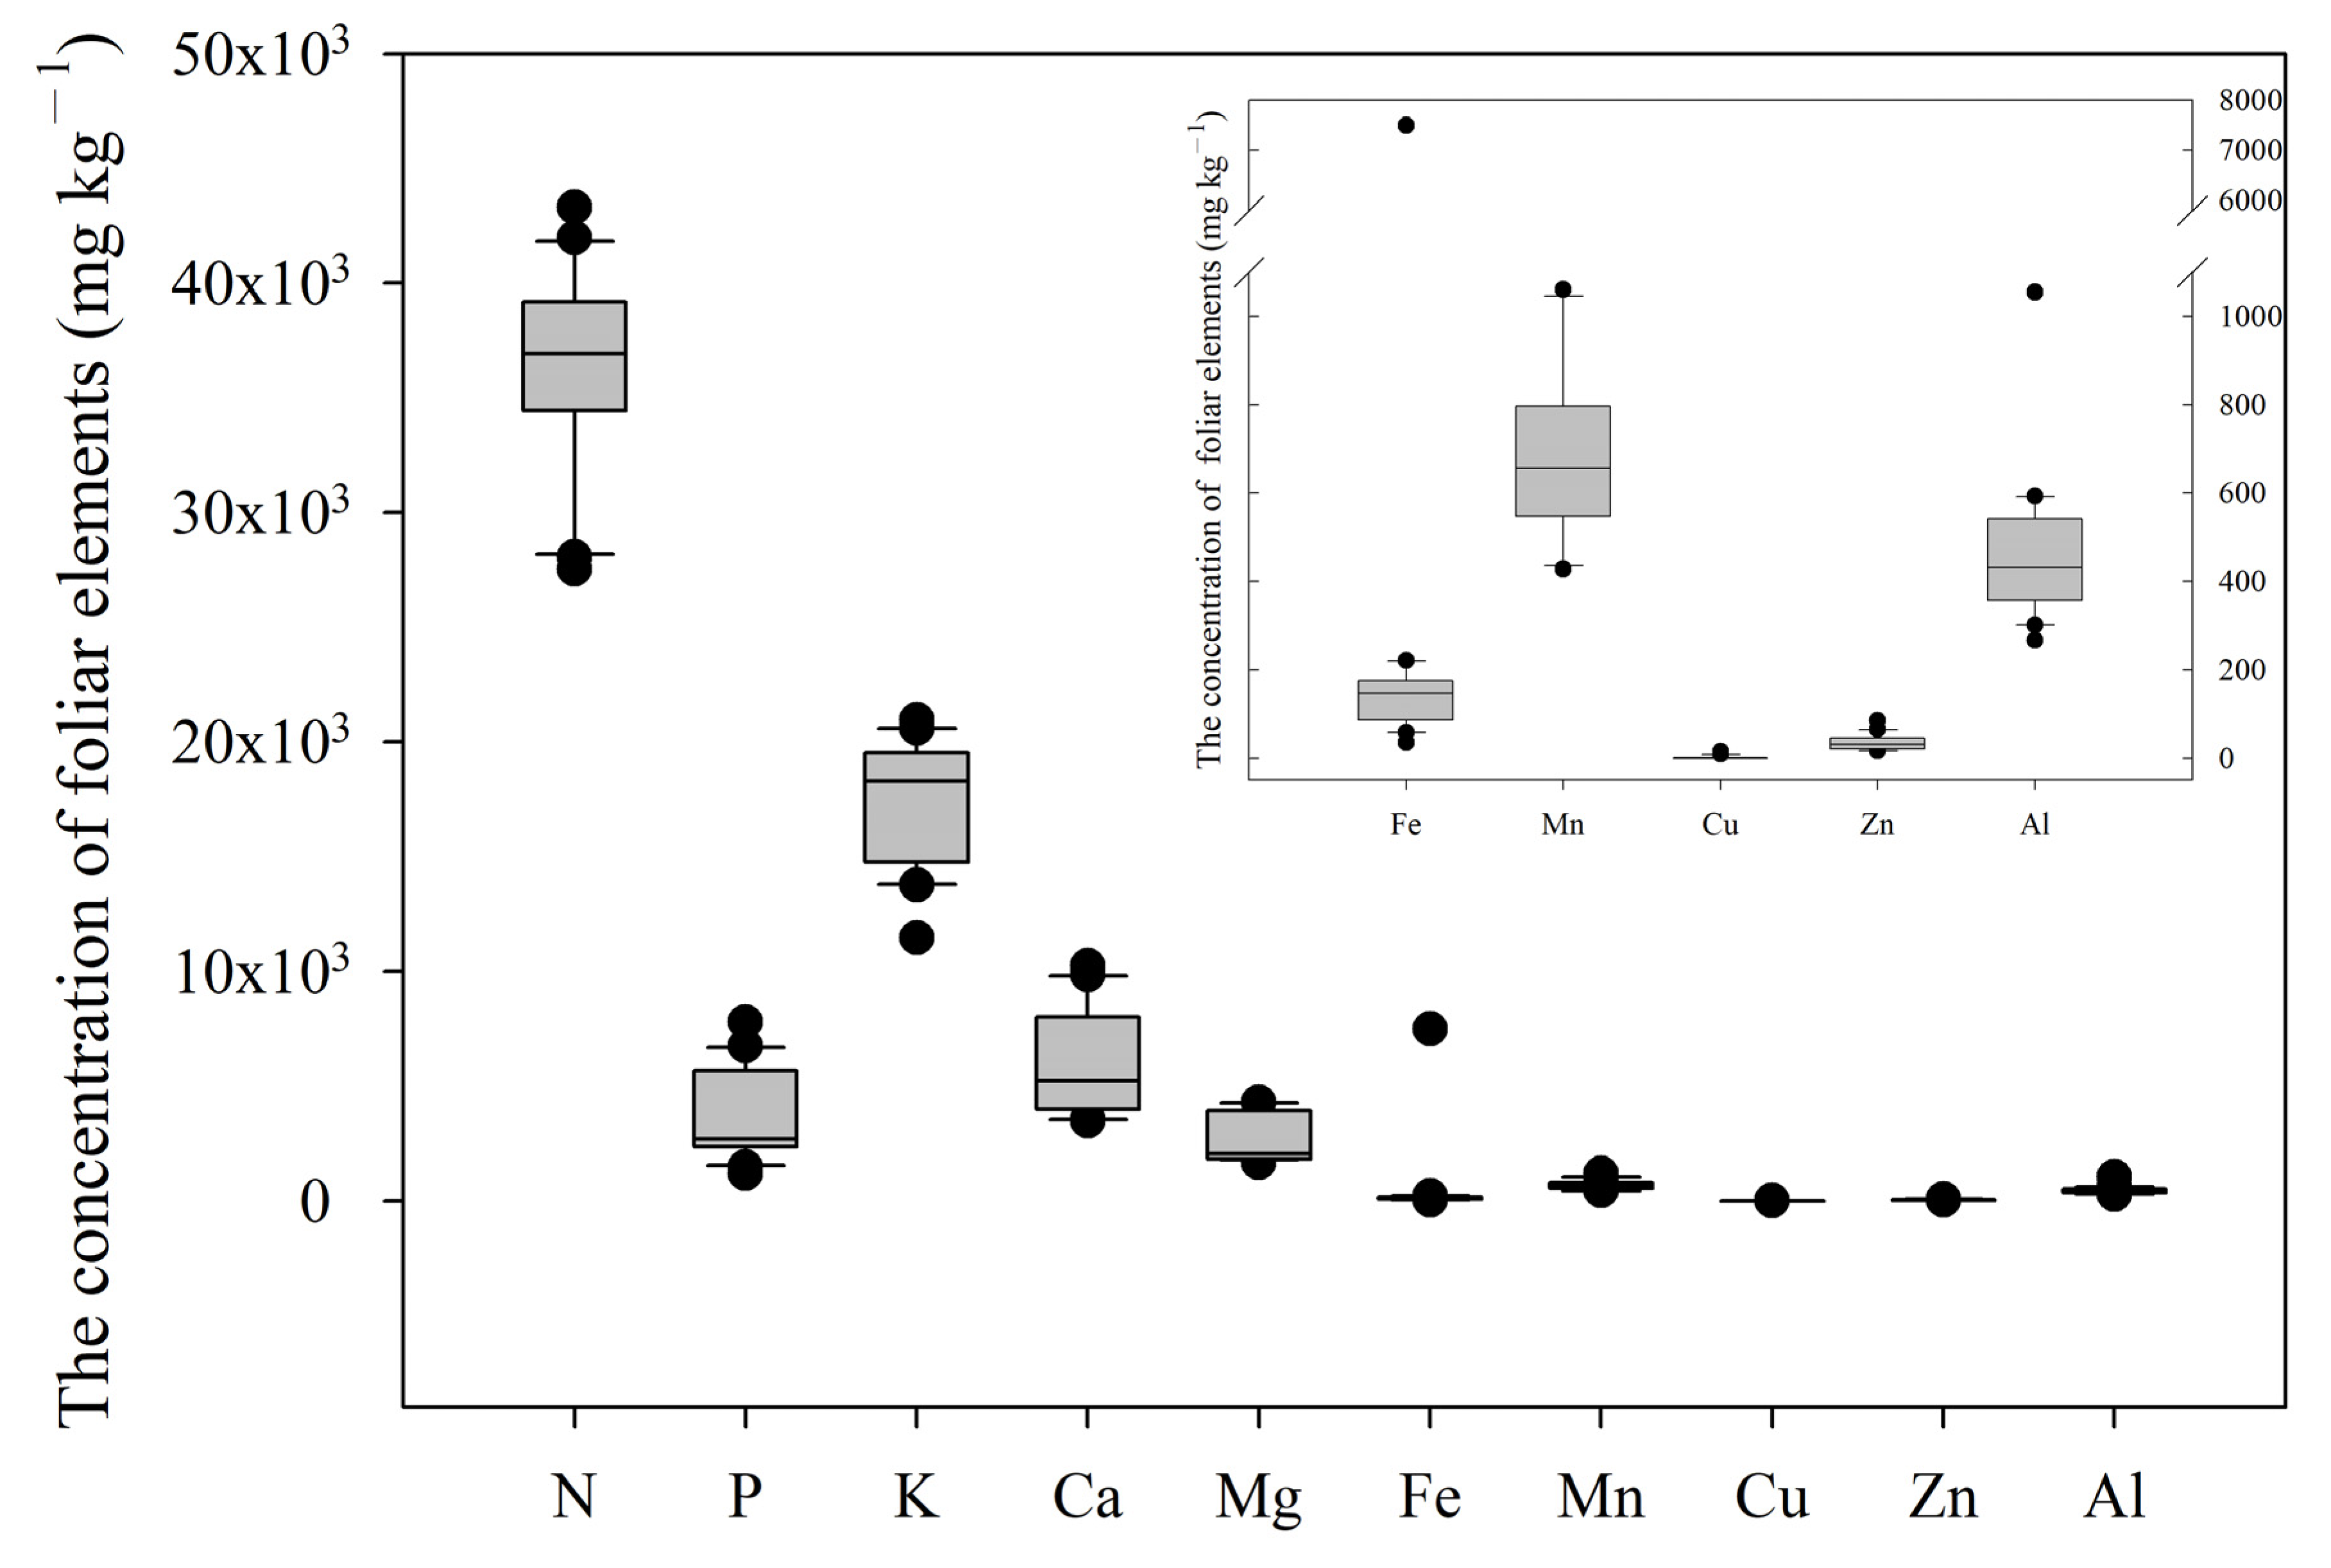
3.2. The Concentration of Leaf Nutrient Elements

In tea leaf samples, the basic descriptive statistics of elements are presented in Table 2. Elements enriched in tea leaves in descending order were N > K > Ca > P > Mg > Mn > Al > Fe > Zn > Cu as shown in Figure 2. Sufficient macronutrient levels were determined in our research validated by the range of tea N, P, K, Ca, and Mg standard levels, 4.0–6.0%, 0.2–0.4%, 1.5–2.0%, 0.2–0.6%, and 0.1–0.3%, respectively [39]. Among these leaf samples, tea Fe concentration was mutable that the maximum and minimum value were 7497 and 34 mg kg−1, respectively, compared with the standard nutrient ranging from 90–150 mg kg−1. As a high Mn and Al tolerant plant, tea Mn concentration varied 2.8-fold, from 427 to 1205 mg kg−1 among the 27 samples from selected plantations, and the Al concentration varied 4-fold from 266 to 1054 mg kg−1. The tea Cu concentration in the majority of selected samples was not detectable with the standard nutrient level range of 8–15 mg kg−1.

3.3. The Content of Extractable Chemical Compositions in Tea Leaves

The extractable chemical composition contents in tea leaves are presented in Table 3. There were 15–45% total polyphenols of dry weight (DW) of tea, which is claimed to attribute an astringent taste, determined in overall selected tea leaf samples and revealed a varying variation. The content of catechins and flavones, which are yellow pigmentation and an astringency attributor was 14–35% DW and 9–16% DW, respectively. The content of free amino acids, umami taste contributor, was 1.7–5.8% with the normal level ranging from 1% to 4%. Moreover, the content of caffeine was 4.7–9.6% DW determined among selected samples.

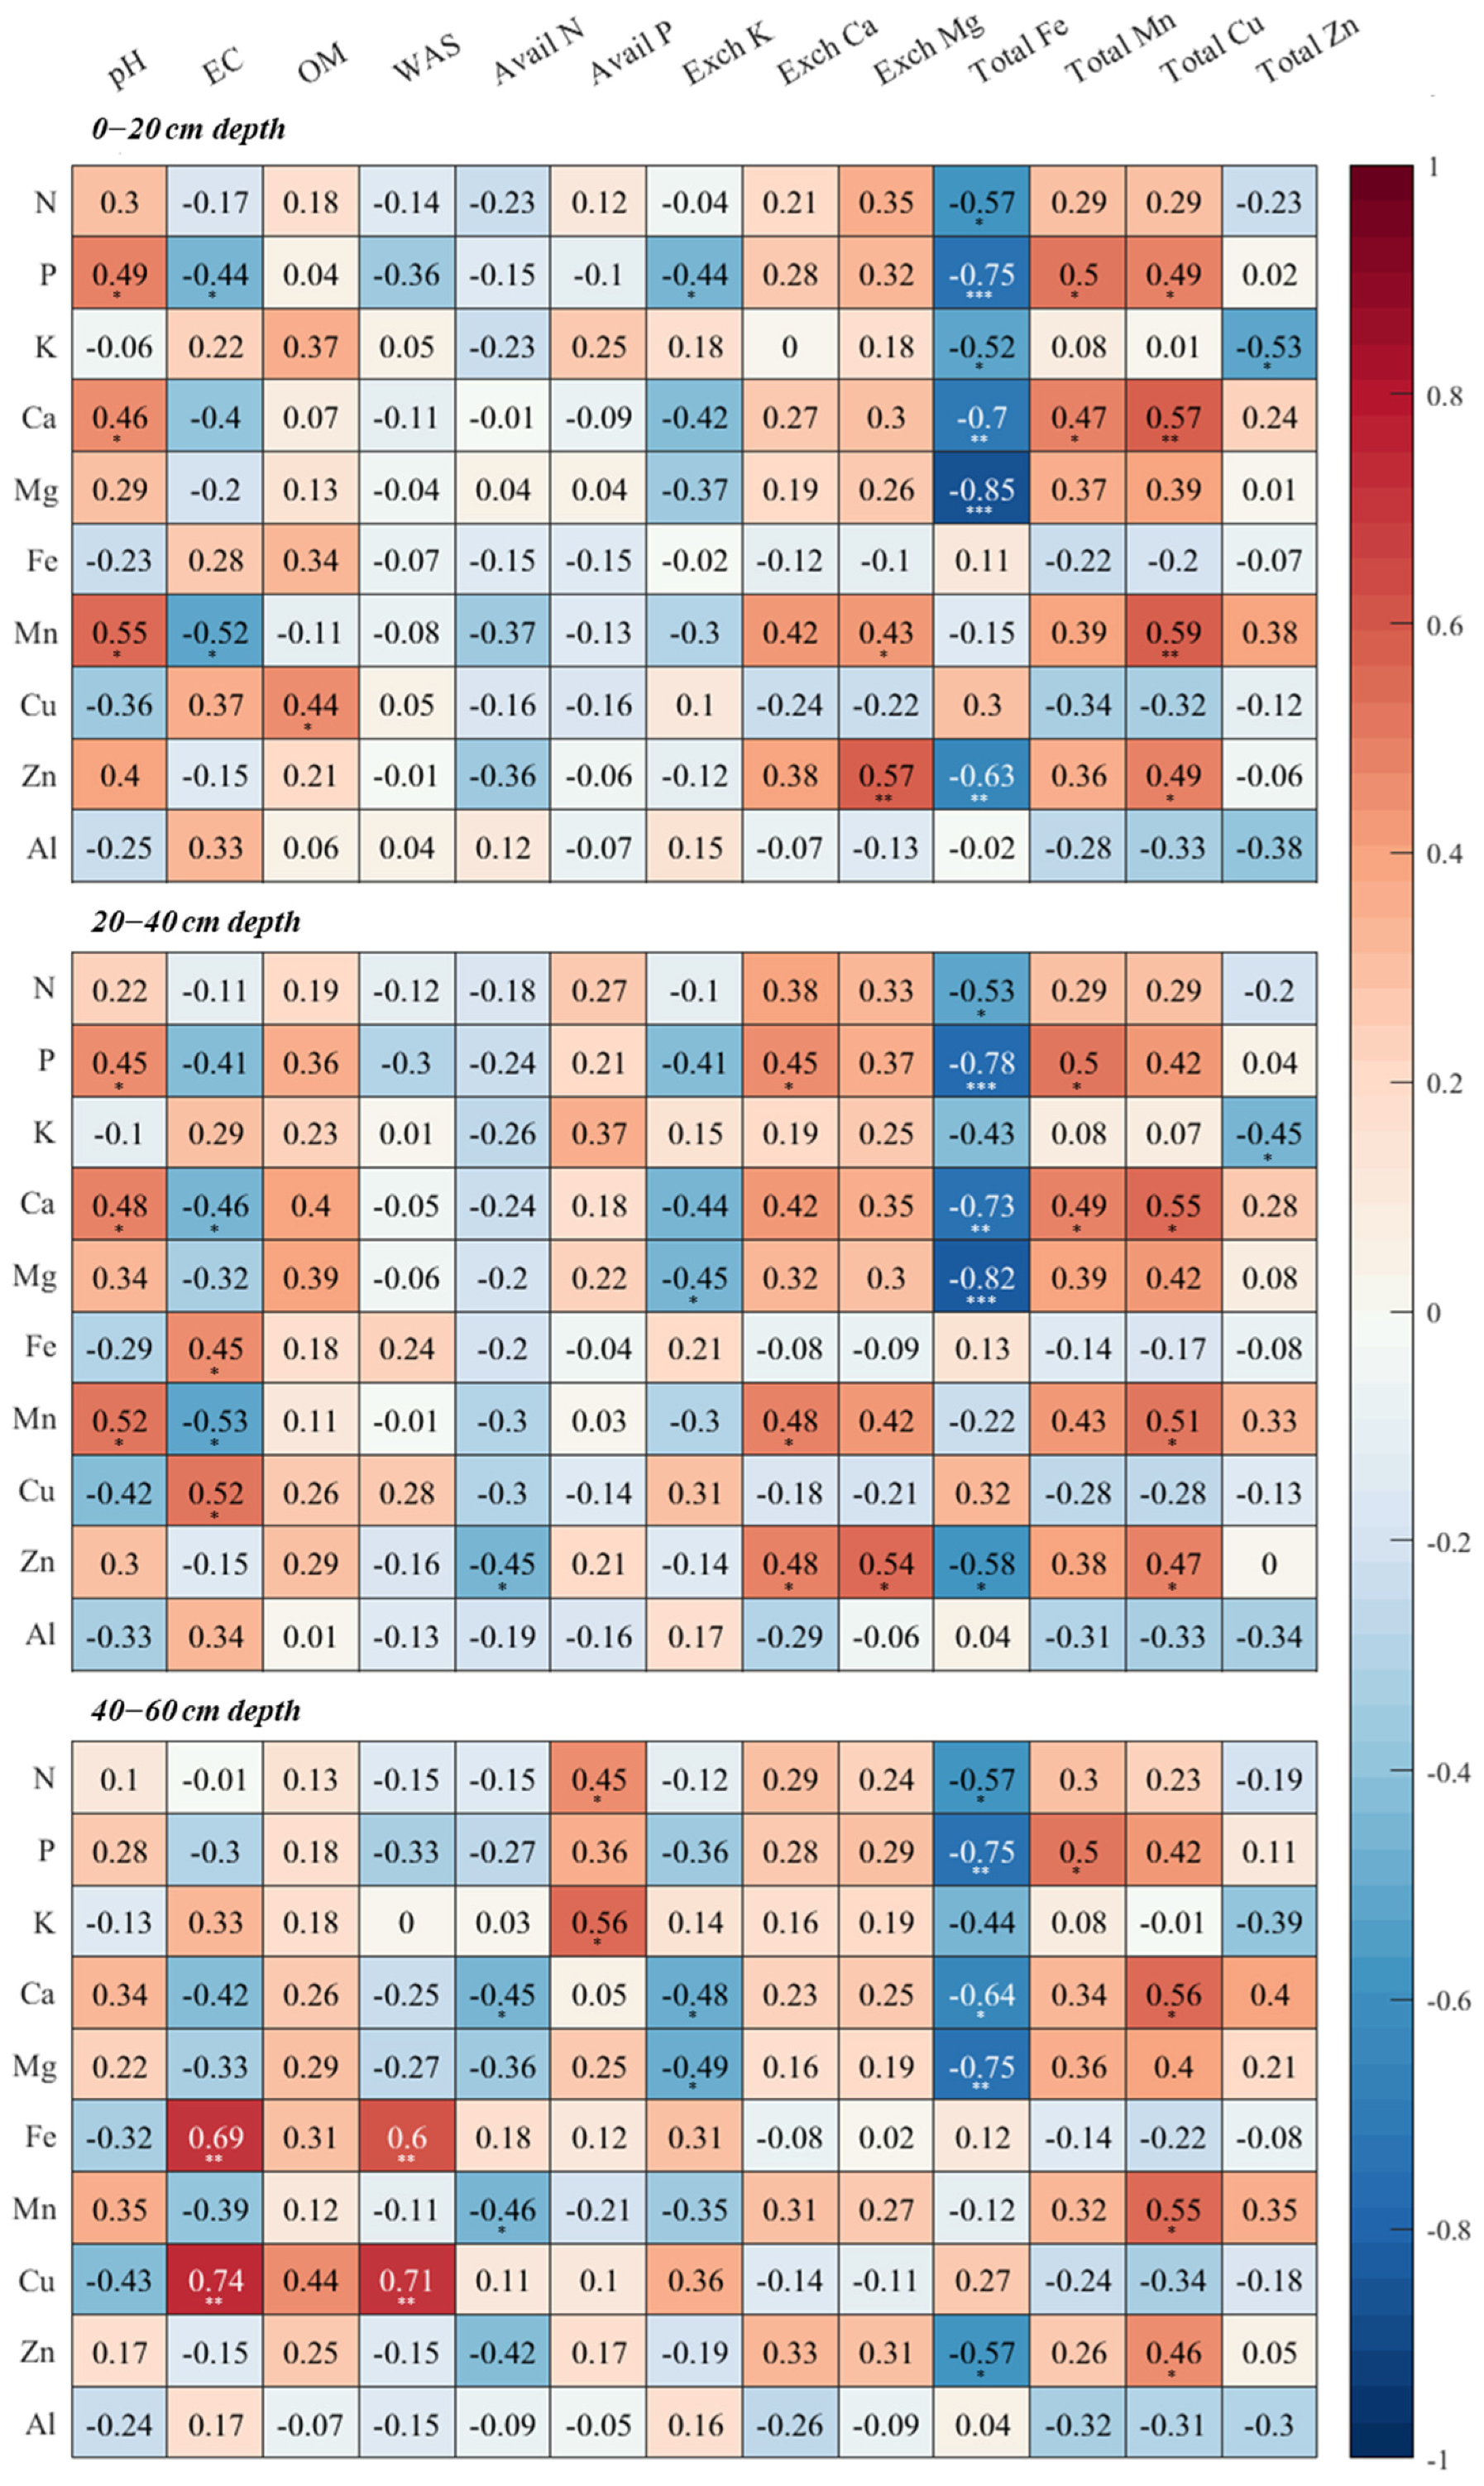
3.4. Heat Map for the Relationship between Soil Properties and Leaf Elements

The Pearson’s correlation coefficient between soil available nutrients and leaf elements is illustrated as a heat map in Figure 3. The basic soil characteristics, such as pH and EC, in three different depths of soils were related to different elements in tea leaves. Soil pH was significantly correlated with P, Ca, and Mn in tea leaves in 0–20 cm and 20–40 cm depth. Of note, soil EC and WAS were highly significantly correlated with Fe and Cu at the depth of 40–60 cm, compared with the results at the above (0–20 cm and 20–40 cm). Similarly, the significant statistical results of availability P were predominantly exhibited at the depth of 40–60 cm. Furthermore, leaf elements revealed clear relationships with concentrations of exchangeable Ca, exchangeable Mg, total Mn, and total Zn at the topsoil and subsoil, while the total concentration of Fe and Cu was also significantly related to leaf Ca, Mn, and Zn at all sampled depths.

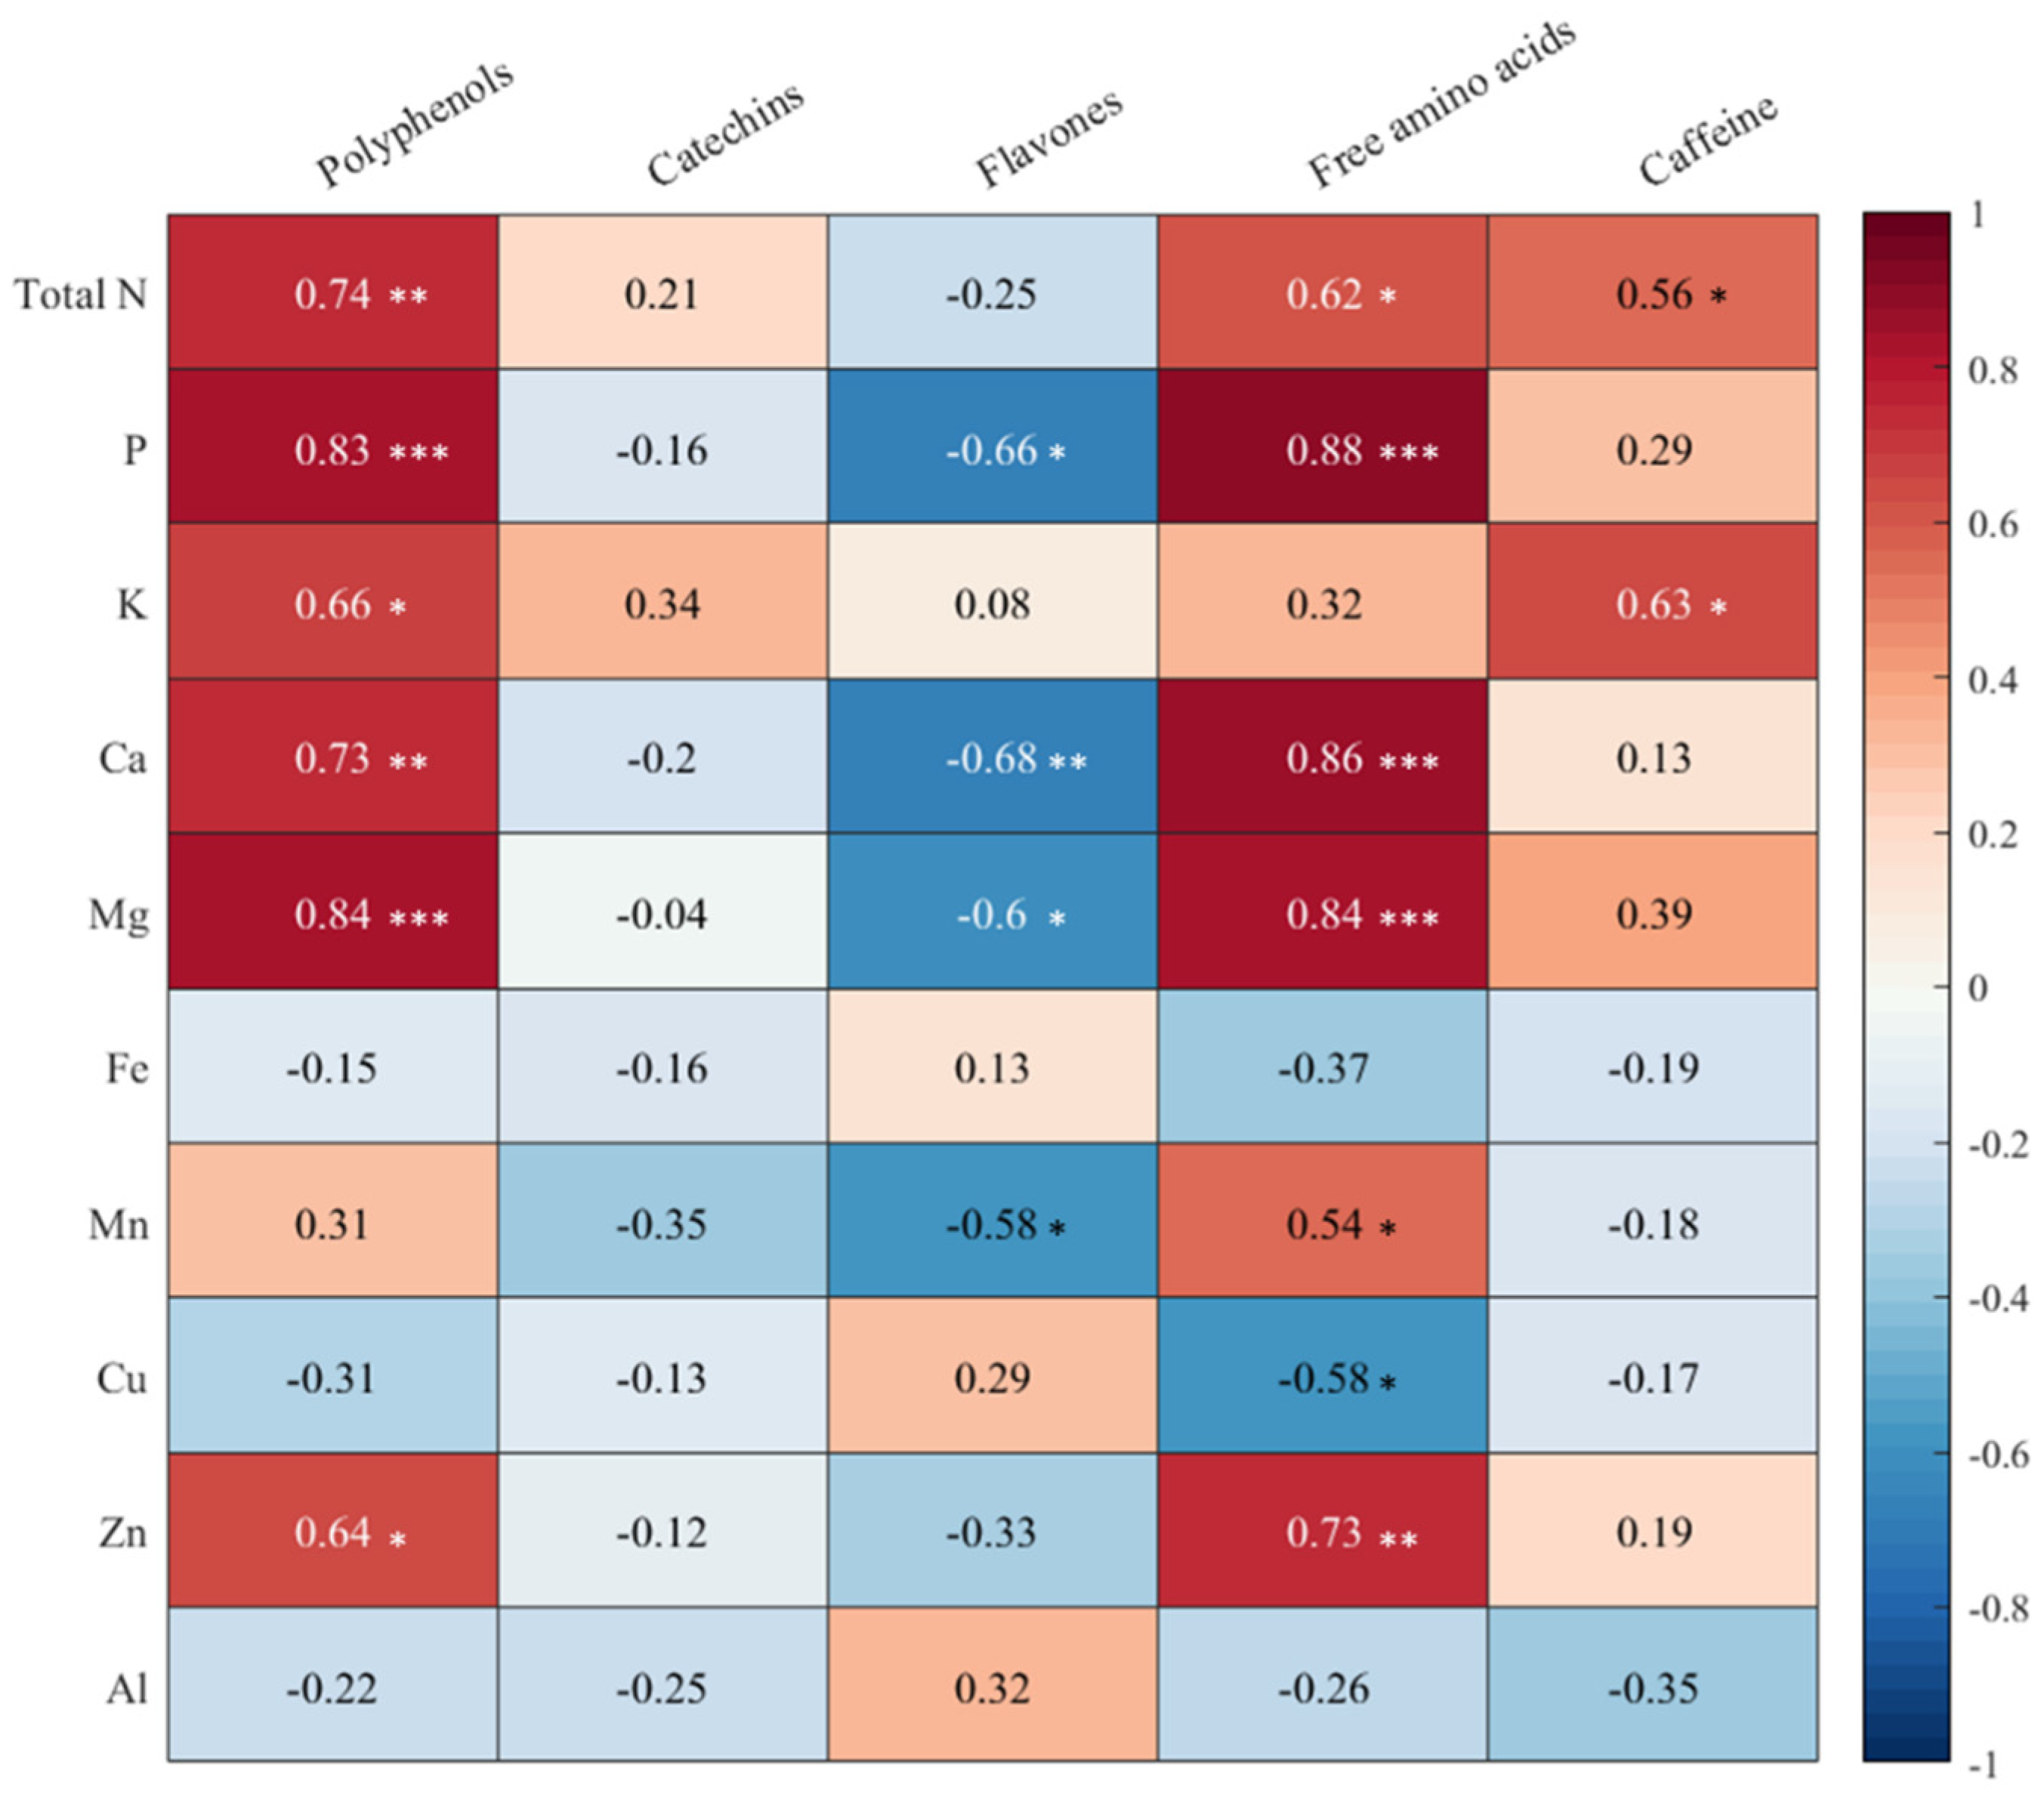
3.5. Heat Map for the Relationship between Leaf Elements and Chemical Compositions

The relationship among leaf element levels and the five main chemical composition contents is illustrated in Figure 4. The macronutrients, such as N, P, K, Ca, and Mg as well as the micronutrient, Zn, were positively related to polyphenols; the Pearson’s correlation coefficients were 0.74 (p < 0.01), 0.83 (p < 0.0001), 0.66 (p < 0.05), 0.73 (p < 0.01), 0.84 (p < 0.0001), and 0.64 (p < 0.05), respectively. The catechins, which is the subgroup of flavonoids, had nonrelationships with elements, whereas the flavones revealed negative relationships with P (−0.66, p < 0.05), Ca (−0.68, p < 0.01), Mg (−0.60, p < 0.05), and Mn (−0.58, p < 0.05) concentrations in the leaves. Except for leaf Fe and Al, the positive relationships between each element and organic N-containing compounds, free amino acids, were also depicted, whereas they related negatively to Cu. Regarding caffeine, its level was moderately related to leaf N and K.

3.6. PCA and PCA Correlation between Soil Properties and Tea Quality Compositions

Firstly, there were four components whose eigenvalue was greater than one that were selected and are presented in Table 4. These four components implemented the correlation analysis with chemical compositions presented in Table 5 and Table 6. The PC1 score calculated by the equation obtained by eigenvectors was positively related to free amino acid levels. Notably, pH, EC, exchangeable Ca, exchangeable Mg, total concentration of Mn and Cu with the over 0.7 correlation coefficient were obtained and regarded as the main soil factors influencing free amino acids. In addition, PC3 and PC4 had fewer strength relationships with polyphenols, flavones, and caffeine that showed the decreasing OM and increasing available N effect on flavone induction as well as the total Fe, Zn, and WAS effect on polyphenols and caffeine.

4. Discussion

4.1. The Nutrient Element Uptake and Usability for Different Depths of Soil

The relationships between soil pH and leaf P, Ca, and Mn indicate that soil pH around tea roots was readily implicated in the transfer and accumulation of nutrients from soil to plants [40]. In addition, the results revealed that the abundance of metals was affected by the changing soil conditions, such as pH, EC, OM, and WAS [41]. Despite that previous research demonstrated the concentration of plant tissue nutrients relies on the corresponding soil nutrient supply [42], our nonsignificant correlation revealed that mineral nutrients needed for tea leaf growth may be mainly supplied by the nutrients stored in the sink of tea trees instead of reflected immediately by the available nutrient levels of soil. Nevertheless, the limiting nutrients, such as soil available N and exchangeable K, were significantly negatively related to leaf Ca, Mg, and Mn; soil available P was positively related to leaf N and K at a depth of 40–60 cm, and showed that the macronutrient alteration around the main root system may affect the other element uptakes or cycles. Moreover, the rhizosphere soil of tea garden evidencing the accumulations of iron oxides also revealed the negative association with leaf macronutrients and Zn might be given the competitive interaction. Overall, a seasonal strategy of fertilization application in autumn and winter may subsequently remobilize and support the next spring growth [43,44].

4.2. Implication of Leaf Element Level for Tea Quality Chemical Compositions

Despite the previous findings that chemical compositions are induced under high solar radiation and high temperature stress [16], N, P, K, Ca, Mg, and Zn play crucial roles in the synthesis of polyphenols and free amino acids in Sijichun leaves [45]. N not only promotes tea plant growth but also indirectly affects the synthesis of theanine and the accumulation of catechin in tea leaves by inducing the activity of phenylalanine ammonia-lyase and increasing the activity of glutamate synthase, which is responsible for theanine production in the sink of tea trees [46,47,48]. The abundance of Mg may indirectly affect the biosynthesis of polyphenols, flavonoids, and free amino acids because of the role of chloroplast center and catalyst involved in phosphorylation [20,49]. Likewise, K was demonstrated not only to improve drought stress but also to induce more free amino acids. In addition, our results may suggest that there was a threshold of P level enhancing catechins and flavones since the result of a negative relationship with leaf P to flavones and a nonrelationship to catechins contradicted the results of earlier research that proposed the inhibition of cinnamic acid biosynthesis, which is the precursor of flavonoid metabolism, occurring under P deficiency [50].
In microelements, Zn, the nonmobile nutrient, was revealed to play an important role as well as induce the accumulation of polyphenols, flavonoids, and free amino acids in the tender bud and leaf growth [51,52]. Of note, phenolic metabolism was induced on account of an Al tolerance mechanism in general. However, phenolic compounds were not induced excessively by leaf Al within the critical level between 400–900 mg kg−1 (the Al level of our study had a range of 260–1060 mg kg−1) [53,54]. This finding suggested that the soil pH of the tea garden should be maintained in a proper range to avoid external Al stress by soil acidification, thus formatting the astringency compounds.

4.3. From Soil Properties, Elements, to Tea Quality Compositions

Our finding according to the result of the PCA correlation revealed that free amino acids might be enriched by increasing soil pH, exchangeable Ca, exchangeable Mg, total Mn and, total Cu level in the suitable range as well as by decreasing soil EC value, a result that was similar to the previous study [55]. Consequently, soil pH is the foundation of tea plantation management [56]. Free amino acids content increased with increasing pH values under the condition of pH 3.50–5.21 in our study [57]. Meanwhile, exchangeable Mg was suggested as the vital soil factor to increase theanine and keep the activity of nitrate reductase, glutamine synthetase, and theanine synthetase under an adequate nutrient level in tea roots [58,59,60,61]. With regards to leaf nutrients, the soil exchangeable Ca and Mg and total Mn and total Cu, which were indicated to be associated with free amino acids, showed a consistent relationship with P, Ca, Mn, Cu, Zn in leaves in Figure 2 and Figure 3. This finding was discussed with possible implications being that pH, EC, exchangeable Ca, exchangeable Mg, total Mn, and total Cu are pivotal factors in the soil management of tea gardens to enhance the free amino acids of tea and suggest that fertilization has significant effects on crop taste quality [62].

5. Conclusions

Tea polyphenols and free amino acid contents in tea leaves were simultaneously enhanced by adequate leaf macronutrients and Zn. Moreover, the caffeine content had a moderately positive relevance with leaf N and K, whereas the flavone content had a negative relevance with leaf P, Ca, Mg, and Mn. These findings revealed the specific nutrients acted as important roles in Sijichun to enhance the richness of tea taste but reduce the tea pigment based on our result. Regarding soil management, although soil available nutrients cannot respond to the concentration of corresponding essential elements in tea leaves, the continuous and seasonal fertilization strategy would still affect the concentration and metabolic transformation of tea elements and affect the quality of tea trees. Soil pH, EC, the concentration of exchangeable Ca, exchangeable Mg, as well as total Cu and Mn were assessed to significantly influence free amino acids content, namely, increasing the pH of soil within an appropriate limit, and managing soil effective Ca, Mg, Cu, and Mn supply could help to obtain higher free amino acids for a greater umami taste of tea. This finding might be valuable for improving the quality of tea and the sustainable management of tea plantations.

Author Contributions

Conceptualization, W.-Y.T. and H.-Y.L.; Data curation, W.-Y.T.; Methodology, W.-Y.T. and H.-Y.L.; Project administration and supervision, H.-Y.L.; Writing—original draft, W.-Y.T.; Writing—review and editing, H.-Y.L. All authors have read and agreed to the published version of the manuscript.

Funding

This research was funded by the Ministry of Science and Technology of the Republic of China grant number MOST 108-2321-B-005-010 and in part by the Ministry of Education, Taiwan, under the Higher Education Sprout Project.

Institutional Review Board Statement

Not applicable.

Informed Consent Statement

Not applicable.

Data Availability Statement

Not applicable.

Acknowledgments

We gratefully appreciate all the labmates, especially our student, Prapasiri Tongsiri, for helping with laboratory work and preparing the setup of the experiment. And, we would like to express our special thanks to Enzo Chen for the English correction of this paper.

Conflicts of Interest

The authors declare no conflict of interest.

Abbreviations

NNitrogen
PPhosphorus
KPotassium
CaCalcium
MgMagnesium
FeIron
MnManganese
CuCopper
ZnZinc
AlAluminum
ECElectrical Conductivity (Wsoil/Vwater = 1/5)
OMOrganic matter
WASWet aggregate stability
GSGlutamine synthetase
GOGATGlutamate synthase
TSTheanine synthetase
GTPGlutamic-pyruvic transaminase
GLDGlutamate dehydrogenase
PPOPolyphenol oxidase
PCAPrincipal components analysis
PP/AA ratio Polyphenol/amino acid ratio
EPA TaiwanEnvironmental Protection Administration, Executive Yuan, Taiwan
TRES TaiwanTea Research and Extension Station, Executive Yuan, Taiwan

References

  1. Ahmed, S.; Unachukwu, U.; Stepp, J.R.; Peters, C.M.; Long, C.L.; Kennelly, E. Pu-erh tea tasting in Yunnan, China: Correlation of drinkers’ perceptions to phytochemistry. J. Ethnopharmacol. 2010, 132, 176–185. [Google Scholar] [CrossRef] [PubMed] [Green Version]
  2. FAOSTAT. 2020 Food and Agriculture Data. Available online: https://www.fao.org/faostat/en/#data/QCL (accessed on 22 January 2022).
  3. Liang, Y.R.; Lu, J.L.; Zhang, L.Y.; Wu, S.; Wu, Y. Estimation of black tea quality by analysis of chemical composition and colour difference of tea infusions. Food Chem. 2003, 80, 283–290. [Google Scholar] [CrossRef]
  4. Alasalvar, C.; Topal, B.; Serpen, A.; Bahar, B.; Pelvan, E.; Gokmen, V. Flavor Characteristics of Seven Grades of Black Tea Produced in Turkey. J. Agric. Food Chem. 2012, 60, 6323–6332. [Google Scholar] [CrossRef]
  5. Dai, W.D.; Qi, D.D.; Yang, T.; Lv, H.P.; Guo, L.; Zhang, Y.; Zhu, Y.; Peng, Q.H.; Xie, D.C.; Tan, J.F.; et al. Nontargeted analysis using ultraperformance liquid chromatography-quadrupole time-of-flight mass spectrometry uncovers the effects of harvest season on the metabolites and taste quality of tea (Camellia sinensis L.). J. Agric. Food Chem. 2015, 63, 9869–9878. [Google Scholar] [CrossRef]
  6. Khokhar, S.; Magnusdottir, S.G.M. Total phenol, catechin, and caffeine contents of teas commonly consumed in the United Kingdom. J. Agric. Food Chem. 2002, 50, 565–570. [Google Scholar] [CrossRef]
  7. Gai, Z.S.; Wang, Y.; Jiang, J.T.; Xie, H.; Ding, Z.T.; Ding, S.B.; Wang, H. The quality evaluation of tea (Camellia sinensis) varieties based on the metabolomics. HortScience 2019, 54, 409–415. [Google Scholar] [CrossRef] [Green Version]
  8. Kaneko, S.; Kumazawa, K.; Masuda, H.; Henze, A.; Hofmann, T. Molecular and sensory studies on the umami taste of Japanese green tea. J. Agric. Food Chem. 2006, 54, 2688–2694. [Google Scholar] [CrossRef] [PubMed]
  9. Xu, Y.Q.; Liu, P.P.; Shi, J.; Gao, Y.; Wang, Q.S.; Yin, J.F. Quality development and main chemical components of Tieguanyin oolong teas processed from different parts of fresh shoots. Food Chem. 2018, 249, 176–183. [Google Scholar] [CrossRef] [PubMed]
  10. Chen, S.T.; Kang, L.; Wang, C.Z.; Huang, P.J.; Huang, H.T.; Lin, S.Y.; Chou, S.H.; Lu, C.C.; Shen, P.C.; Lin, Y.S.; et al. (-)-Epigallocatechin-3-Gallate decreases osteoclastogenesis via modulation of rankl and osteoprotegrin. Molecules 2019, 24, 156. [Google Scholar] [CrossRef] [PubMed] [Green Version]
  11. Cleverdon, R.; Elhalaby, Y.; McAlpine, M.D.; Gittings, W.; Ward, W.E. Total polyphenol content and antioxidant capacity of tea bags: Comparison of black, green, red rooibos, chamomile and peppermint over different steep times. Beverages 2018, 4, 15. [Google Scholar] [CrossRef] [Green Version]
  12. Yonekura, Y.; Terauchi, M.; Hirose, A.; Odai, T.; Kato, K.; Miyasaka, N. Daily coffee and green tea consumption is inversely associated with body mass index, body fat percentage, and cardio-ankle vascular index in middle-aged japanese women: A cross-sectional study. Nutrients 2020, 12, 1370. [Google Scholar] [CrossRef] [PubMed]
  13. Lee, M.K.; Kim, H.W.; Lee, S.H.; Kim, Y.J.; Asamenew, G.; Choi, J.; Lee, J.W.; Jung, H.A.; Yoo, S.M.; Kim, J.B. Characterization of catechins, theaflavins, and flavonols by leaf processing step in green and black teas (Camellia sinensis) using UPLC-DAD-QToF/MS. Eur. Food Res. Technol. 2019, 245, 997–1010. [Google Scholar] [CrossRef] [Green Version]
  14. Ozdemir, F.; Sahin Nadeem, H.; Akdogan, A.; Dincer, C.; Topuz, A. Effect of altitude, shooting period, and tea grade on the catechins, caffeine, theaflavin, and thearubigin of Turkish black tea. Turk. J. Agric. For. 2018, 42, 334–340. [Google Scholar] [CrossRef]
  15. Jayasekera, S.; Kaur, L.; Molan, A.L.; Garg, M.L.; Moughan, P.J. Effects of season and plantation on phenolic content of unfermented and fermented Sri Lankan tea. Food Chem. 2014, 152, 546–551. [Google Scholar] [CrossRef]
  16. Ahmed, S.; Griffin, T.S.; Kraner, D.; Schaffner, M.K.; Sharma, D.; Hazel, M.; Leitch, A.R.; Orians, C.M.; Han, W.Y.; Stepp, J.R.; et al. Environmental factors variably impact tea secondary metabolites in the context of climate change. Front. Plant Sci. 2019, 10, 939. [Google Scholar] [CrossRef] [Green Version]
  17. Willson, K.C.; Clifford, M.N. Tea: Cultivation to Consumption; Springer Science & Business Media: Berlin, Germany, 2012. [Google Scholar]
  18. Qiao, C.L.; Xu, B.; Han, Y.T.; Wang, J.; Wang, X.; Liu, L.L.; Liu, W.X.; Wan, S.Q.; Tan, H.; Liu, Y.Z.; et al. Synthetic nitrogen fertilizers alter the soil chemistry, production and quality of tea. A meta-analysis. Agron. Sustain. Dev. 2018, 38, 1–10. [Google Scholar] [CrossRef] [Green Version]
  19. Ruan, J.Y.; Wu, X.; Hardter, R. Effects of potassium and magnesium nutrition on the quality components of different types of tea. J. Sci. Food Agric. 1999, 79, 47–52. [Google Scholar] [CrossRef]
  20. Chen, P.A.; Lin, S.Y.; Liu, C.F.; Su, Y.S.; Cheng, H.Y.; Shiau, J.H.; Chen, I.Z. Correlation between nitrogen application to tea flushes and quality of green and black teas. Sci. Hortic. 2015, 181, 102–107. [Google Scholar] [CrossRef]
  21. Lin, Z.H.; Qi, Y.P.; Chen, R.B.; Zhang, F.Z.; Chen, L.S. Effects of phosphorus supply on the quality of green tea. Food Chem. 2012, 130, 908–914. [Google Scholar] [CrossRef]
  22. Steffens, J.C.; Harel, E.; Hunt, M.D. Polyphenol oxidase. In Genetic Engineering of Plant Secondary Metabolism; Ellis, B.E., Kuroki, G.W., Stafford, H.A., Eds.; Springer: Boston, MA, USA, 1994; pp. 275–312. [Google Scholar]
  23. Sun, L.; Zhang, M.; Liu, X.; Mao, Q.; Shi, C.; Kochian, L.V.; Liao, H. Aluminium is essential for root growth and development of tea plants (Camellia sinensis). J. Integr. Plant Biol. 2020, 62, 984–997. [Google Scholar] [CrossRef]
  24. Tolra, R.; Martos, S.; Hajiboland, R.; Poschenrieder, C. Aluminium alters mineral composition and polyphenol metabolism in leaves of tea plants (Camellia sinensis). J. Inorg. Biochem. 2020, 204, 110956. [Google Scholar] [CrossRef]
  25. Brady, N.C.; Weil, R.R. Elements of the Nature and Properties of Soils, 3rd ed.; Pearson: New York, NY, USA, 2013. [Google Scholar]
  26. Thomas, G.W. Soil pH and soil acidity. In Methods of Soil Analysis: Part 3 Chemical Methods, 5.3; Sparks, D.L., Ed.; SSSA Book Series 5; SSSA Inc. and ASA Inc.: Madison, WI, USA, 1996; pp. 475–490. [Google Scholar]
  27. Rhoades, J. Salinity: Electrical conductivity and total dissolved solids. In Methods of Soil Analysis: Part 3 Chemical Methods, 5.3; Sparks, D.L., Ed.; SSSA Book Series 5; SSSA Inc. and ASA Inc.: Madison, WI, USA, 1996; pp. 417–435. [Google Scholar]
  28. Nelson, D.W.; Sommers, L.E. Total carbon, organic carbon, and organic matter. In Methods of Soil Analysis: Part 3 Chemical Methods, 5.3; Sparks, D.L., Ed.; SSSA Book Series 5; SSSA Inc. and ASA Inc.: Madison, WI, USA, 1996; pp. 961–1010. [Google Scholar]
  29. Kemper, W.; Rosenau, R. Aggregate stability and size distribution. In Methods of Soil Analysis: Part 1 Physical and Mineralogical Methods, 5.1; SSSA Book Series 5; SSSA Inc.: Madison, WI, USA, 1986; pp. 425–442. [Google Scholar]
  30. Mulvaney, R.L. Nitrogen—inorganic forms. In Methods of soil analysis: Part 3 Chemical Methods, 5.3; Sparks, D.L., Ed.; SSSA Inc. and ASA Inc.: Madison, WI, USA, 1996; pp. 1123–1184. [Google Scholar]
  31. Kuo, S. Phosphorus. In Methods of soil analysis: Part 3 Chemical Methods, 5.3; Sparks, D.L., Ed.; SSSA Book Series 5; SSSA Inc. and ASA Inc.: Madison, WI, USA, 1996; pp. 869–919. [Google Scholar]
  32. Murphy, J.; Riley, J.P. A modified single solution method for the determination of phosphate in natural waters. Anal. Chim. Acta 1962, 27, 31–36. [Google Scholar] [CrossRef]
  33. Mehlich, A. Mehlich 3 soil test extractant: A modification of Mehlich 2 extractant. Commun. Soil Sci. Plant Anal. 1984, 15, 1409–1416. [Google Scholar] [CrossRef]
  34. EPA, Taiwan. Method Code No: NIEA S6321.65B; Environmental Protection Adiministration of Taiwan ROC: Taipei, Taiwan, 2018.
  35. Jones, J.B., Jr.; Case, V.W. Sampling, handling, and analyzing plant tissue samples. In Soil Testing and Plant Analysis, 3rd ed.; Westerman, R.L., Ed.; SSSA Inc.: Madison, WI, USA, 1990; pp. 389–427. [Google Scholar]
  36. Dai, J.R.; Lin, S.R.; Huang, Y.J.; Yang, M.J. Effects of extraction temperature and time on the contents of tea catechins and total polyphenols. Taiwan Tea Res. Bull. 2016, 32, 151–163. [Google Scholar]
  37. Ou, S.M.; Liu, S.L.; Tsai, Y.S.; Chen, K.R. Characteristics of Taiwan Tiehkuanyin tea identified by physicochemical and stepwise discriminant analyses. Taiwan Tea Res. Bull. 2004, 23, 133–144. [Google Scholar]
  38. Huang, C.C.; Ko, C.H. Impact of chemical composition of TTES No. 18 due to variations of processing treatments. Taiwan Tea Res. Bull. 2006, 25, 197–204. [Google Scholar]
  39. Wang, C.Y. Tea Crop Science: Tea Plant Cultivation and Garden Management; New Sharing Culture Enterprise Co., Ltd.: Taipei, Taiwan, 2018; p. 202. [Google Scholar]
  40. Tao, C.J.; Song, Y.X.; Chen, Z.; Zhao, W.F.; Ji, J.F.; Shen, N.P.; Ayoko, G.A.; Frost, R.L. Geological load and health risk of heavy metals uptake by tea from soil: What are the significant influencing factors? Catena 2021, 204, 105419. [Google Scholar] [CrossRef]
  41. Peng, C.Y.; Zhu, X.H.; Hou, R.Y.; Ge, G.F.; Hua, R.M.; Wan, X.C.; Cai, H.M. Aluminum and heavy metal accumulation in tea leaves: An interplay of environmental and plant factors and an assessment of exposure risks to consumers. J. Food Sci. 2018, 83, 1165–1172. [Google Scholar] [CrossRef] [PubMed]
  42. Dang, M.V. Soil-plant nutrient balance of tea crops in the northern mountainous region, Vietnam. Agric. Ecosyst. Environ. 2005, 105, 413–418. [Google Scholar] [CrossRef]
  43. Ma, L.F.; Shi, Y.Z.; Ruan, J.Y. Nitrogen absorption by field-grown tea plants (Camellia sinensis) in winter dormancy and utilization in spring shoots. Plant Soil 2019, 442, 127–140. [Google Scholar] [CrossRef]
  44. Uscola, M.; Villar-Salvador, P.; Gross, P.; Maillard, P. Fast growth involves high dependence on stored resources in seedlings of Mediterranean evergreen trees. Ann. Bot. 2015, 115, 1001–1013. [Google Scholar] [CrossRef] [Green Version]
  45. Sun, L.L.; Liu, Y.; Wu, L.Q.; Liao, H. Comprehensive analysis revealed the close relationship between n/p/k status and secondary metabolites in tea leaves. ACS Omega 2019, 4, 176–184. [Google Scholar] [CrossRef] [Green Version]
  46. Kovacik, J.; Klejdus, B. Induction of phenolic metabolites and physiological changes in chamomile plants in relation to nitrogen nutrition. Food Chem. 2014, 142, 334–341. [Google Scholar] [CrossRef]
  47. Liu, M.Y.; Burgos, A.; Zhang, Q.F.; Tang, D.D.; Shi, Y.Z.; Ma, L.F.; Yi, X.Y.; Ruan, J.Y. Analyses of transcriptome profiles and selected metabolites unravel the metabolic response to NH4+ and NO3– as signaling molecules in tea plant (Camellia sinensis L.). Sci. Hortic. 2017, 218, 293–303. [Google Scholar] [CrossRef]
  48. Liu, Z.W.; Li, H.; Liu, J.X.; Wang, Y.; Zhuang, J. Integrative transcriptome, proteome, and microRNA analysis reveals the effects of nitrogen sufficiency and deficiency conditions on theanine metabolism in the tea plant (Camellia sinensis). Hortic. Res. 2020, 7, 65. [Google Scholar] [CrossRef] [PubMed]
  49. Ruan, J.Y.; Ma, L.F.; Shi, Y.Z. Potassium management in tea plantations: Its uptake by field plants, status in soils, and efficacy on yields and quality of teas in China. J. Plant Nutr. Soil Sci. 2013, 176, 450–459. [Google Scholar] [CrossRef]
  50. Ding, Z.T.; Jia, S.S.; Wang, Y.; Xiao, J.; Zhang, Y.F. Phosphate stresses affect ionome and metabolome in tea plants. Plant Physiol. Biochem. 2017, 120, 30–39. [Google Scholar] [CrossRef]
  51. Borowiak, K.; Gasecka, M.; Mleczek, M.; Dabrowski, J.; Chadzinikolau, T.; Magdziak, Z.; Golinski, P.; Rutkowski, P.; Kozubik, T. Photosynthetic activity in relation to chlorophylls, carbohydrates, phenolics and growth of a hybrid Salix purpurea × triandra × viminalis 2 at various Zn concentrations. Acta Physiol. Plant. 2015, 37, 1–12. [Google Scholar] [CrossRef] [Green Version]
  52. Hajiboland, R.; Bahrami-Rad, S.; Bastani, S. Phenolics metabolism in boron-deficient tea [Camellia sinensis (L.) O. Kuntze] plants. Acta Biol. Hung. 2013, 64, 196–206. [Google Scholar] [CrossRef]
  53. Kochian, L.V. Cellular mechanisms of aluminum toxicity and resistance in plants. Ann. Rev. Plant Physiol. Plant Molecular Biol. 1995, 46, 237–260. [Google Scholar] [CrossRef]
  54. Chen, Y.M.; Tsao, T.M.; Liu, C.C.; Lin, K.C.; Wang, M.K. Aluminium and nutrients induce changes in the profiles of phenolic substances in tea plants (Camellia sinensis CV TTES, No. 12 (TTE)). J. Sci. Food Agric. 2011, 91, 1111–1117. [Google Scholar] [CrossRef] [PubMed]
  55. Tongsiri, P.; Tseng, W.Y.; Shen, Y.; Lai, H.Y. Comparison of soil properties and organic components in infusions according to different aerial appearances of tea plantations in central Taiwan. Sustainability 2020, 12, 4384. [Google Scholar] [CrossRef]
  56. Li, S.Y.; Li, H.X.; Yang, C.L.; Wang, Y.D.; Xue, H.; Niu, Y.F. Rates of soil acidification in tea plantations and possible causes. Agric. Ecosyst. Environ. 2016, 233, 60–66. [Google Scholar] [CrossRef]
  57. Wen, B.; Li, R.; Zhao, X.; Ren, S.; Chang, Y.; Zhang, K.; Wang, S.; Guo, G.; Zhu, X. A Quadratic regression model to quantify plantation soil factors that affect tea quality. Agriculture 2021, 11, 1225. [Google Scholar] [CrossRef]
  58. Ding, Y.; Luo, W.; Xu, G. Characterisation of magnesium nutrition and interaction of magnesium and potassium in rice. Ann. Appl. Biol. 2006, 149, 111–123. [Google Scholar] [CrossRef]
  59. Ruan, J.; Wu, X.; Ye, Y.; Härdter, R. Effect of potassium, magnesium and sulphur applied in different forms of fertilisers on free amino acid content in leaves of tea (Camellia sinensis L.). J. Sci. Food Agric. 1998, 76, 389–396. [Google Scholar] [CrossRef]
  60. Ruan, J.Y.; Ma, L.F.; Yang, Y.J. Magnesium nutrition on accumulation and transport of amino acids in tea plants. J. Sci. Food Agric. 2012, 92, 1375–1383. [Google Scholar] [CrossRef] [PubMed]
  61. Jayaganesh, S.; Venkatesan, S. Impact of magnesium sulphate on biochemical and quality. Am. J. Food Techn. 2010, 5, 31–39. [Google Scholar] [CrossRef] [Green Version]
  62. Yang, T.T.; Li, H.Y.; Hu, X.F.; Li, J.; Hu, J.N.; Liu, R.; Deng, Z.Y. Effects of fertilizing with N, P, Se, and Zn on regulating the element and functional component contents and antioxidant activity of tea leaves planted in red soil. J. Agric. Food Chem. 2014, 62, 3823–3830. [Google Scholar] [CrossRef]
Figure 1. The map of soil sampling sites in Mingjian township, Nantou county, Taiwan that were generated via ArcGIS. (https://www.esri.com/en-us/arcgis/products/arcgis-desktop/overview; mapped on 7 January 2022).
Agronomy 12 00670 g001
Figure 2. Visualization comparison of the concentration of ten foliar elements (n = 20). The unit of macronutrients was converted into mg kg−1.
Agronomy 12 00670 g002
Figure 3. Heatmap of the correlation coefficient between different soil depth properties and elements in Sijichun leaves. The soil properties are depicted on the horizontal axis while the elements are depicted on the vertical axis. *: p < 0.05; **: p < 0.01; ***: p < 0.0001. Abbreviations: EC, electrical conductivity; OM, organic matter; WAS, wet aggregate stability; Avail., Available; Exch., Exchangeable.
Agronomy 12 00670 g003
Figure 4. Heatmap of the correlation coefficient between element nutrients and chemical compositions in Sijichun leaves. The chemical compositions are depicted on the horizontal axis, while the elements are depicted on the vertical axis. *: p < 0.05; **: p < 0.01; ***: p < 0.0001.
Agronomy 12 00670 g004
Table 1. The basic descriptive statistics of soil properties 1. (n = 20).
pHECOMWASAvail. NAvail. PExch. KExch. CaExch. MgTotal FeTotal MnTotal CuTotal Zn
dS m−1%mg kg−1
0–20 cm depth
Mean ± SD4.04 ± 0.410.19 ± 0.091.44 ± 0.5044.3 ± 11.312.78 ± 8.20302 ± 195171 ± 93223.1 ± 216.0120.4 ± 86.234,177 ± 614222.34 ± 9.7739.61 ± 15.6178.7 ± 62.0
Max5.210.402.3668.7530.38691.41489.05932.28458.0540,202.046.7100.63317.3
Q3 24.260.251.8251.8616.88429.45215.31242.48153.7738,590.025.742.36208.4
Medium3.960.171.4143.1913.50297.75147.64133.6586.9736,651.020.638.32182.2
Q1 23.730.121.1137.416.75105.70111.34100.0371.7928,929.015.029.76111.2
Min3.500.050.6719.210.0032.0357.1346.8248.3623,374.013.223.8599.42
20–40 cm depth
Mean ± SD4.11 ± 0.410.16 ± 0.081.21 ± 0.4841.0 ± 10.710.51 ± 7.63230 ± 180141 ± 62176.2 ± 160.391.9 ± 65.334,289 ± 597521.73 ± 9.4340.48 ± 15.4186.6 ± 62.7
Max4.940.342.0666.1926.35691.41295.28712.26317.7740,58347.5893.47316.6
Q34.370.221.5748.5713.50347.03182.13253.28108.2438,22324.945.26230.3
Medium4.000.141.1839.416.75205.41147.02118.2071.6337,28017.8537.15190.7
Q13.800.090.7335.406.7575.5485.5167.0343.5430,53815.4629.94124.3
Min3.470.070.5716.830.0018.0538.3816.6934.3622,64513.1421.4098.5
40–60 cm depth
Mean ± SD4.19± 0.490.14 ± 0.091.18 ± 0.4838.8 ± 9.19.75 ± 6.78144 ± 122138 ± 63180.7 ± 218.779.82 ± 52.3533,744 ± 570721.21 ± 7.0638.1 ± 13.2183.1 ± 65.1
Max5.430.422.3064.1826.24471.85242.37795.81223.3939,40137.0486.15337.4
Q34.460.181.4241.7813.50211.85201.46229.6294.4637,69726.0743.66229.3
Medium4.100.101.1337.376.75105.70128.5786.0477.1136,50719.8336.98187.2
Q13.840.080.8033.703.3858.3385.5132.8639.8931,20615.5829.82120.6
Min3.490.040.5519.760.0012.6434.6312.7428.1922,03812.2220.7291.65
1 Abbreviations: EC, electrical conductivity; OM, organic matter; WAS, wet aggregate stability; Avail., Available; Exch., Exchangeable. 2 Q1 and Q3 are the first and third quartiles of dataset arranged in increasing order.
Table 2. The basic descriptive statistics of the elements in tea leaves. (n = 20).
NPKCaMgFeMnCuZnAl
%mg kg−1
Mean ± SD3.62 ± 0.430.38 ± 0.201.75 ± 0.270.6 ± 0.220.27 ± 0.11498.9 ± 1648699 ± 207.91.54 ± 3.5736.3 ± 18.89469.6 ± 168.8
Max4.330.782.101.020.437497.901205.8314.1384.511054.38
Q3 13.880.561.950.770.39171.07792.630.7544.71531.92
Medium3.690.271.830.520.20146.21656.42ND 230.98432.84
Q1 13.480.241.480.410.1888.85553.86ND21.22369.62
Min2.750.121.150.350.1734.39427.09ND15.24266.04
1 Q1 and Q3 are the first and third quartiles of dataset arranged in increasing order. 2 ND: not detectable.
Table 3. The basic descriptive statistics of chemical compositions in tea leaves. (n = 20).
PolyphenolsCatechinsFlavonesFree Amino AcidsCaffeine
mg g−1%
Mean ± SD306.1 ± 70.6267.6 ± 45.1128.8 ± 17.636.66 ± 11.418.12 ± 1.2
Max451.4349.6156.658.139.57
Q3 1360.2290.7141.343.748.95
Medium297.1267.1129.135.268.55
Q1 1265.0240.1115.428.467.36
Min155.8147.492.0017.964.79
1 Q1 and Q3 are the first and third quartiles of dataset arranged in increasing order.
Table 4. The selected eigenvalues greater than one of PCA by database in 0–60 cm soil properties.
FactorEigenvalueDifferenceProportionCumulative
14.7663572.1182250.36660.3666
22.6481320.8411310.20370.5703
31.8070010.4621210.13900.7093
41.3448800.4816860.10350.8128
Table 5. The eigenvectors for variations of PCA by dataset in 0–60 cm soil properties.
Soil PropertiesEigenvectors
Factor 1Factor 2Factor 3Factor 4
pH0.96997 1−0.08209−0.106540.02801
EC−0.828080.383070.053490.02407
OM−0.303580.189860.804890.01164
WAS−0.402940.441590.317220.54703
Avail. N0.13583−0.01854−0.71906−0.13002
Avail. P−0.100060.750000.11796−0.45127
Exch. K−0.183700.82988−0.395540.13329
Exch. Ca0.875400.31566−0.035090.08174
Exch. Mg0.793100.380770.022590.06946
Total Fe−0.138800.44980−0.403530.63010
Total Mn0.727560.386980.28273−0.22302
Total Cu0.850630.332400.268940.12923
Total Zn0.39439−0.552130.200150.57520
1 The bold values assigned to the eigenvector greater than 0.6.
Table 6. PCA correlations between PCA score of average soil properties at 0–60 cm depth and chemical composition in Sijichun leaves.
Leaf Chem.
Composition
PC1PC2PC3PC4
r 1p Valuerp Valuerp Valuerp Value
Polyphenols0.3320.15210.0050.98370.4130.0702−0.6560.0017
Catechins−0.0770.74820.2360.3162−0.3490.1313−0.1290.5867
Flavones−0.3430.13920.3690.1091−0.4700.03640.2160.3604
Free Amino Acids0.7150.0004−0.1700.47370.3380.1449−0.4710.0359
Caffeine0.0590.80480.2140.3644−0.0340.8881−0.5260.0172
1 −0.7 ≤ r ≥ 0.7 indicate strong correlation; the bold values assigned to show the statistically significant result when p value is less than 0.05.
Publisher’s Note: MDPI stays neutral with regard to jurisdictional claims in published maps and institutional affiliations.

