Article

Recovery Characteristics of Cry1Ac Endotoxin Expression and Related Physiological Mechanisms in Bt Transgenic Cotton Squares after High-Temperature Stress Termination

Jiangsu Key Laboratory of Crop Cultivation and Physiology, Agricultural College of Yangzhou University, Yangzhou 225009, China
*
Author to whom correspondence should be addressed.
Agronomy 2022, 12(3), 668; https://doi.org/10.3390/agronomy12030668
Submission received: 13 February 2022 / Revised: 5 March 2022 / Accepted: 7 March 2022 / Published: 10 March 2022

Abstract

:
High-temperature stress reduces the endotoxin expression of the insecticidal gene (Cry1Ac) in transgenic Bacillus thuringiensis (Bt) cotton and affects nitrogen metabolism. However, its effects on Cry1Ac endotoxin expression after high-temperature stress termination remain unclear. In order to investigate the effect of high-temperature stress on the expression of insecticidal proteins in Bt cotton squares, the conventional Sikang-1 cultivar and hybrid Sikang-3 cultivar were used as the experimental materials. The potted cotton plants in the squaring stage were moved to an artificial climatic chamber at 38 °C for 72 h and 96 h in 2017 and 2018, respectively, and plants were moved to the climate chamber where the control cotton plants were located (at 27 °C). Then, cotton squares were collected to measure the Bt protein concentration and nitrogen metabolism physiology at 0, 12, 24, 48, 72 and 96 h after high-temperature stress termination, respectively. The Cry1Ac endotoxin expression of the squares could be recovered to the corresponding control level and a longer recovery time was required as the high-temperature stress period increased. Therefore, the recovery degree of Cry1Ac endotoxin expression of cotton squares can be predicted according to the duration of high-temperature stress, which may provide a reference for the rational control of Helicoverpa armigera and related pests in cotton production.

1. Introduction

Since its initial commercialization in the 1990s, Bacillus thuringiensis (Bt) transgenic cotton has been widely grown worldwide [1,2,3,4], increasing the economic prosperity of cotton growers, reducing the need for chemical insecticides and, thus, allowing for improved worker safety and environmental pollution [5,6]. However, the Bt insecticide gene is not always properly expressed during the growing season [7,8], and in China, as well as in other countries, it exhibits varying insecticidal effects in different growing stages [9,10]. The maximum resistance of Bt cotton shows evident characteristics in the early stages of growth, and lower toxin expression in the yield stage, which reduces bollworm resistance [8]. In addition, the leaves of these Bt cotton plants exhibit greater insecticidal effects compared to other plant organs, and these effects are increased in the leaves of younger plants whilst also decreased in the reproductive organs of cotton plants [9,10,11]. The decrease in protein concentrations is associated with reduced insecticidal activity [12,13]. This decrease can be attributed to the silencing of introduced transgenes [14], extreme environmental conditions or the age or reproductive status of individual plants [15,16,17,18]. Benedict and Sachs et al. studied the insect resistance, Bt protein expression and soluble protein changes of the Bt cotton plants in different regions of the United States. They reported that temperature, soil moisture and fertilizer affected the expression of insect resistance genes of the Bt cotton plants [13]. Chen et al. showed that the expression of Cry1Ac endotoxin in cotton leaves significantly decreased after 24 h and 48 h of high-temperature stress at 37 °C in the boll stage [19]. Wang et al. found that the physiological activity of nitrogen metabolism in the boll shell of transgenic Bt cotton was changed after high-temperature stress at the peak of the boll stage [20]. Other researchers also demonstrated that the change of Bt cotton resistance is related to heredity, physiological ages and nitrogen metabolism, as well as the environment. Many studies have shown that the insect resistance of the Bt cotton was affected by extreme environments with stage-specific effects [21,22,23]. Whether the insect resistance in the Bt cotton recovers or partially recovers after the extreme environmental stress or not has rarely been reported. Chen et al. studied the recovery characteristics of Bt protein expression in leaves after high- and low-temperature stress termination. However, they did not consider the recovery of insect resistance of the reproductive organ that cotton bollworm preferred under temperature stress [24]. Some studies have also shown that Bt protein is also a part of soluble protein, which is also closely related to protein synthesis [25,26,27]. Therefore, we assume that the recovery of the Bt protein after high-temperature stress is also related to protein turnover, and the key enzymes of proteins will also change. Further studies on the changes of insecticidal protein expression in Bt cotton squares after high-temperature stress termination are of great theoretical and practical significance in order to characterize the recovery of insect resistance as well as its safe application.

2. Materials and Methods

2.1. Plant Materials and Field Design

A temperature-controlled glass greenhouse under natural light was used to conduct this study at Yangzhou University, Yangzhou, Jiangsu Province, China (32°30′ N, 119°25′ E) during the cotton growing seasons in 2017 and 2018. Two Bt cotton cultivars (medium in maturity), i.e., Sikang 1 (SK-1, Bt cultivar) and Sikang 3 (SK-3, hybrid Bt cultivar), were grown in a warm room under plastic mulch from April 6th of each year. Forty-one days after sowing (DAS41: 17th May), the seeds were then transplanted into porcelain pots (30 cm 35 cm, height × diameter) with one seedling per pot. The pot contained 20 kg of sandy loam (i.e., typical Fluvaquents and Entisols) with 18.8 g·kg−1 of organic matter and 134.7, 22.5 and 81.3 mg·kg−1 of available N, P and K, respectively. Standard local management practices were used to water and fertilize the plants throughout the growing season. The SK-1 and SK-3 plants flowered on DAS90 and DAS91, respectively. The first flower of cotton boll occurred on DAS138 and DAS139, respectively.
When the cotton plant grew to the peak of the crimping stage, the date of the crimp emergence was marked on the first fruiting node of the first five fruiting branches of the cotton plant. The cotton plants were moved to the artificial climate chamber for high-temperature stress experiments when the labelled square was 15 days old. The experiment was performed by following a completely randomized design. The duration of continuous stress at a critical high temperature of 38 °C was 72 h in 2017 and was increased to 96 h in 2018 on the basis of the 2017 experiment. After the stress was terminated, the cotton plants were moved to the artificial climate chamber where the control cotton plants were located (at 27 °C).

2.2. Preparation of Plant Material

In 2017 and 2018, cotton squares were collected at 0, 12, 24, 48, 72 and 96 h after temperature stress termination, respectively. Twelve plants were measured at each time point, and 12 different plants were used in the next sampling round. The squares were frozen with liquid nitrogen, stored in an ultra-low-temperature freezer, and utilized to assess Bt protein content, nitrogen metabolizing chemicals and enzymes activities.

2.3. Physiological Measurements

2.3.1. Cry1Ac Protein Concentration Assay

Cry1Ac protein levels were assessed in square extracts via ELISA [28]. Briefly, frozen square tissue extracts (0.5–0.8 g) were mixed with 2 mL of lysis buffer (Na2CO3 1.33 g, DTT 0.192 g, NaCl 1.461 g, and Vc 0.5 g in 250 mL dH2O), homogenized, transferred to a new tube, and residue was rinsed with 3 mL of this lysis buffer, which was combined with the original lysate solution. The mixture was then constantly agitated for 4 h at 4 °C, followed by centrifugation for 20 min at 10,000× g at 4 °C and passage through a C18 Sep-Pak Catridge (Waters, MA, USA). Supernatants were collected for analysis. Microtiter plates were coated with samples or Cry1Ac insecticidal protein standards for 4 h at 37 °C. Antibodies were added to individual wells for an additional 30 min at 37 °C. Cry1Ac protein-specific antibodies were obtained, as previously discussed by Weiler et al. [26]. Then, horseradish peroxidase-labeled goat antirabbit immunoglobulin was added to each well for 30 min at 37 °C, after which orthopenylenediamino was added as a buffered enzyme substrate. After a 15 min incubation at 37 °C while protected from light, this enzymatic reaction was terminated with 3 M H2SO4, and absorbance at 490 nm was assessed, with results being assessed as previously detailed by Weiler et al. [29].

2.3.2. Free Amino Acid and Soluble Protein Content Analyses

Square extracts (0.5 g) from different treatments were used to extract and analyze the levels of soluble protein and amino acids in prepared samples. Following initial homogenization in 5 mL of chilled water (MilliQ grade) at 4 °C, samples were centrifuged for 5 min at 800× g, and supernatants were stored on ice while pellets were resuspended with 3 mL of cold water and centrifuged again for an additional 5 min at 800× g. These two supernatant samples were then pooled, and this process was repeated a third time with 2 mL of cold water. After all three supernatants had been combined, a ninhydrin assay was used to measure the total levels of free amino acids therein [30]. Measured absorbance values were converted into μg amino acid g−1 fresh weight with a glycine-based standard curve. The Bradford Coomassie Blue dye-based method was employed to assess total protein content, with BSA being used to prepare a standard curve [31].

2.3.3. Glutamic Pyruvic Transaminase (GPT) and Glutamate Oxaloacetate Transaminase (GOT) Assays

Square extracts from different treatment conditions were utilized to assess GPT and GOT activity. Initially, 0.5 g per sample was homogenized in a buffered media (0.05 mM Tris-HCl, pH 7.2), followed by centrifugation for 10 min at 26,100× g at 0 °C. GOT activity in prepared supernatants was them measured by mixing 0.5 mL of 0.8 M alanine in 0.1 M Tris-HCl (pH 7.5) and 0.1 mL of 2 mM pyridoxal phosphate, followed by the addition of 0.2 mL of 0.1 M 2-oxoglutarate, and 0.2 mL of the enzyme preparation was then added. After incubation for 10 min at 37 °C, this reaction was terminated by adding 0.1 mL of 0.2 M trichloroacetic acid, with pyruvate being converted into pyruvate hydrazine as a chromogenic readout. The hydrazone color intensity in saturated water toluene was assessed at 520 nm. GOT activity was calculated based upon pyruvate standard samples that had been analyzed in parallel. GPT activity was assessed via an identical approach in which an equal volume of 0.8 M alanine in 0.1M Tris-HCl (pH 7.5) was substituted in place of the 0.1 M buffered aspartate solution within the reaction mixture, and with the omission of aniline citrate [32].

2.3.4. Protease and Peptidase Activity Analyses

Initially, 0.8 g of each sample was homogenized at 4 °C in 1 mL of a β-mercaptoethanol extraction buffer containing ethylene glycol, sucrose and phenylmethylsulfonyl fluoride (pH = 6.8). Samples were then centrifuged, and cellular debris was discarded, while supernatants were kept on ice and used for immediate protease activity analyses as assessed using azocasein as a model substrate [33], with the resultant values being reported in absorbance (400 nm) mg protein g−1 fresh weight.
To evaluate peptidase activity levels, 0.5 g of each sample was homogenized in 8 mL of Tris-HCl extraction buffer (4 mmoL l-1 DTT, 4 mmoL l-1 EDTA, 1% PVP, pH = 7.5) at 4 °C, followed by centrifugation for 30 min at 15,000× g at 0 °C. Supernatant peptidase activity was then assessed by combining 0.4 mL of acetate buffer (pH 4.8) and 1% bovine hemoglobin compounded with 0.2 mL acetate buffer (pH 4.8) for 10 min at 37 °C, followed by the addition of 0.4 mL of the prepared enzyme-containing sample and a subsequent incubation for 1 h at 38 °C. Next, the reaction was terminated by adding 1 mL of 10% trichloroacetic acid. Control samples were prepared by adding this termination reagent prior to reaction initiation. Samples were then spun for 5 min at 4000× g, allowed to sit for 30 min 4 °C, spun again under identical conditions, and a ninhydrin assay was then used to assess the amino acid content in the prepared supernatant [30], with results being given in the form of absorbance μmol amino acid g−1 square fresh weight.

2.4. Statistics Analysis

Data were assessed using a Proc ANOVA in SPSS 25. Differences among treatments were tested via LSD at the 5% significance levels. Correlations were evaluated based upon Pearson correlation coefficients.

3. Results

3.1. Changes of Cry1Ac Endotoxin Contents in Cotton Squares after Critical High-Temperature Stress Termination

Figure 1A shows that the Bt protein content in cotton squares of the SK-1 and SK-3 varieties showed an upward trend with the removal of the continuous stress at the critical temperature of 38 °C during the squaring stage and the extension of the recovery time. The Cry1Ac endotoxin content in the SK-1 squares was only 35.14% of that of the control after 72 h of high-temperature stress was terminated, while it was 41.11%, 51.91%, 74.77%, 100.42% and 100.75% of the control at 12, 24, 48, 72 and 96 h after the termination of the stress, respectively. This indicates that 72 h after the termination of stress, the Cry1Ac endotoxin content of cotton squares did not show a significant difference from that of the control. The expression of Bt protein in SK-3 cotton squares was 41.90%, 59.16%, 78.44%, 99.50%, 100.13% and 98.43% of the corresponding control at 0, 12, 24, 48, 72 and 96 h after the termination of 72 h of continuous stress, respectively. This reveals that the expression of Bt protein recovered to the control level 48 h after the stress termination, and the recovery rate showed a relatively higher value within 24 h after the stress was terminated.
As seen from Figure 1B, the Cry1Ac endotoxin content in the SK-1 squares was only 28.46% of that of the control after 96 h of high-temperature stress was terminated, but it was 33.15%, 41.67%, 60.75%, 84.80% and 101.90% of the control at 12, 24, 48, 72 and 96 h after the termination of the stress, respectively. This indicates that 96 h after the termination of stress, the Cry1Ac endotoxin content of cotton squares showed no significant difference from that of the control. The expression of Cry1Ac endotoxin in SK-3 cotton squares was 30.18%, 39.64%, 58.84%, 85.93%, 100.78% and 100.61% of the corresponding control at 0, 12, 24, 48, 72 and 96 h after the termination of 96 h of continuous stress, respectively. This reveals that the Cry1Ac endotoxin content level of cotton squares showed no significant difference from those of the control 72 h after the termination of stress.
It can Be seen that the expression of the Cry1Ac endotoxin content in these two varieties of cotton squares could recover to the corresponding control level after the termination of the high-temperature stress, but the recovery time was correspondingly prolonged with the increase in the high-temperature stress duration. The conventional SK-1 cultivar had a longer recovery time compared with the SK-3 cultivar.

3.2. Physiological Characteristics of Nitrogen Metabolism in Bt Cotton Squares after Critical High-Temperature Stress Termination

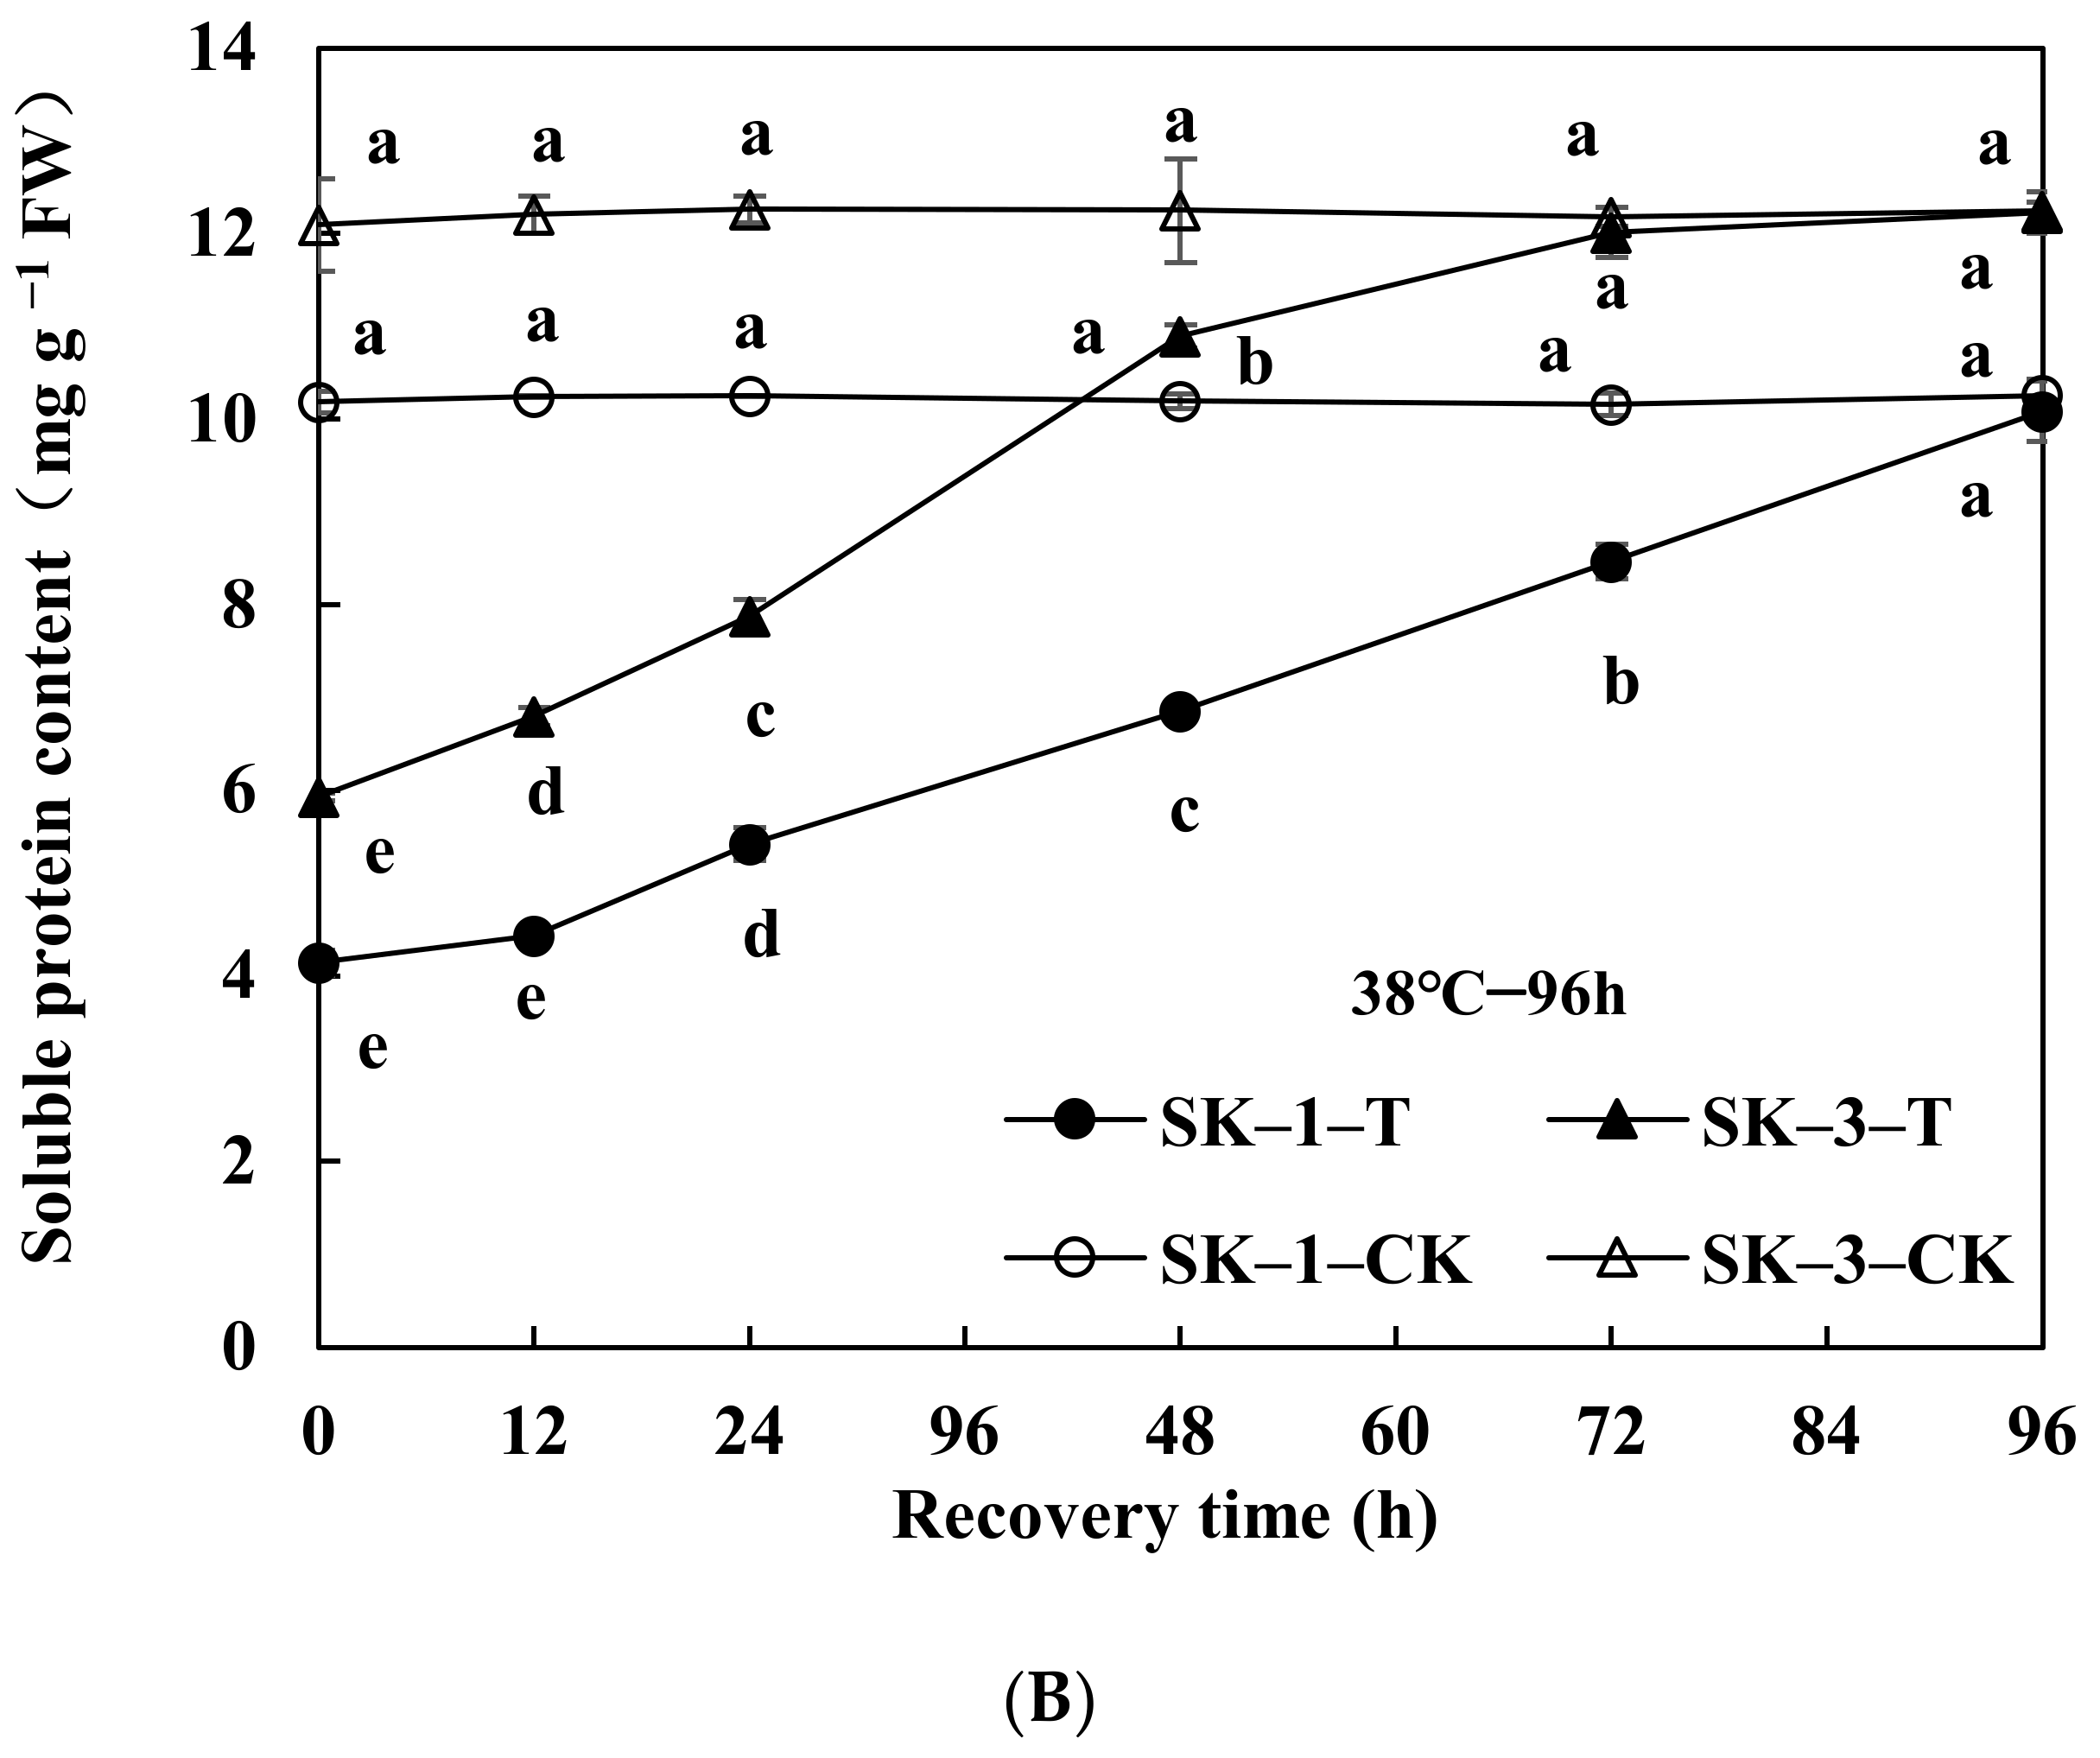
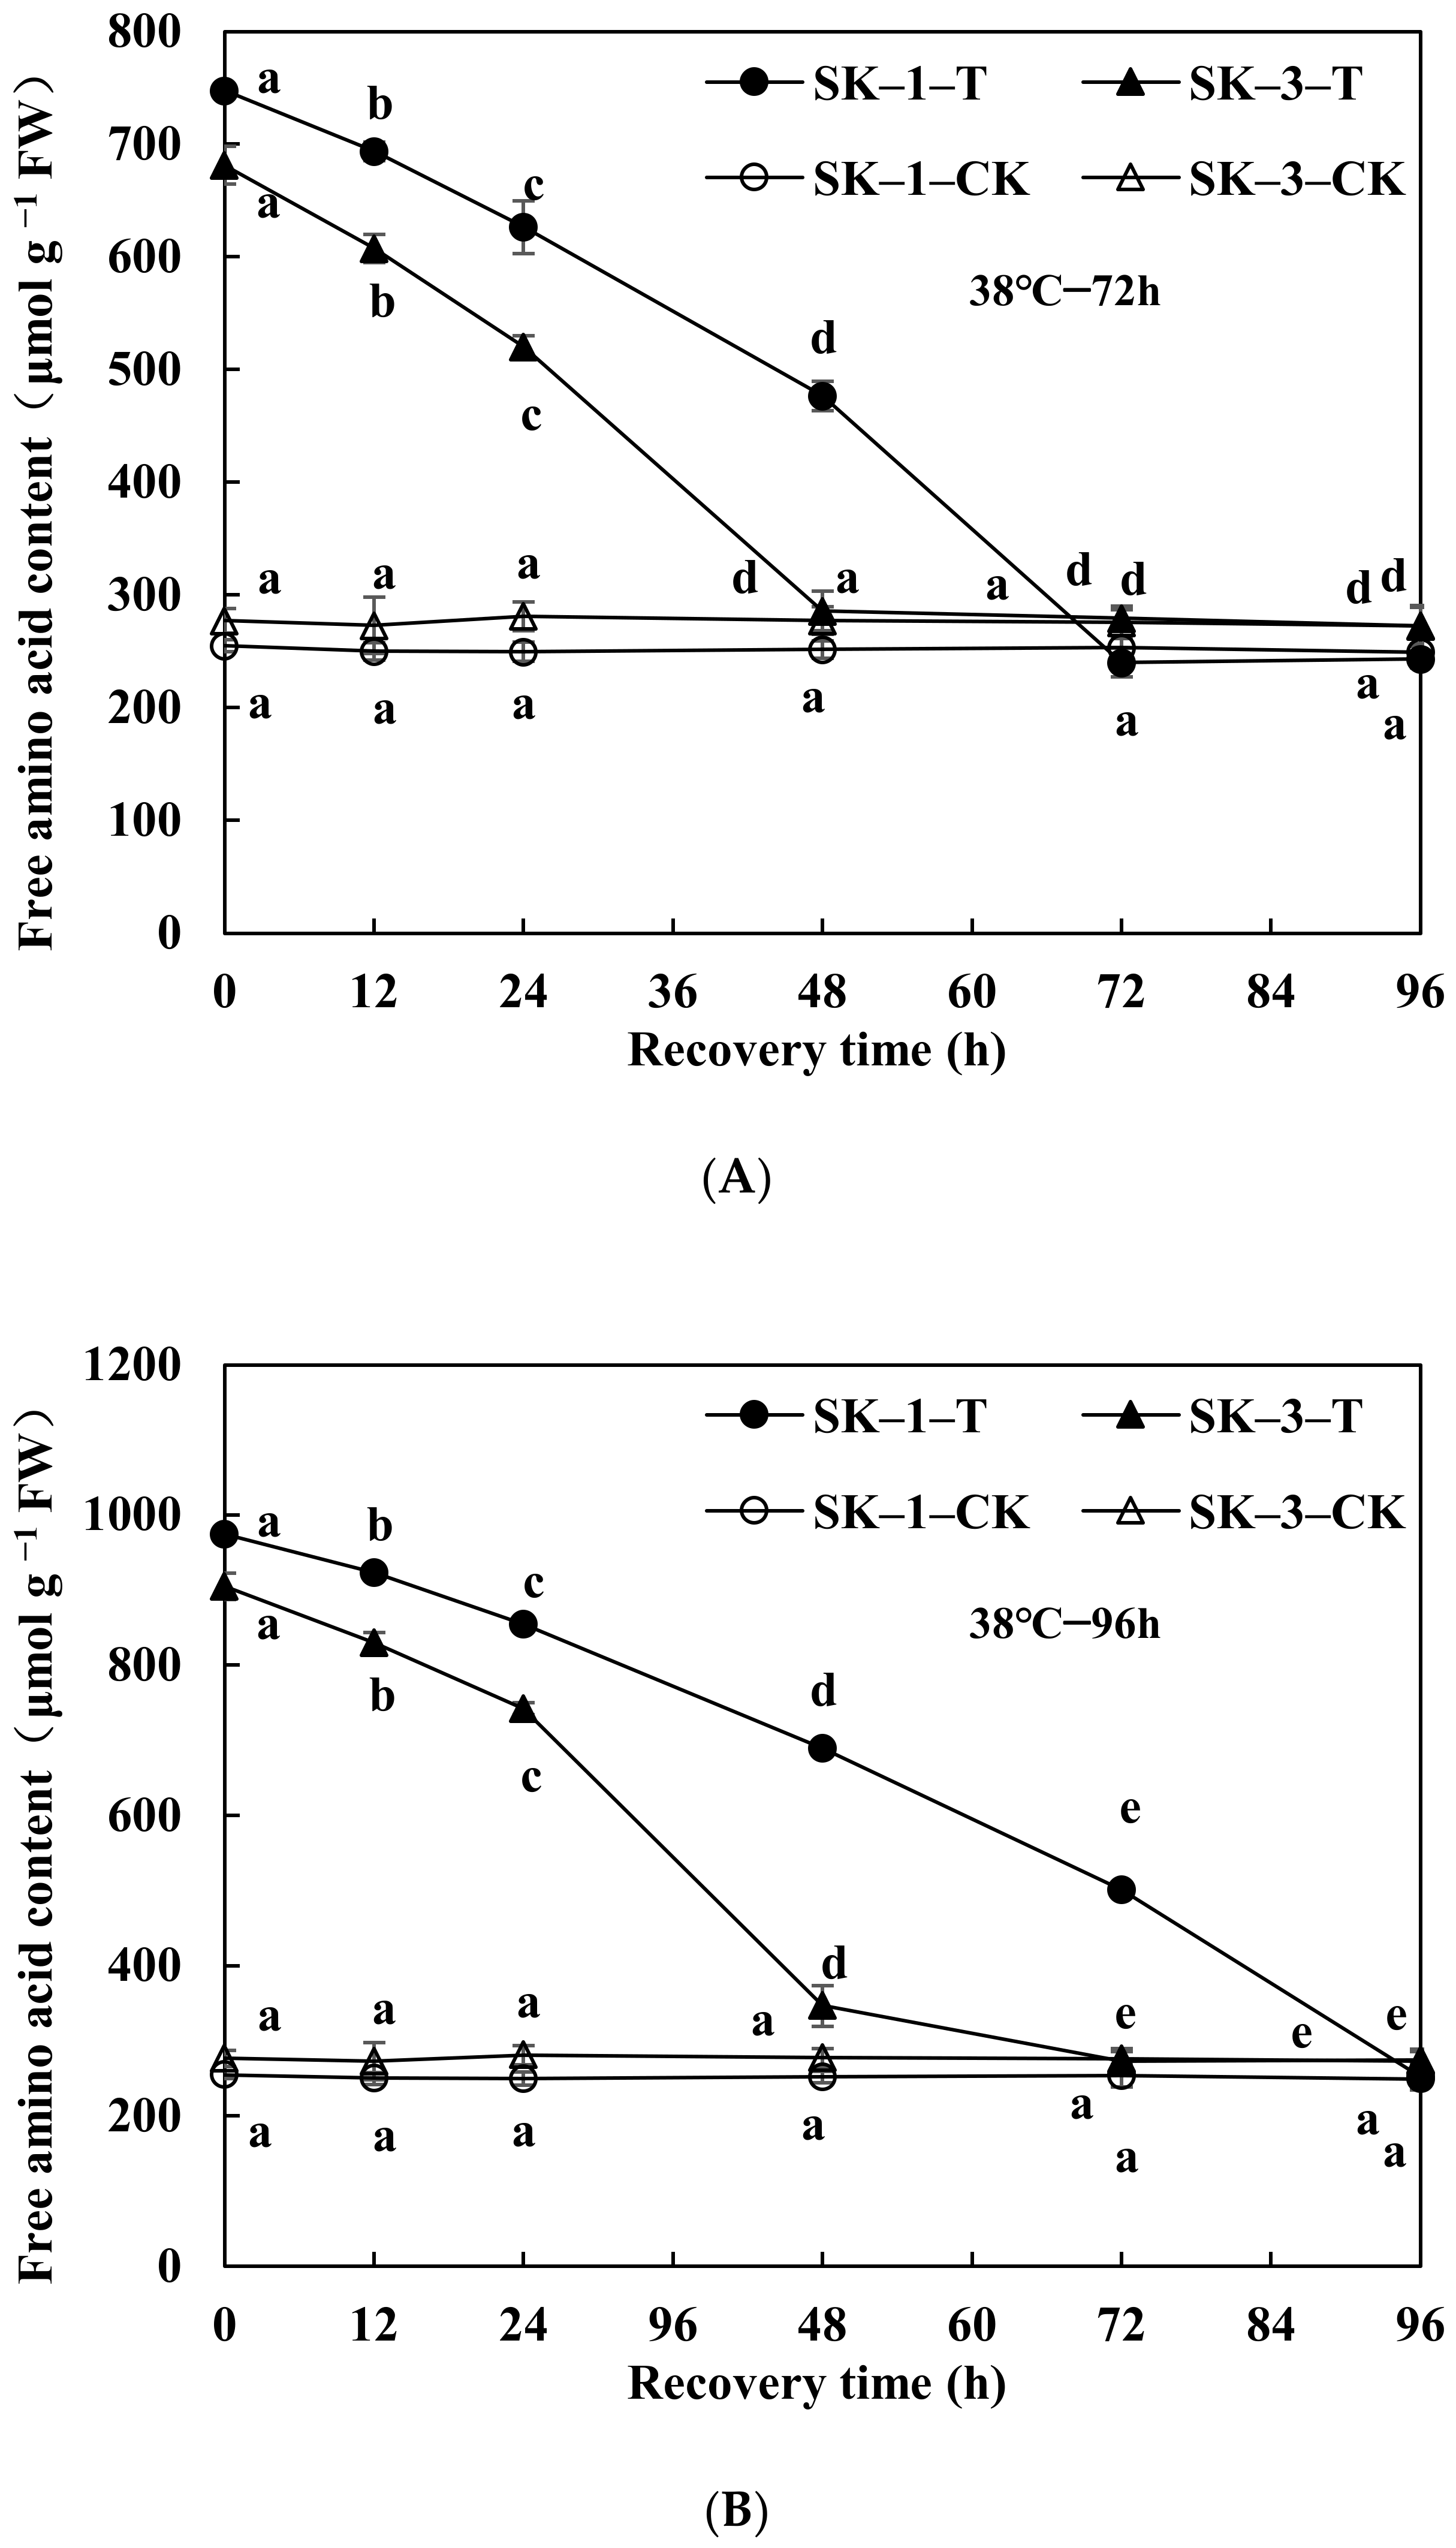
3.2.1. Changes in Soluble Protein and Free Amino Acid Contents

Figure 2 shows that soluble protein levels in cotton squares increased with increasing recovery time after the termination of the 72 h and 96 h of critical high-temperature stress at 38 °C in the full squaring stage. The soluble protein expression in the SK-1 squares was 46.78%, 50.00%, 62.92%, 83.92%, 101.97% and 101.93% of the corresponding control at 0, 12, 24, 48, 72 and 96 h after the termination of 72 h of continuous stress, respectively, indicating that there were no significant differences in soluble protein content between SK-1 and the control 72 h after stress termination. The soluble protein expression in the SK-3 squares was 51.74%, 60.82%, 74.73%, 98.33%, 100.41% and 100.28% of the corresponding control at 0, 12, 24, 48, 72 and 96 h after 72 h continuous stress, respectively, indicating that the SK-3 did not show any differences in soluble protein content from the control 48h after stress termination. The soluble protein expression in the SK-1 squares was 40.71%, 43.31%, 52.93%, 67.24%, 83.32% and 98.31% of the corresponding control at 0, 12, 24, 48, 72 and 96 h after 96 h of continuous stress, respectively, indicating that there were no significant differences in soluble protein contents between the SK-1 and the control 96 h after stress termination. The soluble protein expression in the SK-3 squares was 49.05%, 55.71%, 69.12%, 88.92%, 98.62% and 99.91% of the corresponding control at 0, 12, 24, 48, 72 and 96 h after 96 h of continuous stress, respectively, indicating that the soluble protein content of squares recovered to the corresponding control level at the time between 48 and 72 h after 96 h of continuous stress.
Figure 3 shows that free amino acid content in cotton squares under high-temperature stress at 38 °C significantly decreased at 96 h after the termination of 72 h of continuous stress. The free amino acid content in the SK-1 cotton squares was 292.99%, 277.32%, 250.78%, 189.21%, 94.71% and 97.47% of the control at 0, 12, 24, 48, 72 and 96 h after the termination of 72 h of continuous stress, respectively, while that of the SK-3 was 245.99%, 222.37%, 184.95%, 103.12%, 101.36% and 99.91% of the control, respectively. This indicates that the free amino acid content in SK-1 and SK-3 recovered within 72 and 48 h after the termination of 72 h of continuous stress, respectively. The free amino acid content in the SK-1 cotton squares was 381.76%, 369.03%, 341.87%, 273.61%, 197.54% and 101.12% of the control at 0, 12, 24, 48, 72 and 96 h after the termination of 96 h of stress, respectively, while that in the SK-3 cotton squares was 326.73%, 303.79%, 263.91%, 124.97%, 99.07% and 100.59% of the control, respectively. The results show that the free amino acid content in cotton squares generally decreased to the corresponding control level after the termination of 96 h of stress in the conventional varieties and 72 h of stress in the hybrid varieties.
Thus, it is presented that the soluble protein expression and free amino acid content in the squares of both the conventional cultivar SK-1 and the hybrid cultivar SK-3 could recover to the corresponding control level after the stress termination, and the recovery time increased with the increase in stress duration. Particularly, the hybrid cultivar SK-3 showed a longer recovery time than the conventional cultivar SK-1. Correlation analyses revealed significant positive correlations between soluble protein expression and Cry1Ac endotoxin expression (R = 0.964 **), while there was a significantly negative correlation between free amino acid content and Cry1Ac endotoxin expression (R = −0.894 **). The results show that the increased protein synthesis capacity of cotton squares facilitated the recovery of Bt protein expression.

3.2.2. Changes of GOT and GPT Activities

Figure 4 shows that GOT and GPT activities in cotton squares significantly increased after the termination of the critical high-temperature stress at 38 °C in the full squaring stage. The activity of GOT in the SK-1 squares was only 29.79% of that of the control after the termination of 72 h of continuous stress, but it was 36.17%, 47.63%, 66.35%, 102.99% and 100.95% of that of the control at 12, 24, 48, 72 and 96 h after stress termination, respectively. This reveals that GOT activity did not differ between SK-1 and the control 48h after the termination of stress. The activity of GOT in the SK-3 squares was only 41.38% of that of the control after the termination of 72 h of continuous stress, but it was 55.82%, 76.64%, 103.96%, 101.84% and 103.51% of that of the control at 12, 24, 48, 72 and 96 h after stress termination, respectively. This indicates that there were no significant differences in the GOT activity between SK-3 and the control 48 h after the termination of stress. The activity of GOT in the SK-1 squares was only 17.29% of that of the control after the termination of 96h continuous stress, but it was 22.19%, 31.43%, 50.32%, 75.77% and 108.77% of that of the control at 12, 24, 48, 72 and 96 h after the termination of stress, respectively. This shows that there were no significant differences in the GOT activity between SK-1 and the control 96 h after the termination of stress. The activity of GOT in the SK-3 squares was only 28.05% of that of the control after the termination of 96 h of continuous stress, but it was 37.82%, 50.23%, 88.78%, 103.80% and 104.14% of that of the control at 12, 24, 48, 72 and 96 h after the termination of stress, respectively. This demonstrates that there were no significant difference in the GOT activity between SK-3 and the control 72 h after the termination of stress.
Figure 5 shows that activity of GPT in SK-1 squares was only 33.36%, 40.61%, 49.78%, 68.52%, 100.68% and 102.20% of that of the control at 0, 12, 24, 48, 72 and 96 h after the termination of 72 h of critical high-temperature stress, respectively. This indicates that the activity of GPT in squares recovered to the corresponding control level within 72 h after the stress was terminated. The activity of GPT in the SK-3 squares was 37.82%, 53.42%, 65.95%, 102.92%, 98.31% and 99.48% of that of the control at 0, 12, 24, 48, 72 and 96 h, respectively, indicating that there were no significant differences in the GPT activity between SK-3 and the control 48 h after the termination of stress. The activity of GPT in the SK-1 squares was 23.27%, 28.70%, 35.38%, 52.33%, 73.93% and 99.40% of that of the control at 0, 12, 24, 48, 72 and 96h after the termination of 96 h of critical high-temperature stress. It was found that there were no significant differences in the GPT activity between SK-1 and the control 96 h after the termination of stress. The activity of GPT in the SK-3 squares was 28.18%, 35.25%, 46.52%, 85.78%, 97.75% and 100.84% of that of the control at 0, 12, 24, 48, 72 and 96 h, respectively, indicating that the activity of GPT in squares recovered to the corresponding control level within 72 h after the stress was terminated.
Thus, this clearly shows that the activity of GOT and GPT in the squares of both the conventional cultivar SK-1 and the hybrid cultivar SK-3 could recover to the corresponding control level after the stress termination, and the recovery time increased with the increase in stress duration. In terms of the activity, the conventional cultivar SK-1 had a shorter recovery time than the hybrid cultivar SK-3. Correlation analysis showed that there was a significant positive correlation between the activity of GOT/GPT and Cry1Ac endotoxin expression (R(GOT) = 0.971 **; R(GPT) = 0.981 **). Therefore, the recovery of GOT and GPT activity improved the protein synthesis, thus increasing the expression of Bt protein.

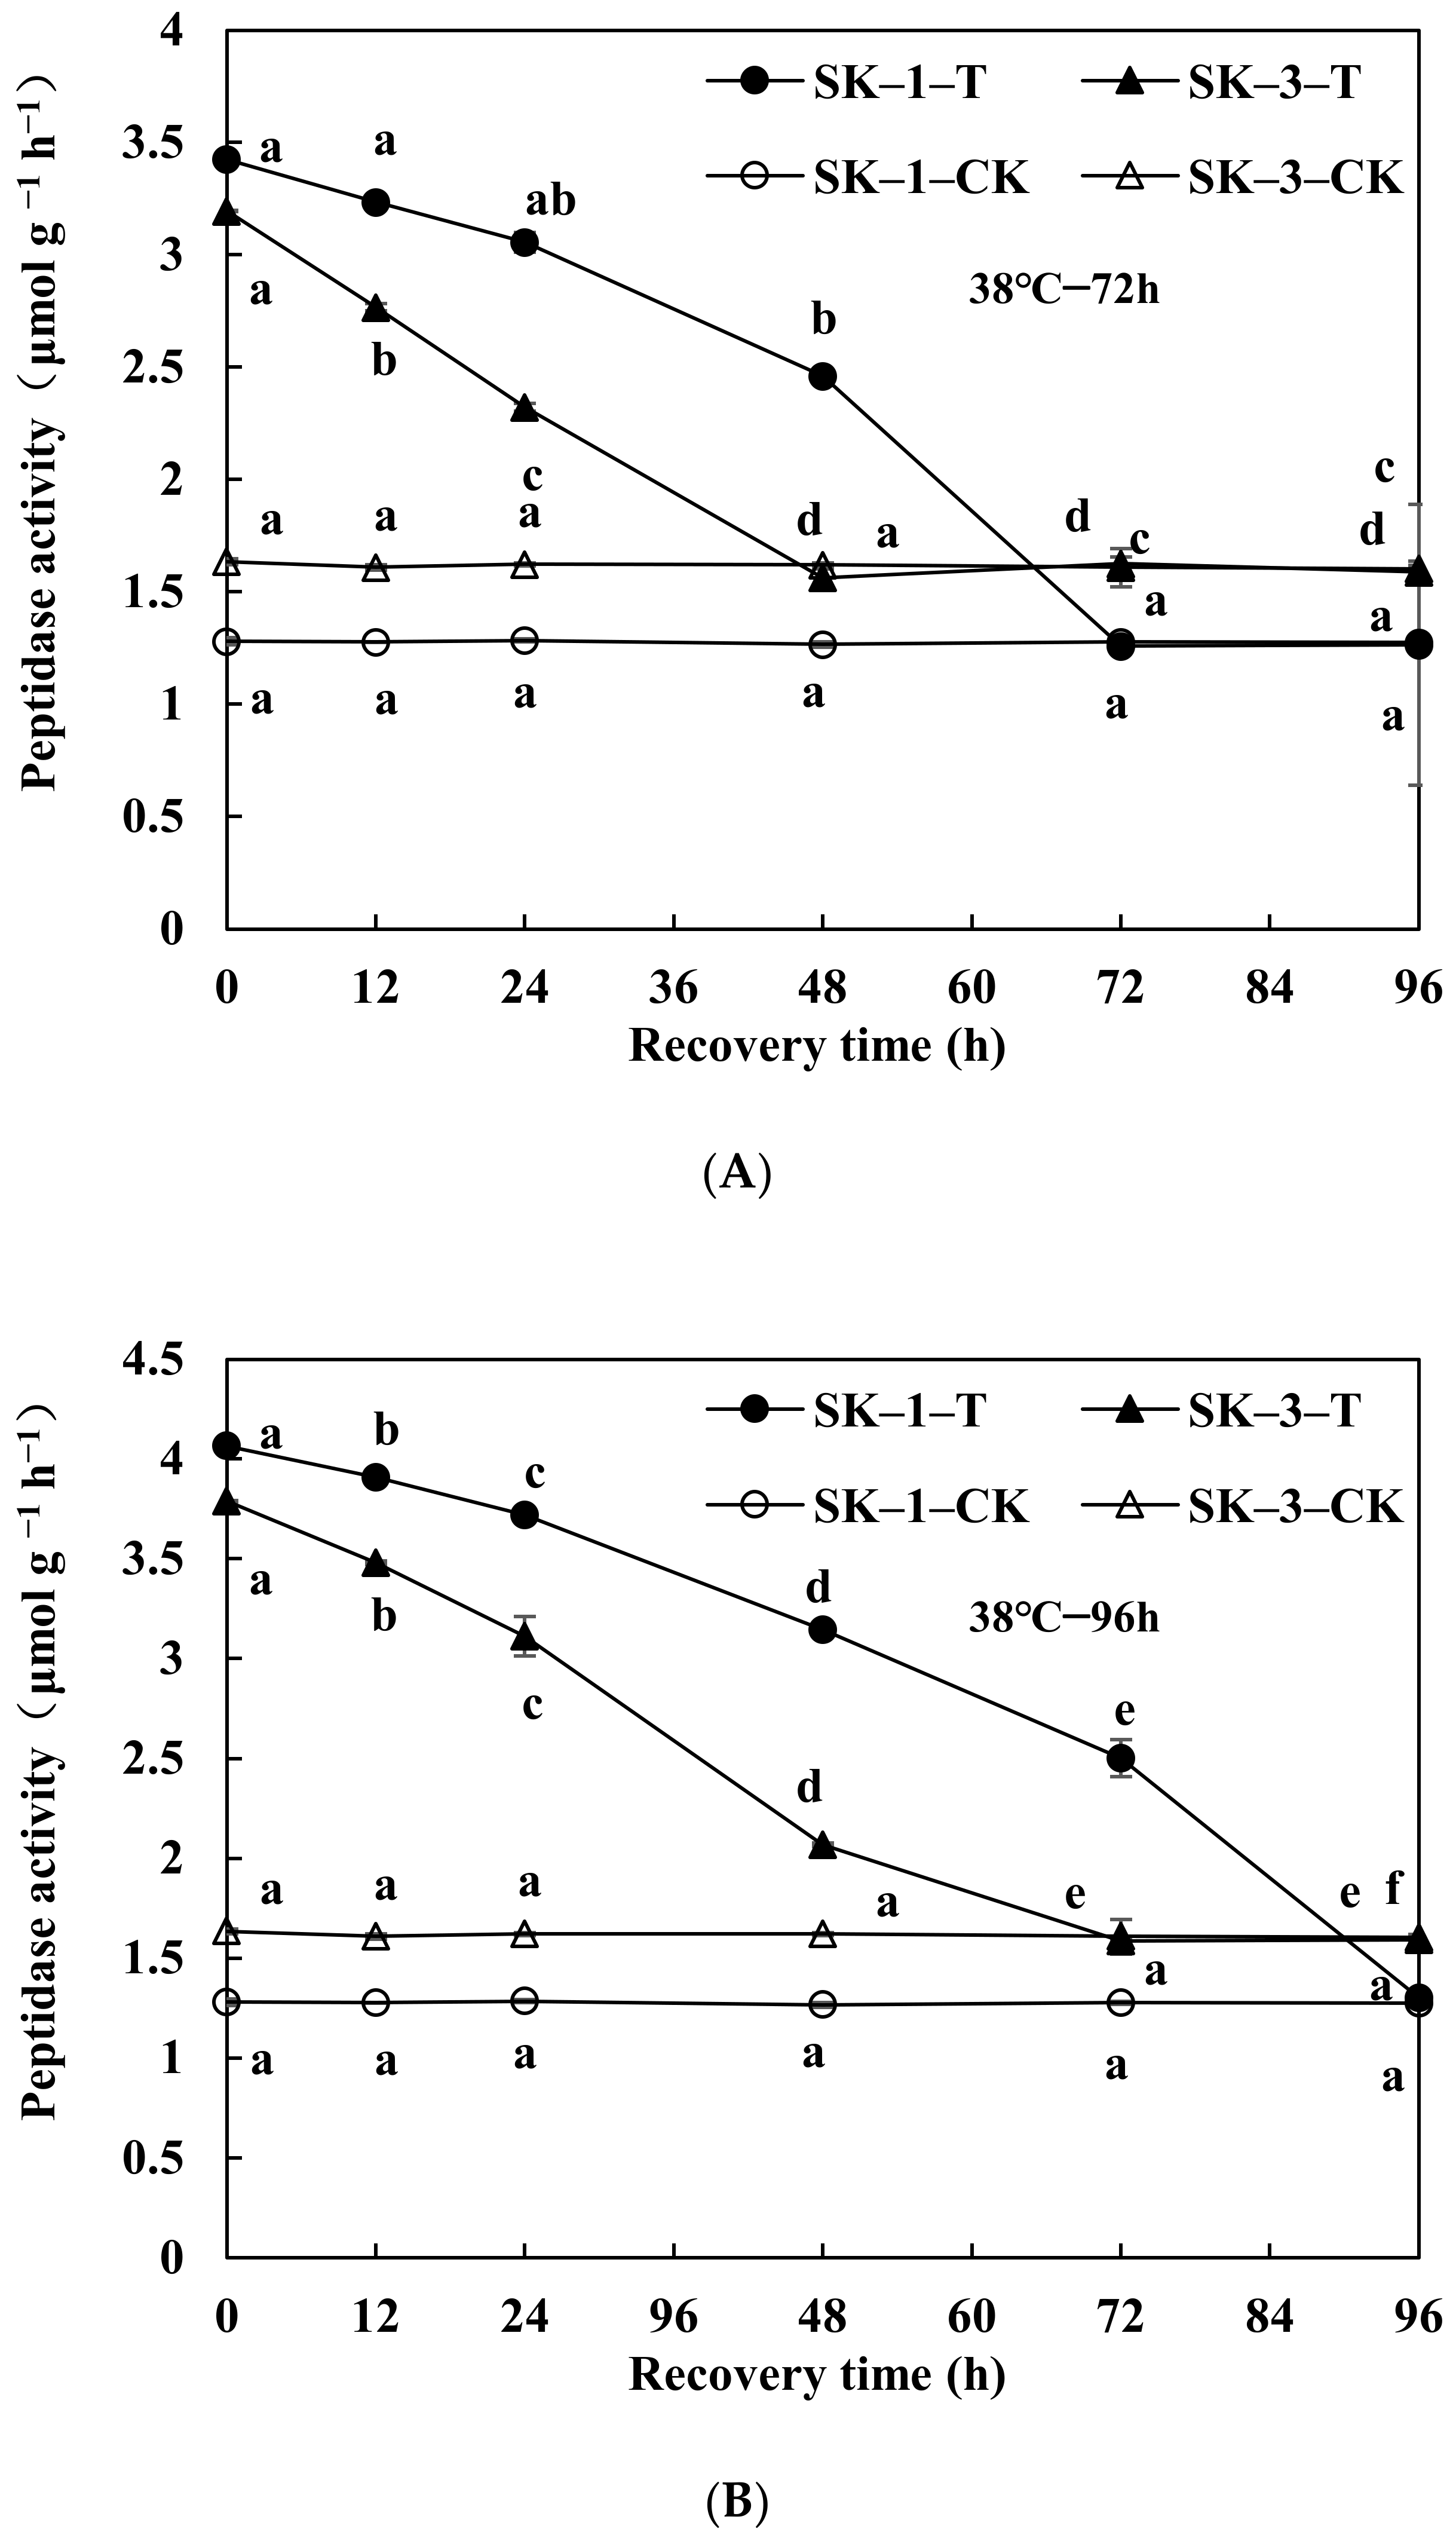
3.2.3. Changes of Protease Activity and Peptidase Activity

Figure 6 shows that the activity of protease and peptidase decreased in cotton squares after the termination of the critical high-temperature stress at 38 °C in the full squaring stage. The protease activity in the SK-1 squares was 363.39%, 335.90%, 286.84%, 216.26%, 101.02% and 100.86% of that of the control at 0, 12, 24, 48, 72 and 96 h after the termination of 72 h of critical high-temperature stress, respectively. This indicates that protease activity did not significantly vary between SK-1 and the control 72 h after the termination of stress. The activity of protease in the SK-3 squares was 288.37%, 244.00%, 204.38%, 96.10%, 103.58% and 99.38% of that of the control at 0, 12, 24, 48, 72 and 96 h after the termination of 72 h of critical high-temperature stress, respectively. This indicates that the activity of protease in the squares recovered to the corresponding control level within 48 h after the stress was terminated. The protease activity in the SK-1 squares was 444.75%, 426.53%, 376.91%, 314.33%, 216.72% and 102.21% of that of the control at 0, 12, 24, 48, 72 and 96 h after the termination of 96 h of critical high-temperature stress, respectively. This indicates that there were no significant difference in protease activity between the SK-1 and the control 96 h after the termination of stress. The activity of protease in the SK-3 squares was 356.22%, 300.05%, 258.14%, 152.68%, 108.24% and 103.24% of that of the control at 0, 12, 24, 48, 72 and 96 h after the termination of 96 h of critical high-temperature stress, respectively. This indicates that the activity of protease in squares recovered to the corresponding control level within 72 h after the stress was terminated.
Figure 7 shows that activity of peptidase in SK-1 squares was 267.54%, 253.44%, 237.81%, 194.14%, 98.57% and 99.31% of that of the control at 0, 12, 24, 48, 72 and 96 h after the termination of 72 h of critical high-temperature stress, respectively. This indicates that the activity of peptidase in squares recovered to the corresponding control level within 72 h after the stress was terminated. The activity of peptidase in the SK-3 squares was 195.40%, 171.87%, 143.19%, 96.43%, 100.99% and 99.02% of that of the control at 0, 12, 24, 48, 72 and 96 h, respectively, indicating that the activity of peptidase in squares recovered to the corresponding control level within 48 h after the stress was terminated. The activity of peptidase in the SK-1 squares was 317.50%, 306.14%, 289.30%, 248.16%, 195.87% and 102.17% of that of the control at 0, 12, 24, 48, 72 and 96 h after the termination of 96 h of critical high-temperature stress. This indicates that the activity of peptidase in squares recovered to the corresponding control level within 96 h after the stress was terminated. The activity of peptidase in the SK-3 squares was 231.68%, 216.19%, 191.91%, 127.58%, 98.61% and 99.33% of that of the control at 0, 12, 24, 48, 72 and 96 h, indicating that the activity of peptidase in squares recovered to the corresponding control level within 72 h after the stress was terminated. This indicates that the protease activity did not vary between SK-3 and the control 72 h after the termination of stress.
It also shows that the activity of protease and peptidase in the squares of the conventional cultivar SK-1 and the hybrid cultivar SK-3 could decrease to the corresponding control level after the termination of critical high-temperature stress, and the time required to decrease the activity to the corresponding control level was related to the duration of high-temperature stress. The length of time needed for these two enzymes to decrease to the control level increased with increasing stress time. Correlation analysis indicated that there was a significant negative correlation between the activity of square protease and peptidase and Cry1Ac endotoxin expression. The rapid decrease in protein decomposition after stress termination promoted the increase in Bt protein expression.

4. Discussion

4.1. High-Temperature Stress Duration Affecting the Recovery of Bt Protein Expression in Cotton Squares after Stress Termination

As for the recovery characteristics of insecticidal protein in Bt cotton after high-temperature stress termination, Chen et al. showed that the levels of Bt proteins in the leaves at the peak of the boll stage recovered to the control level within 24 h after 24 h of continuous stress at 37 °C [24]. Under 48 h of continuous stress, a longer recovery time was required. The expression of Bt protein in the leaves of SK-1 recovered 72 h after the termination of stress, and that of SK-3 recovered to the control level 48 h after the termination of stress. This further revealed that the time required for Bt protein expression in cotton squares to recover to the control level at the peak of the squaring stage was different after 72 h and 96 h of high-temperature stress at 38 °C. Under high-temperature stress with a longer duration, a longer time was required for Bt protein expression to recover to the control level after the stress termination. Therefore, the duration of high-temperature stress affected the recovery speed of Bt cotton insect resistance. Since only 72 and 96 h of high-temperature stress were tested in this study, the recovery degree of Bt protein expression in cotton squares at a longer duration of the stress and whether they could recover to their original level still needs to be studied further. Cotton grew under the condition of diurnal temperature variation, with high temperatures occurring during the day and then the high-temperature stress was relieved at night. Thus, the effect of high-temperature stress on the recovery characteristics of Bt protein expression in cotton squares may be different under diurnal temperature variation. Therefore, further studies on the changes in insecticidal protein expression in the reproductive organs of Bt cotton under diurnal temperature variation stress are significant to clarify the insect resistance characteristics of Bt cotton and to prevent cotton bollworm. In addition, other studies have found that hybrid varieties have stronger growth potential, strong stress resistance and recovery ability of their reproductive organs, which is due to the heterosis of the variety itself [34,35]. The recovery rate of the conventional cultivar SK-1 was smaller than that of hybrid cultivar SK-3, which may be related to heterosis.

4.2. The Recovery of Cry1Ac Endotoxin Expression in Cotton Squares Related to Nitrogen Metabolism

Many studies have revealed that the insecticidal Bt protein levels in Bt cotton leaves and reproductive organs, as well as the recovery of insecticidal protein expression in leaves after high-temperature stress, are closely linked to nitrogen metabolism [36,37,38]. This study showed that after the high-temperature stress termination, the soluble protein content in cotton squares and the activities of GPT and GOT gradually increased along with the increase in the termination time. On the contrary, the free amino acid content in cotton squares and the activities of protease and peptidase gradually decreased. This indicates that GPT activity did not show any differences between SK-1 and the control 96 h after the termination of stress. Regarding the soluble protein expression, GOT and GPT activities showed a significant positive correlation with Bt protein expression, while showing a negative correlation with amino acid contents, protease and peptidase activities.

5. Conclusions

This paper reveals that the recovery degree of Bt protein in cotton squares was associated with the duration of high-temperature stress. A longer time was required to recover to the original level for Bt protein in the cotton squares under a longer duration of high-temperature stress. Compared with conventional Bt cultivars SK-1, the hybrid cultivar SK-3 showed better resilience. In addition, the high-temperature stress caused a decrease in the protein synthesis capacity, while the decomposition capacity was greatly increased. After the high-temperature stress was terminated, the protein synthesis capacity rapidly increased and the decomposition capacity decreased, which resulted in the recovery of Bt protein contents to the normal level in the cotton squares.

Author Contributions

Conceptualization, D.C. and X.Z.; methodology, Z.L. and G.W.; software, G.W.; validation, Z.L., Z.Z. and C.Z.; investigation, H.L. and T.W.; writing—original draft preparation, Z.L.; writing—review and editing, D.C.; funding acquisition, D.C. All authors have read and agreed to the published version of the manuscript.

Funding

This study was supported by the National Nature Science Foundation of China (31901462, 31671613), Natural Science Foundation of Jiangsu Province (BK20191439), National Industrial System Cotton Post Expert Project (CARS-18-18) and Priority Academic Program Development of Jiangsu Higher Education Institutions (PAPD).

Data Availability Statement

The data used to support the findings of this study are available from the corresponding author upon request.

Conflicts of Interest

The authors declare no conflict of interest.

References

  1. Huang, J.K.; Mi, J.W.; Lin, H.; Wang, Z.J.; Chen, R.J.; Hu, R.F.; Scott, R.; Carl, P. Adecade of Bt cotton in Chinese field: Assessing direct effect and indirect externalities of Bt cotton adoption in China. Sci. China Life Sci. 2010, 53, 981–991. [Google Scholar] [CrossRef] [PubMed]
  2. Clive, J. The development state for commercial Biotechnology and transgenic crops. China Biotechnol. 2012, 32, 1–14. [Google Scholar]
  3. Jenkins, J.N.; McCarty, J.C.J.; Wofford, T. Bt cotton—A new era in cotton production. Am. Proc. Beltwide Cotton Conf. 1995, 1, 171–173. [Google Scholar]
  4. Pray, C.E.; Huang, J.K.; Hu, R.F.; Rozelle, S. Five years of Bt cotton in China the benefits continue. Plant J. 2002, 31, 423–430. [Google Scholar] [CrossRef] [PubMed]
  5. Gould, F. Evolutionary biology and genetically engineered crops. Bioscience 1988, 38, 26–33. [Google Scholar] [CrossRef]
  6. Gasser, C.S.; Fraley, R.T. Genetically engineering plants for crop improvement. Science 1989, 244, 1293–1299. [Google Scholar] [CrossRef] [PubMed] [Green Version]
  7. Zhao, J.Z.; Zhou, C.H.; Lu, M.G.; Fan, X.L.; Rong, L.J.; Meng, X.Q. Monitoring and management of Helicoverpa armigera resistance to transgenic Bt cotton in Northern China. Res. Pest Manag. 2000, 1, 28–31. [Google Scholar]
  8. Adamczyk, J.J.; Meredith, W.R. Genetic basis for the variability of Cry1Ac expression among commercial transgenic Bacillus thuringiensis (Bt) cotton cultivars in the United States. J. Cotton Sci. 2004, 8, 17–23. [Google Scholar]
  9. Shen, P.; Lin, K.J.; Zhang, Y.J.; Wu, K.M.; Guo, Y.Y. Seasonal expression of Bacillius thuingiensis insecticidal protein and control to cotton bollworm in different varieties of transgenic cotton. Cotton Sci. 2010, 22, 393–397. [Google Scholar] [CrossRef]
  10. Glenn, D.S. Field versus farm in Warangal: Bt cotton, higher yields, and larger questions. World Dev. 2011, 39, 387–398. [Google Scholar] [CrossRef]
  11. Cui, J.J.; Xia, J.Y. Studies on the resistance dynamics of the Bt transgenic cotton on cotton bollworm. Acta Gossipi Sin. 1999, 11, 141–146. [Google Scholar]
  12. Finnegan, E.J.; Mcelory, D. Transgenic inactivation: Plant fight back! Biotechnology 1994, 12, 883–888. [Google Scholar]
  13. Benedict, J.H.; Sachs, E.S.; Altman, D.W.; Deaton, W.R.; Kohel, R.J.; Ring, D.R.; Berberich, S.A. Field performance of cottons expressing transgenic Cry1Ac insecticidal proteins for resistance to Heliothis virescens and Helicoverpa zea (Lepidoptera: Noctuidae). J. Econ. Entomol. 1996, 89, 230–238. [Google Scholar] [CrossRef]
  14. Stam, M.; Mol, J.M.; Kooter, J.M. The silence of gene in transgenic plant. Anal. Bot. 1997, 79, 3–12. [Google Scholar] [CrossRef] [Green Version]
  15. Benedic, J.H.; Sachs, E.S.; Altman, D.W.; Ring, D.R.; Stone, T.B.; Sims, S.R. Impact of endotoxin-producing transgenic cotton on insect-plant interactions with Heliothis virescens and Helicoverpa zea (Lepidoptera: Noctuidae). Environ. Entomol. 1993, 22, 1–9. [Google Scholar] [CrossRef]
  16. Wang, Y.H.; Ye, G.Y.; Luan, N.; Xiao, J.; Chen, Y.; Chen, D.H. Boll size affects the insecticidal protein content in Bacillius Thuringiensis (Bt) cotton. Field Crops Res. 2009, 110, 106–110. [Google Scholar] [CrossRef]
  17. Chen, Y.; Wen, Y.; Chen, Y.; Cothren, J.T.; Zhang, X.; Wang, Y.; Payne, W.A.; Chen., D.H. Effects of extreme air temperature and humidity on the insecticidal expression level of Bt cotton. J. Integr. Agric. 2012, 11, 101–108. [Google Scholar] [CrossRef]
  18. Chen, Y.; Chen, Y.; Wen, Y.J.; Zhang, X.; Chen, D.H. The effects of the relative humidity on the insecticidal expression level of Bt cotton during bolling period under high temperature. Field Crops Res. 2012, 137, 141–147. [Google Scholar] [CrossRef]
  19. Chen, D.H.; Ye, G.Y.; Yang, C.Q.; Chen, Y.; Wu, Y.K. The effect of high temperature on the insecticidal properties of Bt Cotton. Environ. Exp. Bot. 2005, 53, 333–342. [Google Scholar] [CrossRef]
  20. Wang, J.; Eltayib, A.; Hua, M.M.; Heng, L.; Lv, C.H.; Chen, D.H. Effects of high temperature on Bt protein content and nitrogen metabolic physiology in boll wall of Bt cotton. Chin. J. Appl. Ecol. 2015, 26, 3202–3206. [Google Scholar]
  21. Wang, S.M. Factors affecting the insect resistance of Bt transgenic cotton. Cotton Sci. 1999, 11, 336. [Google Scholar]
  22. Warren, G.W.; Carozzi, N.B.; Desai, N.; Koziel, M.G. Field evaluation of transgenic tobacco containing a Bt insecticial protein gene. J. Econ. Entomol. 1992, 85, 1651–1659. [Google Scholar] [CrossRef]
  23. Fitt, G.P.; Mares, C.L.; Liewellyn, D.J. Field evaluation and potential ecological impact of transgenic cottons in Australia. Biocontrol Sci. Technol. 1994, 4, 535–548. [Google Scholar] [CrossRef]
  24. Chen, Y.; Wen, Y.J.; Chen, Y.; Zhang, X.; Wang, Y.H.; Chen, D.H. The recovery of Bt toxin content after temperature stress termination in transgenic cotton. Span. J. Agric. Res. 2013, 11, 438–446. [Google Scholar] [CrossRef] [Green Version]
  25. Zhou, M.Y.; Liu, Z.Y.; Li, L.N.; Chen, Y.; Zhang, X.; Chen, Y.; Chen, D.H. Effect of Urea Spray on Boll Shell Insecticidal Protein Content in Bt Cotton. Front. Plant Sci. 2021, 12, 623504. [Google Scholar] [CrossRef] [PubMed]
  26. Liu, Z.Y.; Eltayib, H.M.A.A.; Wu, H.M.; Zhou, M.Y.; Zhang, X.; Chen, Y.; Chen, D.H. Bt insecticidal efficacy variation and agronomic regulation in Bt cotton. J. Cotton Res. 2019, 2, 219–224. [Google Scholar] [CrossRef] [Green Version]
  27. Zhou, M.Y. Insecticidal Protein Regulation and Physiological Mechanism of Reproductive Organ in Bt Cotton; Yangzhou University: Yangzhou, China, 2021. [Google Scholar]
  28. Chen, S.; Wu, J.Y.; He, X.L.; Huang, J.Q.; Zhou, B.L.; Zhang, R.X. Quantification using ELISA of Bacillus thuringiensis insecticidal protein expressed in the tissue of transgenic insect-resistant cotton. J. Jiangsu Agri. Sci. 1997, 3, 154–156. [Google Scholar]
  29. Weiler, E.W.; Jourdan, P.S.; Conrad, W. Levels of indole-3-acetic acid and intact decapitated coleoptiples as determined by a specific and highly sensitive solid-phase enzyme immuno-assay. Planta 1981, 153, 561–571. [Google Scholar] [CrossRef]
  30. Yemm, E.W.; Cocking, E.C. The determination of amino acid with ninhydrin. Analyst 1955, 80, 209–213. [Google Scholar] [CrossRef]
  31. Bradford, M.M. A rapid and sensitive method for the quantification of microgram quantities of protein utilizing the principle of protein-dye binding. Ann. Biochem. 1976, 72, 248–254. [Google Scholar] [CrossRef]
  32. Tonhazy, N.E.; White, N.G.; Umbriet, W.W. Colorimetric assay of glutamic-pyruvic transaminase. Arch. Biochem. Biophys. 1950, 28, 36–38. [Google Scholar]
  33. Vance, C.P.; Heichel, G.H.; Barnes, D.K.; Bryan, J.M.; Johnson, L.E. Nitrogen fixation, nodule development, and vegetative regrowth of alfalfa (Medicago sativa L.) following harvest. Plant Physiol. 1979, 64, 1–8. [Google Scholar] [CrossRef] [PubMed] [Green Version]
  34. Liu, J.; Huang, X.H. Advance and perspectives in crop heterosos. Sci. Sin. 2021, 51, 1396–1404. [Google Scholar]
  35. Tyagi, P.; Bowman, D.T.; Bourland, F.M.; Edmisten, E.K.; Campbell, B.T.; Fraser, D.E.; Wallace, T.; Kuraparthy, V. Components of hybrid vigor in upland cotton (Gossypium hirsutum L.) and their relationship with environment. Euphytica 2014, 195, 117–127. [Google Scholar] [CrossRef]
  36. Lu, X.Y.; Li, S.Y.; Zhu, J.B.; Chen, F.R.; Liu, F.Z.; Yu, C. Effects of alternating temperatures day and night on cotton bollworm mortality and insecticidal protein expression of two kinds of Bt cottons. Chin. Agric. Sci. Bull. 2015, 31, 103–108. [Google Scholar]
  37. Chen, Y.; Han, Y.; Wang, J.; Hua, M.M.; Gu, C.; Li, G.S.; Zhang, X.; Chen, D.H. Effects of high temperature on Bt proteins expression and nitrogen metabolic physiology in square of Bt cotton at the peak squaring stage. Chin. J. Appl. Ecol. 2014, 25, 2623–2628. [Google Scholar]
  38. Chen, D.H.; Yang, C.Q.; Chen, Y.; Nie, A.Q.; Wu, Y.K. The effects of the high temperature stress on the leaf Bt protein content and nitrogen metabolism of Bt cotton. Cotton Sci. 2003, 5, 288–292. [Google Scholar] [CrossRef]
Figure 1. Changes of insecticidal protein content in squares of Bt cotton after 72 h (A) and 96 h (B) high-temperature stress termination. Bt toxin content at the recovery time with different lowercase letters is significantly different from the control at p < 0.05 under the same high-temperature stress duration for the same cultivar. T—treatments for 72 h (A) and 96 h (B); CK—control.
Agronomy 12 00668 g001
Figure 2. Changes in soluble protein content in squares of Bt cotton after 72 h (A) and 96 h (B) high-temperature stress termination. Soluble protein content at the recovery time with different lowercase letters is significantly different from the control at p < 0.05 under the same high-temperature stress duration for the same cultivar. T—treatments for 72 h (A) and 96 h (B); CK—control.
Agronomy 12 00668 g002aAgronomy 12 00668 g002b
Figure 3. Changes in free amino acid content in squares of Bt cotton after 72 h (A) and 96 h (B) high-temperature stress termination. Free amino acid content at the recovery time with different lowercase letters is significantly different from the control at p < 0.05 under the same high-temperature stress duration for the same cultivar. T—treatments for 72 h (A) and 96 h (B); CK—control.
Agronomy 12 00668 g003
Figure 4. Changes in GOT activities in squares of Bt cotton after 72 h (A) and 96 h (B) high-temperature stress termination. GOT activity at the recovery time with different lowercase letters is significantly different from the control at p < 0.05 under the same high-temperature stress duration for the same cultivar. T—treatments for 72 h (A) and 96 h (B); CK—control.
Agronomy 12 00668 g004aAgronomy 12 00668 g004b
Figure 5. Changes in GPT activities in squares of Bt cotton after 72 h (A) and 96 h (B) high-temperature stress termination. GPT activity at the recovery time with different lowercase letters is significantly different from the control at p < 0.05 under the same high-temperature stress duration for the same cultivar. T—treatments for 72 h (A) and 96 h (B); CK—control.
Agronomy 12 00668 g005
Figure 6. Changes in protease activities in squares of Bt cotton after 72 h (A) and 96 h (B) high-temperature stress termination. Protease activity at the recovery time with different lowercase letters is significantly different from the control at p < 0.05 under the same high-temperature stress duration for the same cultivar. T—treatments for 72 h (A) and 96 h (B); CK—control.
Agronomy 12 00668 g006aAgronomy 12 00668 g006b
Figure 7. Changes in peptidase activities in squares of Bt cotton after 72 h (A) and 96 h (B) high-temperature stress termination. Peptidase activity at the recovery time with different lowercase letters is significantly different from the control at p < 0.05 under the same high-temperature stress duration for the same cultivar. T—treatments for 72 h (A) and 96 h (B); CK—control.
Agronomy 12 00668 g007
Publisher’s Note: MDPI stays neutral with regard to jurisdictional claims in published maps and institutional affiliations.

