Article

The Effect of Nitrogen Fertilizer and Water Supply Levels on the Growth, Antioxidant Compounds, and Organic Acids of Baby Lettuce

by
Khayelihle Ncama
1,2,* and
Nkanyiso Justice Sithole
1,2
1
Department of Crop Science, Faculty of Natural and Agricultural Sciences, Mafikeng Campus, North-West University, Private Bag X575, Mmabatho 2790, North West Province, South Africa
2
Food Security and Safety Niche Area, Faculty of Natural and Agricultural Sciences, North-West University, Private Bag X2046, Mmabatho 2790, North West Province, South Africa
*
Author to whom correspondence should be addressed.
Agronomy 2022, 12(3), 614; https://doi.org/10.3390/agronomy12030614
Submission received: 10 November 2021 / Revised: 11 December 2021 / Accepted: 13 December 2021 / Published: 28 February 2022

Abstract

:
Applications of solutions with various organic acids have been widely demonstrated as effective disinfectants on lettuce. However, agronomic techniques of improving the concentration of internal organic acids in lettuce are not well investigated. Hereon, changes in growth, antioxidants, and organic acids of baby lettuce (Lactuca sativa L. var. longifolia) resulting from different levels of nitrogen fertilizer (0.10, 0.14, 0.18, or 0.22 g/5 kg soil) and water supply (300, 600, or 900 mL) were investigated. The pot experiment was conducted under a net house at North-West University (Mafikeng Campus), South Africa. Data on growth parameters (number of leaves and leaf area) and chlorophyll concentration were sampled weekly until leaf organic acids (citric, malic, and tartaric), total antioxidant compounds (TAO), as well as dry matter content, were measured at harvest. Reducing the amount of water supplied to baby lettuce significantly (p < 0.05) increased the chlorophyll concentration, leaf area, TAO, citric acid, and malic acid. The number of leaves and the leaf tartaric acid concentrations were increased by increasing the treatment levels. It was conclusive that decreasing water supply increases the organic acids regardless of the nitrogen level.

1. Introduction

Lettuce (Lactuca sativa L. var. longifolia) is widely consumed as a salad because it contains various nutritional benefits, including low calories, fats, and sodium, while it is a good source of fibre, iron, folate, and vitamin C [1]. It is characterised by a short period of growth which makes its production rapid and economically viable. Baby lettuce is harvested at a shorter period compared with fully grown lettuce, which is kept longer in the field. The parameters used for determining maturity levels for fresh market are the same. The economic yield quality of lettuce leaves is normally based on average leaf area and the number of leaves, while vitamin C content and total soluble solids are used for physiological quality [2]. The measurement of vitamin C content in vegetables is widely based on an equivalent to one major antioxidant compound, the ascorbic acid [3]. The total soluble solids (TSS) are based on the total amount of solids that are extractable from the plant tissue. The TSS measurement as a quality parameter is vague since it combines reflectance with all phyto-compounds, including organic sugars, oils, pigments, and organic acids.
Organic acids are significant contributors to the antioxidant and TSS concentrations of plants. Plants use them to defend themselves against pathogens and reactive compounds that deteriorate their freshness and storage quality. They possess both antimicrobial and physiological benefits. Organic acids are used as an active ingredient in anti-browning agents applied on lettuce post-harvest [4]. Application of solutions with various organic acids has been widely demonstrated as an effective disinfectant agent on lettuce [5,6]. The effectiveness of organic acids is associated with their activity when applied on the leaves externally. Dipping fresh cut lettuce in solutions containing organic acids is a known effective way to decrease counts of external pathogens, such as E. coli and L. monocytogenes [7]. Oxalic, propionic, tartaric, butyric, malonic, malic, lactic, citric, maleic, fumaric, and succinic acids have been found in the leaves of lettuce [8]. Internally, organic acids inhibit microorganisms via a mechanism associated with pH, the ratio of the associated form of organic acids, chain length, cell physiology, and metabolism [9]. Organic acids that are lipophilic penetrate plasma membranes and reduce the pH of a pathogen’s cell interior, causing cell inactivation [10].
Research focusing on improving the contents of organic acids in baby lettuce harvested for fresh produce market is critical. The improvement of organic acid concentrations in lettuce to increase its defence mechanisms is not well investigated. Harvested fresh greens are commonly washed with chlorine to improve defence mechanisms against pathogens. It has been found that washing baby spinach with lactic and citric acid, or lactic and malic acid at 40 °C for 5 min is a better treatment, achieving a 2.7 log reduction of E. coli O157:H7 that is significantly higher than the commercially used chlorine [11]. The phytochemical contents of baby lettuce are normally compromised during harvesting, as they are harvested at a tender stage compared with fully grown lettuce. Fully grown lettuce display a higher content of total sugars, phenolic compounds, vitamin C and folates, while baby lettuce have a higher content of organic acids, carotenoids, and chlorophylls [12]. The higher pigmentation on baby lettuce is also used by consumers as a quality indexing parameter. Nitrogen is the fertilizer nutrient responsible for the green pigmentation of vegetables. The nitrogen contents of leafy vegetables have a strong linear relationship with the chlorophyll pigment [13]. The amount of nitrogen available for plant uptake from a fertilizer causes a significant change in the pigmentation of baby lettuce.
Cano and Arnao [14] found that the stems and oldest leaves of fully grown lettuce contain more lipophilic than hydrophilic antioxidant compounds compared to younger leaves. The amount and activity of hydrophilic antioxidant compounds, being immersed in water, are directly affected by the water content of the young leaf. Deficit irrigation can be an ideal technique to increase the TSS as well as the concentrations of antioxidant compounds in baby lettuce. Deficit irrigation is known to increase the concentration of TSS in plant tissues [15]. It was hypothesised that increasing nitrogen and water supply levels will increase the growth, total antioxidants, and organic acids of the baby lettuce. This study investigated the effect of applying different levels of nitrogen fertilizer and irrigation water on growth, antioxidants, and organic acids of baby lettuce.

2. Material and Methods

2.1. Growing Conditions

This study is reported as an average of two pot experiments executed in the year 2019 and repeated in 2020. The experiments were conducted during the winter season inside a net house that had an average of 27 °C ambient temperature and no rainfall throughout the experiment period at the North-West University Farm (25°49′15.8′′ S 25°36′50.4′′ E) located in Mafikeng, South Africa. The net house was 10 × 60 m3, covered with a 60% grey net, and faced south-east, which was diagonal to the sun direction.
A virgin red sandy-loam soil was collected from the experimental site. Its texture was determined using the standard hydrometer method. The collected soil was sieved using a 3 mm sieve to avoid clogged particles. The soil moisture content was reduced by spreading the soil on top of a plastic sheet inside the net house for three days. This was performed to simulate a condition of a farm soil that went through a dry winter season. The prepared soil was randomly sampled and analysed for its nitrogen content using the Leco instrument (LECO Africa (Pty.) Ltd., Spartan, Kempton Park, South Africa), before samples of 5 kg were poured into 7 L pots.
The collected soil had a sandy loam texture (56% sand, 6% clay, 38% silt), a slightly acidic pH (6.50), residual carbon of 256.67 µg/g, and residual sulphur of 1.11 µg/g. Residual nitrogen in the soil was also assessed and found to be 20.08 µg/g. This is the soil property associated with leaf area and overall yield. The amount of N left in the soil after crop harvest is known to vary from year to year because of the ever-changing and unpredictable/random environment that causes yield levels to fluctuate every season [16]. The value of nitrogen carryover information can be obtained by using stochastic or deterministic plateau functions. Over-application of nitrogen can have negative environmental implications if residual N is not considered, which can be avoided by the use of appropriate functions during assessment of total N that will be available for the planted lettuce [17].
Romaine lettuce seeds were selected because this cultivar is known to withstand heat better than other cultivars. The seeds from Starke Ayres® (STARKE AYRES PTY LTD, Northmead, South Africa) were purchased from a local market. They were germinated in seedling trays containing hygromix organic substrate media for their development and growth until they were transplanted into pots containing the soil. The healthy and vigorous seedlings were transplanted one week after emergence.

2.2. Experimental Design

This study was laid out in a 3 × 4 completely randomised block design with 3 replications resulting in the total of 36 pots per experiment. The pots were spaced in a measured 1 × 1 m2 layout which occupied a space of 10 × 4 m2 of the 10 × 60 m2 net house. One seedling was grown in each pot. Four nitrogen fertilizer (urea) levels were based on the recommended N application for lettuce which is 140 kg/ha (0.14 g/5 kg soil) (DAFF, 2020). The applied N levels were 0.10, 0.14, 0.18, and 0.22 g, placed in rooting zone prior to transplanting. The recommended rate of lettuce irrigation amount is 600 mL/5 kg at two-day intervals in sandy loam soils (DAFF, 2020). Therefore, the irrigation levels L1 (300 mL), L2 (600 mL), and L3 (900 mL) per pot were carefully poured into the pots using a calibrated 1 L beaker at two-day intervals.

2.3. Measurement of Chlorophyll Concentration, Plant Growth and Dry Matter Content

The chlorophyll concentration was measured weekly throughout the three weeks experimental period using the chlorophyll meter (Apogee MC-100 Handheld, Apogee Instruments, India). The measurement was taken weekly from the middle of a fully matured leave. The number of leaves were counted per pot. Leaf area was expressed as a product of the leaf length and width. The dry matter content was measured as a percentage of dry matter to fresh sample mass. The mass of freshly harvested leaf samples was measured using a digital weighing scale (RS PRO Weighing Scale, 300 g Weight Capacity Type A—North American/Japanese 2-blade) before being oven dried at 75 °C. The mass of the dried leaf samples was measured in 2 hr intervals until stable mass values were observed.

2.4. Quantification of Organic Acids

The two oldest and biggest leaves were taken in the final sampling at three weeks after transplanting, which was the 4th week after emergence. The leaf sample was cut from the base of the plant and taken to the laboratory for analysis. The citric, tartaric, and malic acids were evaluated by the titratable acidity method [18]. Briefly, 0.5 g of each sample was crushed and mixed with 10 mL distilled water to extract the juice, then the 0.25 µm filter papers were used to filter the extract into a beaker. The pH was basified using 0.5 M sodium hydroxide (NaOH) to the end point of pH 7.0. The amount of NaOH used (titre) was recorded and the formulae for citric acid (1), malic acid (2) and tartaric acid (3) were applied to calculate their concentrations in the leaf as percentages (%):
%Citric acid = ((0.0064 × titre))/(10 mL juice) × 100
%Malic acid = ((0.0067 × titre))/(10 mL juice) × 100
%Tartaric acid = ((0.0075 × titre))/(10 mL juice) × 100

2.5. Quantification of Total Antioxidant Compounds

The crushed sample from the oldest leaves that was taken during the fourth week after emergence sampling was also used for obtaining extracts for analysis of antioxidant compounds. Leaf extracts were obtained by immersion of 0.5 g ground leaf mass into 10 mL of 80% (v/v) methanol. The extraction was kept at room temperature for 1 h in the dark, with the agitations at 15 min intervals. The pure aqueous extract was obtained by filtering the sample through a 0.25 µm filter papers.
The total antioxidant compounds (TAO) of the extracts were evaluated by the phosphor-molybdenum method according to [19]. The 0.3 mL methanolic extract was combined with 3 mL reagent solution (0.6 mM sulphuric acid, 28 mM sodium phosphate and 4 mM ammonium molybdenum) and incubated at 65 °C for 60 min. The solution was allowed to cool at room temperature before its absorbance was measured at 695 nm using the UV-180 Spectrophotometer (Shimadzu Scientific Instrument INC., Washington, Columbia, USA) against a methanol blank of 0.3 mL. The total antioxidant activity was expressed as milligrams equivalent of ascorbic acid per gram of plant-fresh mass based on the developed standard curve with the formula: y = 0.4665x + 0.0618, and R2 = 0.96.

2.6. Data Analysis

The analysis of statistical variance among collected data was performed using GenStat statistical software (GenStat®, 14th edition, VSN International, Harpenden, UK). The average of data from the 2019 to 2020 experiments was calculated prior to the analysis of overall means of treatment. The prepared data were subjected to ANOVA and means were separated by least significant difference (LSD) at two levels of confidence: 95% confidence interval (p = 0.05), then 99% confidence interval (p = 0.01). The correlations between the parameters were performed with 95% accuracy via chemometric data analysis that was executed using The Unscrambler® X software (The Unscrambler® X v10.5, Camo Software AS, Oslo Science Park, Olso, Norway).

3. Results

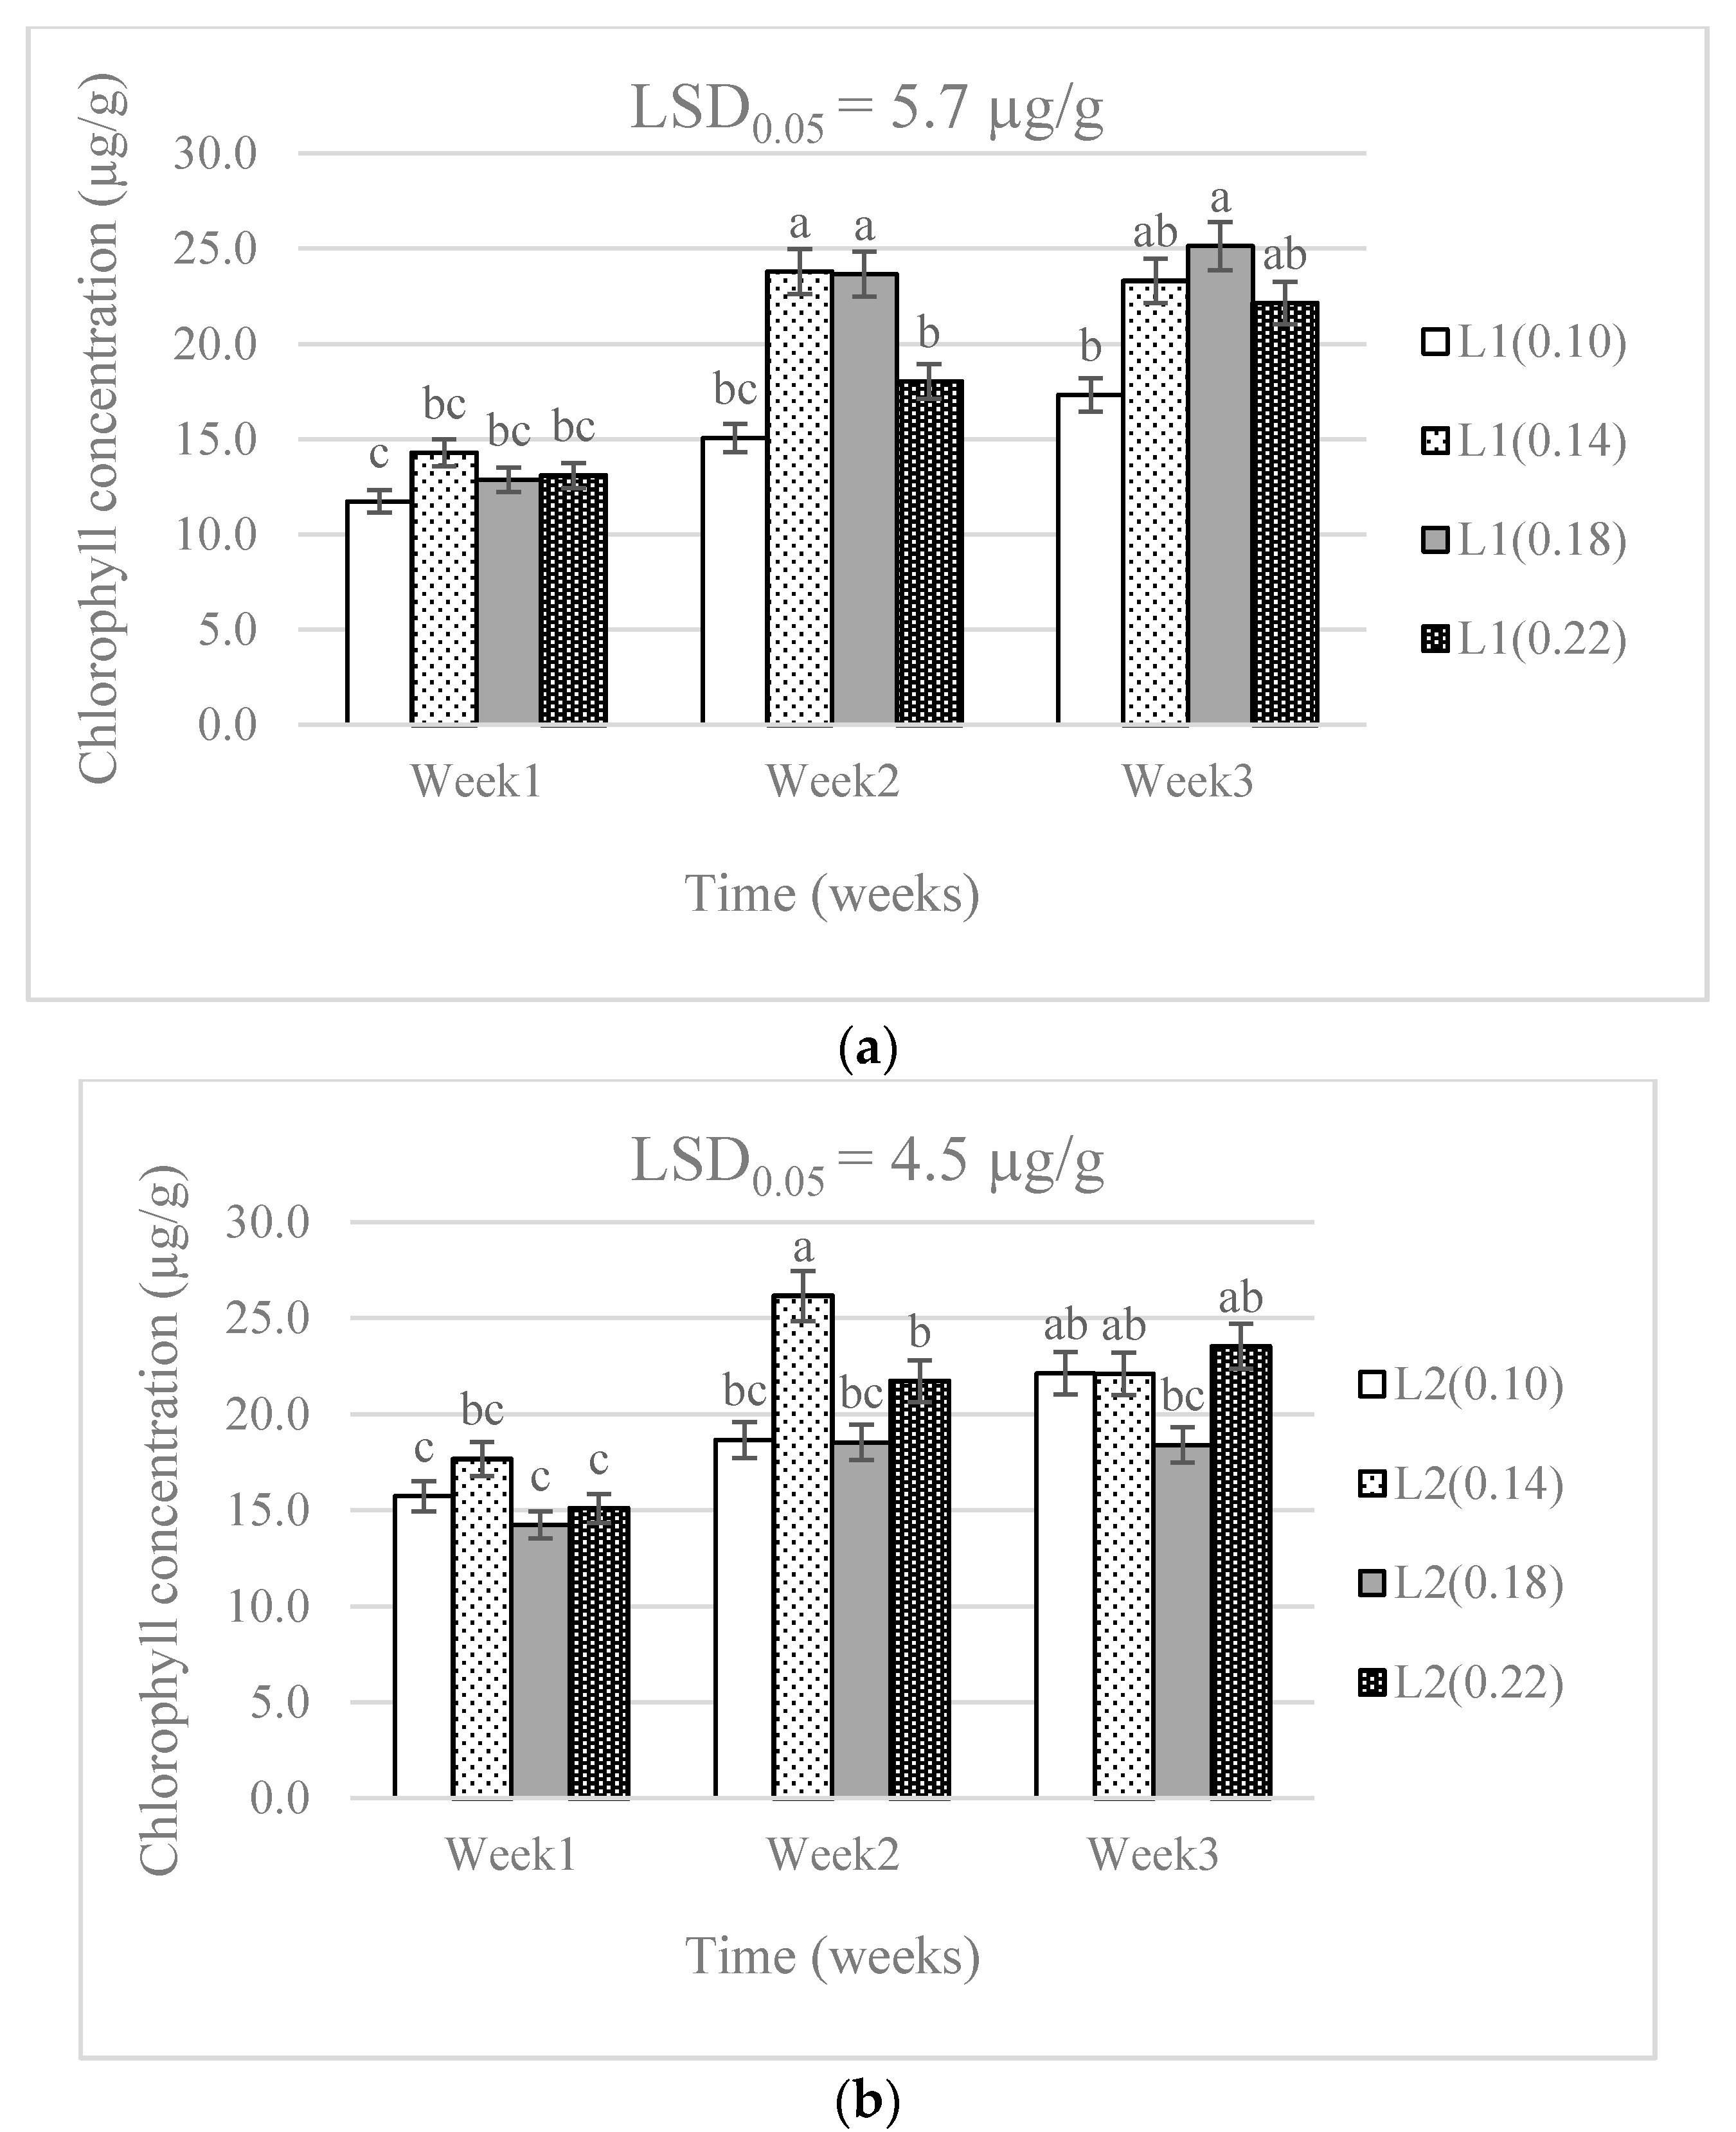
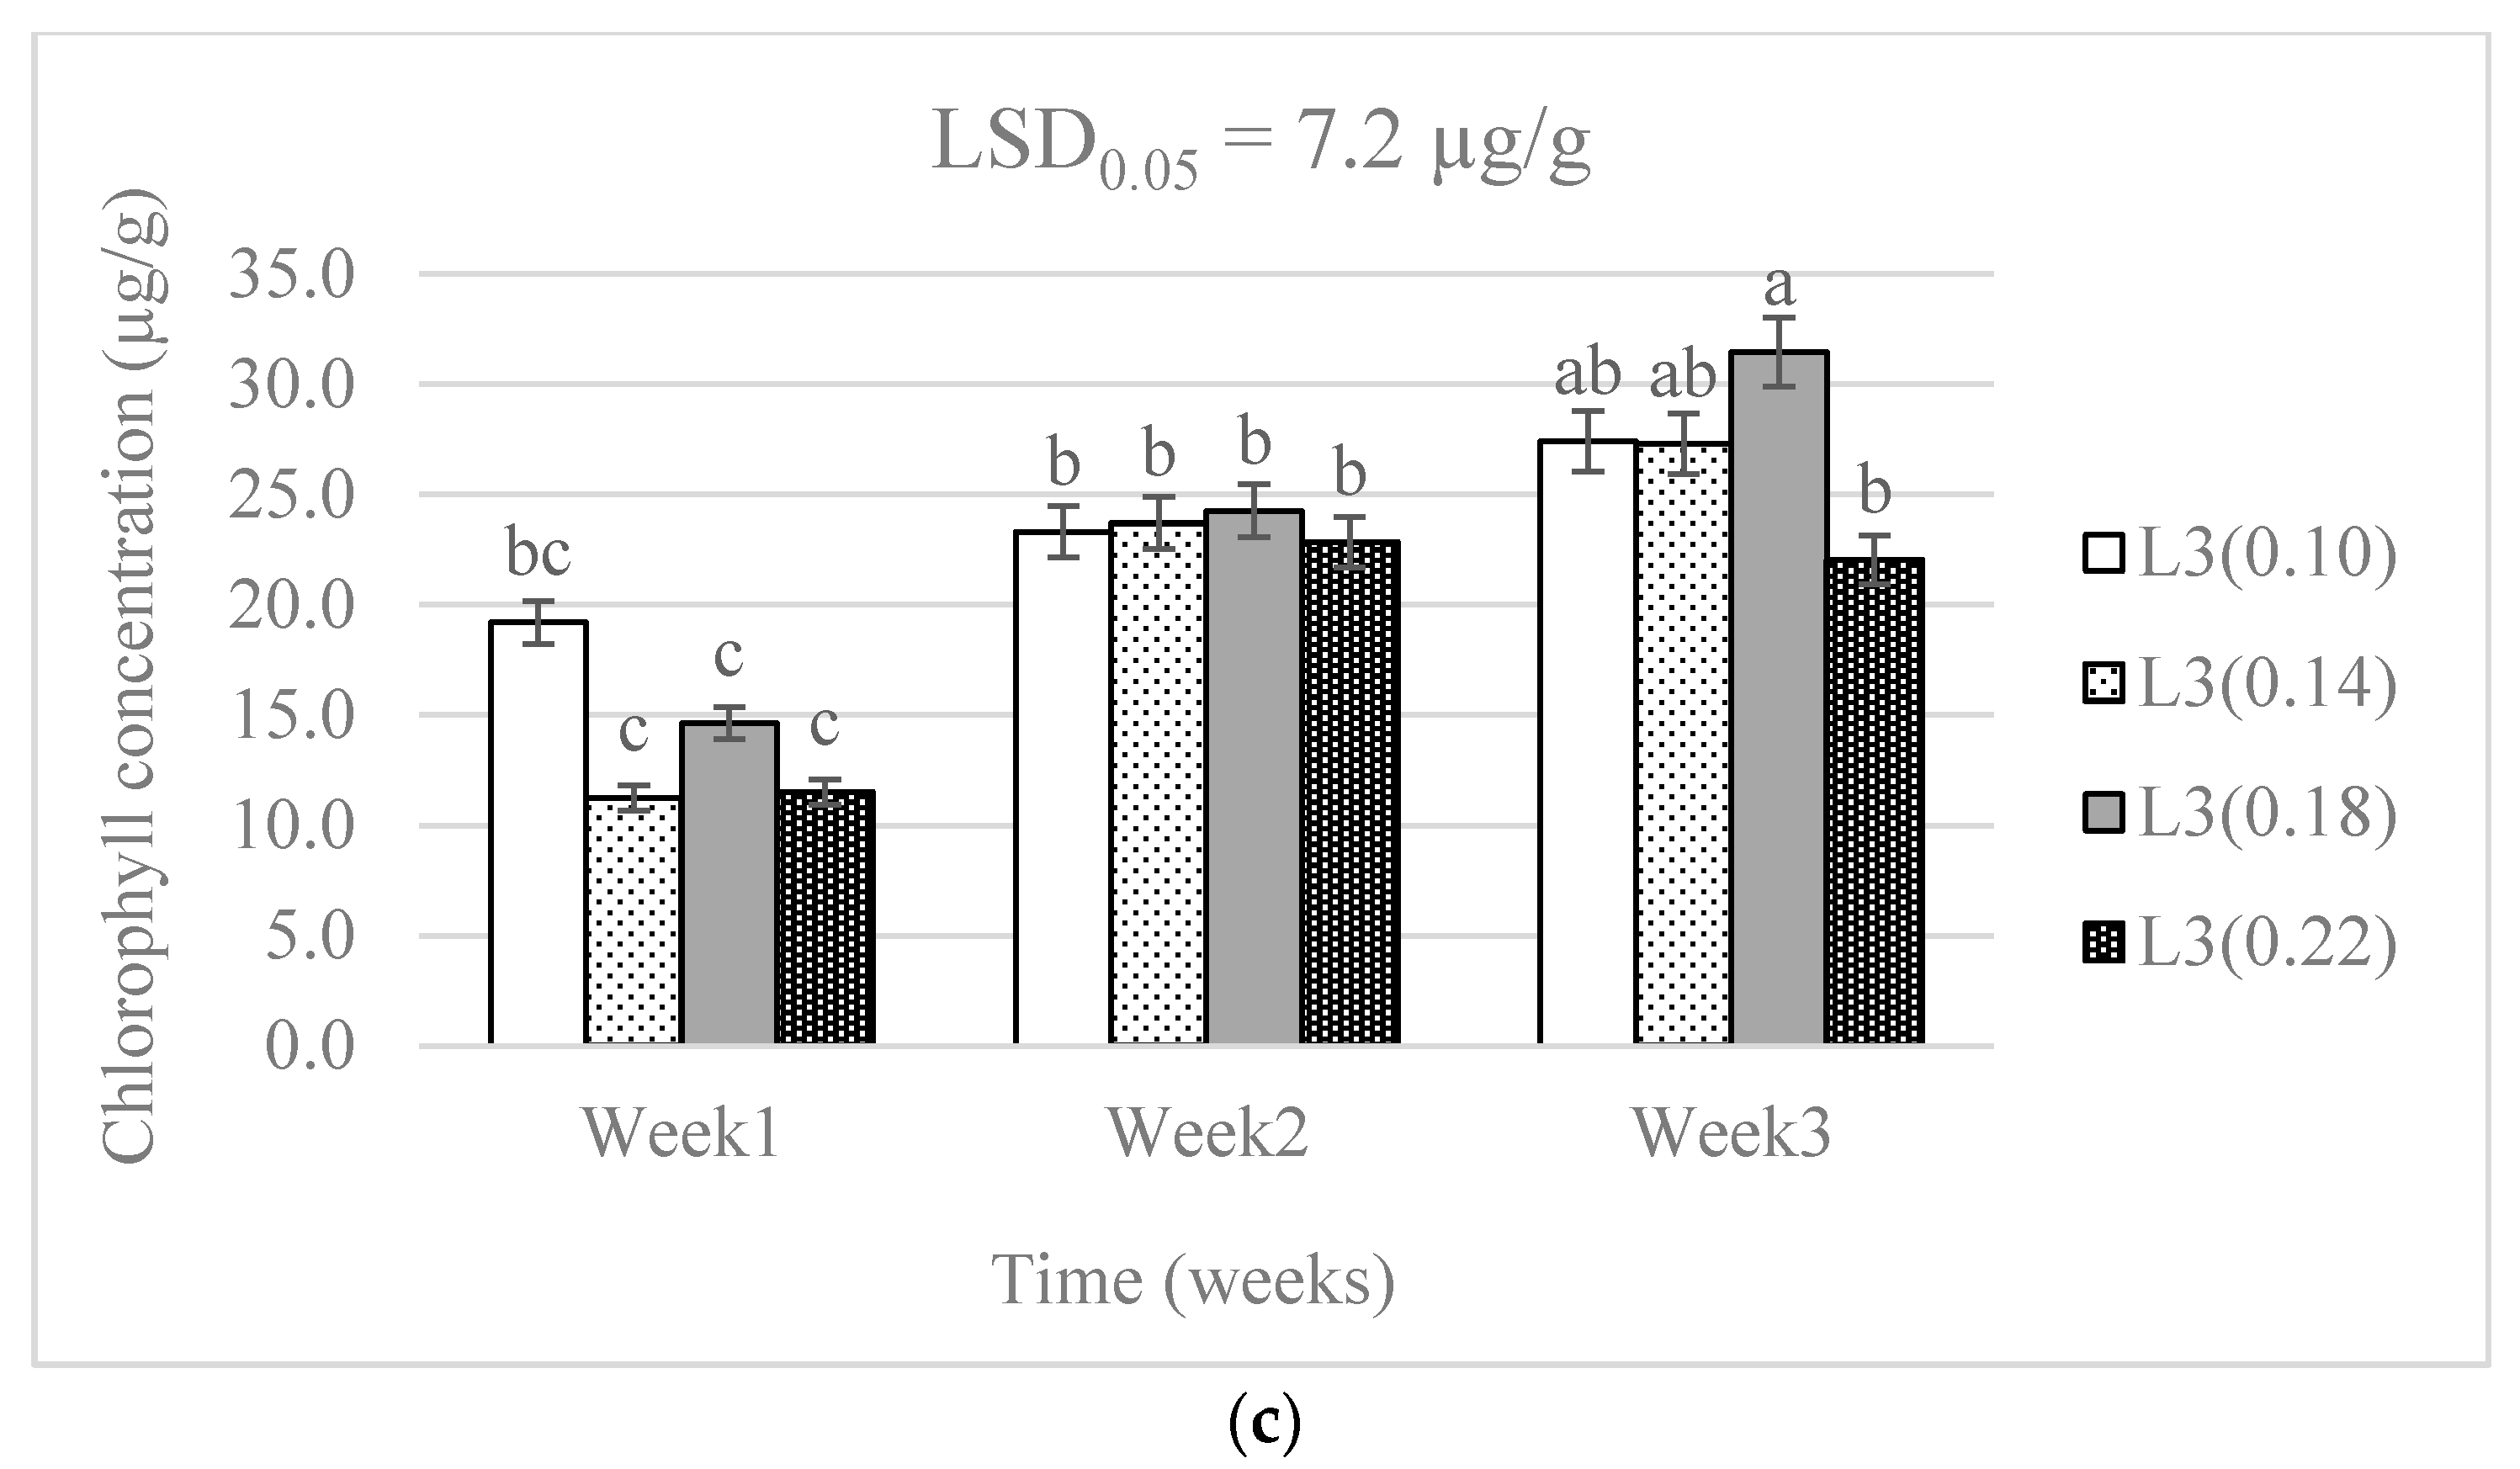
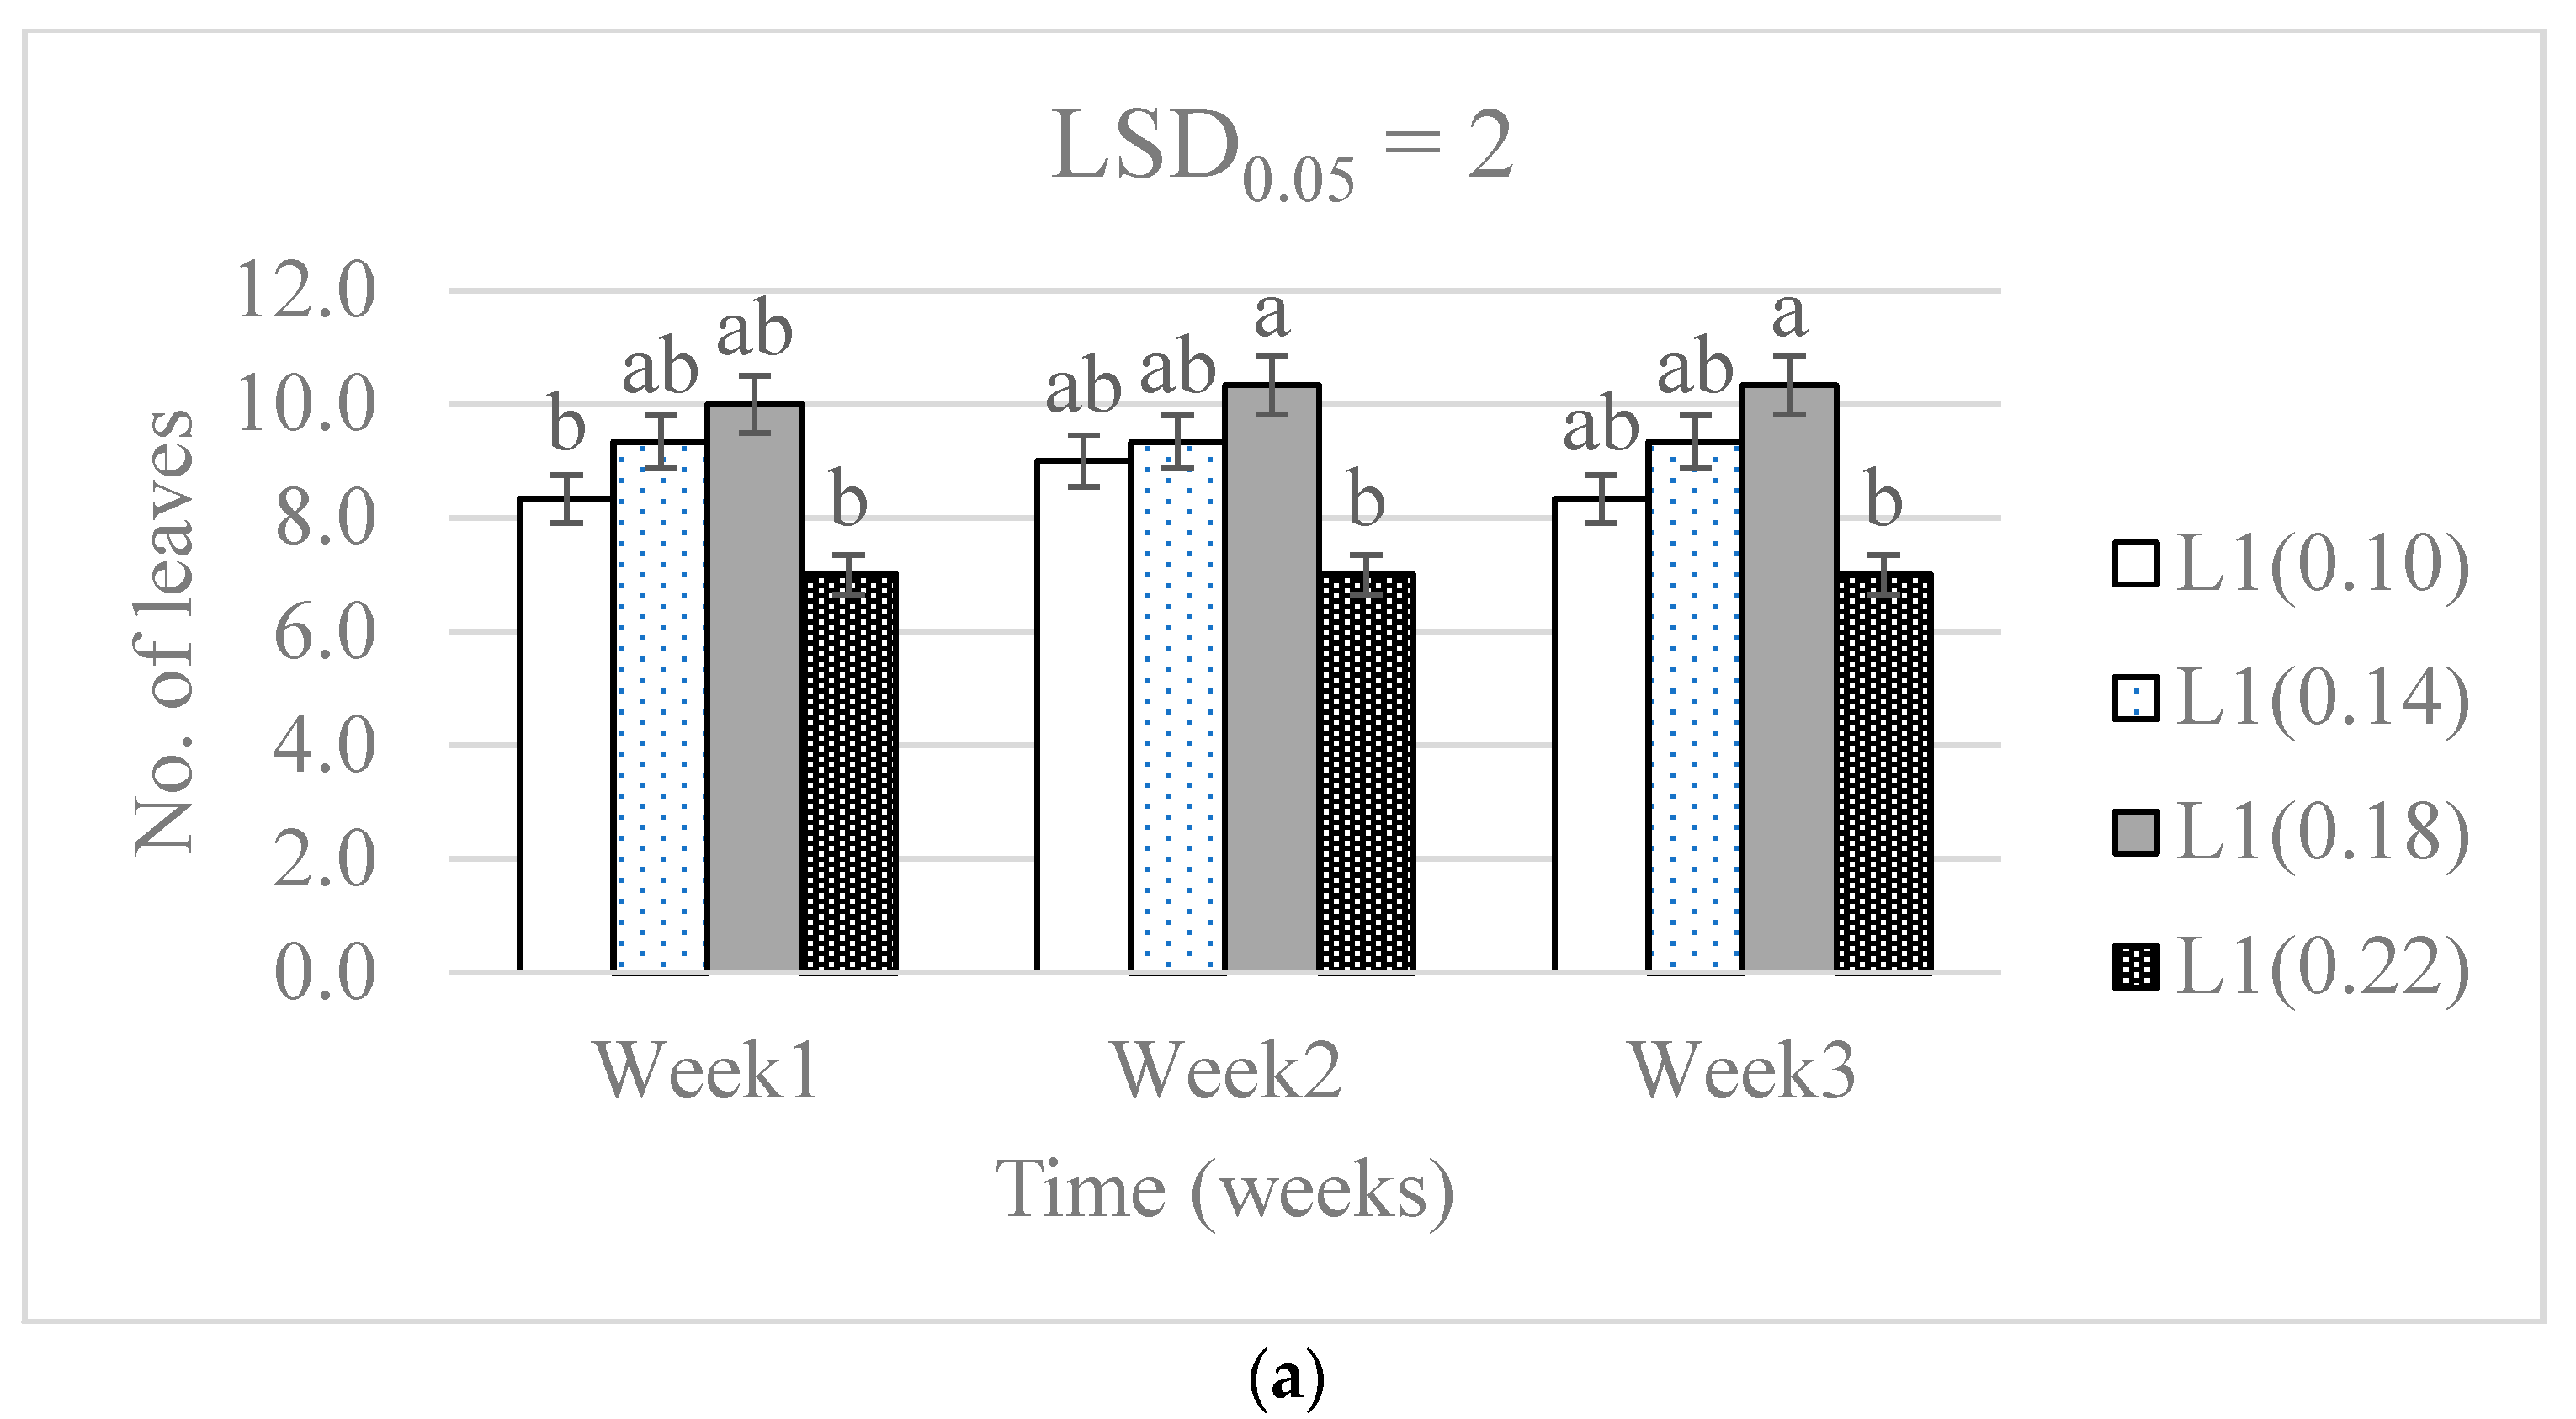
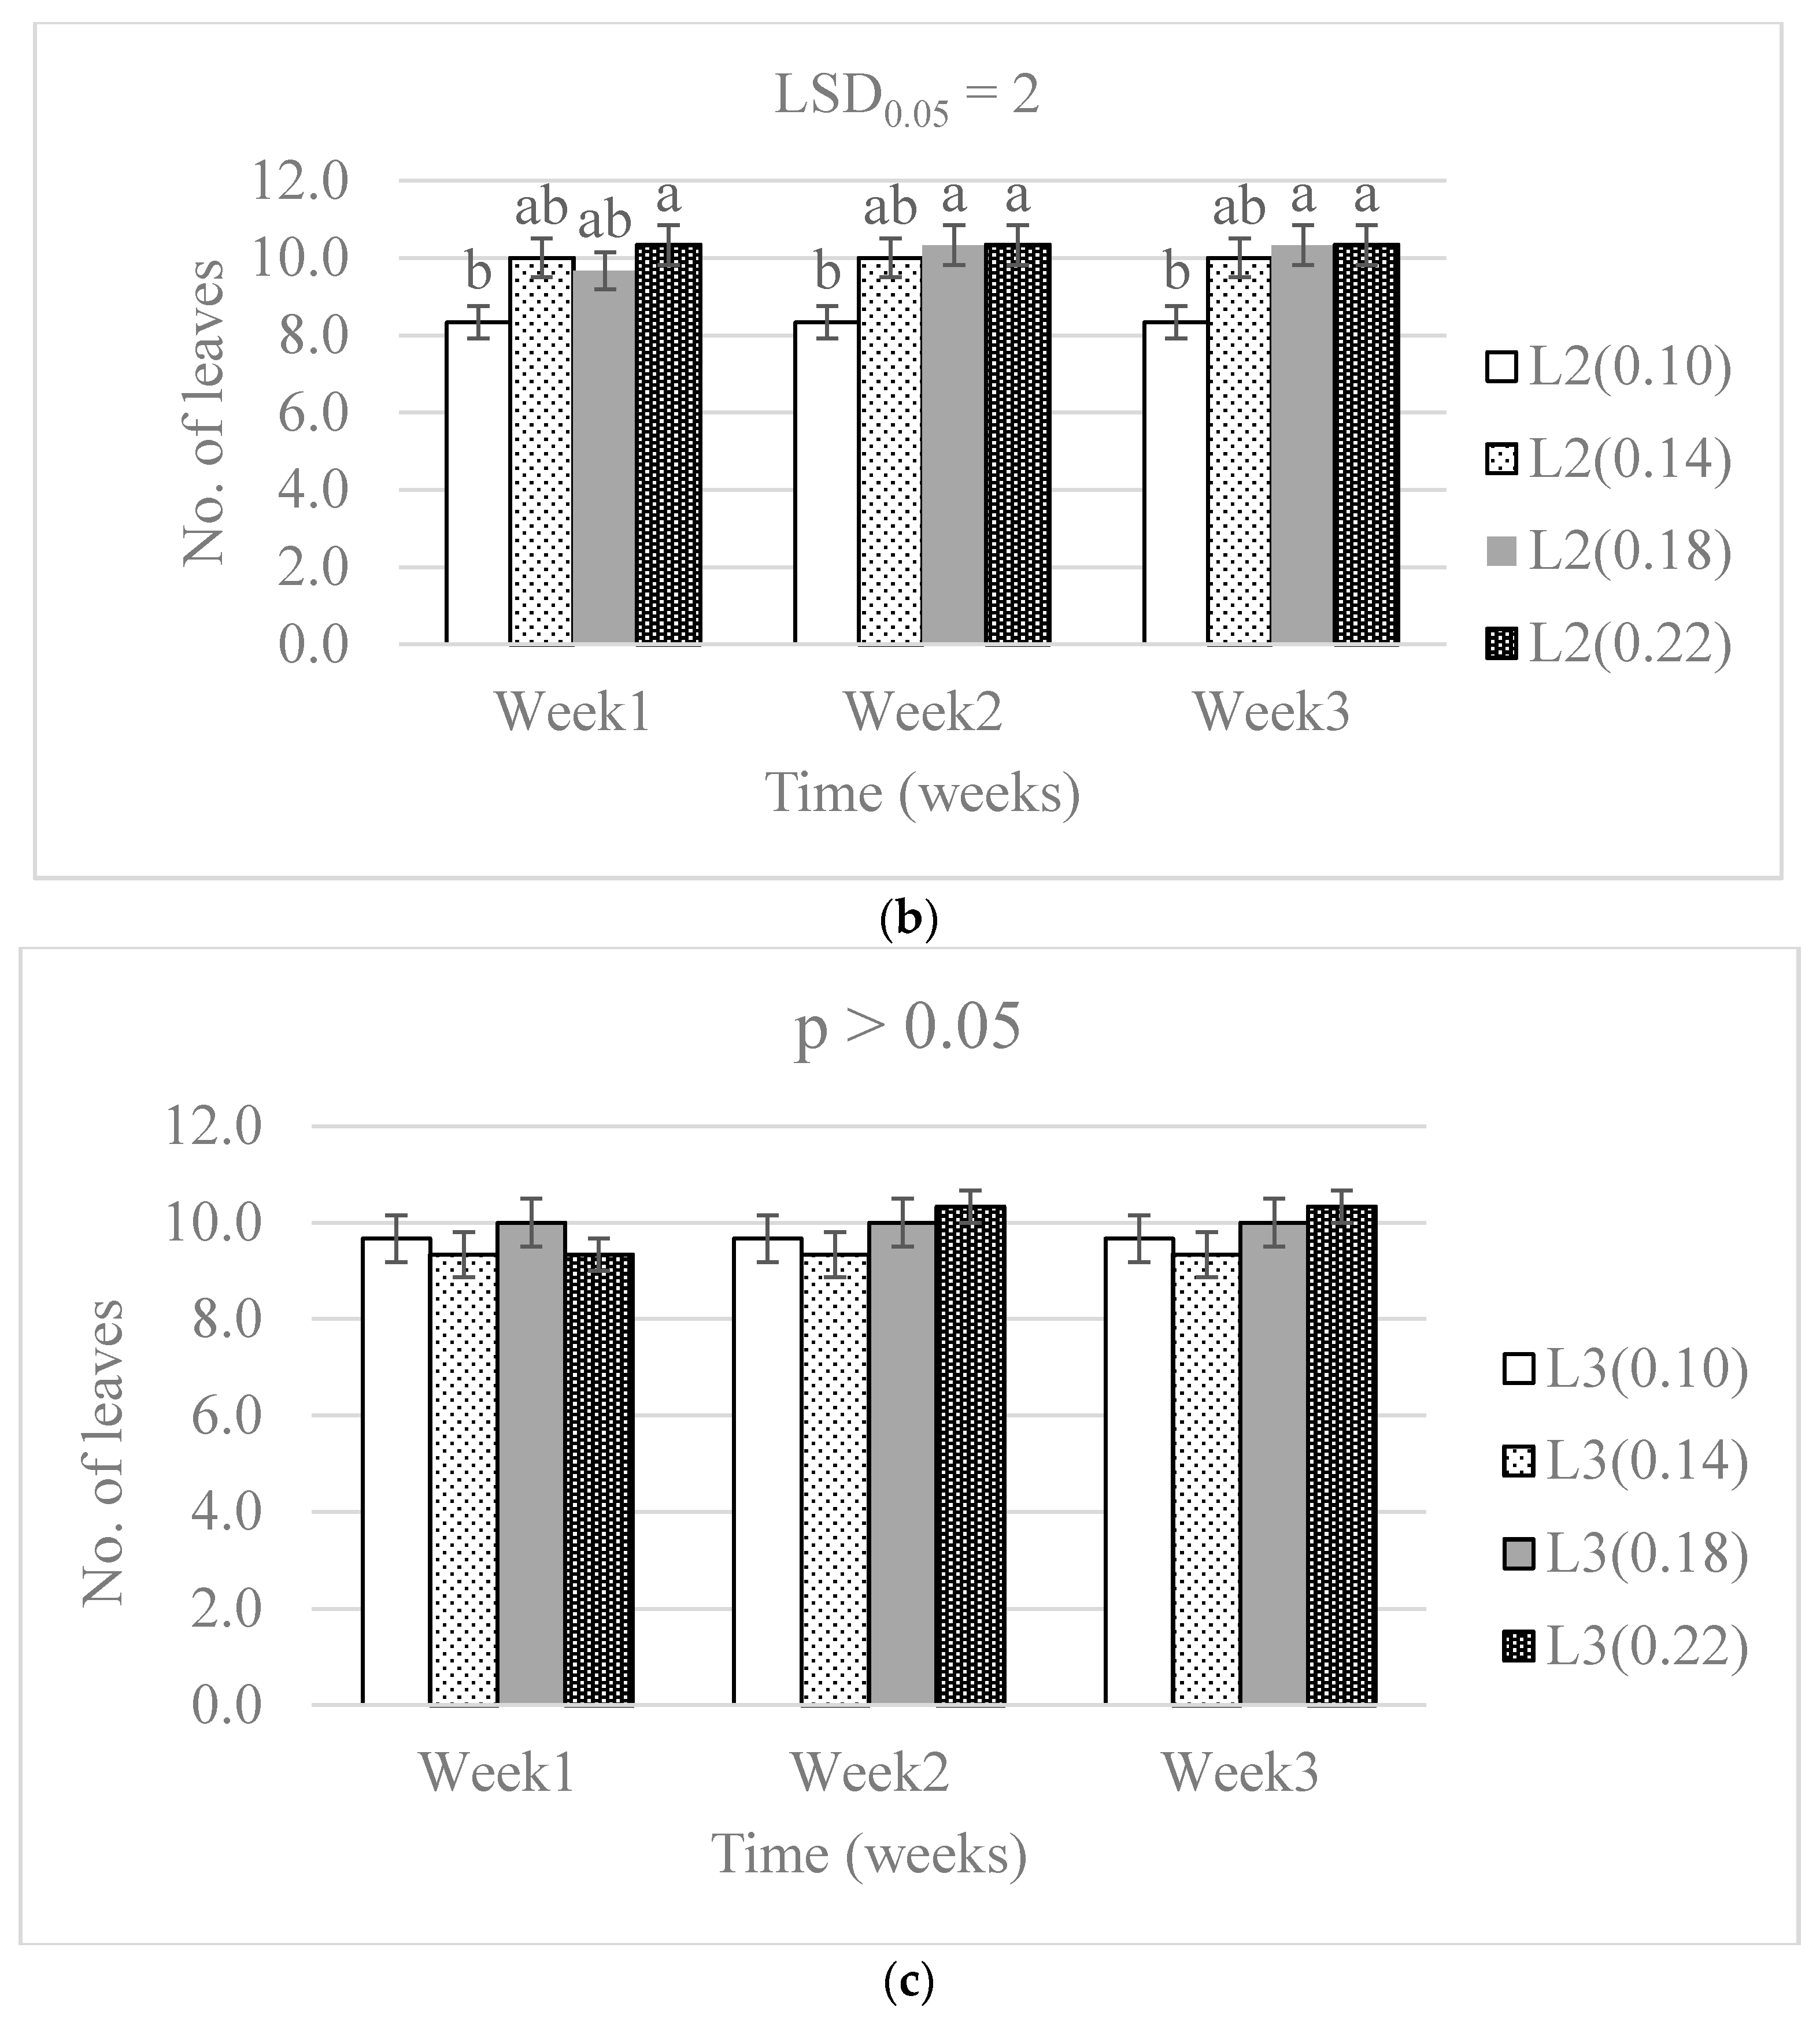
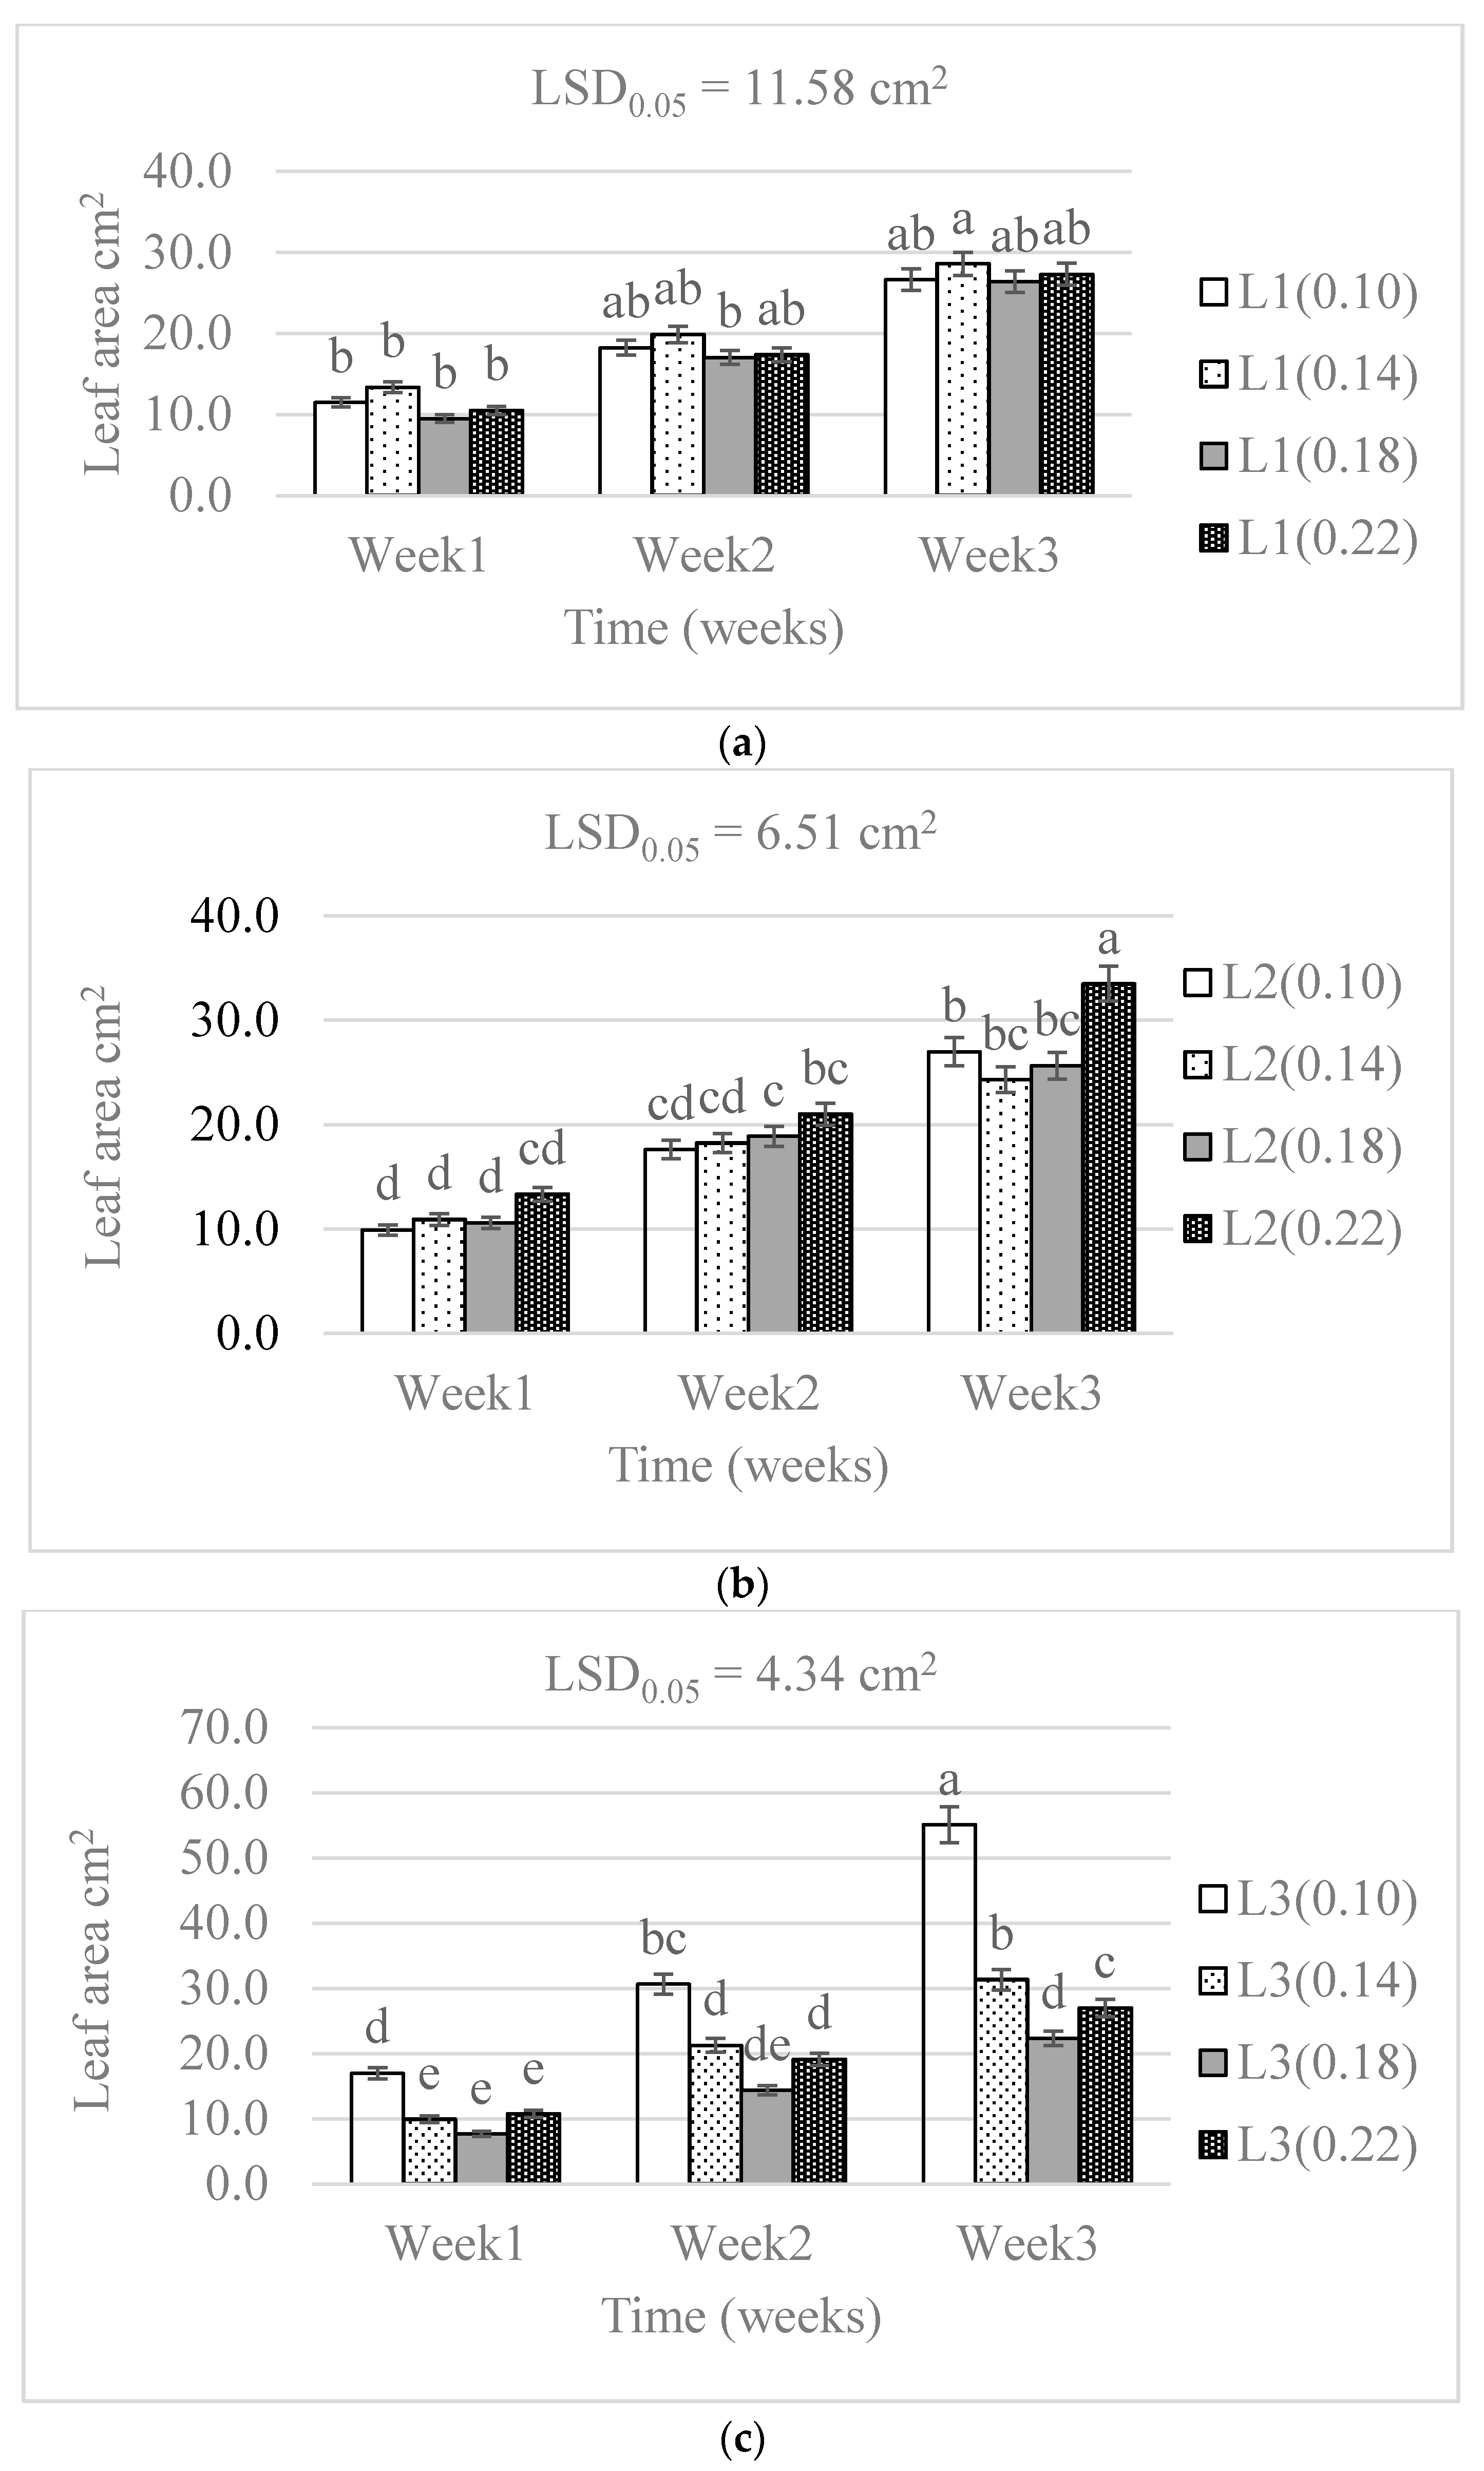
3.1. Chlorophyll Concentration and Plant Growth

There were no significant differences (p > 0.05) in the leaf chlorophyll concentrations from the different N levels. A significant effect (p < 0.05) was caused by the difference in water supply levels. The combination of water supply and N levels showed a significant effect (p < 0.05) on the leaf chlorophyll concentration (Table 1). There was a higher chlorophyll concentration in week three than in week one in all treatment combinations. The chlorophyll concentration was lowest in the 0.18 g N level and L2 combination. The 0.18 g N level was above the 0.14 g level recommended by DAFF [20], but below the highest level (0.22 g) applied in this study. The chlorophyll concentration increased with time in all treatment combinations (Figure 1).
Significant differences in the number of leaves were caused by the N level (p < 0.01), the water supply (p < 0.01) and the treatment combinations (p < 0.001) throughout the three-week period (Table 1). The number of leaves significantly increased along the three experimental weeks in all treatments except the 0.22 g N level and L3 water supply (Figure 2). Although differences were observable, there was a non-significant difference in the number of leaves because of N level in the L3 water supply throughout the experimental period.
The N levels caused significant differences (p < 0.01) in the leaf area. The water supply levels resulted in non-significant differences. The leaf area showed significant differences (p < 0.01) in all treatment combinations (Table 1). Notably, the difference between the leaf areas of treatment combinations was significantly increased by increasing the water supply. The treatment combination of the highest water and lowest nitrogen levels (L3(0.10 g)) resulted in doubled expansion of the leaf area compared with the lowest treatment combination. The L2(0.22 g) and L3(0.10 g) were significantly higher than the other treatments, but not much from each other. The highest leaf area was observed in the lowest nitrogen (0.01 g) followed by the 0.14 g, 0.22 g, and the 0.18 g, in the highest water supply (Figure 3).

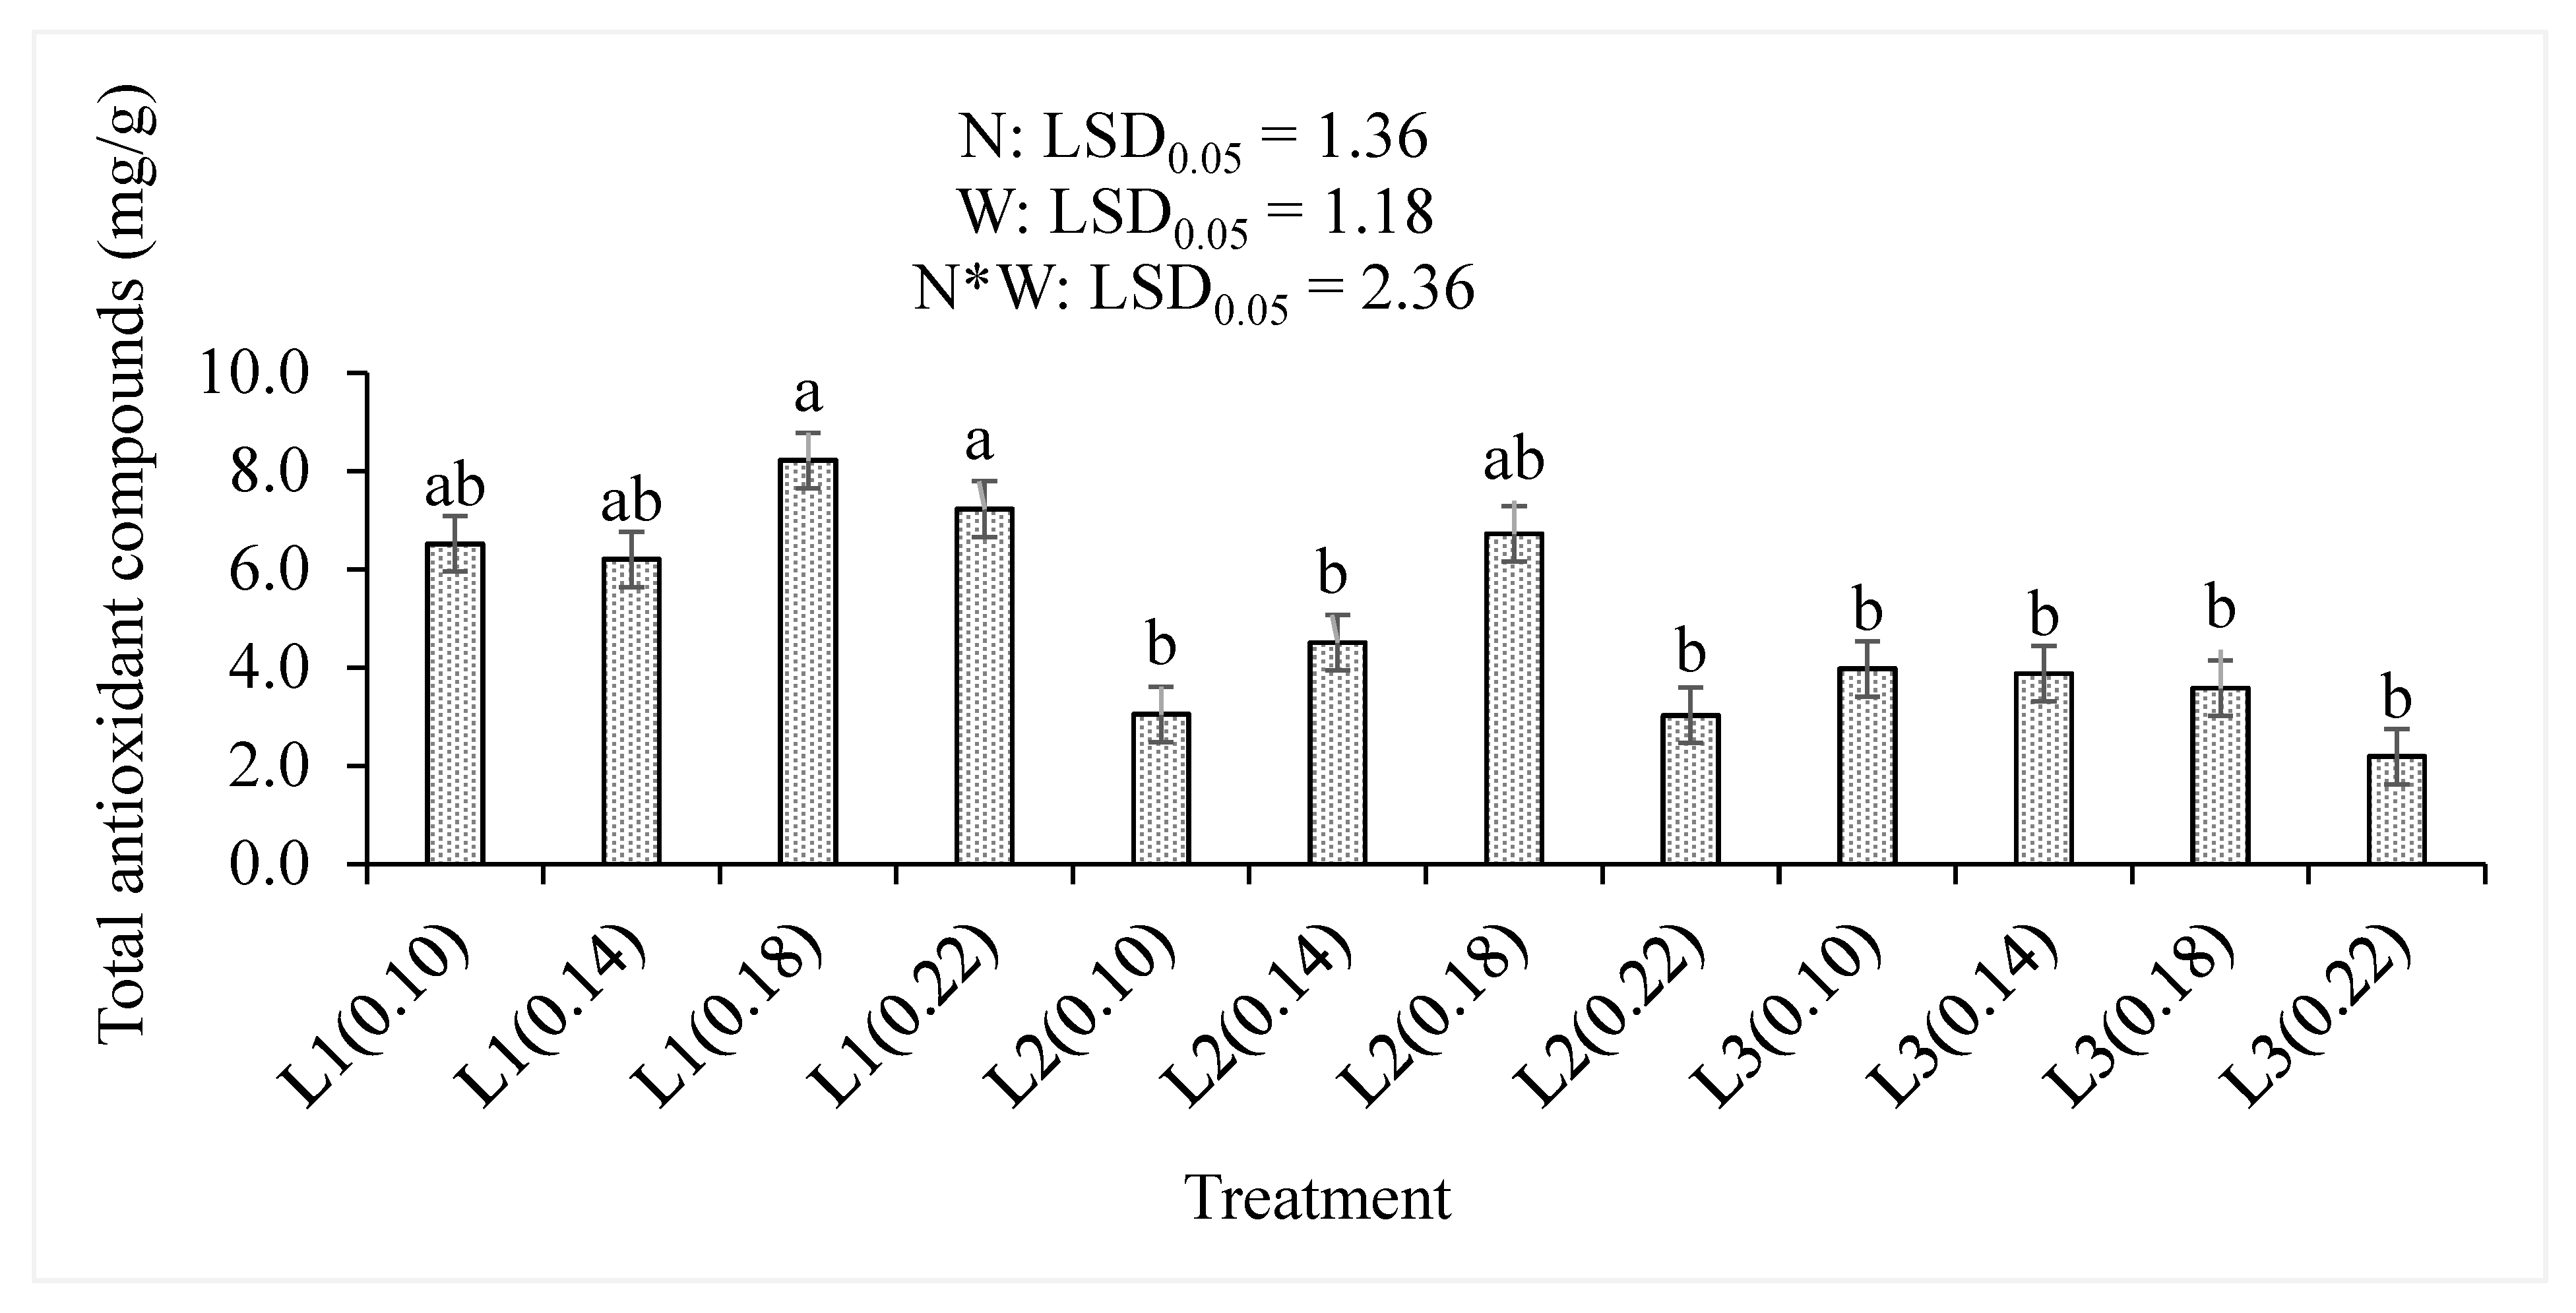
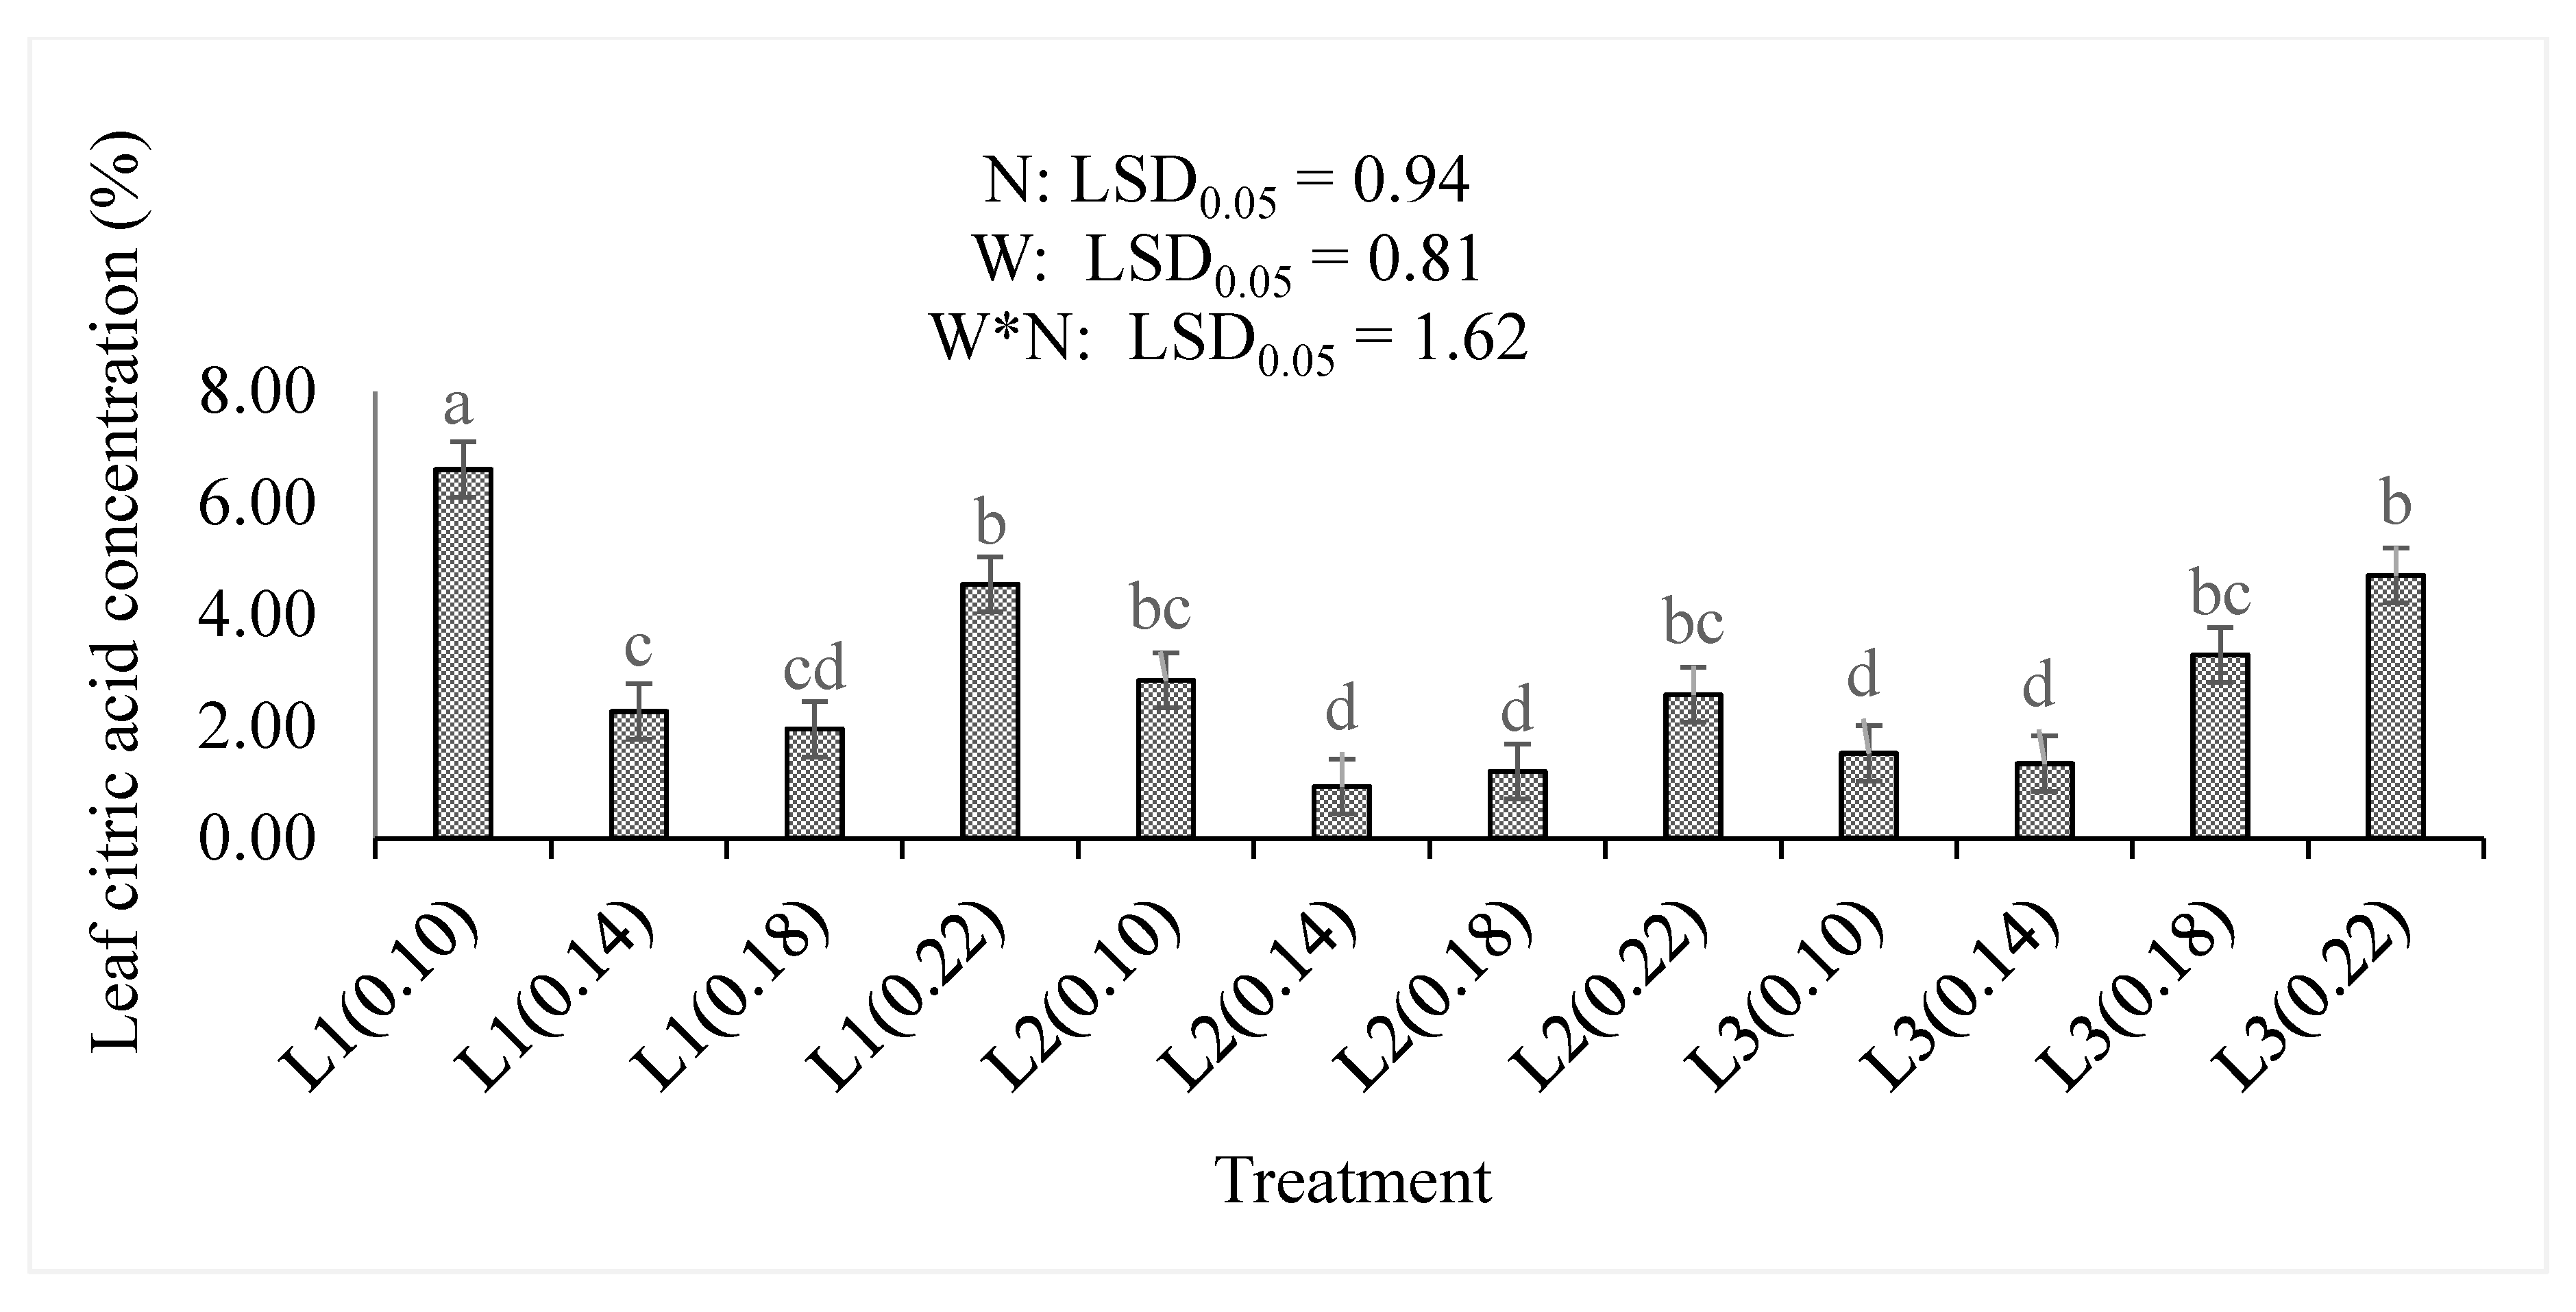
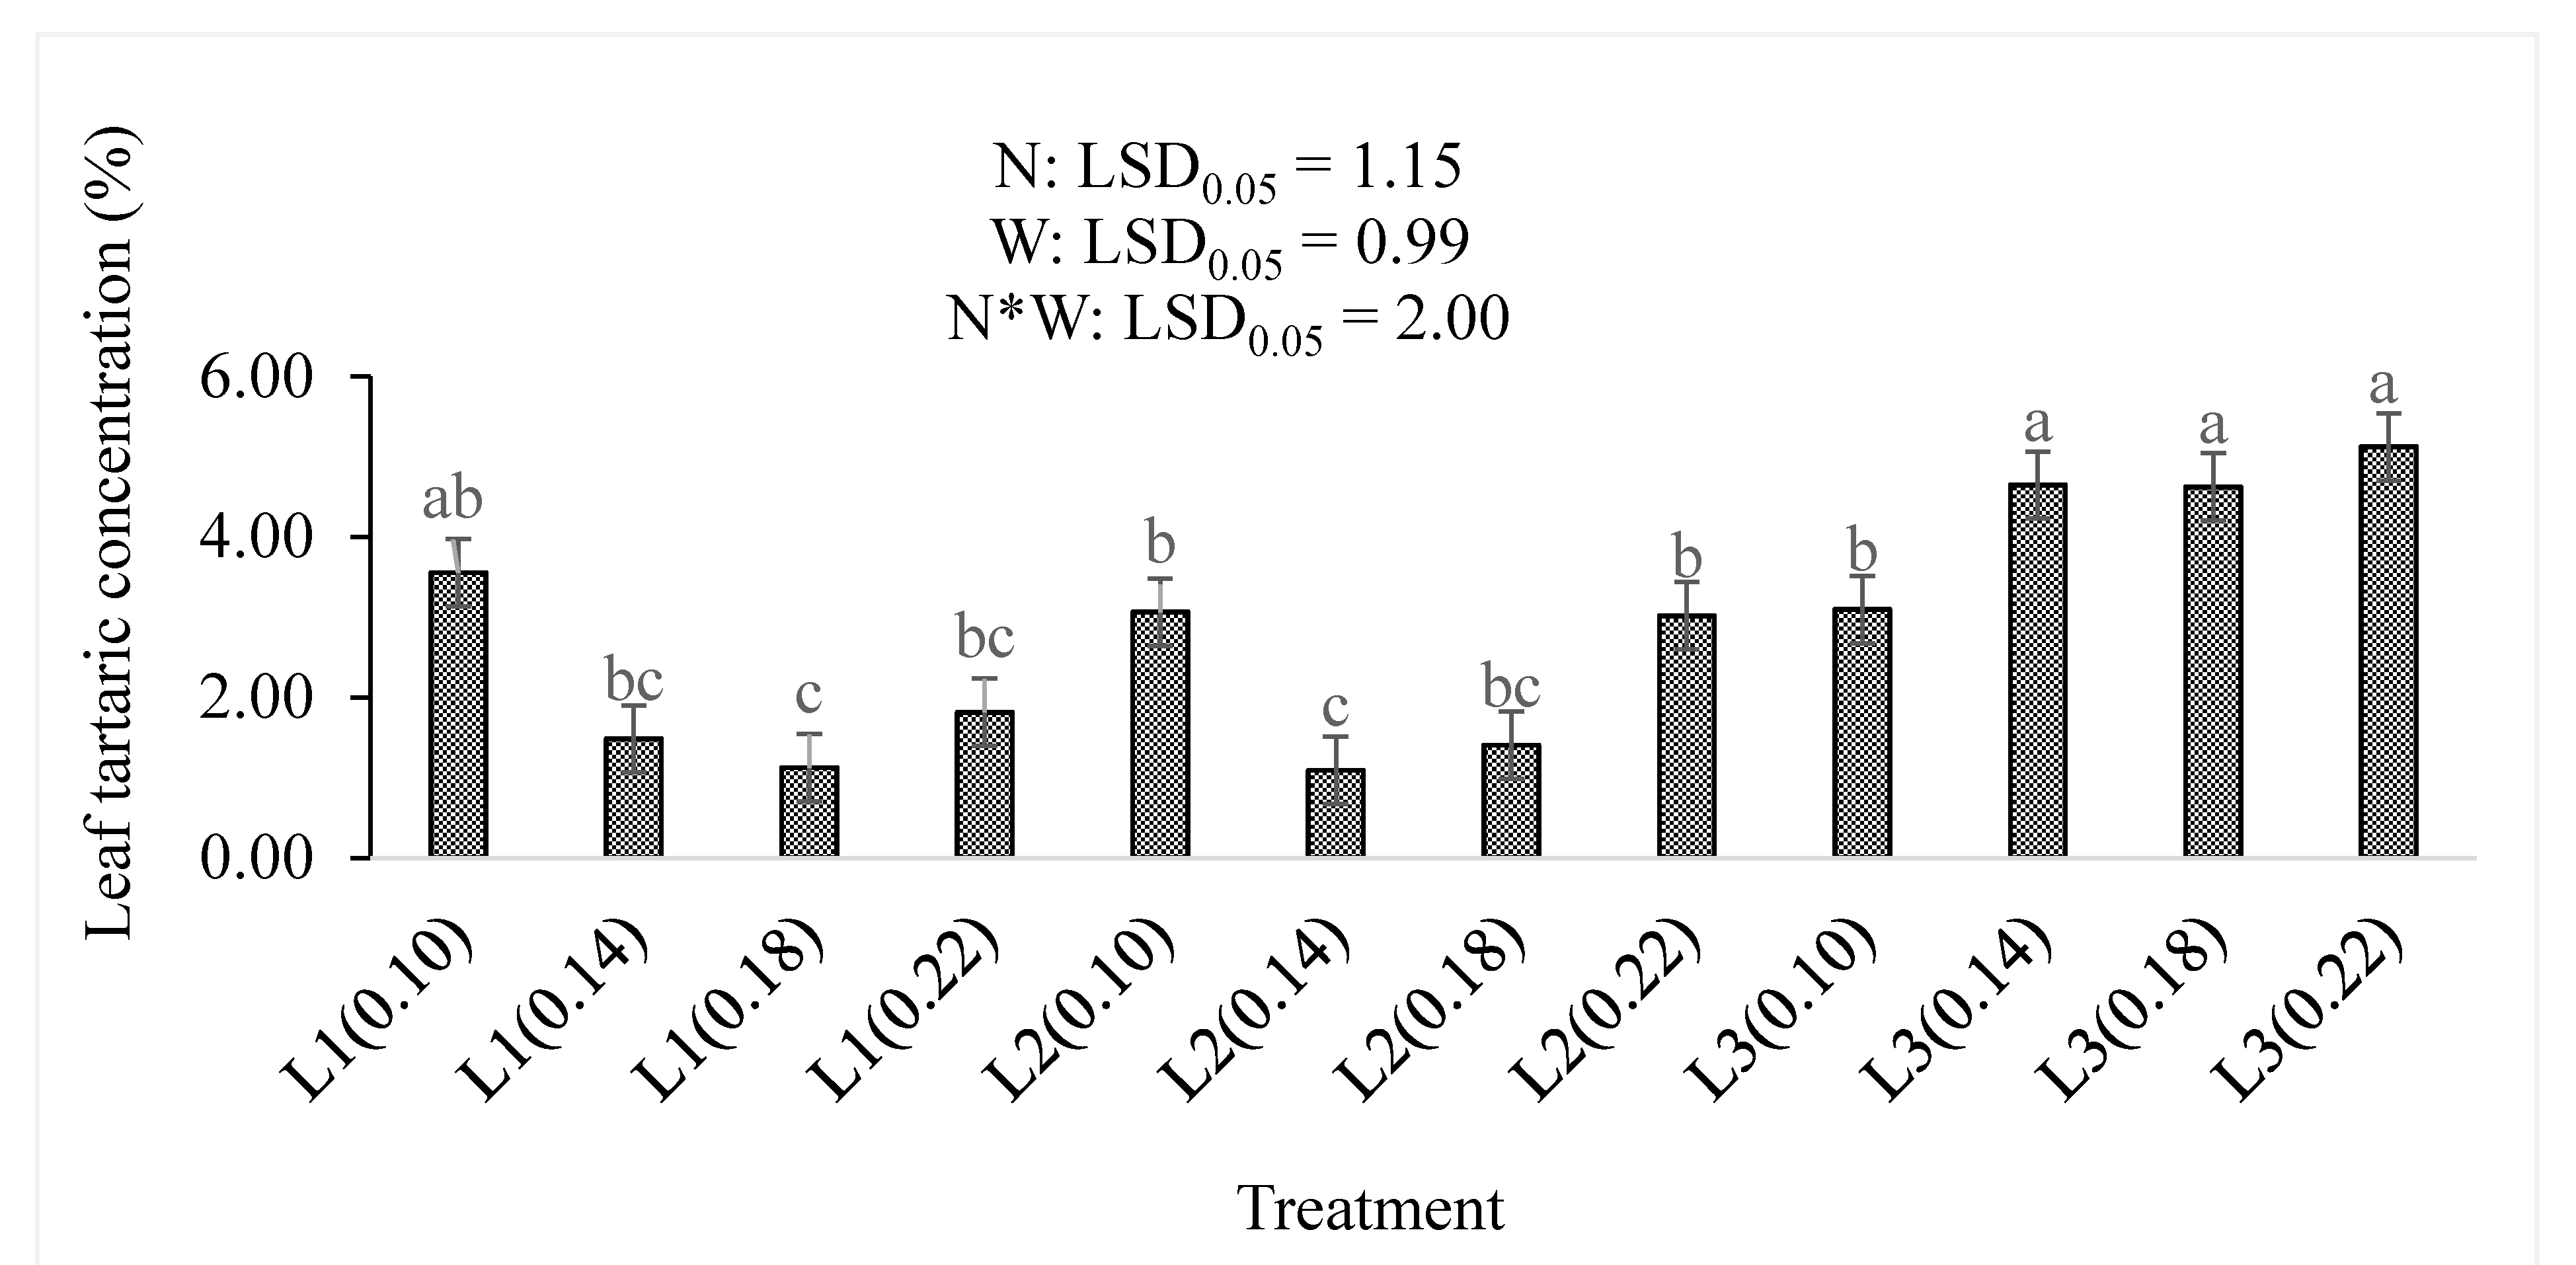
3.2. Total Antioxidant Compounds, Organic Acids, and Dry Matter Content

The levels of nitrogen and water supplied to the baby lettuces significantly (p < 0.05) affected the leaf concentration of total antioxidant compounds (Figure 4). The lowest supply of water with moderate nitrogen fertilizer level (L1(0.18) and L1(0.22)) showed 8.22% and 7.23% that were the higher TAO concentrations than any other treatment combinations. The 0.18 level of nitrogen showed highest TAO concentration on both L1 (8.22%) and L2 (6.72%). However, further increase in water supply resulted in non-significant differences in the L3 supply that had the lowest concentration of 2.19% at the L3(0.22) treatment combination. Increasing water supply decreased the TAO concentration of the lettuce leaf regardless of the increase in applied nitrogen levels. Increasing the nitrogen levels or the treatment combinations significantly (p < 0.001) increased the TAO concentrations, while the increase in water levels significantly (p < 0.001) decreased it (Table 2).
The leaf citric acid concentration was the highest (p < 0.05) at the lowest water supply and nitrogen level (L1(0.10)). Increasing the amount of nitrogen in L2 and L3 increased the leaf citric acid concentration (Figure 5). There was a non-significant difference between the lowest (0.10) and the highest (0.22) nitrogen levels in the L2 water supply. Increasing the amount of water supplied increased the positive response of leaf citric acid to the nitrogen application. However, the increase in water supply significantly reduced it. This is observed in L3 where the lower levels of nitrogen (0.10 and 0.14) had significantly lower citric acid concentrations than the higher levels (0.18 and 0.22). The concentration of leaf citric acid was significantly (p < 0.001) increased by increasing the nitrogen level, but significantly (p < 0.001) reduced by increasing the water supply or the treatment combinations (Table 2).
Increasing both the water supply and nitrogen levels increased the leaf tartaric concentration of the baby lettuce (Figure 6). There were no significant differences in the top three levels of the treatment interactions (L3(0.14), L3(0.18), and L3(0.22)). These levels were higher than any other treatment combination but not significantly higher than the L1(0.10) concentration (3.55%). The lowest tartaric acid concentrations of 1.12% and 1.09% were observed in the L1(0.18) and L2(0.14) treatment combinations, respectively. The concentration of the leaf tartaric acid was increased by increasing the water supply (p < 0.001), more than it was affected by the nitrogen level (p = 0.196) in this study (Table 2). The combinations of the treatments also contributed non-significantly (p < 0.05) to the increase in leaf tartaric acid concentration.
Supplying the lowest amount of water resulted in a significantly (p < 0.05) increased concentration of the leaf malic acid (Figure 7). Although the differences were not statistically significant between the lowest treatment combination (L1(0.10)) and L1(0.22), the L1(0.10) treatment showed the highest concentration (6.55%) than any other treatment combination. A further increase in water supply to L2 or L3 significantly decreased the concentration of leaf malic acid concentration regardless of the nitrogen level. The lowest concentration (0.97%) was observed in the L2(0.14) treatment combination. The leaf malic acid concentration was not significantly affected by the nitrogen level (p = 0.166) or the treatment combinations (p > 0.05) but was significantly (p < 0.001) reduced by the water supply (Table 2).
Increasing water supply significantly (p < 0.05) decreased the leaf dry matter percentages, irrespective of the nitrogen level (Figure 8). The highest combination of treatments (L3(0.22)) resulted in the lowest dry matter percentage (8.20%) compared to any other treatments. The highest dry matter percentage (14.32%) was observed in the L1(0.10) treatment combination. In L1, only L1(0.10) was significantly different to other L1 water supply. In L2, only the L2(0.10) was significantly different to other L1 water supply. The significantly high (11.39%) dry matter percentage was observed in the L3(0.10), while the L3(0.22) treatment combination had the lowest (8.20%) dry matter percentage in the L3 water supply. A significant (p < 0.001) decrease in the dry matter percentage resulted from increasing the nitrogen level or the water supply, as well as increasing treatment combinations (p < 0.05) in this study (Table 2).

3.3. Correlation of Growth Parameters to Chlorophyll, Antioxidants, Organic Acids, and Dry Matter Percentage

Chlorophyll concentration had a positive correlation to the number of leaves (0.15), leaf area (0.58), and dry matter percentage (0.10), while it had a negative correlation to the total antioxidant compounds (−0.02) and the organic acids. The number of leaves had a positive correlation to the leaf area (0.11), total antioxidant compounds (0.20) and the tartaric acid (0.03), while it had a negative correlation with the citric acid (−0.31), malic acid (−0.23) and the dry matter percentage (−0.26). The leaf area had a positive correlation to the tartaric acid (0.01) and dry matter (0.03), while it had negative correlations to antioxidant compounds (−0.18), citric acid (−0.14), and malic acid (−0.20). The total antioxidant compounds had a positive correlation to citric acid (0.11), malic acid (0.22) and dry matter (0.09), while it had a negative correlation to tartaric acid (−0.13). Organic acids had positive correlations to each other (Table 3). The dry matter had a positive correlation to citric acid (0.37) and malic acid (0.56), while it had a negative correlation to tartaric acid (−0.46).

4. Discussion

Understanding accurate water and nitrogen balance appropriate for optimal plant production during growth is ideal, especially in baby greens, such as the baby lettuce investigated in this study. Shortage of water and inappropriate water application are among major factors limiting the production of horticultural crops. Over-fertilization can cause toxicity problems in crops if water is not applied properly [21]. Toxicity results in increased susceptibility to various diseases and disorders. Deficit irrigation increases the concentration of nutrient solution absorbed by crops throughout their development and growth stages. The concentrations of defence phytochemical compounds, including TAO and organic acids, can be associated with plant growth rates and age, as well as fertilizers and water management. Deficit water availability is considered an important abiotic stress factor affecting plant growth parameters as it influences plant growth at various levels, from the cell to the entire plant parts [22].

4.1. Chlorophyll Concentration and Plant Growth

The amount of nitrogen available for plant uptake is the factor contributing to processes, such as photosynthesis, that result in biomass production [23]. It was found that an ideal amount of nitrogen for ideal leaf chlorophyll concentration and growth is the moderate that implies avoiding toxicity or lack of nutrients to the plants. Young leaves of lettuce are more sensitive to soil nitrogen changes [24]. Although differences were non-significant, the nitrogen level higher than the recommended level but lower than the highest level was found to have the highest leaf chlorophyll in this study. This showed that increasing water and nitrogen levels does not always result in a greener crop. A non-significant difference in the contents of carotenoids and chlorophylls in fresh weights of lettuce that received the highest and the lowest nitrogen supply levels has been found previously [25]. A positive correlation between chlorophyll and dry matter content was found. It is hypothesised that the pigmentation of tender baby lettuce cannot be solely associated with the chlorophyll content. Other parameters, such as water content, concentration of other pigments, inactive maturity enzymes, as well as the immature chloroplasts, reduced the processes that result in chlorophyll production. Pigments, including chlorophyll, lutein, and β-carotene, have been found to be more augmented at advanced maturity stages, and to be more concentrated in the red pigmented cultivar of lettuce [26].
The difference in the number of leaves on the lettuce from all the N treatments did not vary significantly in the highest water supply. This was associated with the effect from the water supply level. The significant difference in the number of leaves was observed in the L1 and L2 water supply. The water content of plants is known to contribute as media in processes that results in the development of new plant tissues [27]. The dynamic responses of leaf water potential and stomata are affected by the hydraulics of inner leaf tissues, and that affects the plant carbon economy and leaf expansion growth [28]. The lowest water supply had the lower number of leaves, and the least was observed in the treatment with the highest nitrogen level in L1 and L2. This was attributed to the concentration of nitrogen having an effect either by toxicity or solution concentration where it lowered reactions that are responsible for the development of new leaves.
The leaf area was significantly decreased by changing the nitrogen level. Similar results were also observed by Moosavi [29] on maize. The observed highest leaf area in the combination of least N level and highest water supply is associated with the process of photosynthesis. Water is an input during photosynthesis [30]. The lowest concentration of nitrogen is needed during photosynthesis because it can increase the viscosity of the internal plant sap and reduce the water available for the photosynthesis. This study provided a basis for optimal levels of water and nitrogen application during the growth of baby lettuce. Optimizing this field of research is complicated by the need for well-sized attractive green leaves in the market. It was stipulated that this can be obtained by compromising the concentration of chlorophyll to improve the growth and physiological processes of the baby lettuce via water and nitrogen levels.

4.2. Total Antioxidant Compounds, Organic Acids, and Dry Matter Percentages

Increasing water supply decreased the TAO concentration of the lettuce leaf regardless of the increase in applied nitrogen level. Increasing nitrogen level increased the concentration of TAO in L2 and L3; however, it decreased in the highest nitrogen level (Figure 4). This was associated with nitrogen playing a vital role in the activity of enzymes facilitating pathways that produce antioxidant compounds. The enzyme nitrate reductase is known to be insensitive to the nitrogen levels in baby lettuce [31]. Whether nitrate reductase is present or not, nitrogen plays a role in antioxidants against reactive oxygen species and toxic ions, such as cadmium [32]. The tolerance to stress caused by nitrogen is attributed to the fact that two N3- ions can bond with three Cd2+ ions and reduce the stress effect from cadmium. The observed difference in TAO was attributed to the increase in nitrogen level improving antioxidant compounds that are non-nitrogen “consumers”, as they do not need the process of nitrogen reduction from the nitrate reductase enzyme. Fertilizer treatments can provide lettuce with substantially different nitrate contents responsible for maintaining pigmentation while strongly influencing the contents of phenolic acids and flavones that are among phytochemicals included in TAO [25]. This study showed that increasing nitrogen levels or reducing water supply levels does not always result in higher TAO that is associated with nitrate reductase enzymes. Nitrogen availability has a direct effect on the amount of available total antioxidant compounds.
Increasing the amount of supplied water increased the positive response of leaf citric acid to the nitrogen application. The highest water supply resulted in significant differences amongst nitrogen levels. Increasing both the amount of water supply and nitrogen level increased the leaf tartaric concentration of the baby lettuce. Supplying the lowest amount of water resulted in a significantly (p < 0.05) increased concentration of the leaf malic acid regardless of the nitrogen level. High concentrations of leaf citric and malic acids were also found in purslane (Portulaca oleracea) applied with a high N level by Camalle et al. [33]. The authors associated these results with the acidic NO3- ion in which N is absorbed by plants. However, we hypothesize that the nitrogen form associated with increasing leaf acidity of baby lettuce is the NH4+ instead of the NO3- stated by Camalle et al. [33]. Both forms are readily available for plant uptake. However, this hypothesis is based on the fact that NH4+ can substitute H+ ions in the leaf sap and result in an elevated level of acidity. The discovery of increasing organic acid concentrations by regulating irrigation and fertilizer amounts is significant in the horticultural industry. It was found that organic acids extracted from seeds of Cuminum cyminum L showed the most promising antifungal activity against Botrytis cinerea both in vitro and in vivo [34].
Increasing water supply significantly (p < 0.05) decreased the leaf dry matter percentages irrespective of the nitrogen level. It is known that the shoot dry mass of baby lettuce does not differ because of the different sources of nitrogen [31]. However, this study showed that the level of nitrogen also does not contribute as much as the water level. The dry matter content of baby lettuce was increased by reducing the amount of plant available water. This was correlated with a decrease in number of leaves and tartaric acid, while increasing the chlorophyll, leaf area, TAO, citric acid, and malic acid.

5. Conclusions

Reducing the amount of water supplied to baby lettuce provided a significant increase in the chlorophyll, leaf area, total antioxidant compounds, citric acid, and malic acid. The hypothesised effect that increasing nitrogen and water supply levels will increase the growth, total antioxidants, and organic acids of the baby lettuce was rejected. It was the number of leaves and the leaf tartaric acid concentration that were increased by increasing both the N levels and water supply treatments. The industrial significance of these findings could be based on the use of lower amounts of water to produce lettuce with high green pigmentation and leaf area. The produced baby lettuce will have high antioxidant compounds and organic acids, which are directly related to the high level of lettuce health value to consumers and higher defence mechanisms against pathogens. Finding agronomical ways of increasing the internal concentration of organic acids was significant since it was associated with increasing the defence mechanism of the baby lettuce. The limitation of this study was the lack of pathogenic tests as that would confirm the antimicrobial improvement through increasing internal organic acid content. Future studies will be based on in vivo assessment of susceptibility to common diseases of lettuce with high concentrations of organic acids. This finding could substitute the post-harvest sterilization with inorganic acids that is commonly performed on fresh lettuce. Studies investigating the susceptibility to common pathogens of lettuce with high concentrations of internal organic acids are recommended.

Author Contributions

K.N. conceptualized, formatted the analysis, conducted, and supervised investigations, and wrote the different drafts that yielded this final manuscript. N.J.S. reviewed the data analysis, interpretation, and the overall write-up of the manuscript. All authors have read and agreed to the published version of the manuscript.

Funding

There is no funding source for this study from funding agencies in the public, commercial, or not-for-profit sectors. This manuscript if from a research that was supported by the North-West University student’s research funds.

Institutional Review Board Statement

Not applicable.

Informed Consent Statement

Not applicable.

Data Availability Statement

The data presented in this study is available on request from the corresponding author. The data is not publicly available due to academic ethics restriction in sharing raw data from dissertations of students.

Acknowledgments

Authors acknowledge the North-West University and the consented honours students that were involved in the sub-projects that resulted in the combination of this manuscript: Motlalipula Aobeng and Rethabile Modise.

Conflicts of Interest

The authors declare that there is no conflict of interest in this work.

References

  1. Kim, M.J.; Moon, Y.; Tou, J.C.; Mou, B.; Waterland, N.L. Nutritional value, bioactive compounds and health benefits of lettuce (Lactuca sativa L.). J. Food Compos. Anal. 2016, 49, 19–34. [Google Scholar] [CrossRef]
  2. Dimitrov, I.; Stancheva, I.; Mitova, J.; Atanasova, E. Comparative study of some quality parameters of lettuce in dependence on way of cultivation. Bulg. J. Agric. Sci. 2006, 12, 421. [Google Scholar]
  3. Abdullah, M.; Jamil, R.T.; Attia, F.N. Vitamin C (Ascorbic Acid). StatPearls. 2020. Available online: https://www.ncbi.nlm.nih.gov/books/NBK499877/ (accessed on 13 February 2021).
  4. Castañer, M.; Gil, M.I.; Artés, F. Organic acids as browning inhibitors on harvested “Baby” lettuce and endive. Z. Lebensm. und-Forsch. A 1997, 205, 375–379. [Google Scholar] [CrossRef]
  5. Wang, J.; Tao, D.; Liu, Y.; Han, S.; Zheng, F.; Wu, Z. Comparison of generally recognized as safe organic acids for disinfecting fresh-cut lettuce. BioRxiv 2018. [Google Scholar] [CrossRef]
  6. Wang, J.; Tao, D.; Wang, S.; Li, C.; Li, Y.; Zheng, F.; Wu, Z. Disinfection of lettuce using organic acids: An ecological analysis using 16S rRNA sequencing. RSC Adv. 2019, 9, 17514–17520. [Google Scholar] [CrossRef] [Green Version]
  7. Akbas, M.Y.; Ölmez, H. Inactivation of Escherichia coli and Listeria monocytogenes on iceberg lettuce by dip wash treatments with organic acids. Lett. Appl. Microbiol. 2007, 44, 619–624. [Google Scholar] [CrossRef] [PubMed]
  8. Shams, M.; Yildirim, E.; Ekinci, M.; Turan, M.; Dursun, A.; Parlakova, F.; Kul, R. Exogenously applied glycine betaine regulates some chemical characteristics and antioxidative defence systems in lettuce under salt stress. Hortic. Environ. Biotechnol. 2016, 57, 225–231. [Google Scholar] [CrossRef]
  9. Doores, S.; Davidson, P.M.; Sofos, J.N.; Branen, A.L. Organic acids. Food Sci. Technol. 2005, 145, 91. [Google Scholar]
  10. Booth, I.R. Regulation of cytoplasmic pH in bacteria. Microbiol. Rev. 1985, 49, 359. [Google Scholar] [CrossRef]
  11. Huang, Y.; Chen, H. Effect of organic acids, hydrogen peroxide and mild heat on inactivation of Escherichia coli O157:H7 on baby spinach. Food Control. 2011, 22, 1178–1183. [Google Scholar] [CrossRef]
  12. López, A.; Javier, G.A.; Fenoll, J.; Hellín, P.; Flores, P. Chemical composition and antioxidant capacity of lettuce: Comparative study of regular-sized (Romaine) and baby-sized (Little Gem and Mini Romaine) types. J. Food Compos. Anal. 2014, 33, 39–48. [Google Scholar] [CrossRef]
  13. Limantara, L.; Dettling, M.; Indrawati, R.; Indriatmoko, I.; Brotosudarmo, T. Analysis on the Chlorophyll Content of Commercial Green Leafy Vegetables. Procedia Chem. 2015, 14, 225–231. [Google Scholar] [CrossRef] [Green Version]
  14. Cano, A.; Arnao, M.B. Hydrophilic and Lipophilic Antioxidant Activity in Different Leaves of Three Lettuce Varieties. Int. J. Food Prop. 2005, 8, 521–528. [Google Scholar] [CrossRef]
  15. Adu, M.O.; Yawson, D.O.; Abano, E.E.; Asare, P.A.; Armah, F.A.; Opoku, E.K. Does water-saving irrigation improve the quality of fruits and vegetables? Evidence from meta-analysis. Irrig. Sci. 2019, 37, 669–690. [Google Scholar] [CrossRef]
  16. Raun, W.R.; Dhillon, J.; Aula, L.; Eickhoff, E.; Weymeyer, G.; Figueirdeo, B.; Lynch, T.; Omara, P.; Nambi, E.; Oyebiyi, F.; et al. Unpredictable Nature of Environment on Nitrogen Supply and Demand. Agron. J. 2019, 111, 2786–2791. [Google Scholar] [CrossRef] [Green Version]
  17. Dhakal, C.; Lange, K.; Parajulee, M.N.; Segarra, E. Dynamic Optimization of Nitrogen in Plateau Cotton Yield Functions with Nitrogen Carryover Considerations. J. Agric. Appl. Econ. 2019, 51, 385–401. [Google Scholar] [CrossRef] [Green Version]
  18. Ncama, K.; Magwaza, L.S.; Tesfay, S.Z.; Mditshwa, A.; Mbili, N.C. In-field application of portable NIR to assess’ Valencia’ orange fruit maturity. In Proceedings of the XXX International Horticultural Congress IHC2018: International Symposium on Strategies and Technologies to Maintain Quality, Istanbul, Turkey, 12–16 August 2018; Volume 1275, pp. 61–68. [Google Scholar]
  19. Aliyu, A.B.; Ibrahim, M.A.; Musa, A.M.; Musa, A.O.; Kiplimo, J.J.; Oyewale, A.O. Free radical scavenging and total antioxidant capacity of root extracts of Anchomanes difformis Engl. (Araceae). Acta Pol. Pharm. 2013, 70, 115–121. [Google Scholar]
  20. DAFF. Production Guidelines for Lettuce. Department of Agriculture Fisheries and Forestry, Republic of South Africa. 2020. Available online: https://www.nda.agric.za/docs/Brochures/ProdGuideLettuce.pdf (accessed on 6 July 2021).
  21. Montemurro, F. Are organic n fertilizing strategies able to improve lettuce yield, use of nitrogen and n status? J. Plant Nutr. 2010, 33, 1980–1997. [Google Scholar] [CrossRef]
  22. Colom, M.; Vazzana, C. Drought stress effects on three cultivars of Eragrostis curvula: Photosynthesis and water relations. Plant Growth Regul. 2001, 34, 195–202. [Google Scholar] [CrossRef]
  23. Mu, X.; Chen, Y. The physiological response of photosynthesis to nitrogen deficiency. Plant Physiol. Biochem. 2021, 158, 76–82. [Google Scholar] [CrossRef]
  24. Karam, F.; Mounzer, O.; Sarkis, F.; Lahoud, R. Yield and nitrogen recovery of lettuce under different irrigation regimes. J. Appl. Hortic. 2002, 4, 70–76. [Google Scholar] [CrossRef]
  25. Qadir, O.; Siervo, M.; Seal, C.J.; Brandt, K. Manipulation of Contents of Nitrate, Phenolic Acids, Chlorophylls, and Carotenoids in Lettuce (Lactuca sativa L.) via Contrasting Responses to Nitrogen Fertilizer When Grown in a Controlled Environment. J. Agric. Food Chem. 2017, 65, 10003–10010. [Google Scholar] [CrossRef] [PubMed] [Green Version]
  26. El-Nakhel, C.; Pannico, A.; Graziani, G.; Kyriacou, M.C.; Giordano, M.; Ritieni, A.; De Pascale, S.; Rouphael, Y. Variation in macronutrient content, phytochemical constitution and in vitro antioxidant capacity of green and red butter-head lettuce dictated by different developmental stages of harvest maturity. Antioxidants 2020, 9, 300. [Google Scholar] [CrossRef] [Green Version]
  27. Ncama, K.; Aremu, O.A.; Sithole, N.J. Plant Adaptation to Environmental Stress: Drought, Chilling, Heat, and Salinity. In Environment and Climate-Smart Food Production; Springer: Singapore, 2021; pp. 151–179. [Google Scholar]
  28. Prado, K.; Maurel, C. Regulation of leaf hydraulics: From molecular to whole plant levels. Front. Plant Sci. 2013, 4, 255. [Google Scholar] [CrossRef] [PubMed] [Green Version]
  29. Moosavi, S.G. The effect of water deficit stress and nitrogen fertilizer levels on morphology traits, yield and leaf area index in maize. Pak. J. Bot. 2012, 44, 1351–1355. [Google Scholar]
  30. Wright, I.J.; Reich, P.B.; Westoby, M. Least-cost input mixtures of water and nitrogen for photosynthesis. Am. Nat. 2003, 161, 98–111. [Google Scholar] [CrossRef]
  31. Rocha, D.C.; da Silva, B.F.I.; Moreira dos Santos, J.M.; Tavares, D.S.; Pauletti, V.; Gomes, M.P. Do nitrogen sources and molybdenum affect the nutritional quality and nitrate concentrations of hydroponic baby leaf lettuce? J. Food Sci. 2020, 85, 1605–1612. [Google Scholar] [CrossRef]
  32. Zhang, F.; Wan, X.; Zheng, Y.; Sun, L.; Chen, Q.; Zhu, X.; Guo, Y.; Liu, M. Effects of nitrogen on the activity of antioxidant enzymes and gene expression in leaves of Populus plants subjected to cadmium stress. J. Plant Interact. 2014, 9, 599–609. [Google Scholar] [CrossRef]
  33. Camalle, M.; Standing, D.; Jitan, M.; Muhaisen, R.; Bader, N.; Bsoul, M.; Ventura, Y.; Soltabayeva, A.; Sagi, M. Effect of Salinity and Nitrogen Sources on the Leaf Quality, Biomass, and Metabolic Responses of Two Ecotypes of Portulaca oleracea. Agronomy 2020, 10, 656. [Google Scholar] [CrossRef]
  34. Wang, Y.; Qiao, Y.; Zhang, M.; Ma, Z.; Xue, Y.; Mi, Q.; Wang, A.; Feng, J. Potential value of small-molecule organic acids for the control of postharvest gray mold caused by Botrytis cinerea. Pestic. Biochem. Physiol. 2021, 177, 104884. [Google Scholar] [CrossRef]
Figure 1. The effect of nitrogen level (0.10, 0.14, 0.18, and 0.22 g) and water supply at L1-300 mL (a), L2-600 mL (b), and L3-900 mL (c) on chlorophyll concentration of baby lettuces. Bars labelled with similar letters in each graph show no significant difference under 95% confidence interval.
Agronomy 12 00614 g001aAgronomy 12 00614 g001b
Figure 2. The effect of nitrogen level (0.10, 0.14, 0.18, and 0.22 g) and water supply at L1-300 mL (a), L2-600 mL (b), and L3-900 mL (c) on the development in the number of baby lettuce leaves. Bars labelled with similar letters in each graph show no significant difference under 95% confidence interval.
Agronomy 12 00614 g002aAgronomy 12 00614 g002b
Figure 3. The effect of nitrogen level (0.10, 0.14, 0.18, and 0.22 g) and water supply at L1-300 mL (a), L2-600 mL (b), and L3-900 mL (c) on the development in leaf area of baby lettuces. Bars labelled with similar letters in each graph show no significant difference under 95% confidence interval.
Agronomy 12 00614 g003
Figure 4. The effects of nitrogen (N) level and water supply (W) on the concentrations of total antioxidant compounds in baby lettuce leaves. Bars labelled with similar letters show no significant difference under 95% confidence interval.
Agronomy 12 00614 g004
Figure 5. The effect of nitrogen (N) level and water supply (W) on the concentrations of citric acid in leaves of baby lettuce. Bars labelled with similar letters show no significant difference under 95% confidence interval.
Agronomy 12 00614 g005
Figure 6. The effect of nitrogen level (N) and water supply (W) on concentration of tartaric acid in baby lettuce leaves. Bars labelled with similar letters show no significant difference under 95% confidence interval.
Agronomy 12 00614 g006
Figure 7. The effect of nitrogen (N) level and water supply (W) on concentration of malic acid in baby lettuce leaves. Bars labelled with similar letters show no significant difference under 95% confidence interval.
Agronomy 12 00614 g007
Figure 8. The effect of nitrogen (N) level and water supply (W) on the dry matter content of baby lettuce leaves. Bars labelled with similar letters show no significant difference under 95% confidence interval.
Agronomy 12 00614 g008
Table 1. The statistical significance of the differences caused by nitrogen and water levels, as well as their combinations, to baby lettuce chlorophyll and growth parameters.
ParameterFactor of VariabilityFactor Effectp-Value
Chlorophyll concentration N0.343
W+0.036
N*W0.049
Leaf numberN+0.009
W0.006
N*W+<0.001
Leaf areaN0.007
W+0.154
N*W+<0.001
N—nitrogen level; W—water supply; + means increasing a factor increased a parameter; − means increasing a factor decreased a parameter.
Table 2. The statistical significance of the differences caused by nitrogen and water levels as well as their combinations to baby lettuce TAO, organic acids, and dry matter percentages.
ParameterFactor of VariabilityFactor Effectp-Value
Total antioxidants (mg/g)N+<0.001
W<0.001
N*W+0.001
Citric acid %N+<0.001
W<0.001
N*W<0.001
Tartaric acid %N0.196
W+<0.001
N*W+0.057
Malic acid %N0.166
W<0.001
N*W0.353
Dry matter %N<0.001
W<0.001
N*W0.004
N—nitrogen level; W—water supply; + means increasing a factor increased a parameter; − means increasing a factor decreased a parameter.
Table 3. The correlations of chlorophyll, growth parameters, total antioxidant compounds, organic acids, and the dry matter percentages of baby lettuce.
Chlorophyll (µg/g FM)No. of LeavesLeaf Area (cm2)TAO (mg/g FM)Citric Acid %Tartaric Acid %Malic Acid %Dry Matter %
Chlorophyll (µg/g FM)1
No. of leaves0.151
Leaf area (cm2)0.580.111
TAO (mg/g FM)−0.020.20−0.181
Citric acid (%)−0.19−0.31−0.140.111
Tartaric acid (%)−0.030.030.01−0.130.421
Malic acid (%)−0.11−0.23−0.200.220.740.101
Dry matter (%)0.10−0.260.030.090.37−0.460.561
TAO—total antioxidant compounds; FM—fresh mass.
Publisher’s Note: MDPI stays neutral with regard to jurisdictional claims in published maps and institutional affiliations.

