Article

Towards Heat Tolerant Runner Bean (Phaseolus coccineus L.) by Utilizing Plant Genetic Resources

1
AGES Austrian Agency for Health and Food Safety, Division for Food Security, Institute for Seed and Propagating Material, Phytosanitary Service and Apiculture, Spargelfeldstraße 191, 1220 Vienna, Austria
2
AIT Austrian Institute of Technology GmbH, Center for Health & Bioresources, Konrad-Lorenz-Str. 24, 3430 Tulln, Austria
3
Saatzucht Gleisdorf Ges.mbH, Am Tieberhof 33, 8200 Gleisdorf, Austria
*
Author to whom correspondence should be addressed.
These authors contributed equally to this work.
Agronomy 2022, 12(3), 612; https://doi.org/10.3390/agronomy12030612
Submission received: 1 February 2022 / Revised: 21 February 2022 / Accepted: 24 February 2022 / Published: 28 February 2022
(This article belongs to the Special Issue Utilizing Genetic Resources for Agronomic Traits Improvement)

Abstract

:
Climate change and its extreme heat waves affect agricultural productivity worldwide. In the cultivation of beans, heat stress during the reproductive phase may lead to complete crop failures, as recently was documented for runner bean (Phaseolus coccineus L.) in Austria. Developing better adapted varieties utilizing plant genetic resources is of utmost importance in such conditions. Our study aimed at identifying heat tolerant accessions and developing associated genetic markers for their application in marker assisted selection. For this, we assessed the genetic and phenotypic characteristics of 113 runner bean genotypes (101 of Austrian origin) grown in the glasshouse under heat stress conditions during two years. In particular three accessions showed a higher yield than the reference variety Bonela under heat stress in both years. The phenotypic data complemented with genetic data based on 1190 SNPs revealed high performing pure genotypes that may serve as good candidates to be included in breeding programs. In addition, the genome-wide association analysis resulted in 18 high quality SNPs that were subsequently used for the calculation of an estimated heat tolerance using the MassARRAY® system. Overall, our study represents first steps towards breeding heat tolerant runner bean to withstand global warming.

1. Introduction

Runner bean (Phaseolus coccineus L.) is one out of five domesticated Phaseolus species. It is considered the economically third-most important bean species worldwide, after common bean (P. vulgaris L.) and lime bean (P. lunatus L.) [1].
Although 61 runner bean entries are registered in the EU Plant variety database [2], local varieties and landraces play a major role in some European countries [3,4,5,6,7]. In Austria, three registered varieties are mainly cultivated, whereby two of them, Bonela and Melange, were bred in Styria utilizing local landraces. The third, Ober-Wolfsbacher Feuerbohne, is registered as “developed for growing under particular conditions” and is sold for growing in home gardens. The diverse and very local breeding and cultivation history is reflected by 4346 runner bean accessions that are currently being stored in ex situ collections worldwide [8], whereby 134 accessions are kept in Austria, out of which 122 are of Austrian origin [9].
In Austria, the consumption of runner bean becomes more popular, and in August 2016, “Steirische Käferbohne (PDO)” was entered in the register of protected designations of origin (PDO) and protected geographical indications (PGI) [10]. “Steirische Käferbohne” is a denomination for climbing runner bean cultivars with purple-black to brown-beige speckled seeds (complying with the Austrian varieties Bonela and Melange) that have been grown locally in Styria since the 19th century. In addition, the cultivated area of runner bean per year has increased considerably since 2010, from an average of 120 ha from 1995–2009 to an average of 632 ha from 2010–2019 [11]. In recent years, during hot and dry summers, major crop losses have occurred in the production of runner bean in Styria. Especially the hot summers of 2003, 2013 and 2015 caused almost a total crop shortfall resulting in a limited production of 297 kg ha−1, 130 kg ha−1 and 139 kg ha−1, respectively, which is only about a tenth of the usual yield potential of runner bean in intercropping systems in Austria [11].
It is well known that heat stress is a major bean production constraint causing significant reduction in yield and quality. Shedding of flowers and pods, pollen sterility, and pod and seed set reduction have been described when the temperature exceeds 32 °C in common bean [12,13,14,15]. Similar effects have been observed in runner bean production practice. However, breeding for tolerance against the consequences of a changing climate is complex and requires genetic diversity, either from wild or domesticated species [16]. National and international gene banks and germplasm research centers are valuable sources for breeders looking for tolerance traits to tackle climate change-related stresses [16,17]. Characterization of plant genetic resources (PGRs) using state-of-the-art genomic and phenomic methods is needed to exploit this wealth of diversity [18,19,20].
Next generation sequencing (NGS) technologies are important elements of modern plant breeding programs but also pivotal to discovering the genetic diversity of PGRs and selecting genotypes with desired traits [21,22,23]. With regard to runner bean, studies so far have mainly focused on the elucidation of the genetic diversity and evolutionary history of this species, using mostly single sequence repeat (SSR) and inter simple sequence repeat (ISSR) markers [5,24,25,26]. No research has been performed so far linking the observed genetic variability of this species to relevant agronomic traits based on state-of-the-art methods, as has been performed for the closely related common bean through genome-wide association studies (GWAS) [21,27,28]. These examples highlight the importance of the combination of NGS data with GWAS to characterize genetic markers associated to (agronomic) traits of relevance, which can be used in selection and breeding programs, as reviewed in [29]. The downstream application and validation of such markers is often performed at a smaller scale, e.g., using SNP-based genotyping platforms such as the MassARRAY® system [30], which has been successfully applied in plants for species identification and diversity analyses [31] as well as the validation of SNP markers [32].
In this study, the genetic and phenotypic characteristics of runner bean PGRs from the Austrian gene bank, including selected varieties and breeding lines were assessed under heat stress conditions in two consecutive glasshouse trials. The aim was to support the breeding of heat tolerant runner bean varieties by identifying heat tolerant accessions and developing molecular markers for the evaluation of heat tolerance, since the availability of adapted varieties is crucially important for sustaining the cultivation of runner bean under changing climatic conditions.

2. Materials and Methods
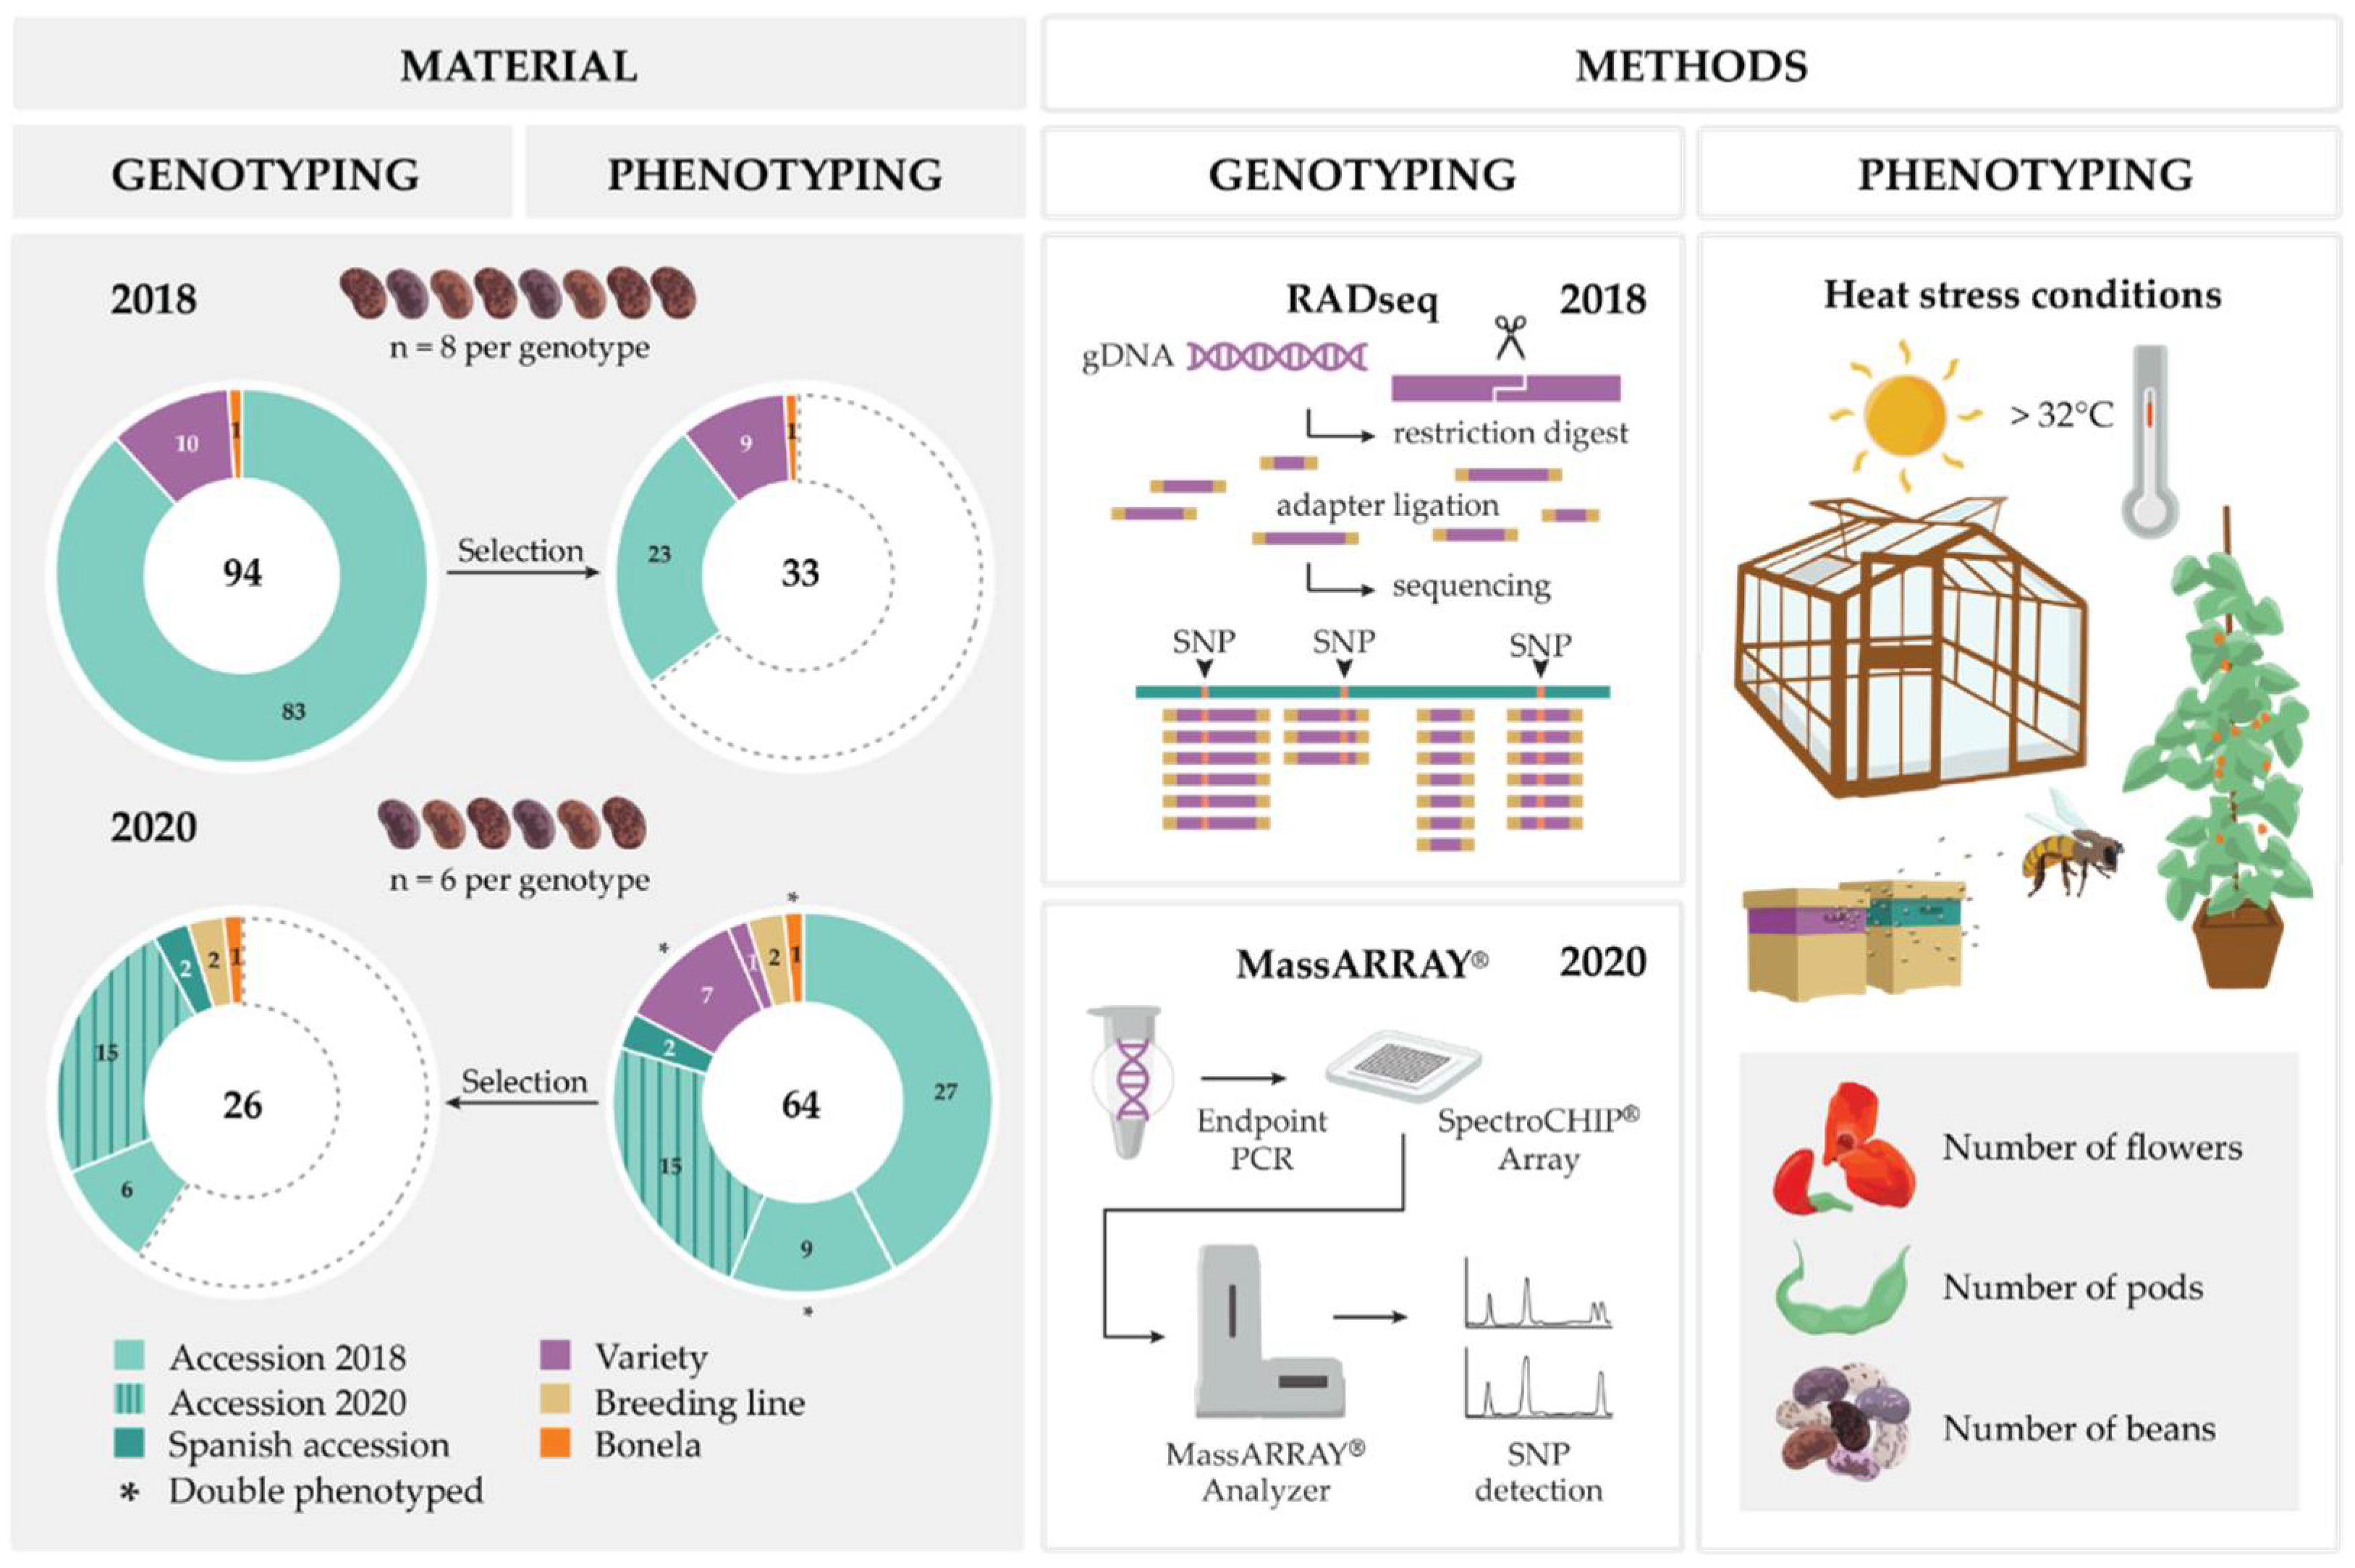
2.1. Plant Material

In total, 113 runner bean (Phaseolus coccineus L.) genotypes were selected to be included in this study. The term genotype is used in the following to cover accessions/landraces, varieties and breeding lines used in this research. Most genotypes (n = 99) were received from the AGES gene bank, Linz, Austria (www.genbank.at, accessed on 24 February 2022), with most of them being landraces (Table S1). In addition, seven varieties were obtained from the Institute of Special Crops, Agricultural Research Center Styria, Wies, Austria, and three varieties from Naktuinbouw (the Netherlands Inspection Service for Horticulture; www.naktuinbouw.com, accessed on 24 February 2022), Roelofarendsveen, the Netherlands. Two breeding lines were included that were received from the Austrian plant breeding company Saatzucht Gleisdorf GmbH, Gleisdorf, Austria (www.saatzuchtgleisdorf.at, accessed on 24 February 2022), and two accessions were kindly provided by the Spanish National Research Council (CSIC; https://www.csic.es/en/csic, accessed on 24 February 2022). Most of the genotypes are of Austrian origin (n = 101), but also genotypes from the Netherlands (n = 3), Spain (n = 2), Germany, Portugal, Hungary, Italy and China (each n = 1), and two with unknown origin were included.

2.2. Trial Design

An overview of the trial design is given in Figure 1. Briefly summarized, selected plant material was phenotyped and genotyped in two trial years, 2018 and 2020. From a total of 113 genotypes, 80 were characterized both genetically and phenotypically, while 33 genotypes were only genetically characterized (cf. Table S1). While 94 genotypes were genotyped by sequencing in 2018, 26 were genotyped in 2020 using the MassARRAY® SNP genotyping platform. Out of these, as indicated by the same color (non-dashed light green), six accessions in addition to Bonela were genotyped with both methods. A selection of 33 genotypes was phenotyped in 2018, and 64 in 2020, while 17 were phenotyped in both years. Genotype 88 (Bonela) was the chosen reference in all analyses and years, as it is a commonly used and well-established Styrian runner bean variety that has been registered in 1988 [33].

2.3. Glasshouse Trials and Phenotyping

Selected runner bean genetic material was used in two individual heat stress glasshouse trials, 33 genotypes in 2018 and 64 genotypes in 2020 (Figure 1). In the first trial, up to 15 seeds per genotype were selected and sown on 12 March 2018. Eight individuals from each genotype were selected, transplanted into 8-L Kick/Brauckmann-pots (Stoma, Germany), and placed in groups per genotype in the glasshouse. Floradur Seed S 0,5 (Floragard, Germany) was used as substrate (pH value of 5.6, 0.5 g L−1 salt content, 90 mg L−1 N-nitrogen, 50 mg L−1 P2O5-phosphate, 100 mg L−1 K2O-potassium). In total, 264 individuals were grown in the glasshouse. Plants were irrigated daily to prevent drought stress. Pollination of the runner beans was guaranteed by placing a colony of honey bees (Apis mellifera L.) in the glasshouse.
In 2018, heat stress was applied 55 days after sowing. Temperature in the glasshouse was gradually increased over a period of three days until a daily maximum temperature of 35 °C was reached, which was maintained during 11 a.m. until 3 p.m. The heat stress regime was applied daily over a period of 29 days (cf. Figure S1).
In 2020, some slight alterations were made: Sowing of the seeds was performed on 18 June 2020. Since the 2018 sequencing results had shown that reducing the numbers of phenotyped individuals did not cause a notable loss of genetic diversity, six individuals per genotype were selected. Due to a low germination rate, only three individuals of one Spanish accession (genotype 122) could be selected, leading to a total number of 381 plants that were placed fully randomized in the glasshouse. As a result of the significantly later cultivation compared to 2018, temperatures in the glasshouse continuously reached >32 °C (cf. Figure S2), and no artificial heat stress was applied.
In both trials, the number of flowers and the number of formed pods (length > 5 cm) on each individual plant were counted three times a week (cf. Figures S1 and S2). In 2020, the number of mini pods (<5 cm) per individual was additionally documented. Once matured, all counted pods (>5 cm) were harvested and dried (48 h at 30 °C). All formed beans were extracted, counted and weighed, while stunted beans were discarded before. The following phenotypic traits were assessed for each individual and summarized on a genotype level: Sum of all flowers counted over the course of the trial (Total_NoF), highest number of flowers observed on one day over the course of the trial (Total_MaxF), final number of pods (>5 cm) harvested at the end of the trial (Final_NoP), highest number of pods (>5 cm) observed on one day over the course of the trial (Total_MaxP), total number of beans harvested at the end of the trial (Total_NoB). The weight of all beans harvested for all individuals of one genotype was determined (W_B). From this data, the average number of beans per pod (>5 cm) harvested at the end of the trial (NoB_per_P) and the average weight per bean harvested at the end of the trial (W_per_B) were calculated. In 2020, four additional traits were recorded for each genotype: Percentage of individuals of one genotype that flower (%_F_Ind), final number of mini pods (<5 cm) harvested at the end of the trial (Final_NoMP), highest number of mini pods (<5 cm) observed on one day over the course of the trial (<5 cm) (Total_MaxMP) and percentage of individuals of one genotype that had formed pods (>5 cm) (%_P_Ind).

2.4. Leaf Sampling and DNA Extraction

In both trial years (2018 and 2020, cf. Figure 1), plant material was sampled for DNA extraction. In case of young plantlets, a leaf was collected, and in case of adult plants, a young shoot tip including 1–3 leaves was collected per individual. The plant material was immediately cooled and further frozen to −20 °C.
Genomic DNA was isolated using a protocol adjusted for robotics-based high-throughput processing based on a cetyltrimethylammonium bromide (CTAB) method as described in [34], with ~80 mg of freeze-dried, powdered leaf tissue as input material per sample. The cleaned DNA pellet was dissolved in 100 μL of double-autoclaved water containing 5 μL of RNase (10 mg mL−1). The extracted DNA was quality checked on a standard agarose gel and stored at −20 °C until further processing. A backup of the genomic DNA is deposited at the Repository Centre at the AIT Austrian Institute of Technology (www.dnabank.at, accessed on 24 February 2022).

2.5. RAD Sequencing and Data Analysis

DNA of 94 chosen genotypes (cf. Figure 1) was sent for library preparation and restriction site-associated DNA sequencing (RADseq) to Floragenex, Inc., Beaverton, Oregon, USA. Each genotype was represented by eight individuals, except for the genotype 84, where sample 84_7 was not included, due to a repeatedly insufficient DNA quality. Overall, 751 samples were processed into RAD libraries similar to the method in [35] by using PstI as restriction enzyme and ~200 ng of genomic DNA as input.
Each amplified library was size selected (either 200–400 bp or 300–500 bp) through the gel extraction method using MinElute Gel Extraction Kit (Quiagen) and quantified with a Qubit fluorometer and run on an Agilent Bioanalyzer with the High Sensitivity kit to determine size distribution. The average library sizes were as follows: 96-well plate 1: 508 bp, plate 2: 530 bp, plate 3: 534 bp, plate 4: 532 bp, plate 5: 431 bp, plate 6: 442 bp, plate 7: 449 bp and plate 8: 429 bp. The libraries were diluted to 10 nM, and then libraries with unique i7 indices were pooled. This resulted in two pools, one containing plates 1–4, and another containing plates 5–8. 1 × 100 bp single end sequencing was performed on the HighSeq 4000 at the University of Oregon GC3F.
The received already quality-filtered RAD sequencing data were further demultiplexed using fastq-multx [36] and technical replicates were merged. Resulting fastq files were quality checked using FastQC [37] in combination with MultiQC [38] and have been made available in NCBI’s SRA database, BioProject ID PRJNA783867. Further data analysis was performed based on the de novo mapping approach using ipyrad v.0.9.56 [39] with the following amended parameter settings: phred_Qscore_offset = 43, mindepth_majrule = 5, min_samples_locus = 593 (resembling to 80% of the entire sample set) and max_Indels_locus = 5.
RAD sequencing resulted in a total number of reads ranging from 244,009 (sample 06_7) up to 15,778,822 (sample 87_4). Towards the establishment of the final alignment dataset, the following samples were excluded due to their comparably low number of loci recovered: 26_3, 28_8, 30_3, 36_2, 64_5, 64_6 and 92_1. Further, the samples 12_5, 14_8 and 75_7 did not pass the ipyrad-specific filtering steps. After this filtering, 741 individuals were kept with retained loci/sample ranging from 616 (sample 06_7) to 4171 (sample 15_6). Further read statistics are given in Table S2. Overall, after ipyrad filtering steps, 4175 RAD loci harboring 29,271 SNPs were retained (Table S3). The final assembly dataset (vcf format) was translated into a 012-matrix using VCFtools [40] without any filter settings and further converted into the CSV format using a custom python script. Using the R package adegenet version 2.1.4 [41], high quality SNPs were selected by filtering for SNPs with less than 20% missing data and for polymorphism (MAF > 1%). To avoid linkage disequilibrium, one SNP per RAD tag was selected. The resulting dataset with 1190 SNPs was used for GWAS as well as for phylogenetic analysis and the calculation of the ancestry matrix.

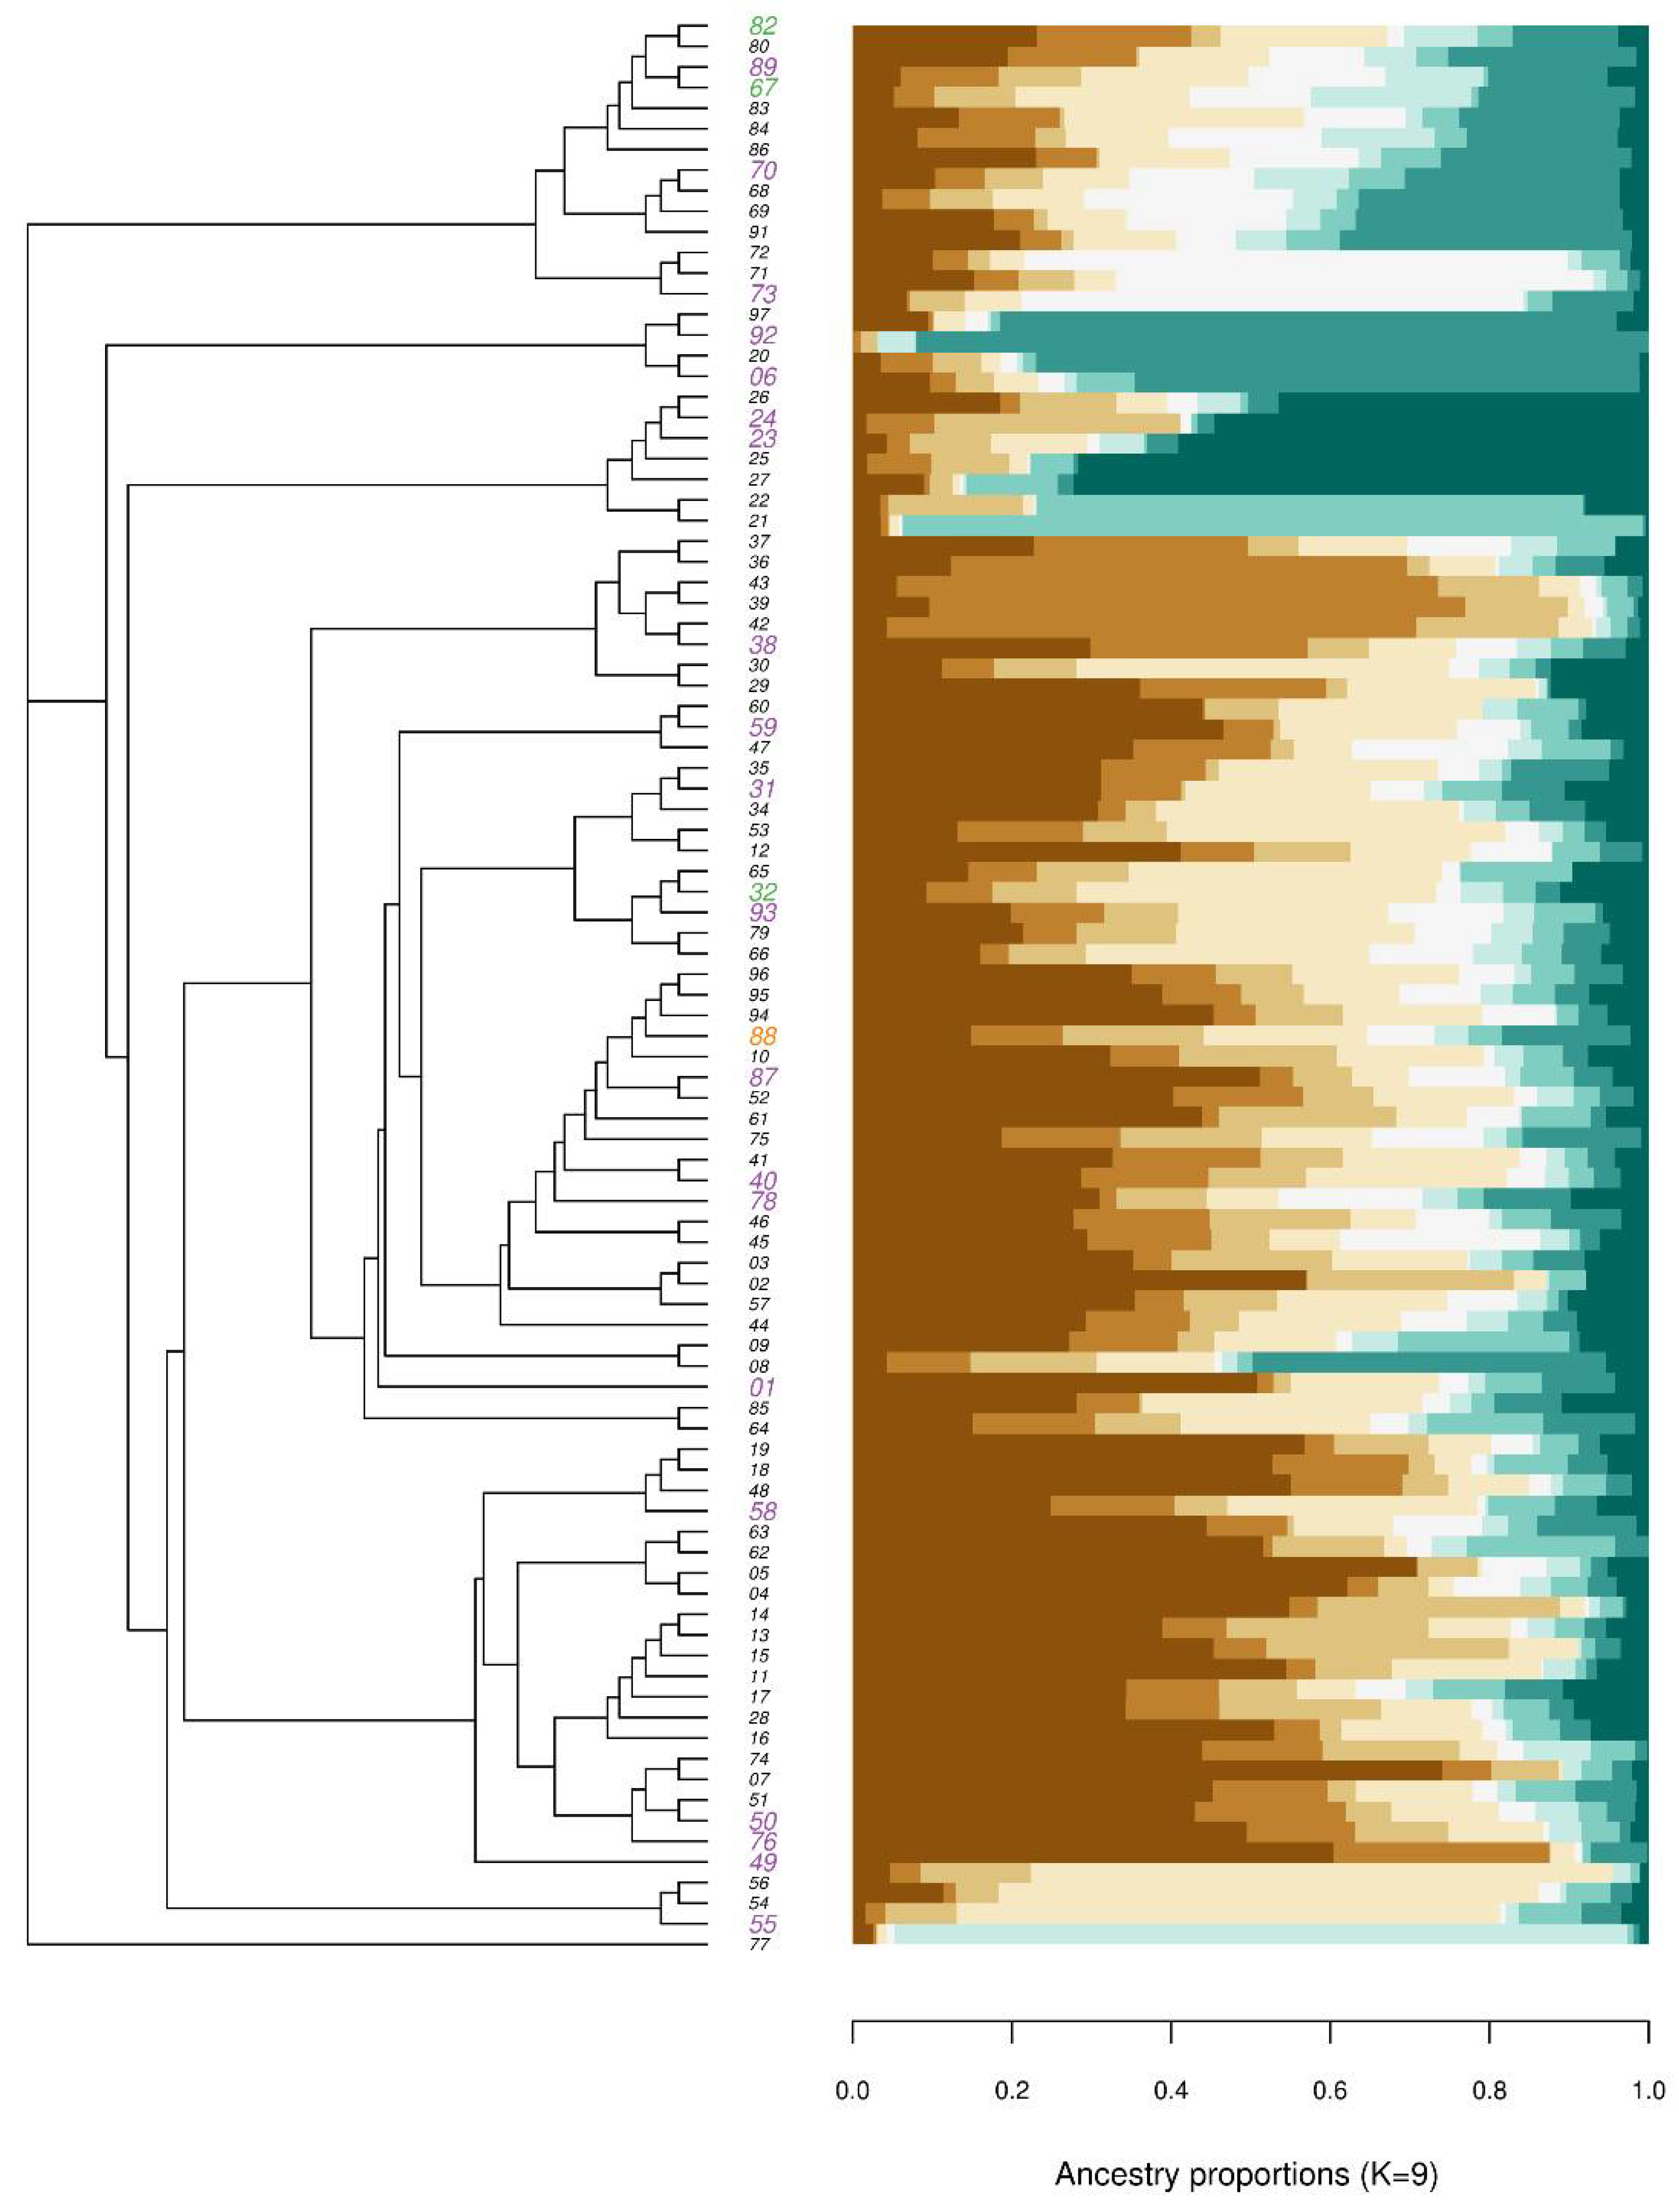
2.6. Phylogeny and Ancestry Matrix

Calculation of the phylogenetic relationship as well as the ancestry matrix was based on the filtered RAD dataset containing 1190 SNPs covering 741 individual samples of 94 genotypes (see above). A distance matrix on the genotype level was calculated using the R package adegenet version 2.1.4 [41], which further was used for a hierarchical cluster analysis with the function hclust using the ward.D2 method. For visualizing and rooting the phylogenetic tree the R package ape version 5.5 [42] was used. With the R package poppr version 2.9.3 [43], a dendrogram with bootstrap support based on Nei’s genetic distance was calculated on the individual level. Calculation of the ancestry matrix was performed using the snmf function of the R package LEA version 2.4.0 [44]. The optimal number of clusters (K) to be represented was estimated through the calculation of the minimal cross-entropy for K = 1:15, whereby K = 9 was retained.

2.7. Genome-Wide Association Studies (GWAS)

Association analysis for heat tolerant traits was performed with individuals and genotypes that were genotyped by RADseq in 2018 and phenotyped in 2018 and/or in 2020 (cf. Figure 1). Three different datasets were used. For GWAS I, data of 260 plants that were genotyped and phenotyped individually in 2018 were used. The data of the individual 19_5 that only formed stunted, sterile flowers as well as the data of three individuals with low quality genotypic data (12_5, 84_7 and 92_1; as described above) were excluded before the GWAS. In addition, data of 33 accessions that were genotyped and phenotyped in 2018 (trial 2018) as well as 45 genotypes that were genotyped in 2018 and phenotyped in 2020 (trial 2020) were analyzed on the genotype-level (GWAS II). In order to develop a common genotype for the latter two datasets the most common sequence of the eight individuals of each genotype was identified. Loci, for which no clear result could be obtained, were assigned “missing data (NA)”. Phenotypic traits that were included in the analysis are described above. Based on the 1190 high-quality SNPs, a GWAS was performed for each of the phenotypic traits individually by latent factor mixed model (lfmm) using the R package LEA version 3.0.0 [44]. To determine the number of latent factors (K) the sparse nonnegative matrix factorization (snmf) function and Tracy-Widom test were used. Missing data were imputed by using the snmf function. Each run was repeated five times using the following parameters: K = 3, 10,000 iterations and 5000 burnin period. The Benjamini–Hochberg procedure was applied and returned candidates with an expected false discovery rate (FDR) of 0.01 [45]. The SNPs that were significantly associated to phenotypic traits in both trial 2018 and trial 2020 were summarized (GWAS II).

2.8. MassARRAY® Design and Genotyping

The candidate SNPs resulting from the GWAS were complemented with a further 10 SNPs that have already been described to be associated to heat stress tolerance in common bean (cf. Table S4) [27,28]. For their validation and to establish a SNP panel to estimate the heat tolerance for runner bean, the targeted SNP genotyping approach was applied using Agena’s MassARRAY® system [30]. The design of the final MassARRAY® Multiplex Assays was performed in two steps (designs) using Design Suite V2.0 (Agena Bioscience) according to the manufacturers’ protocol.
Design 1: After extending the RAD tag sequence with the sequence of the best blast hit using NCBI’s BLASTn, whereby RAD tags with no hit were excluded, the in silico design of the Multiplex Assays resulted in five plexes of which the first four were chosen for further genotyping. Plex 1 covered 27 SNPs, plex 2 also contained 27, plex 3 20 and plex 4 covered ten SNPs. Plex 5 contained only two SNPs (RAD_3146_19 and S1_205075622) and was not included in the subsequent genotyping.
Design 2: Due to the failure of some SNPs in the genotyping based on Design 1 (no calls, monomorphic calls, calls in the negative control), 28 selected SNPs were redesigned. This time, the RAD tag sequence was extended by the best blast hit using BLASTn in the Phytozome database with the restriction to Fabidae. The subsequent in silico design comprised three plexes of which the first two with 17 and 9 SNPs, respectively, were chosen. Plex 3 contained only one SNP (RAD_3281_19) and was omitted. During the in silico design, the SNP RAD_3773_1 was marked as “rejected” in all Design 2 versions and was therefore not present in any of the plexes.
The forward, reverse and extend primers were ordered unmodified from Sigma-Aldrich Handels GmbH (Vienna, Austria) and the dilution and extend primer adjustment was optimized for each plex following the manufacturer’s instructions. Genotyping was then performed using 1:5 diluted genomic DNA from 26 genotypes (six individuals per genotype, minus three which did not germinate, summing up to a total of 153 samples; cf. Figure 1) where the mass of the extend primer was determined by the MassARRAY® MALDI-TOF mass spectrometer at the AIT Austrian Institute of Technology according to the manufacturers protocols. The genotype calls were evaluated and, where necessary, manually adjusted through MassARRAY® TYPER 4.0 software.

2.9. SNP Selection and Calculation of Heat Tolerance

The resulting SNPs were further filtered for polymorphism and the presence of a favorable allele (FA). Polymorphism was verified by the genetic information of the 153 individuals examined by MassARRAY®. The FA indicated the allele which was beneficial for pod development under heat stress conditions in both trial years. To determine the FA, the Final_NoP of the 33 and 64 genotypes tested in the glasshouse trials in 2018 and 2020, respectively, were evaluated. For each genotype, the most common genotype of all biological replicates (including the results of the MassARRAY®) was identified. Boxplots that compared the phenotypic value of the genotypes carrying the reference allele versus the alternate allele were generated by the use of the ggplot2 package of R [46]. SNP markers were identified if the median in the boxplots resulted in a FA that was beneficial for pod development under heat stress conditions in both trial years. In order to include a sufficient number of SNPs, also SNPs with a FA that was beneficial for pod development in only one year were included if the allele was equally important as the unfavorable allele (UFA) in the second year. Significant differences between groups were calculated by Wilcoxon rank-sum test with the ggsignif package [47].
The estimated heat tolerance on the genotype level was calculated based on the genetic information of each individual on the selected 18 SNP markers. Per genotype, both the number of FAs as well as the number of UFAs were counted. Missing values as well as alleles that neither were identified as FA nor as UFA were neglected in this calculation. Out of this, the estimated heat tolerance is represented by the respective ratio of FA to the total number of alleles given in percent.

3. Results

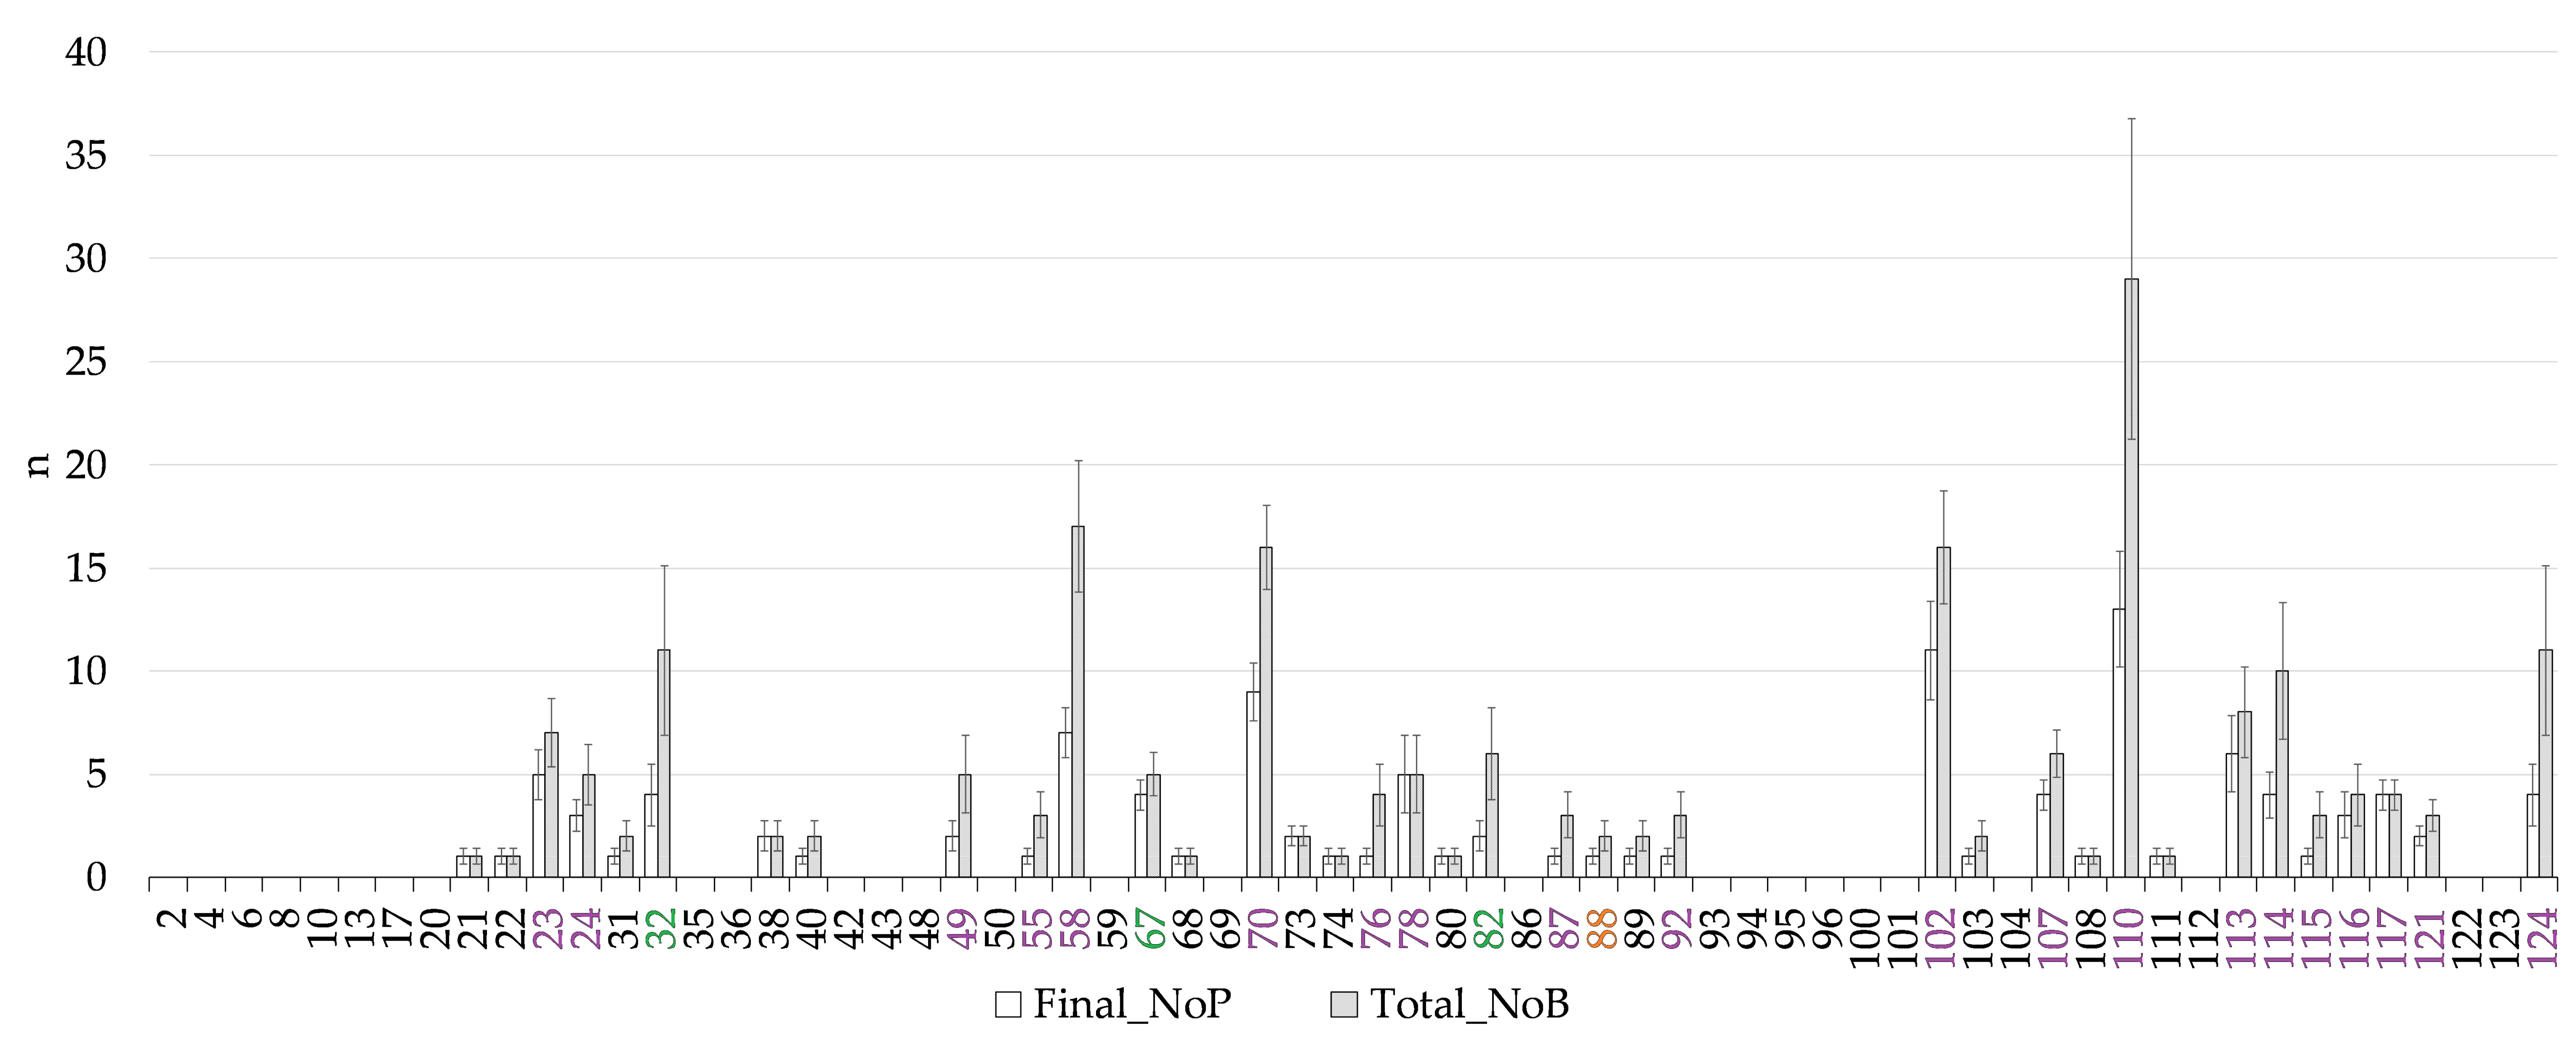
3.1. Plant Development and Heat Stress Reaction

Formation of flowers and pods on the runner bean plants was observed during both trials. In 2018, first flowers were counted on individuals 35 days after sowing, while the cumulative maximum number of flowers were counted 58 days after sowing (Figure S1). One individual of the genotype 19 only formed stunted, sterile flowers that never developed into pods. In total, ~96% (n = 254) of all individuals formed flowers over the course of the glasshouse trials, whereas on ~57% (n = 144) of all individuals pods (>5 cm) were observed. From all 33 grown genotypes, only one (genotype 89) failed to form any pods on any of its eight individuals. On average, it took 14 days from the first observation of a flower until the first observation of a pod (>5 cm).
Due to the later sowing date, plant development in 2020 was more rapid. The first flowering individual was noted 27 days after sowing, while the cumulative maximum number of flowers was observed 43 days after sowing (Figure S2). In total, ~83% (n = 315) of all individuals formed flowers over the course of the trial, while only ~17% (n = 64) of all individuals formed a pod (>5 cm). Since pods of four individuals were stunted at harvest time, the final number of individuals that formed harvestable pods was reduced to ~16% (n = 60). In 2020, mini pods (<5 cm) were also counted and documented. Here, ~25% (n = 94) of individuals displayed the formation of mini pods over the course of the trial.
In both years, a response of the plants to the heat stress conditions in the glasshouse was observed. In 2018, all genotypes reacted towards the artificially applied heat stress with shedding of flowers, resulting in a rapidly declining number of counted flowers (Figure S1). The counted cumulative number of flowers of all individuals declined from a maximum of 1884 flowers (58 days after sowing) to a minimum of 70 flowers (73 days after sowing) after 17 days of heat stress. In contrast, in 2020, due to continuously elevated daily maximum temperatures, the permanent heat stress condition in the glasshouse led to an overall lower number of flowering individuals as well as a lower number of flowers per individual (Figure S2). The maximum cumulative number of flowers was observed 43 days after sowing where 2197 flowers were counted on all individuals. This decreased to a minimum of 84 flowers at 76 days after sowing. When the daily maximum temperature started to drop (around 80 days after sowing, at the beginning of September), the cumulative number of flowers counted on all individuals started to increase again.

3.2. Phenotypic Diversity

In both heat stress trials, 2018 and 2020, the documented yield parameters varied greatly between the genotypes. In 2018, the Total_NoB (total number of beans) ranged from 0 (genotype 89) to 196 (genotype 67), while the W_B (weight of all beans) ranged from 0 g (genotype 89) to 184.55 g (genotype 82). The W_per_B (average weight per bean) also displayed a great variability among genotypes, with the minimum being 0.64 g (genotype 97) and the maximum 1.38 g (genotype 87, cf. Table S1). From all 33 grown genotypes, nine accessions (1, 6, 32, 40, 50, 59, 67, 73 and 82) and one variety (93) developed more beans under heat stress conditions than the reference variety Bonela (88) (Figure 2).
A similar variability in phenotypic diversity could also be observed in 2020, albeit the prolonged and continuous heat stress resulted in generally lower overall values for the assessed yield parameters: Final_NoP (final number of pods) at the end of the trial and Total_NoB (total number of beans) harvested. In this trial, 27 genotypes failed to grow any harvestable beans, while the maximum total number of beans harvested from any genotype was 29 (genotype 110) (Figure 3). Consequently, the measured W_B was considerably lower than in the 2018 trial. Here, a maximum value of only 26.76 g (genotype 110) was reached, which accounts for only about 15% of the maximum yield reached in 2018 (cf. Table S1). Overall, 19 accessions, one breeding line (124) and three varieties (70, 87 and 92) developed more beans than the reference variety Bonela (88) under heat stress conditions (Figure 3). Three accessions (32, 67 and 82) grew more beans in both trials than Bonela. As expected, the trait Final_NoP correlated well with Total_NoB as can be seen by the Spearman correlation coefficient of 0.98 across all phenotypic data on genotype level (p < 0.001; Figure S3).

3.3. Phylogenetic Relationship

After the analysis of the RADseq data (cf. Table S2) and respective filtering of the SNP dataset (see Section 2), the calculation of the phylogenetic relationship on the genotype level was performed by using the final dataset of one SNP per RAD locus (in total 1190 SNPs) and the ward.D2 clustering method. Rooted by the outgroup genotype 77, which has its origin in China, a clustering of the accessions according to their collection site can be seen, e.g., accessions 71–73 collected in Stadtschlaining and accessions 21–27 from Vogau (Figure 4, Table S1). In addition, all genotypes of European origin but with a collection site outside Austria (67–70, 84, 91, 92, 97) are located close together in the upper part of the tree. With regard to the included varieties, Bonela (88) was located on the same branch as the varieties Hara (93) and Melange (87);Choco (94), Hellviolette (95) and Aldrian (96) clustered well together, likely mirroring their breeding history, since all six varieties were selected/bred out of traditional Styrian landraces. However, clustering according to focal traits was not observed, as can be seen for Total_NoB: Genotypes performing better than the reference variety Bonela (88) in the years 2018 or 2020 are highlighted in purple, and the three genotypes 32, 67 and 82 that produced more beans than Bonela in both trial years are highlighted in green. The ancestry matrix was calculated with the value K = 9, which was chosen after evaluation of the minimal cross-entropy (data not shown). Overall, the ancestry matrix supports the clustering represented by the phylogenetic tree.
To get a deeper insight into the intra- and inter-accession genetic diversity as well as to identify potential duplicates in the herein analyzed germplasm collection, a dendrogram on the individual level was calculated (Figure S4). With this methodological approach, we could identify 22 “pure” genotypes, where all individuals appeared to be exclusively on one branch, including the accessions 01, 02, 07, 12, 27, 29, 30, 43, 44, 49, 50, 55, 58, 60, 64, 71, 72, 74, 77, 85 and 86, and the variety 92 (Lady Di). All the other genotypes were intermixed to a greater or lesser extent, often in concordance with their geographical origin or breeding history (as already described above, cf. Figure 4). For example, the accessions 04 and 05 appeared next to each other on one super-branch, but their individuals are not clearly separated from each other. Both accessions share the same collection origin in Wolfsberg, Austria, and are characterized by the same seed color (cf. Table S1). In contrast, examples of intermixture of two accessions with different collection origins were also identified, e.g., 06 and 20 (collection site 5 km apart) or 36 and 39 (~25 km apart). Interestingly, with regard to the varieties, Lady Di (92) is among itself well separated on one branch, but embedded in the variety Prijswinner (97), which could be explained by their common breeding history in the Netherlands. Worth mentioning is also the close relationship of the dwarf variety 91 (Hestia, the Netherlands) with the accession 69 (denominated as variety Preisgewinner originating from the former German Democratic Republic (GDR)) and the dwarf variety 70 (Hammond’s Dwarf Scarlet of unknown origin). Astonishingly, although having the same name, Prijswinner or Preisgewinner, respectively, the variety 97 and the accession 69 were not characterized by genetic similarity. However, what appeared to be closely related (on one branch) were some individuals of the varieties Choco (94), Hellviolette (95) and Aldrian (96) together with Bonela (88), highlighting a breeder’s impact on the genetics of the plant material (see also above, cf. Figure 4). Actually, Bonela, although a highly used variety, showed a very high diversity as individuals were widely spread all over the tree.

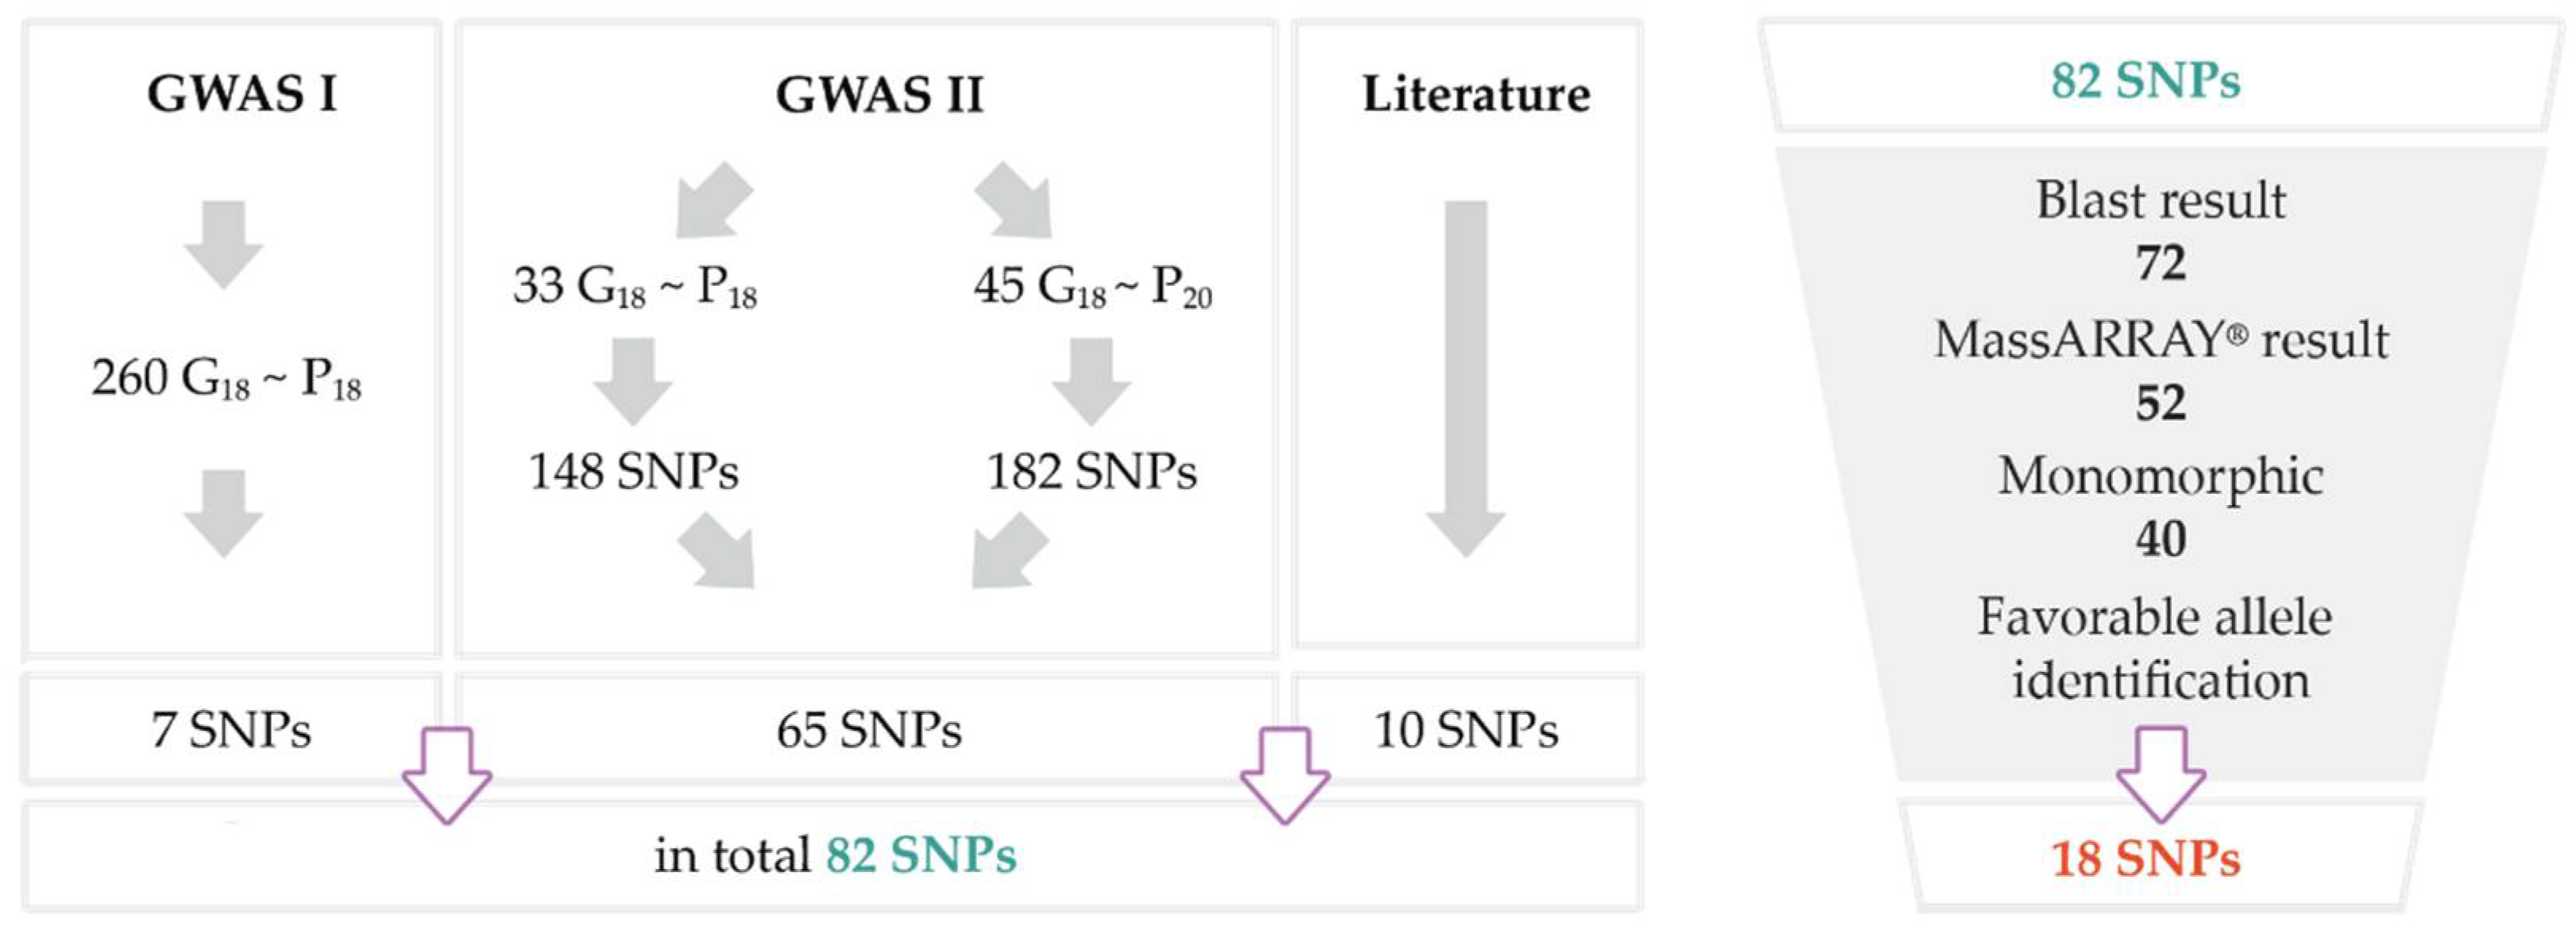
3.4. Results of Genome-Wide Association Studies (GWAS)

The association analysis of the genotypes to the different target traits resulted in a total of 148 SNPs in the 2018 trial (33 genotypes) and 182 SNPs in the 2020 trial (45 genotypes) based on the significance level p < 0.01 (Table 1, Figure 5). In 2018, the most associations were found to the trait W_per_B, while in 2020 the trait Total_NoB was associated the most (Table 1). Sixty-five SNPs were detected considering both trials (GWAS II) with 22 SNPs consistently associated to the same trait. For example, for W_per_B 13 and for Total_NoF five significant SNPs were identified in both years. In addition, the GWAS of the 260 individual samples (GWAS I) resulted in seven SNPs significantly associated to three phenotypic traits: six to Final_NoP, one additionally to Total_NoB and one to W_per_B. Together with the 65 SNPs that were obtained from GWAS II, those seven SNPs obtained from GWAS I were further used for marker development, resulting in a total of 72 SNPs obtained from both GWAS (Figure 5).

3.5. Selection of SNPs

The identified 72 associated SNPs were further complemented with ten SNPs described in the literature to be associated to heat stress tolerance in common bean (cf. Table S4). In the next step, the 82 SNPs were filtered for their application with the MassARRAY® system. In the first step of the selection process, ten RAD sequences were filtered out, because no similarity to Fabidae was found after blasting (Figure 5). Further 20 SNPs were discarded, because they had to be excluded in the MassARRAY® design process, including four SNPs from the literature. In the frame of initial MassARRAY® tests, six SNPs each from the GWAS analysis and literature were identified to be monomorphic and were thus excluded from further analysis. From the resulting 40 SNPs, additional 22 SNPs were excluded because no allele could be identified that was beneficial for pod development in both trial years.

3.6. Characterisation of Selected SNPs

Finally, 18 SNPs were identified that were associated to phenotypic traits under heat stress conditions and carrying a favorable allele (FA) leading to a higher number of pods and beans compared to the unfavorable allele (UFA) in both trial years (Figure 5). Resulting from the BLAST search against Fabidae, the most sequence similarities were found for genes of common bean, as well as adzuki bean (Vigna angularis var. angularis (Willd.) Ohwi and H. Ohashi) and cowpea (Vigna unguiculata (L.) Walp., Table 2). Only for half of the SNP loci a functional annotation based on gene ontology (GO) was documented, reaching from calcium- and zinc-ion binding, protein transport, beta-galactosidase activity to ATP binding, photosystem II assembly, and defense response to fungus.
16 SNPs originated from GWAS II, while two SNPs originated from the individual analysis of the 260 plants grown in 2018 (GWAS I, Table 2, Figure 5). Thirteen SNPs were associated to a different number and kind of phenotypic traits across the two trial years, but five SNPs were identified to be significantly associated to a minimum of one identical phenotypic trait as highlighted in bold (Table 2): RAD_414_35, RAD_611_31, RAD_1289_78, RAD_1534_20 and RAD_2341_68. RAD_414_35 was outstanding, since it was significantly associated to five identical phenotypic traits in 2018 and 2020.
In our study, alleles with a positive effect on an increased Final_NoP were defined as FAs, whereas those that resulted in a decrease in Final_NoP were defined as UFAs (Figures S5–S22). Among the FAs, RAD_414_35, RAD_1199_80 and RAD_1534_20 exhibited significantly higher numbers of pods compared with the UFAs in at least one year of the trials (Figure 6). For example, genotypes harboring the FA of RAD_1534_20 developed on average 2.58 pods in 2020, while genotypes with the UFA developed only 0.7 pods.

3.7. Estimation of Heat Tolerance

Based on the cumulated number of FAs that were present on those 18 SNP markers, the estimated heat tolerance for each genotype was calculated. Across all 113 genotypes that were genotyped by RADseq and/or MassARRAY®, the estimated heat tolerance ranged from a minimum of 27% to a maximum of 81%, with a mean of 53%. In 2018, the average heat tolerance across all 33 phenotyped genotypes was 54%, and the average number of beans was 40 (Figure 7a). Most of the genotypes with an above-average number of pods also had an above-average estimated heat tolerance. The same trend can be seen for the 64 genotypes analyzed in the 2020 trials, where the average number of beans was three and the estimated average heat tolerance 54% (Figure 7b). The reference variety Bonela (88) had an average estimated heat tolerance of 56%, however, in 2018 a slight above-average, but in 2020 a below-average number of beans. The accessions 67, 32 and 82 yielded above average in both years. They had an estimated heat tolerance of 62%, 63% and 81%, respectively. The accessions 110 and 102 were only observed in 2020, where they showed a particularly high yield. Their heat tolerance was estimated to be 60% and 75%, respectively. Thirty-three accessions were not phenotyped in the glasshouse trials, more than half of them (n = 17) had an estimated heat tolerance of more than 53%, seven with >60% (cf. Table S1).

4. Discussion

The globally experienced detrimental consequences of the climate crisis to agricultural productivity make it necessary to develop varieties that are better adapted to the changing climatic conditions [17]. The negative effects of heat stress have been comprehensively described for common bean [12,13,14,15]. Our observations revealed similar reactions in runner bean when the temperature exceeded 32 °C, in particular flower shedding (cf. Figures S1 and S2). As this phenomenon causes major yield losses in hot summers, farmers need better adapted varieties that produce stable yields even under elevated temperatures.

4.1. Genetic Diversity Analysis for Gene Bank Management and Breeding

Plant genetic resources (PGRs) can contribute to tackle climate crisis-related challenges [30]. Effective incorporation of PGRs into plant breeding programs, however, requires that they are characterized, described and maintained using state-of-the-art methods [32,33]. Due to their high phenotypic and genetic variability, they may be used to develop better adapted varieties and contribute to the development of markers by linking loci to important traits in genome-wide association studies (GWAS). Gene banks have the long-term mission of preserving PGRs and making them available for potential users and complementing the usual phenotypic descriptions with new sequencing data significantly improves the service offered [23]. The analysis of gene bank material by molecular methods helps gene bank managers to detect duplicates and users to efficiently select suitable PGRs. Local varieties and landraces of runner bean play a major role in production and in breeding programs [3,4,5,6,7].
The geographic origin (collection site) of the analyzed Austrian PGRs seemed to be a major causative factor for their relatedness (Figure 4 and Figure S4), exemplified by the landraces from Vogau (genotypes 21–27) and from Stadtschlaining (genotypes 71–73). With regard to the analyzed varieties, the observed close relationships can be explained by a similar breeding origin. For example, Bonela and Hara (88 and 93) were bred by Saatzucht Gleisdorf GmbH through selection and crossing of Styrian landraces [48,49]. Similarly, Hammond’s Dwarf Scarlet (70) and accession 69 (denominated as variety Preisgewinner) are closely related, and indeed Hammond’s Dwarf Scarlet is based on a selection of a variety denominated as Exhibition Prizewinner in 1958 [50]. Interestingly, the genetic analysis revealed that two genotypes 69 and 97, denominated as Preisgewinner and Prijswinner, respectively, were not genetically similar. Accession 69 was obtained by the AGES gene bank from IPK Gatersleben in 1985 and originated from the Montreal Botanical Garden, Canada [9]. Genotype 97, however, is a reference sample of the variety Prijswinner that was obtained from Naktuinbouw in the course of this study, together with seed samples of other varieties. As a cross-pollinator with a relatively high outcrossing rate ranging from 24 to 44%, it is possible that runner bean genotypes may genetically change over time [51], which might also have happened in case of accession 69.
Our results highlight the importance of genotyping more than one individual per genotype. The mapping of the intra- and inter-genotypic diversity within PGRs and the phylogenetic relationships on the individual level provide valuable information with relevance for gene bank managers as well as breeders. Especially those genotypes where seven to eight individuals clustered together on one branch can be classified as pure lines and may be used for breeding synthetic varieties. For the purpose of breeding “Steirische Käferbohne” our analysis highlighted genotype 82 that is characterized by a high estimated heat tolerance, good clustering of seven (out of eight) genotyped individuals and beans phenotypically complying with the relevant specifications (Figure S23). Intermixed genotypes and sub-clusters of varying sizes and locations on the tree can be explained by the outcrossing nature of runner bean [51], but may also reflect the impact of the gene bank manager. For example, we detected intermixture between the accessions 04 and 05, which share the same collection origin and are characterized by the same seed color (cf. Table S1). However, besides a fitting interpretation of the term “duplication” [52,53] and the review of all available information [23], an additional evaluation in the field may be considered, eventually supported by a re-genotyping.

4.2. Challenges of Breeding Heat Stress-Tolerant Runner Bean

In general, runner bean is very difficult to manage for breeding purposes. For line development or propagation, isolated field sites or separate cages with pollinators for each genotype are required to prevent unwanted gene flow between populations, as runner bean is an outcrossing species that has a mixed mating system with relatively high outcrossing rates [51]. Endeavors to monitor abiotic stress tolerance are difficult as the environmental conditions need to be appropriate to expose the plants to heat stress and the monitoring of heat tolerance traits such as flower or pod shedding is highly labor intensive and costly. Consequently, glasshouse trials are necessary when assessing abiotic stress reactions. However, runner bean plants exhibit indeterminate growth, and thus need sufficient space and care when grown in the glasshouse. Contrasting with the mainly autogamous common bean, runner bean flowers require an animal visit (mainly honey bees and bumblebees) for pollination [54]. Here, honey bee colonies were placed in the glasshouses to ensure pollination services, requiring the avoidance of harmful substances in disease and pest management. Our observations highlighted how strongly heat impacts runner bean. The different cultivation dates in the two trial years resulted in different heat stress conditions at different developmental stages of the plants. While the plants in 2018 experienced temperatures mainly between 20–27 °C in the first 30 days after sowing, the temperatures were clearly higher in 2020, ranging between 25–37 °C (cf. Figures S1 and S2). The more severe stress conditions in 2020 resulted in significantly different development of flowers, pods and beans (Figure 2 and Figure 3).

4.3. Molecular Markers for Runner Bean Breeding

In contrast to common bean, abiotic stress tolerance in runner bean has not been addressed to date, except for the impact of low temperature during germination and seedling development [3], and present genotypic data have been mostly used to analyze diversity patterns and to describe potential domestication routes of runner bean [4,25,26]. We identified heat tolerance-associated molecular markers to develop an easy-to-use SNP panel for calculating an estimated heat tolerance in runner bean material. These markers can be used for further studies, and, upon validation, for breeding purposes and selection of desirable traits. In this way, the number of progeny processed in subsequent years after crossbreeding can be reduced at an early stage and in a targeted manner.
Among the current low-to-medium throughput SNP-based genotyping technologies the MassARRAY® system [30] proved to be well suited for our study. Out of initially 82 SNPs, 18 high quality SNPs remained after diverse filtering steps and after their validation on the basis of 26 genotypes (genotyping 2020, Figure 5). In addition, the tested heat stress-related SNPs from common bean (Table S4) had to be filtered due to monomorphism in runner bean. Such a drop in the final number of SNPs is common [32].
Nine of the 18 loci could be assigned to a functional characterization based on gene ontology (GO). Interestingly, one marker was flanked by the gene PHAVU_008G292100g, described to have a calcium-binding function. Calcium has been shown to play a role in the protection against heat stress damage in various plants [55,56,57,58], and is also suggested to mitigate heat stress effects in common bean [59]. The relevance of calcium-binding proteins regarding heat stress tolerance is supported by a study that found a calcium-binding protein enhancing heat stress tolerance in rice [60]. Another marker was flanked by a gene coding for aspartyl-tRNA synthetase (AspRS), which is involved in the activation of abiotic stress-specific defense mechanisms [61]. This gene region was also identified in a previous study flanking a SNP marker associated to heat tolerance in common bean, cf. Table S5 in [27]. Just recently, genes encoding AspRS have been shown to be upregulated upon drought, salt and heavy metal stress [62], which implies that AspRS might play a role in heat stress tolerance as well. Heat stress has been described to cause inhibition of photosystem II (PSII) activity in many plant species (e.g., [63,64,65]). Thus, it is not surprising, that one of the identified SNPs is located in a gene encoding for a photosystem PSII biogenesis protein. Finally, one SNP is located in SEC23, a gene shown to be upregulated upon heat stress to activate vesicle trafficking between the Golgi and the endoplasmatic reticulum in spinach [66]. However, whether these genes play a major role in conferring heat tolerance in runner bean needs further proof through functional characterization.

4.4. Towards Heat Tolerant Runner Bean Varieties

The runner bean varieties on the Austrian market were observed to be heat sensitive, therefore developing or finding heat tolerant varieties is an important part of a long-term strategy to increase productivity and yield security. Heat tolerant PGRs are an important source of this trait. Indeed, in our trials 23 accessions and one breeding line but none of the eleven varieties had an estimated heat tolerance of more than 60%. Only two varieties developed a considerable number of beans under heat stress conditions, however, only in one trial year: Hammond’s Dwarf Scarlet (70) in 2020, which had not been included in 2018, and Hara (93) in 2018, but not in 2020 (Figure 2 and Figure 3). In addition, the varieties Melange (87) and Lady Di (92) developed slightly more beans than Bonela in one of the trial years, but this was not observed in the second year.
We identified three accessions that developed more beans under heat stress conditions than the reference variety Bonela in both trial years: The accession 32, collected in Klausen in the southeast of Austria, accession 67, collected in Santuario Madonna di Polsi, Calabria, Italy, and accession 82 collected in Burgenland, Austria (Table S1 and Figure S23). Applying the herein developed SNP panel, an estimated heat tolerance of >60% was calculated for all three accessions. In fact, accession 82 showed the highest estimated heat tolerance of all genotypes studied, with a calculated value of 81%—reflecting a landrace that seems to be well adapted to the dry and hot summers of eastern Austria, which is influenced by the continental climate of the adjacent Pannonian region. In addition, accession 102 collected from Podgoria, Austria, which is close to the Italian border, and accession 110 from Budapest, Hungary, produced a particularly large number of beans under heat stress in 2020. Due to their high estimated heat tolerance of more than 60%, a constant medium-to-high yield under heat stress can be assumed but remains to be verified. It will also be important to see whether these genotypes produce high yields in field conditions, in particular in hot and dry summers. Promising accessions can be used as crossing partners for the development of heat tolerant runner bean lines. When the seeds do not fulfill the specifications of “Steirische Käferbohne”, additional effort has to be invested to fulfill those criteria at the end of the breeding process. Segregating material must either be developed into homozygous lines by manual selfing, or individual plants must be grown in isolation in the presence of pollinating insects, both of which are very labor intensive. However, as the third-most economically important Phaseolus species worldwide [1] with increasing acreage, e.g., in Austria [11], runner bean deserves its own breeding programs.

5. Conclusions

In summary, in correspondence with general cultivation practice, the standard bean varieties in Austria, Bonela (88) and Melange (87), gave poor yields under heat stress conditions. A proper phenotypic and genetic characterization of PGRs stored ex situ as well as the identification of phenotype–genotype associations are crucial steps towards breeding more tolerant varieties that are able to withstand upcoming climatic extremes. From the 113 runner bean genotypes that were assessed in this study, 24 accessions obtained from the Austrian gene bank were found to be more heat tolerant than the commonly cultivated variety Bonela. In particular, three accessions emerged that showed high yield under heat stress conditions in both years. Inter- and intra-genetic diversity of the runner bean genotypes were studied by the next generation sequencing (NGS) method RADseq, a cost-effective method that was able to deliver 29,271 SNPs. The representation of the phylogenetic relationship based on a selection of 1190 SNPs provides a valuable knowledge base for both, gene bank managers and breeders, as putative duplicates but also pure lines were identified. Especially the latter are of high importance as such genotypes can be integrated in breeding of (synthetic) varieties characterized by traits of interest. The combination of the geno- and phenotype in the association analysis resulted in 18 high quality SNPs applicable as markers for the prediction of heat tolerance. In our analysis, genotypes with an estimated heat tolerance of >60% were likely to have higher yield under heat stress conditions.
The results of our study represent the first steps towards breeding heat tolerant runner bean, a necessity given the changing climate. For this purpose, not only the herein identified heat tolerant accessions can be used as crossing partners, but also the 18 SNP markers can be applied to predict heat tolerance after crossing trials. These findings can speed up the development of new runner bean lines and make it less labor intensive than it would be possible with purely conventional breeding methods.

Supplementary Materials

The following are available online at https://www.mdpi.com/article/10.3390/agronomy12030612/s1, Figure S1: Heat and flowers 2018, Figure S2: Heat and flowers 2020, Figure S3: Correlation, Figure S4: Individual Dendrogram, Figures S5–S22: Boxplots of the selected 18 SNPs. Significant differences between groups were calculated by Wilcoxon rank-sum test. ** = p < 0.01, * = p < 0.05, NS = p > 0.05, Figure S23: Phenotypes of heat tolerant accessions, Table S1: Genotypes, Table S2: RADseq Data Analysis, Table S3: RemovedRetainedLoci, Table S4: Literature SNPs.

Author Contributions

Conceptualization, E.M.S., E.A. and A.R.; Data curation, E.M.S.; Funding acquisition, A.R.; Investigation, S.B., P.v.G., K.H.-H. and N.P.; Methodology, E.M.S., E.A. and A.R.; Project administration, A.R.; Supervision, E.M.S. and A.R.; Writing—original draft, S.B., E.M.S., E.A., P.v.G. and A.R.; Writing—review and editing, S.B., E.M.S., E.A., P.v.G., K.H.-H., N.P. and A.R. All authors have read and agreed to the published version of the manuscript.

Funding

This research was funded by the Austrian Federal Ministry for Agriculture, Regions and Tourism and the Province of Styria within the framework of the federal/provincial cooperation on research (DaFNE-Research project 101193, “Genomics and phenomics of Austrian scarlet runner bean accessions with the focus on heat tolerance” and 101536, “Development of molecular markers to facilitate runner bean breeding”); www.dafne.at, accessed on 24 February 2022.

Institutional Review Board Statement

Not applicable.

Informed Consent Statement

Not applicable.

Data Availability Statement

RAD sequencing data have been made available as fastq files in NCBI’s SRA database, BioProject ID PRJNA783867.

Acknowledgments

Seeds were kindly provided by AGES gene bank Linz, Austria; Institute of Special Crops, Agricultural Research Center Styria, Wies, Austria; Naktuinbouw (The Netherlands Inspection Service for Horticulture), and CSIC (Spanish National Research Council, Antonio De Ron). Our thanks go to Martina Grabner and Barbara Bauer for their help with phenotyping in the glasshouses, Stephan Gaubitzer for his support in the RADseq data analysis, Evelyn Hackl for proof reading, and Tatjana Hirschmugl (https://scillustration.at/en/; accessed on 24 February 2022) for the design of Figure 1 and Figure 5.

Conflicts of Interest

The authors declare no conflict of interest. The funders had no role in the design of the study, in the collection, analyses, or interpretation of data, in the writing of the manuscript, or in the decision to publish the results.

References

  1. Bitocchi, E.; Rau, D.; Bellucci, E.; Rodriguez, M.; Murgia, M.L.; Gioia, T.; Santo, D.; Nanni, L.; Attene, G.; Papa, R. Beans (Phaseolus ssp.) as a model for understanding crop evolution. Front. Plant Sci. 2017, 8, 722. [Google Scholar] [CrossRef] [PubMed] [Green Version]
  2. European Commission. EU Plant Variety Database. Available online: https://ec.europa.eu/food/plant/plant_propagation_material/plant_variety_catalogues_databases/search/public/index.cfm?event=SearchVariety&ctl_type=H&species_id=31&variety_name=&listed_in=0&show_current=on&show_deleted (accessed on 30 December 2021).
  3. Rodiño, A.P.; Lema, M.; Pérez-Barbeito, M.; Santalla, M.; De Ron, A.M. Assessment of runner bean (Phaseolus coccineus L.) germplasm for tolerance to low temperature during early seedling growth. Euphytica 2006, 155, 63–70. [Google Scholar] [CrossRef] [Green Version]
  4. Santalla, M.; Monteagudo, A.B.; González, A.M.; De Ron, A.M. Agronomical and quality traits of runner bean germplasm and implications for breeding. Euphytica 2004, 135, 205–215. [Google Scholar] [CrossRef]
  5. Sicard, D.; Nanni, L.; Porfiri, O.; Bulfon, D.; Papa, R. Genetic diversity of Phaseolus vulgaris L. and P. coccineus L. landraces in central Italy. Plant Breed. 2005, 124, 464–472. [Google Scholar] [CrossRef]
  6. De Ron, A.M.; Bebeli, P.J.; Negri, V.; Vaz Patto, M.C.; Revilla, P. Warm season grain legume landraces from the south of Europe for germplasm conservation and genetic improvement. Front. Plant Sci. 2018, 9, 1524. [Google Scholar] [CrossRef] [PubMed]
  7. Palmero, D.; Iglesias, C.; Cara, M.d.; Tello, J.C.; Camacho, F.G. Diversity and health traits of local landraces of runner bean (Phaseolus coccineus L.) from Spain. J. Food Agric. Environ. 2011, 9, 290–295. [Google Scholar]
  8. Genesys. Global Portal on Plant Genetic Resources. Available online: https://www.genesys-pgr.org/a/overview/v2r8e87E7XJ (accessed on 11 December 2021).
  9. AGES Gene Bank. National Inventory. Available online: https://www.genbank.at/en/national-inventory/search-result.html (accessed on 12 December 2021).
  10. European Commission. Commission Implementing Regulation (EU) 2016/1408 of 12 August 2016 Entering a Name in the Register of Protected Designations of Origin and Protected Geographical Indications (Steirische Käferbohne (PDO)). Off. J. Union 2016. [Google Scholar]
  11. Statistik Austria. Gemüseproduktion ab 1995. Available online: http://www.statistik.at/web_de/statistiken/wirtschaft/land_und_forstwirtschaft/agrarstruktur_flaechen_ertraege/gemuese/index.html (accessed on 6 January 2022).
  12. De Ron, A.M.; Rodiño, A.P.; Santalla, M.; González, A.M.; Lema, M.J.; Martín, I.; Kigel, J. Seedling emergence and phenotypic response of common bean germplasm to different temperatures under controlled conditions and in open Field. Front. Plant Sci. 2016, 7, 1087. [Google Scholar] [CrossRef] [Green Version]
  13. Porch, T.G.; Jahn, M. Effects of high-temperature stress on microsporogenesis in heat-sensitive and heat-tolerant genotypes of Phaseolus vulgaris. Plant Cell Environ. 2001, 24, 723–731. [Google Scholar] [CrossRef]
  14. Rainey, K.M.; Griffiths, P.D. Differential response of common bean genotypes to high temperatures. J. Am. Soc. Hortic. Sci. 2005, 130, 18–23. [Google Scholar] [CrossRef] [Green Version]
  15. Vargas, Y.; Mayor-Duran, V.M.; Buendia, H.F.; Ruiz-Guzman, H.; Raatz, B. Physiological and genetic characterization of heat stress effects in a common bean RIL population. PLoS ONE 2021, 16, e0249859. [Google Scholar] [CrossRef] [PubMed]
  16. Galluzzi, G.; Seyoum, A.; Halewood, M.; López Noriega, I.; Welch, E.W. The role of genetic resources in breeding for climate change: The case of public breeding programmes in eighteen developing countries. Plants 2020, 9, 1129. [Google Scholar] [CrossRef] [PubMed]
  17. Hodgkin, T.; Bordoni, P. Climate change and the conservation of plant genetic resources. J. Crop Improv. 2012, 26, 329–345. [Google Scholar] [CrossRef]
  18. Assefa, T.; Assibi Mahama, A.; Brown, A.V.; Cannon, E.K.S.; Rubyogo, J.C.; Rao, I.M.; Blair, M.W.; Cannon, S.B. A review of breeding objectives, genomic resources, and marker-assisted methods in common bean (Phaseolus vulgaris L.). Mol. Breed. 2019, 39, 20. [Google Scholar] [CrossRef] [Green Version]
  19. D’Agostino, N.; Tripodi, P. NGS-based genotyping, high-throughput phenotyping and genome-wide association studies laid the foundations for next-generation breeding in horticultural crops. Diversity 2017, 9, 38. [Google Scholar] [CrossRef] [Green Version]
  20. Halewood, M.; Chiurugwi, T.; Sackville Hamilton, R.; Kurtz, B.; Marden, E.; Welch, E.; Michiels, F.; Mozafari, J.; Sabran, M.; Patron, N.; et al. Plant genetic resources for food and agriculture: Opportunities and challenges emerging from the science and information technology revolution. New Phytol. 2018, 217, 1407–1419. [Google Scholar] [CrossRef]
  21. Delfini, J.; Moda-Cirino, V.; Dos Santos Neto, J.; Zeffa, D.M.; Nogueira, A.F.; Ribeiro, L.A.B.; Ruas, P.M.; Gepts, P.; Goncalves, L.S.A. Genome-wide association study identifies genomic regions for important morpho-agronomic traits in Mesoamerican common bean. Front. Plant Sci. 2021, 12, 748829. [Google Scholar] [CrossRef]
  22. Nadeem, M.A.; Habyarimana, E.; Çiftçi, V.; Nawaz, M.A.; Karaköy, T.; Comertpay, G.; Shahid, M.Q.; Hatipoğlu, R.; Yeken, M.Z.; Ali, F.; et al. Characterization of genetic diversity in Turkish common bean gene pool using phenotypic and whole-genome DArTseq-generated silicoDArT marker information. PLoS ONE 2018, 13, e0205363. [Google Scholar] [CrossRef]
  23. Mascher, M.; Schreiber, M.; Scholz, U.; Graner, A.; Reif, J.C.; Stein, N. Genebank genomics bridges the gap between the conservation of crop diversity and plant breeding. Nat. Genet. 2019, 51, 1076–1081. [Google Scholar] [CrossRef]
  24. Arriagada, O.; Schwember, A.R.; Greve, M.J.; Urban, M.O.; Cabeza, R.A.; Carrasco, B. Morphological and molecular characterization of selected Chilean runner bean (Phaseolus coccineus L.) genotypes shows moderate agronomic and genetic variability. Plants 2021, 10, 1688. [Google Scholar] [CrossRef]
  25. Rodriguez, M.; Rau, D.; Angioi, S.A.; Bellucci, E.; Bitocchi, E.; Nanni, L.; Knupffer, H.; Negri, V.; Papa, R.; Attene, G. European Phaseolus coccineus L. landraces: Population structure and adaptation, as revealed by cpSSRs and phenotypic analyses. PLoS ONE 2013, 8, e57337. [Google Scholar] [CrossRef] [PubMed] [Green Version]
  26. Spataro, G.; Tiranti, B.; Arcaleni, P.; Bellucci, E.; Attene, G.; Papa, R.; Spagnoletti Zeuli, P.; Negri, V. Genetic diversity and structure of a worldwide collection of Phaseolus coccineus L. Theor. Appl. Genet. 2011, 122, 1281–1291. [Google Scholar] [CrossRef]
  27. López-Hernández, F.; Cortés, A.J. Last-generation genome-environment associations reveal the genetic basis of heat tolerance in common bean (Phaseolus vulgaris L.). Front. Genet. 2019, 10, 954. [Google Scholar] [CrossRef] [PubMed] [Green Version]
  28. Oladzad, A.; Porch, T.; Rosas, J.C.; Moghaddam, S.M.; Beaver, J.; Beebe, S.E.; Burridge, J.; Jochua, C.N.; Miguel, M.A.; Miklas, P.N.; et al. Single and multi-trait GWAS identify genetic factors associated with production traits in common bean under abiotic stress environments. G3 Genes Genomes Genet. 2019, 9, 1881–1892. [Google Scholar] [CrossRef]
  29. Tibbs Cortes, L.; Zhang, Z.; Yu, J. Status and prospects of genome-wide association studies in plants. Plant Genome 2021, 14, e20077. [Google Scholar] [CrossRef]
  30. Ellis, J.A.; Ong, B. The MassARRAY® system for targeted SNP genotyping. Methods Mol. Biol. 2017, 1492, 77–94. [Google Scholar] [CrossRef]
  31. Sudan, J.; Singh, R.; Sharma, S.; Salgotra, R.K.; Sharma, V.; Singh, G.; Sharma, I.; Sharma, S.; Gupta, S.K.; Zargar, S.M. ddRAD sequencing-based identification of inter-genepool SNPs and association analysis in Brassica juncea. BMC Plant Biol. 2019, 19, 1–15. [Google Scholar] [CrossRef] [Green Version]
  32. Smith, H.M.; Smith, B.P.; Morales, N.B.; Moskwa, S.; Clingeleffer, P.R.; Thomas, M.R. SNP markers tightly linked to root knot nematode resistance in grapevine (Vitis cinerea) identified by a genotyping-by-sequencing approach followed by Sequenom MassARRAY validation. PLoS ONE 2018, 13, e0193121. [Google Scholar] [CrossRef] [Green Version]
  33. BAES (Ed.) Österreichische Sortenliste 2022; Schriftenreihe: Berlin, Germany, 2022; ISSN 1560-635X. [Google Scholar]
  34. van der Beek, J.G.; Verkerk, R.; Zabel, P.; Lindhout, P. Mapping strategy for resistance genes in tomato based on RFLPs between cultivars: Cf9 (resistance to Cladosporium fulvum) on chromosome 1. Theor. Appl. Genet. 1992, 84, 106–112. [Google Scholar] [CrossRef]
  35. Baird, N.A.; Etter, P.D.; Atwood, T.S.; Currey, M.C.; Shiver, A.L.; Lewis, Z.A.; Selker, E.U.; Cresko, W.A.; Johnson, E.A. Rapid SNP discovery and genetic mapping using sequenced RAD markers. PLoS ONE 2008, 3, e3376. [Google Scholar] [CrossRef]
  36. Aronesty, E. Comparison of sequencing utility programs. Open Bioinform. J. 2013, 7, 1–8. [Google Scholar] [CrossRef]
  37. Andrews, S. FastQC: A Quality Control Tool for High Throughput Sequence Data. 2010. Available online: http://www.bioinformatics.babraham.ac.uk/projects/fastqc/ (accessed on 24 November 2021).
  38. Ewels, P.; Magnusson, M.; Lundin, S.; Kaller, M. MultiQC: Summarize analysis results for multiple tools and samples in a single report. Bioinformatics 2016, 32, 3047–3048. [Google Scholar] [CrossRef] [PubMed] [Green Version]
  39. Eaton, D.A.R.; Overcast, I. ipyrad: Interactive assembly and analysis of RADseq datasets. Bioinformatics 2020, 36, 2592–2594. [Google Scholar] [CrossRef] [PubMed]
  40. Danecek, P.; Auton, A.; Abecasis, G.; Albers, C.A.; Banks, E.; DePristo, M.A.; Handsaker, R.E.; Lunter, G.; Marth, G.T.; Sherry, S.T.; et al. The variant call format and VCFtools. Bioinformatics 2011, 27, 2156–2158. [Google Scholar] [CrossRef]
  41. Jombart, T. adegenet: A R package for the multivariate analysis of genetic markers. Bioinformatics 2008, 24, 1403–1405. [Google Scholar] [CrossRef] [Green Version]
  42. Paradis, E.; Schliep, K. ape 5.0: An environment for modern phylogenetics and evolutionary analyses in R. Bioinformatics 2019, 35, 526–528. [Google Scholar] [CrossRef]
  43. Kamvar, Z.; Tabima, J.; Grünwald, N. Poppr: An R package for genetic analysis of populations with clonal, partially clonal, and/or sexual reproduction. PeerJ 2014, 2, e281. [Google Scholar] [CrossRef] [Green Version]
  44. Frichot, E.; François, O. LEA: An R package for landscape and ecological association studies. Methods Ecol. Evol. 2015, 6, 925–929. [Google Scholar] [CrossRef]
  45. Benjamini, Y.; Hochberg, Y. Controlling the false discovery rate: A practical and powerful approach to multiple testing. J. R. Stat. Soc. Ser. B 1995, 57, 289–300. [Google Scholar] [CrossRef]
  46. Wickham, H. ggplot2. WIREs Comput. Stat. 2011, 3, 180–185. [Google Scholar] [CrossRef]
  47. Ahlmann-Eltze, C.; Patil, I. ggsignif: R package for displaying significance brackets for ‘ggplot2’. PsyArvix 2021. [Google Scholar] [CrossRef]
  48. Bundesanstalt für Pflanzenbau. Feuerbohne Hara. In Proceedings of the Zuchtbuchkommission des Bundesministeriums für Land- und Forstwirtschaft, Sorten gärtnerischer Kulturpflanzen, Vienna, Austria, 19 December 1985; p. 1. [Google Scholar]
  49. Bundesanstalt für Pflanzenbau. Stangenfeuerbohne Bonela. In Proceedings of the Zuchtbuchkommission des Bundesministeriums für Land- und Forstwirtschaft, Sorten Gärtnerischer Kulturpflanzen, Vienna, Austria, 20 December 1988; p. 9. [Google Scholar]
  50. Lapinskas, P.G.W.; Evans, A.M. Growth habit studies in Phaseolus coccineus. Annu. Rep. Bean Improv. Coop. 1977, 20, 46–47. [Google Scholar]
  51. González, A.M.; De Ron, A.M.; Lores, M.; Santalla, M. Effect of the inbreeding depression in progeny fitness of runner bean (Phaseolus coccineus L.) and it is implications for breeding. Euphytica 2014, 200, 413–428. [Google Scholar] [CrossRef] [Green Version]
  52. van Hintum, T.J.L. Duplication within and between germplasm collections. III. A quantitative model. Genet. Resour. Crop Evol. 2000, 47, 507–513. [Google Scholar] [CrossRef]
  53. van Hintum, T.J.L.; Visser, D.L. Duplication within and between germplasm collections. Genet. Resour. Crop Evol. 1995, 42, 135–145. [Google Scholar] [CrossRef]
  54. Koltowski, Z. Flowering biology, nectar secretion and insect foraging of the runner bean (Phaseolus coccineus L.). J. Apic. Sci. 2004, 48, 53–60. [Google Scholar]
  55. Goswami, S.; Kumar, R.R.; Sharma, S.K.; Kala, Y.K.; Singh, K.; Gupta, R.; Dhavan, G.; Rai, G.K.; Singh, G.P.; Pathak, H.; et al. Calcium triggers protein kinases-induced signal transduction for augmenting the thermotolerance of developing wheat (Triticum aestivum) grain under the heat stress. J. Plant Biochem. Biotechnol. 2015, 24, 441–452. [Google Scholar] [CrossRef]
  56. Larkindale, J.; Knight, M.R. Protection against heat stress-induced oxidative damage in Arabidopsis involves calcium, abscisic acid, ethylene, and salicylic acid. Plant Physiol. 2002, 128, 682–695. [Google Scholar] [CrossRef]
  57. Wang, M.; Zhang, X.; Li, Q.; Chen, X.; Li, X. Comparative transcriptome analysis to elucidate the enhanced thermotolerance of tea plants (Camellia sinensis) treated with exogenous calcium. Planta 2019, 249, 775–786. [Google Scholar] [CrossRef]
  58. Wang, X.; Huang, B. Lipid- and calcium-signaling regulation of HsfA2c-mediated heat tolerance in tall fescue. Environ. Exp. Bot. 2017, 136, 59–67. [Google Scholar] [CrossRef]
  59. Naeem, M.; Traub, J.R.; Athar, H.-u.-R.; Loescher, W. Exogenous calcium mitigates heat stress effects in common bean: A coordinated impact of photoprotection of PSII, up-regulating antioxidants, and carbohydrate metabolism. Acta Physiol. Plant. 2020, 42, 180. [Google Scholar] [CrossRef]
  60. Qiao, B.; Zhang, Q.; Liu, D.; Wang, H.; Yin, J.; Wang, R.; He, M.; Cui, M.; Shang, Z.; Wang, D.; et al. A calcium-binding protein, rice annexin OsANN1, enhances heat stress tolerance by modulating the production of H2O2. J. Exp. Bot. 2015, 66, 5853–5866. [Google Scholar] [CrossRef] [PubMed] [Green Version]
  61. Jisha, K.; Shackira, A.; Puthur, J. GABA/BABA priming causes signaling of defense pathways related to abiotic stress tolerance in plants. In Neurotransmitters in Plants; CRC Press: Boca Raton, FL, USA, 2018; pp. 219–230. [Google Scholar] [CrossRef]
  62. Baranašić, J.; Mihalak, A.; Gruić-Sovulj, I.; Bauer, N.; Rokov-Plavec, J. Expression of genes for selected plant aminoacyl-tRNA synthetases in the abiotic stress. Acta Bot. Croat. 2021, 80, 35–42. [Google Scholar] [CrossRef]
  63. Huang, R.; Liu, Z.; Xing, M.; Yang, Y.; Wu, X.; Liu, H.; Liang, W. Heat stress suppresses Brassica napus seed oil accumulation by inhibition of photosynthesis and BnWRI1 pathway. Plant Cell Physiol. 2019, 60, 1457–1470. [Google Scholar] [CrossRef] [PubMed]
  64. Tang, Y.; Wen, X.; Lu, Q.; Yang, Z.; Cheng, Z.; Lu, C. Heat stress induces an aggregation of the light-harvesting complex of photosystem II in spinach plants. Plant Physiol. 2007, 143, 629–638. [Google Scholar] [CrossRef] [Green Version]
  65. Zhang, L.; Hu, T.; Amombo, E.; Wang, G.; Xie, Y.; Fu, J. The alleviation of heat damage to photosystem II and enzymatic antioxidants by exogenous spermidine in tall fescue. Front. Plant Sci. 2017, 8, 1747. [Google Scholar] [CrossRef] [PubMed] [Green Version]
  66. Zhao, Q.; Chen, W.; Bian, J.; Xie, H.; Li, Y.; Xu, C.; Ma, J.; Guo, S.; Chen, J.; Cai, X.; et al. Proteomics and phosphoproteomics of heat stress-responsive mechanisms in spinach. Front. Plant Sci. 2018, 9, 800. [Google Scholar] [CrossRef]
Figure 1. Trial design. The left block describes the material used for geno- and phenotyping in the two experimental years: In 2018, out of 94 genotypes that were genotyped, 33 were selected for the glasshouse trial, whereas in 2020, out of 64 genotypes grown in the glasshouse trial, 26 were genotyped. The right block highlights the methods used for genotyping, RADseq in 2018 and the MassARRAY® system in 2020, and the phenotyping under heat stress conditions.
Agronomy 12 00612 g001
Figure 2. Final_NoP (final number of pods) and Total_NoB (total number of beans) for each genotype at the end of the 2018 heat stress trial. Genotypes with a higher Total_NoB in 2018 than the reference variety Bonela (orange, 88) are colored in purple, while genotypes 32, 67 and 82 that developed more beans than Bonela in 2018 and 2020 are marked in green (cf. Figure 3).
Agronomy 12 00612 g002
Figure 3. Final_NoP (final number of pods) and Total_NoB (total number of beans) for each genotype at the end of the 2020 heat stress trial. Genotypes with a higher Total_NoB than the reference variety Bonela (orange, 88) in 2020 are colored in purple, while genotypes 32, 67 and 82 that developed more beans than Bonela in 2018 and 2020 are marked in green (cf. Figure 2).
Agronomy 12 00612 g003
Figure 4. Phylogenetic tree and ancestry matrix (based on K = 9) of 94 genotypes (comprising 741 individuals) genotyped in the 2018 trial based on 1190 SNPs. Highlighted (enlarged and colorized labels) genotypes showed a better value for the trait Total_NoB (total number of beans) compared to the reference genotype Bonela (88, in orange) either in the year 2018 or 2020 (purple). Genotypes 32, 67 and 82 that were better than Bonela in both years are marked in green. The genotype 77 of Chinese origin was defined as outgroup and is located at the bottom of the phylogenetic tree.
Agronomy 12 00612 g004
Figure 5. SNPs selection process. Left: The collection of SNPs by GWAS I + II and literature (cf. Table S4). Right: Subsequent filtering steps during MassARRAY® genotyping.
Agronomy 12 00612 g005
Figure 6. Boxplots (25–75th percentile; center line, median) showing the phenotypic differences in Final_NoP (final number of pods) between genotypes with favorable alleles (FAs) and genotypes with unfavorable alleles (UFAs) on selected SNPs as observed in glasshouse heat stress trials in 2018 (33 genotypes) and 2020 (64 genotypes). (a) RAD_414_35, (b) RAD_1199_80, (c) RAD_1534_20, (d) RAD_3235_24. Significant differences between groups were calculated by Wilcoxon rank-sum test. ** = p < 0.01, * = p < 0.05, NS = p > 0.05.
Agronomy 12 00612 g006
Figure 7. Scatter plot showing the Total_NoB (total number of beans) and estimated heat tolerance of (a) 33 genotypes phenotyped in 2018, and (b) 64 genotypes phenotyped in 2020. Average estimated heat tolerance and Total_NoB are indicated. All genotypes that developed more beans than Bonela are labeled. Genotypes that were phenotyped in both years are enlarged. Reference variety Bonela (88) is colored in orange, genotypes with a higher Total_NoB either in 2018 or 2020 are colored in purple, and genotypes 32, 67 and 82 that developed more beans than Bonela in both years are marked in green.
Agronomy 12 00612 g007
Table 1. Number of significant associations obtained by GWAS for the different phenotypic traits measured for runner bean genotypes under heat stress conditions in two different glasshouse trials in 2018 and 2020. Three traits were measured in relation to flowers, two minipod-traits, three pod-related traits, and four traits concerning beans. In trial 2018, 33 genotypes were considered for association analysis, in trial 2020 45 genotypes were considered. GWAS II reflects common associations from trial 2018 and 2020. In GWAS I 260 plants were considered for association analysis. The summarized number of associations to gene regions and the according number of associated SNPs (in brackets) are given in the last row. NA: Not applicable.
Trait GroupTrait-IDTrait ExplanationTrial 2018Trial 2020GWAS IIGWAS I
Flowers%_F_IndPercentage of individuals of one genotype that flowerNA31NANA
Total_MaxFThe highest number of flowers observed on one day over the course of the trial291830
Total_NoFThe sum of all flowers counted over the course of the trial271850
MinipodsFinal_NoMPThe final number of mini pods (<5 cm) harvested at the end of the trialNA32NANA
Total_MaxMPThe highest number of mini pods (<5 cm) observed on one day over the course of the trialNA36NANA
Pods%_P_IndPercentage of individuals of one genotype that had formed pods (>5 cm)NA45NANA
Final_NoPThe final number of pods (>5 cm) harvested at the end of the trial184836
Total_MaxPThe highest number of pods (>5 cm) observed on one day over the course of the trial154810
BeansNoB_per_PThe average number of beans per pod (>5 cm) harvested at the end of the trial20212NA
Total_NoBThe total number of beans harvested at the end of the trial206211
W_BThe weight of all beans harvested for all individuals of one genotype19521NA
W_per_BThe average weight per bean harvested at the end of the trial8733131
Total associations (number of SNPs)235 (148)444 (182)29 (22)8 (7)
Table 2. Details of the final 18 SNPs associated to heat stress either from GWAS I or GWAS II. The associated traits are depicted for both years, 2018 and 2019, whereby traits that were associated in both years are highlighted in bold. For each SNP the two possible alleles are given, whereby the favorable allele (FA) is mentioned first. Further, each SNP is characterized by the best BLAST hit, by the protein that is encoded by the sequence, and finally by the molecular and biological function annotation by Uniprot. The explanation of the abbreviation of each trait is given in Table 1. NA: Not applicable.
SNPGWASAssociated Traits 2018Associated Traits 2020AllelesBLASTProteinMolecular FunctionBiological Function
RAD_220_83IIW_per_B%_P_Ind,
Final_NoP,
Total_MaxP,
NoB_per_P,
Total_NoB,
W_B
C/GVigna angularis var. angularis DNA, chromosome 10, Range 1: 3,212,827 to 3,212,913
RAD_414_35IIFinal_NoP,
Total_MaxP, NoB_per_P,
Total_NoB,
W_B
%_P_Ind,
Final_NoP,
Total_MaxP,
NoB_per_P,
Total_NoB,
W_B
C/GPHAVU_001G030000gaspartyl-tRNA synthetaseaspartate-tRNA ligase activity; ATP binding; DNA bindingaspartyl-tRNA aminoacylation
RAD_611_31IIW_per_BW_per_BT/CPHAVU_005G108600guncharacterized protein photosystem II assembly
RAD_1199_80IINoB_per_P%_F_IndT/APHAVU_008G292100guncharacterized proteincalcium ion binding
RAD_1289_78IITotal_NoF, NoB_per_P, W_per_BW_per_BA/CVigna unguiculata cultivar Xiabao 2 chromosome Vu03, Range 1: 70,689,604 to 70,689,680
RAD_1340_7IINoB_per_PTotal_MaxMP,
Final_NoP,
Total_MaxP,
Total_NoB
A/GVigna unguiculata cultivar Xiabao 2 chromosome Vu04, Range 1: 7,129,018 to 7,129,088
RAD_1525_41IIW_per_BFinal_NoMP,
Total_MaxMP
A/CPHAVU_009G248400guncharacterized proteinATPase-coupled transmembrane transporter activity; ATP binding
RAD_1534_20IITotal_MaxF, W_per_B%_F_Ind,
Total_MaxF,
Total_NoF,
Final_NoMP,
Total_MaxMP, %_P_Ind,
Final_NoP,
Total_MaxP, NoB_per_P,
Total_NoB,
W_B,
W_per_B
T/APHAVU_007G000900gExocyst subunit Exo70 family protein exocytosis; protein transport
RAD_2111_42IITotal_NoF%_F_IndT/AVigna unguiculata cultivar Xiabao 2 chromosome Vu11, Range 1: 4,515,333 to 4,515,417
RAD_2341_68IITotal_MaxF,
Total_NoF,
Final_NoP,
W_B
%_F_Ind,
Total_MaxF,
Total_NoF,
Final_NoP
C/TPHAVU_010G032700gprotein transport protein SEC23zinc ion bindingCOPII-coated vesicle budding; intracellular protein transport
RAD_2589_39IIW_per_BFinal_NoMPT/CVigna angularis var. angularis DNA, chromosome 8, Range 1: 13,616,071 to 13,616,149
RAD_3146_19IINoB_per_P,
W_per_B
Total_MaxF,
Total_NoF,
Total_MaxMP
C/TPHAVU_003G137000gbeta-galactosidasebeta-galactosidase activity; carbohydrate bindingcarbohydrate metabolic process
RAD_3232_18IIW_per_B%_P_Ind,
Final_NoP,
Total_MaxP
T/CVigna unguiculata cultivar Xiabao 2 chromosome LG9, Range 1: 25,868,642 to 25,868,730
RAD_3235_24IIW_BFinal_NoMP,
Total_MaxMP
T/CVigna unguiculata vacuolar protein sorting-associated protein 54, chloroplastic (LOC114163195)vacuolar protein sorting-associated protein 54 endocytic recycling; retrograde transport, endosome to Golgi
RAD_3342_71IITotal_MaxF,
Total_NoF
%_F_IndG/TVigna unguiculata cultivar Xiabao 2 chromosome Vu03, Range 1: 80,449,805 to 80,449,873
RAD_3432_30IW_per_BNAA/GVigna angularis var. angularis DNA, chromosome 8, Range 1: 14,570,377 to 14,570,462
RAD_3517_34IFinal_NoPNAC/TPHAVU_001G190500guncharacterized protein
RAD_4014_50IIW_per_B%_F_IndG/CPHAVU_002G205700guncharacterized protein defense response to fungus
Publisher’s Note: MDPI stays neutral with regard to jurisdictional claims in published maps and institutional affiliations.

