
Interactions between Diffuse Light and Cucumber (Cucumis sativus L.) Canopy Structure, Simulations of Light Interception in Virtual Canopies

 , ,
, ,  ,
, 
Abstract
:1. Introduction
2. Materials and Methods
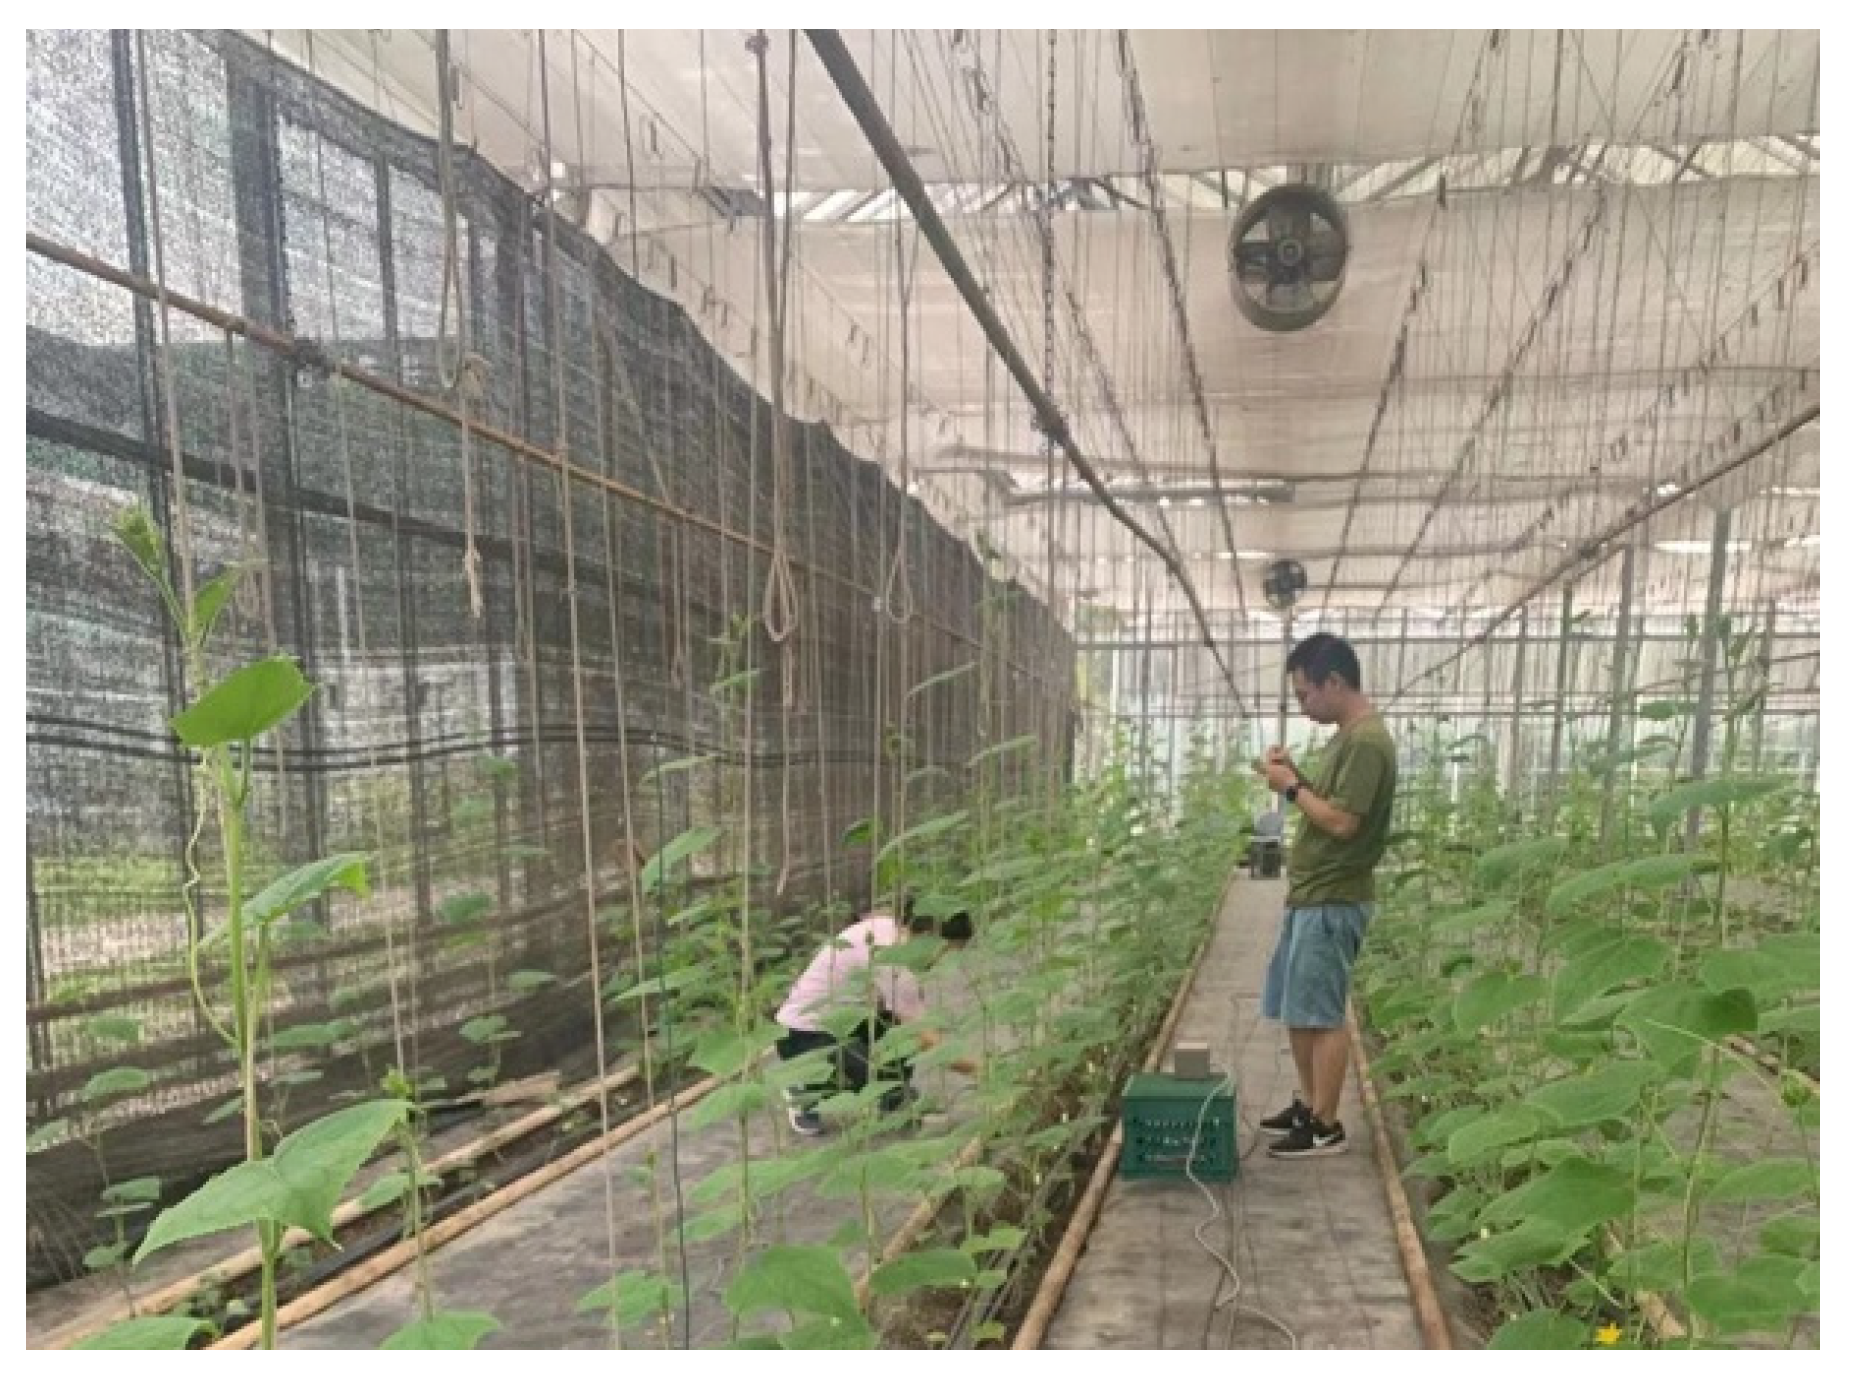
2.1. Plant Material
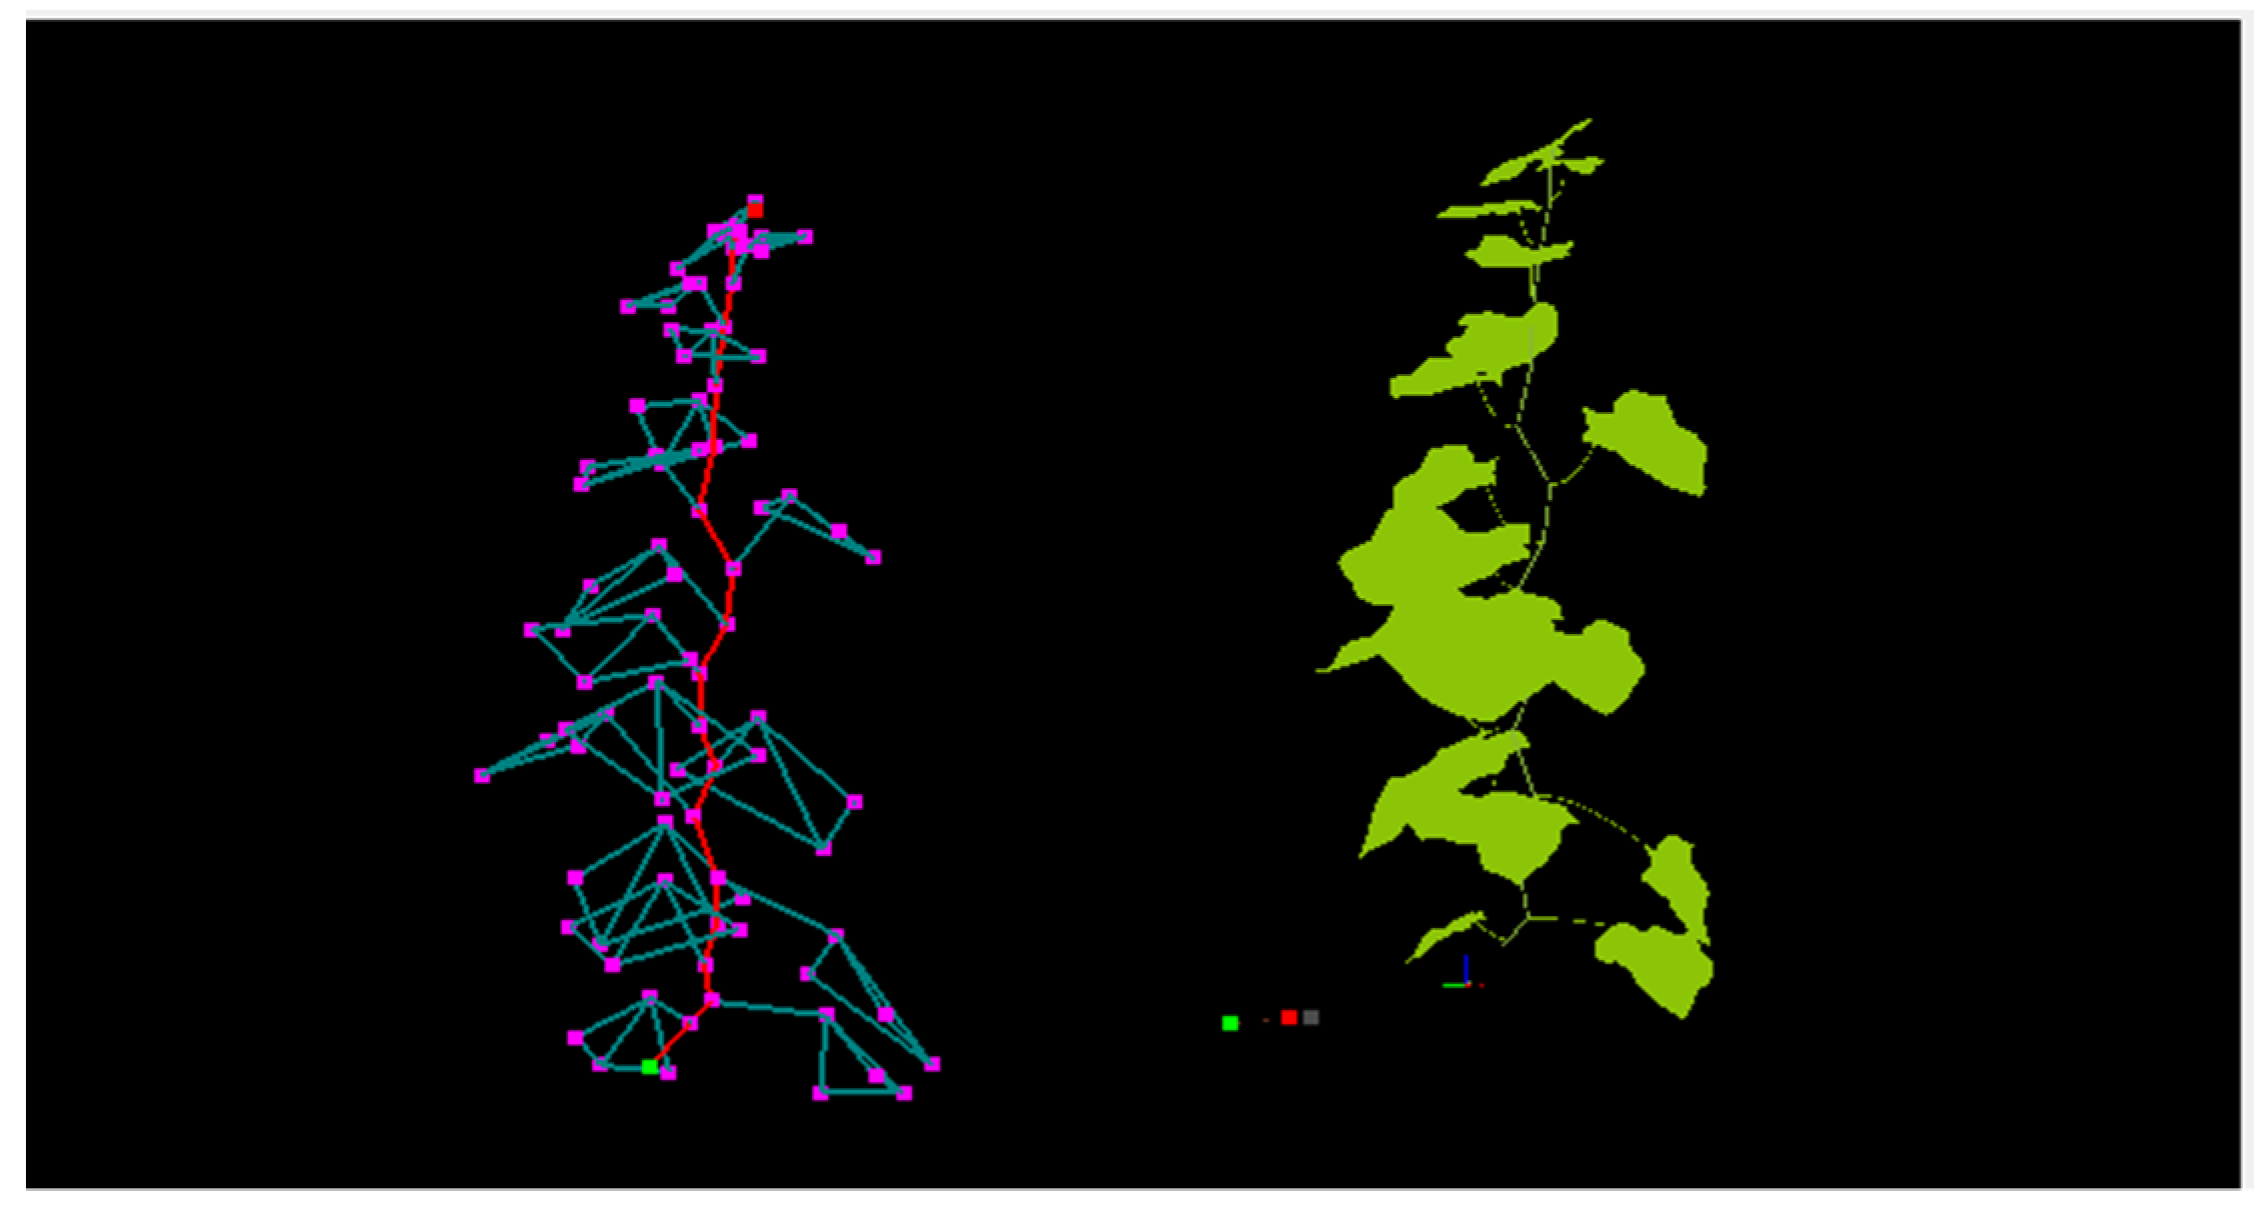
2.2. Simulation of 3D Structural Model
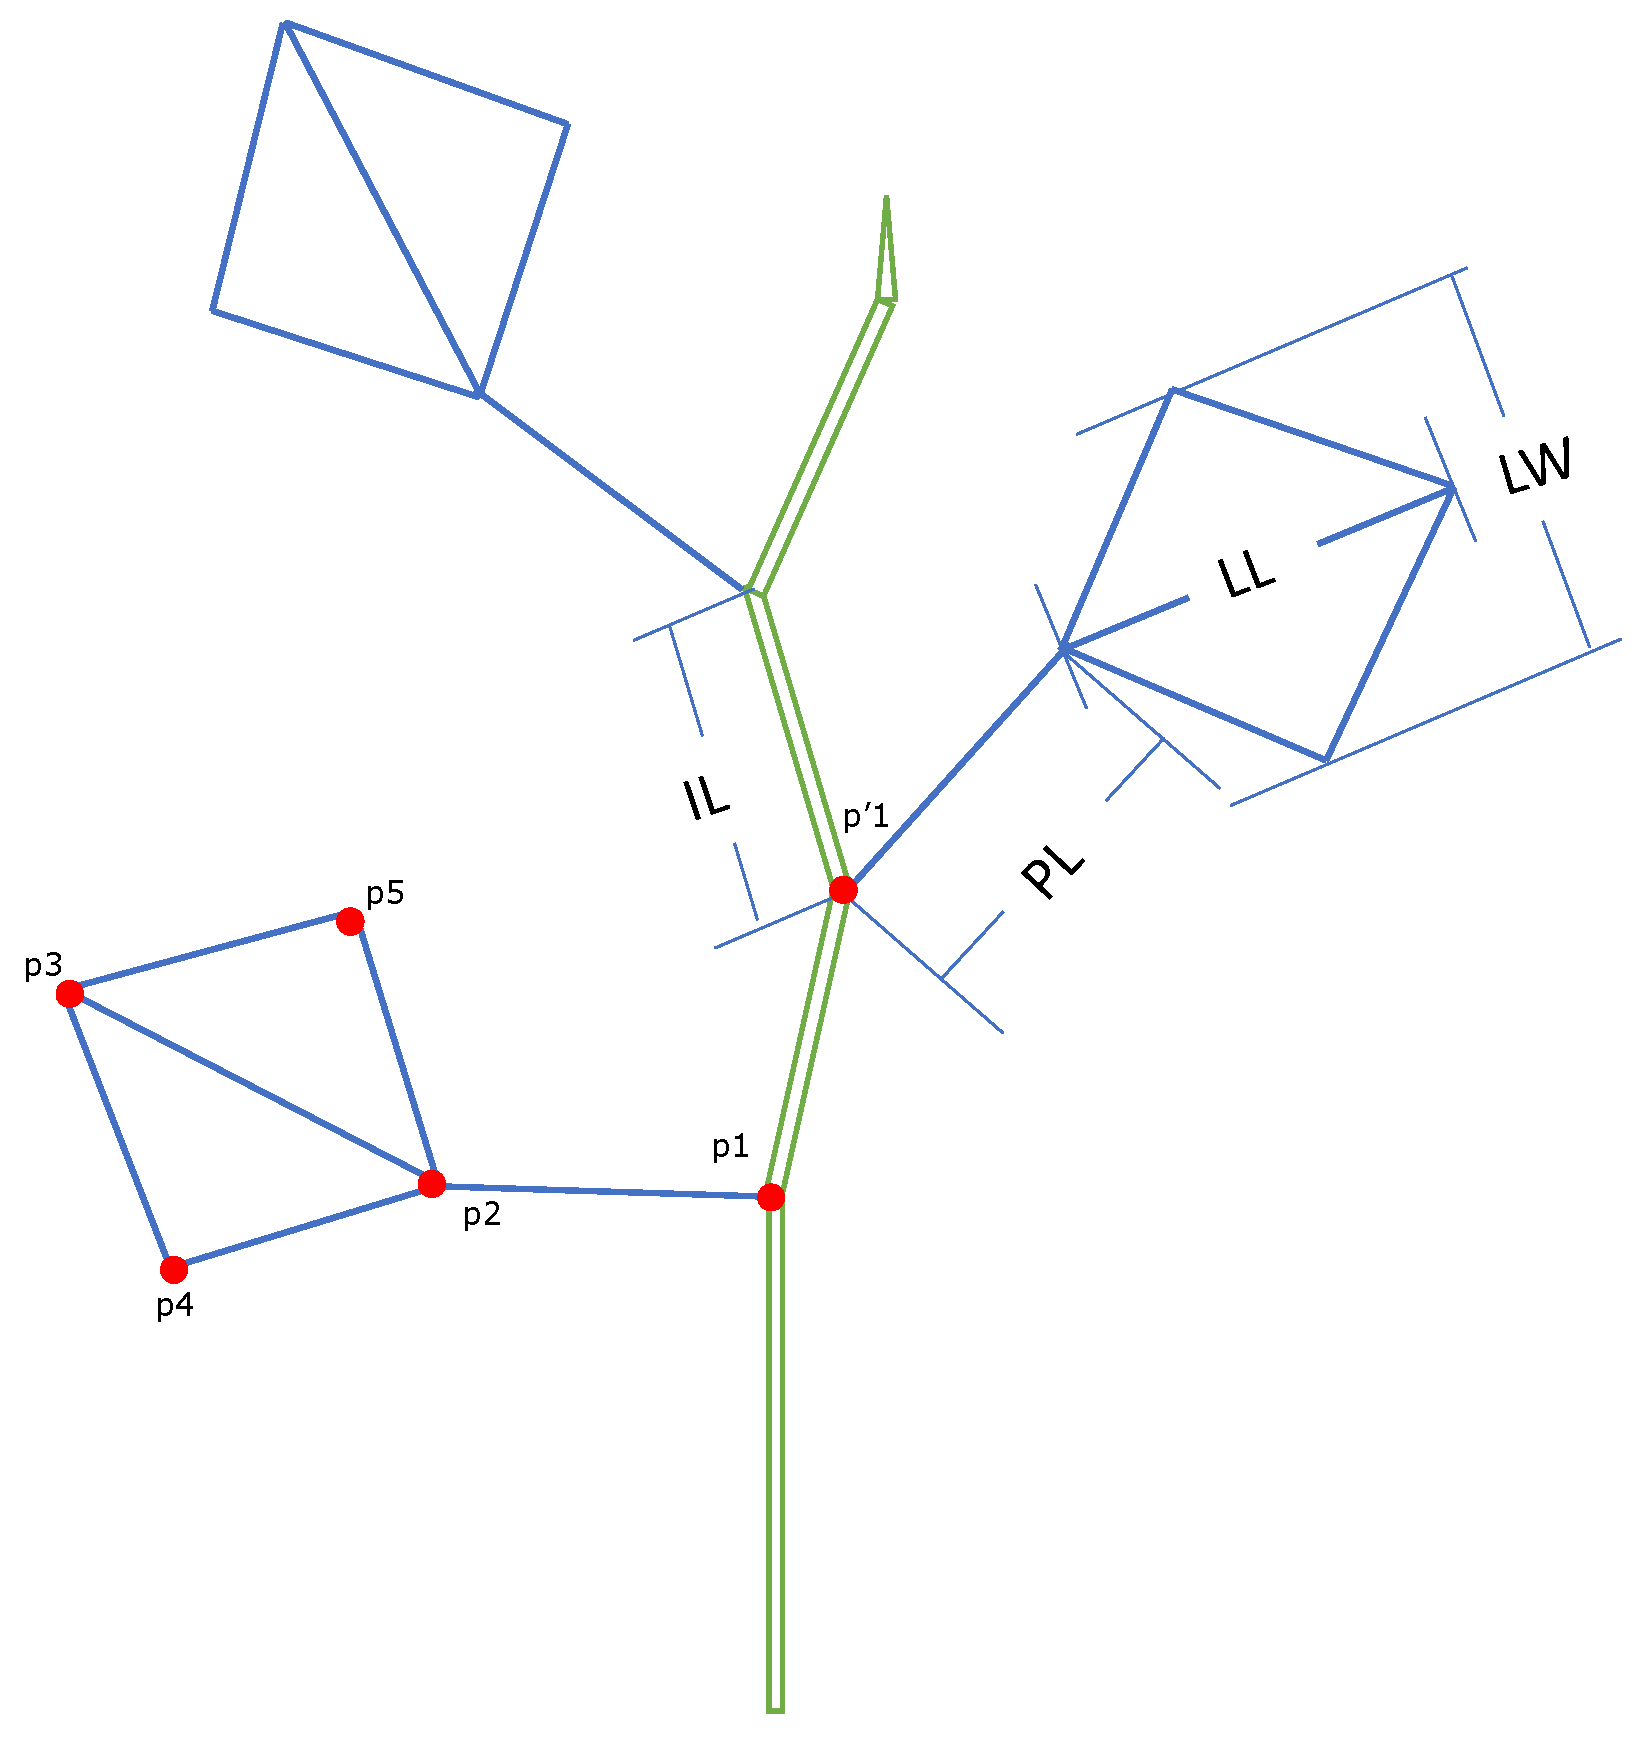
2.2.1. Data Collection and 3D Structural Digitization
2.2.2. The Simulation Settings
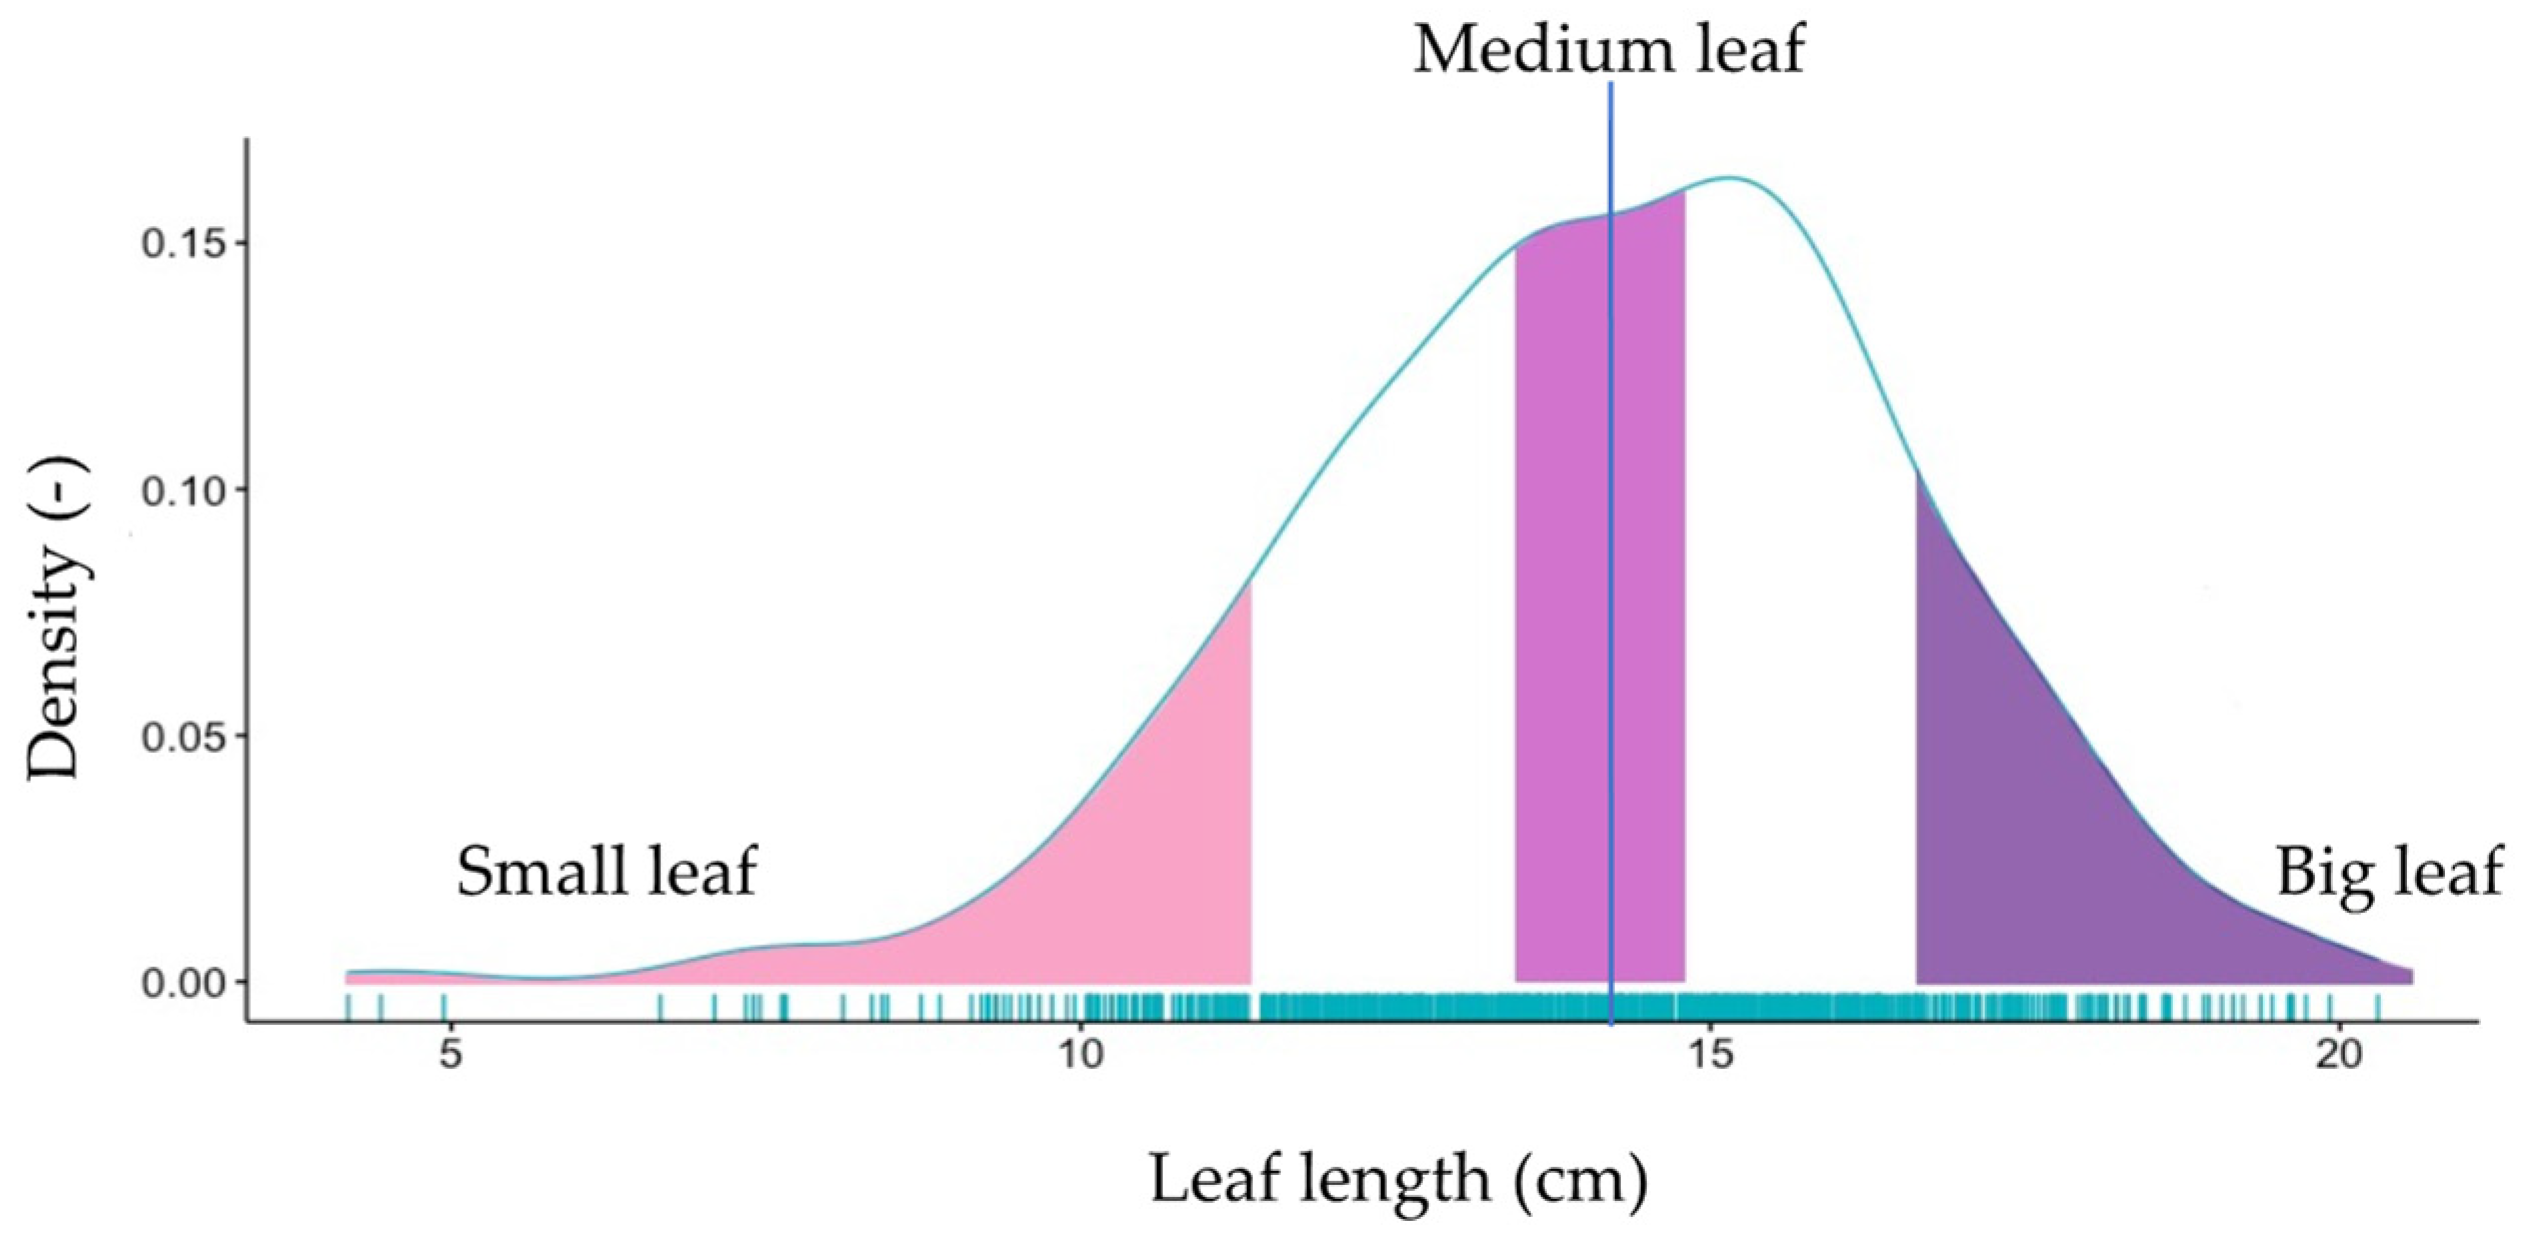
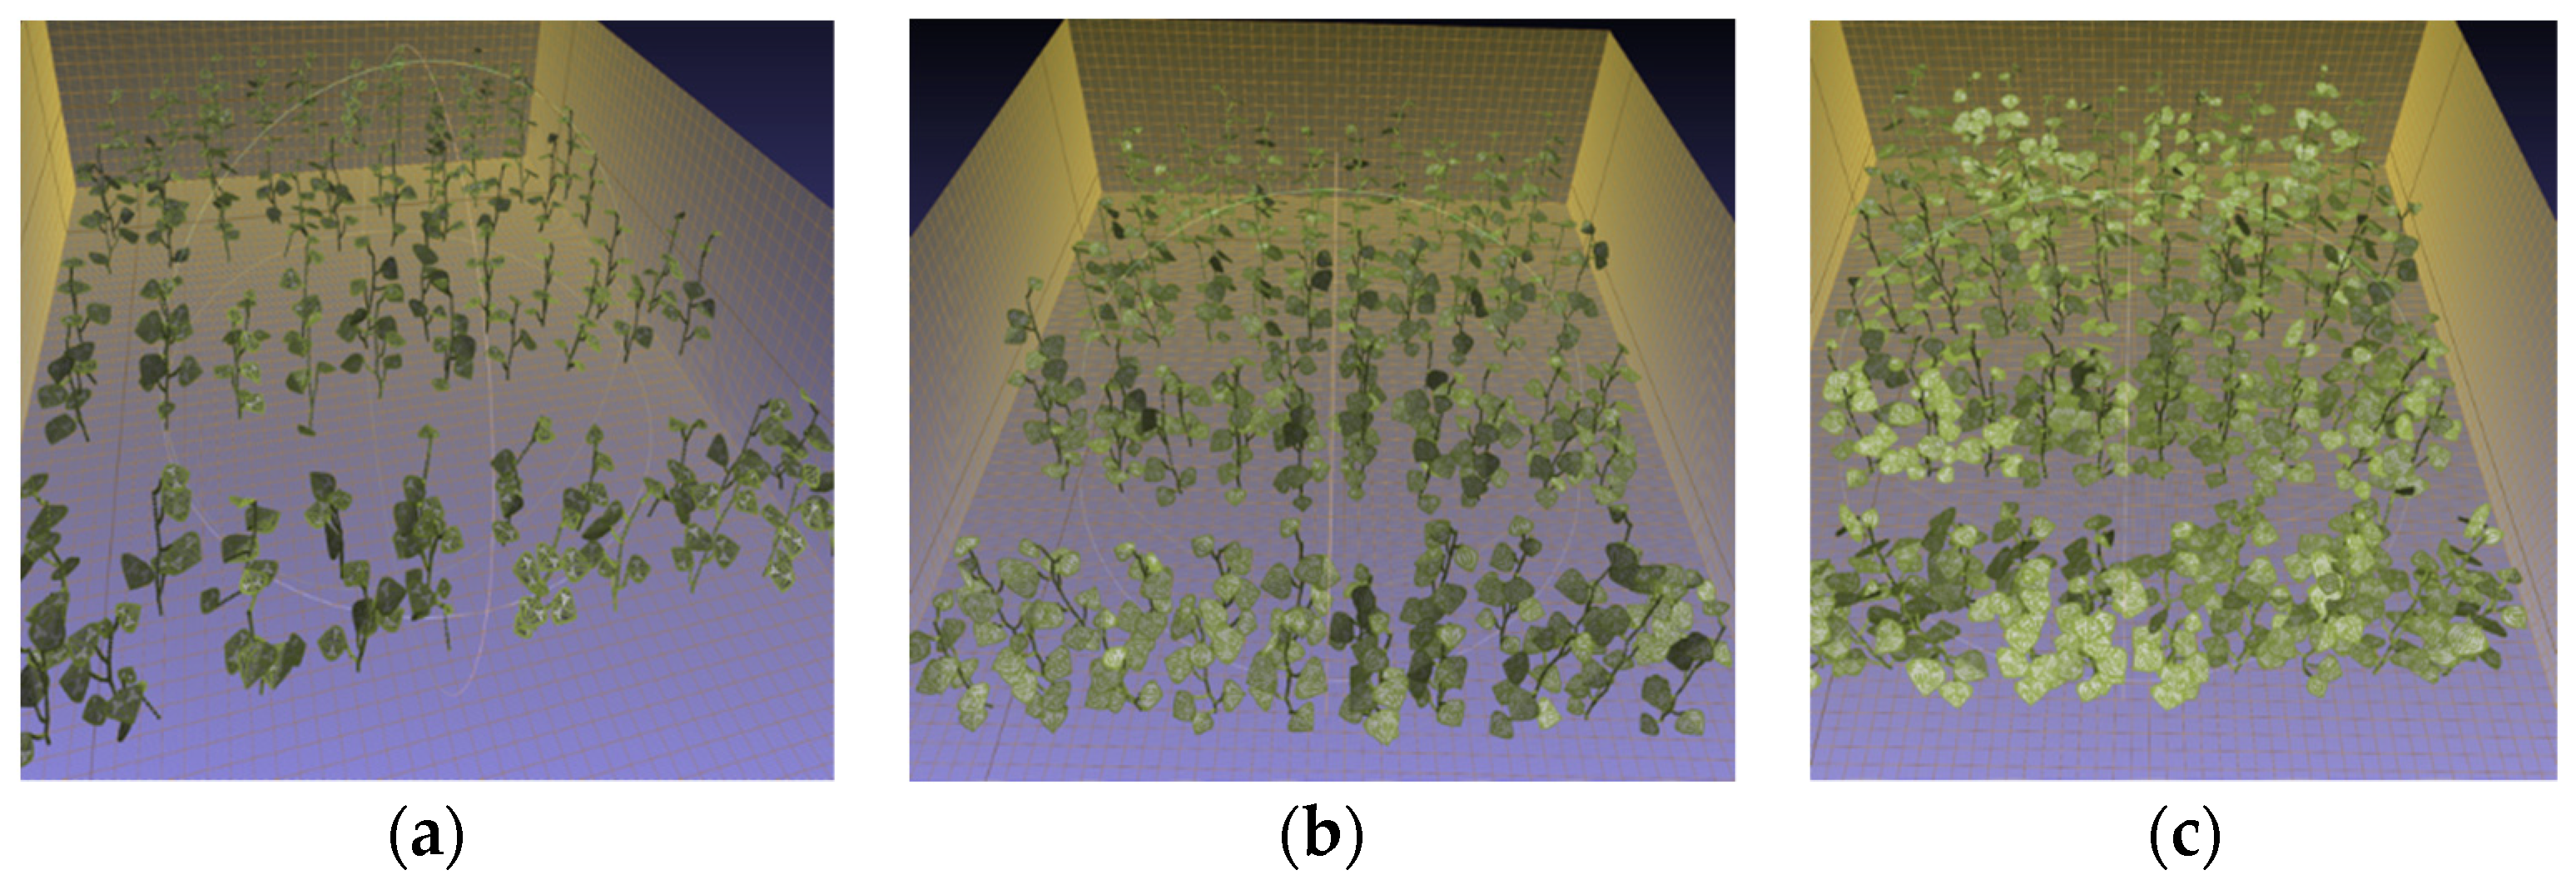
- Three virtual canopies
- The scenarios of light conditions
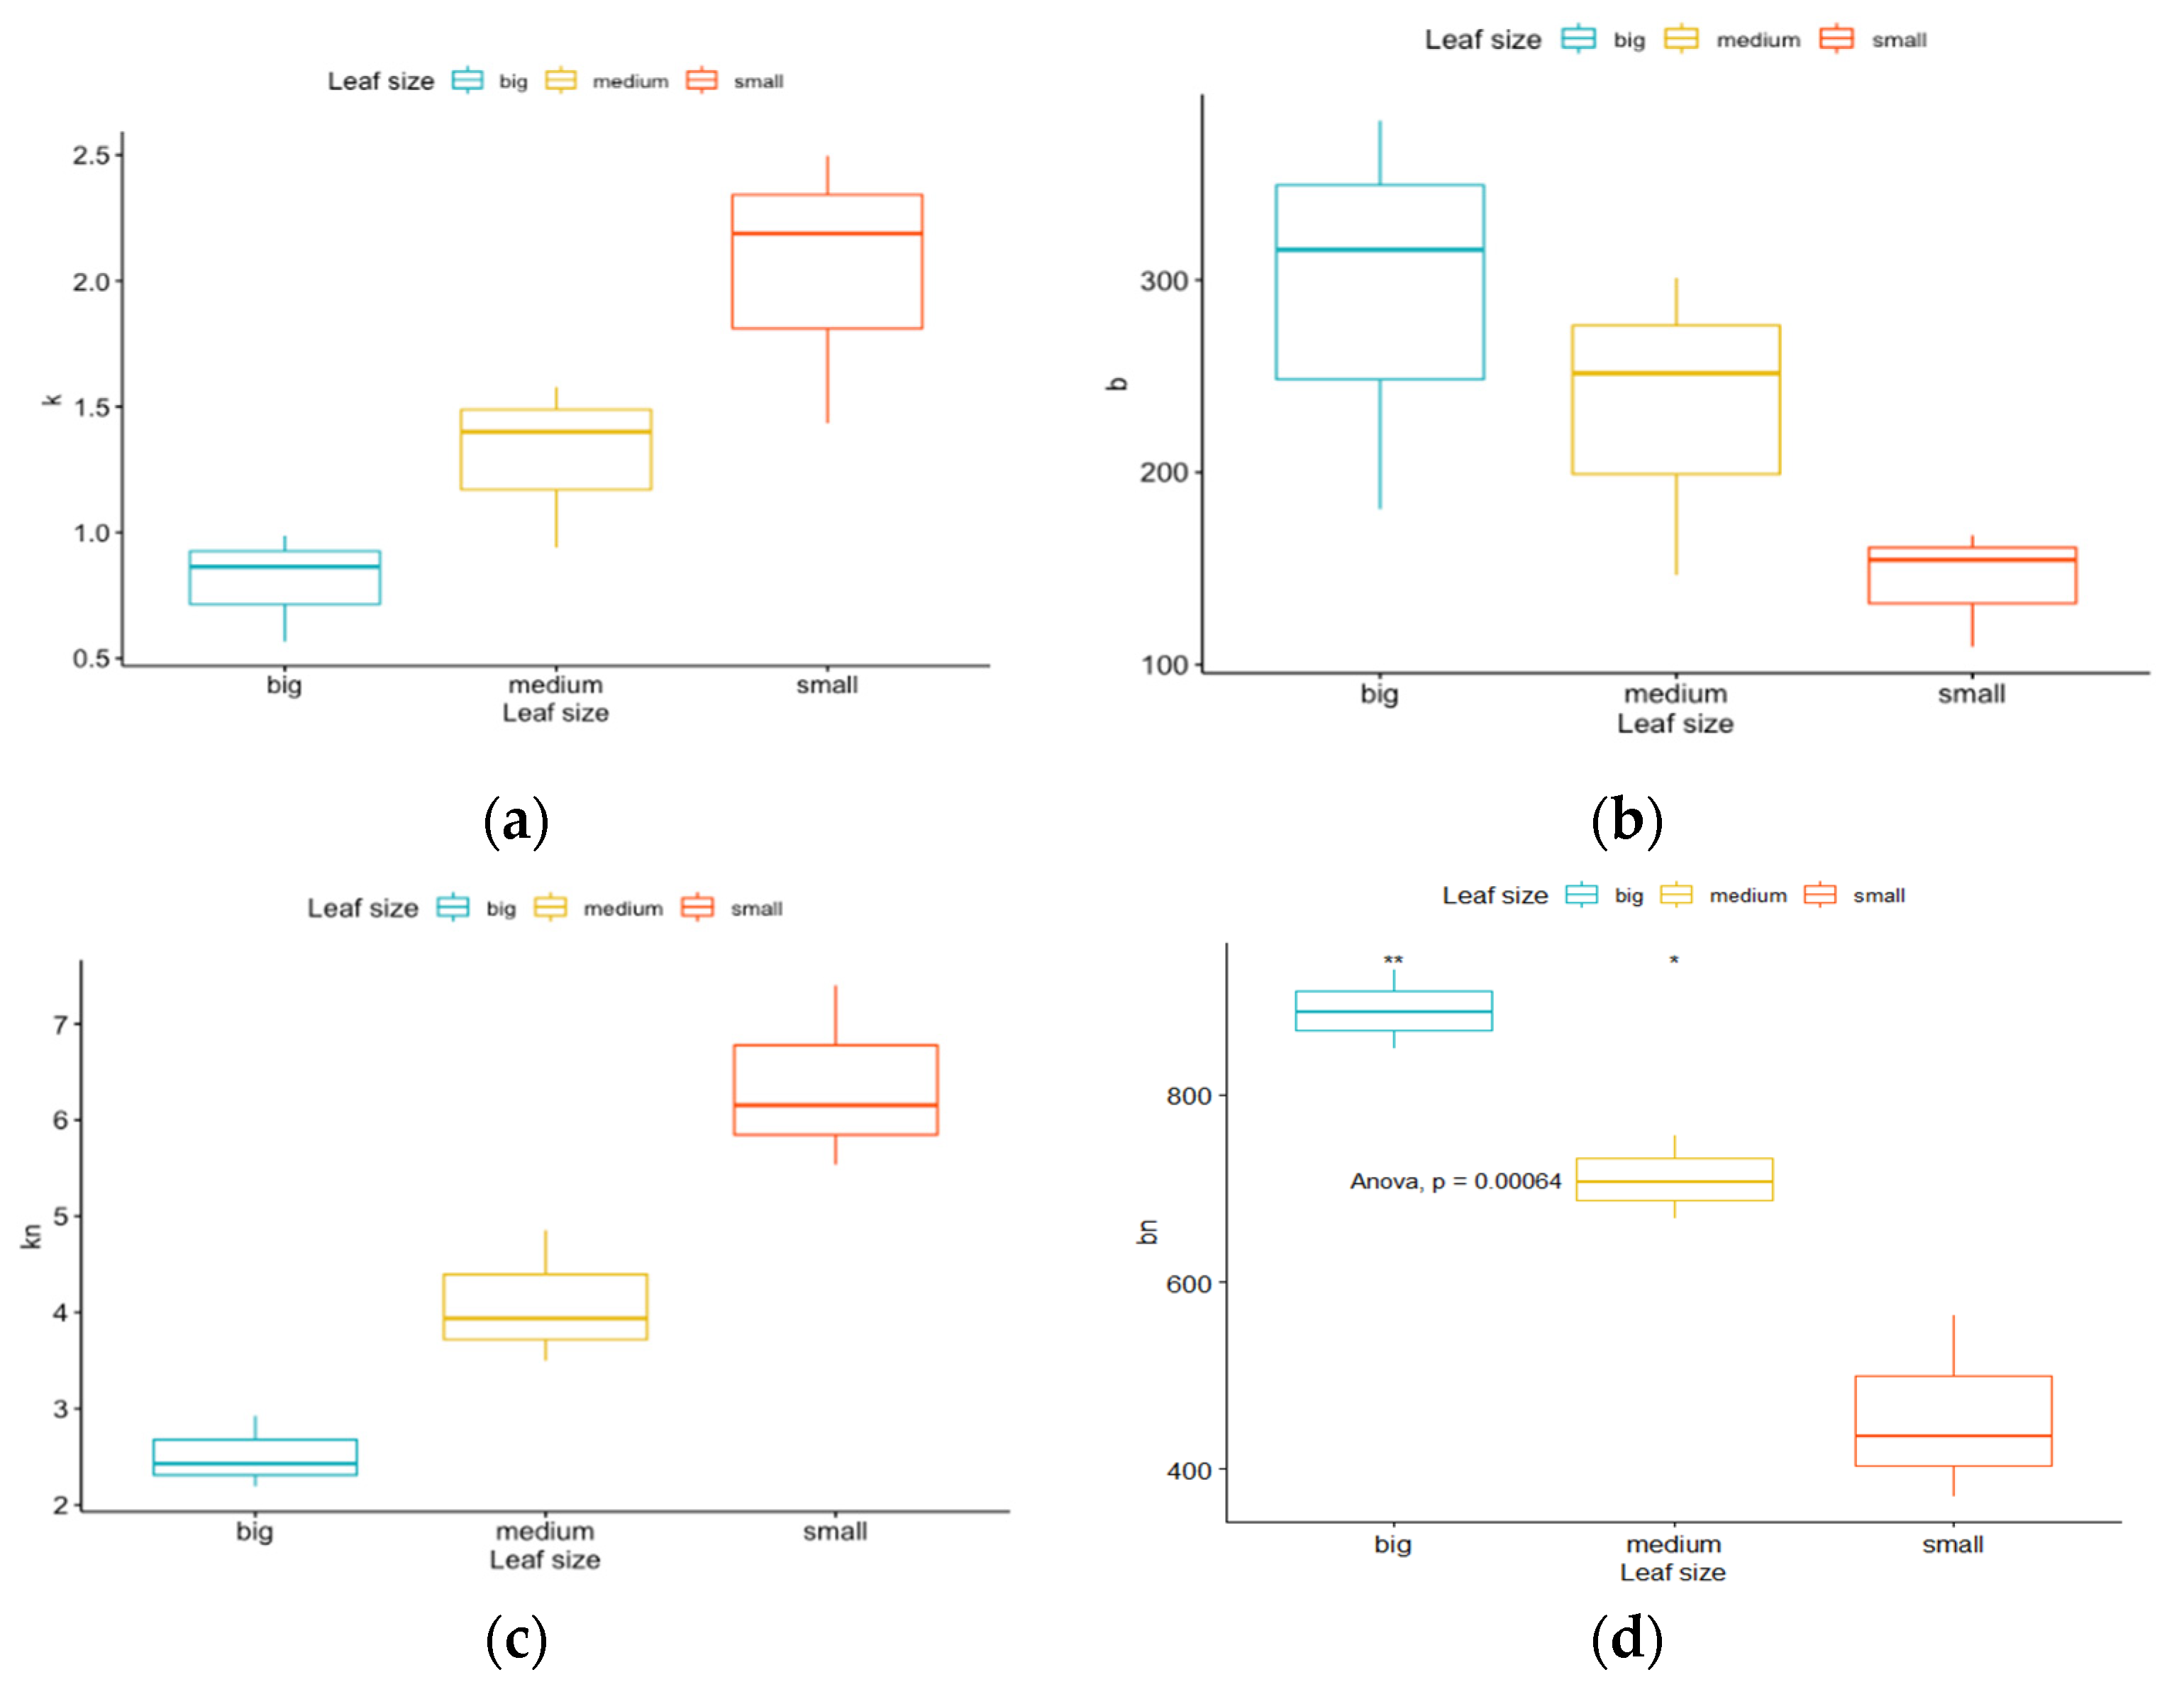
2.3. Data Analysis
- -
- the slopes (k and kn) represented the efficiency of light penetration into the canopy.
- -
- the intercepts (b and bn) indicated either the projected leaf area or total incident radiation depending on the comparison.
3. Results
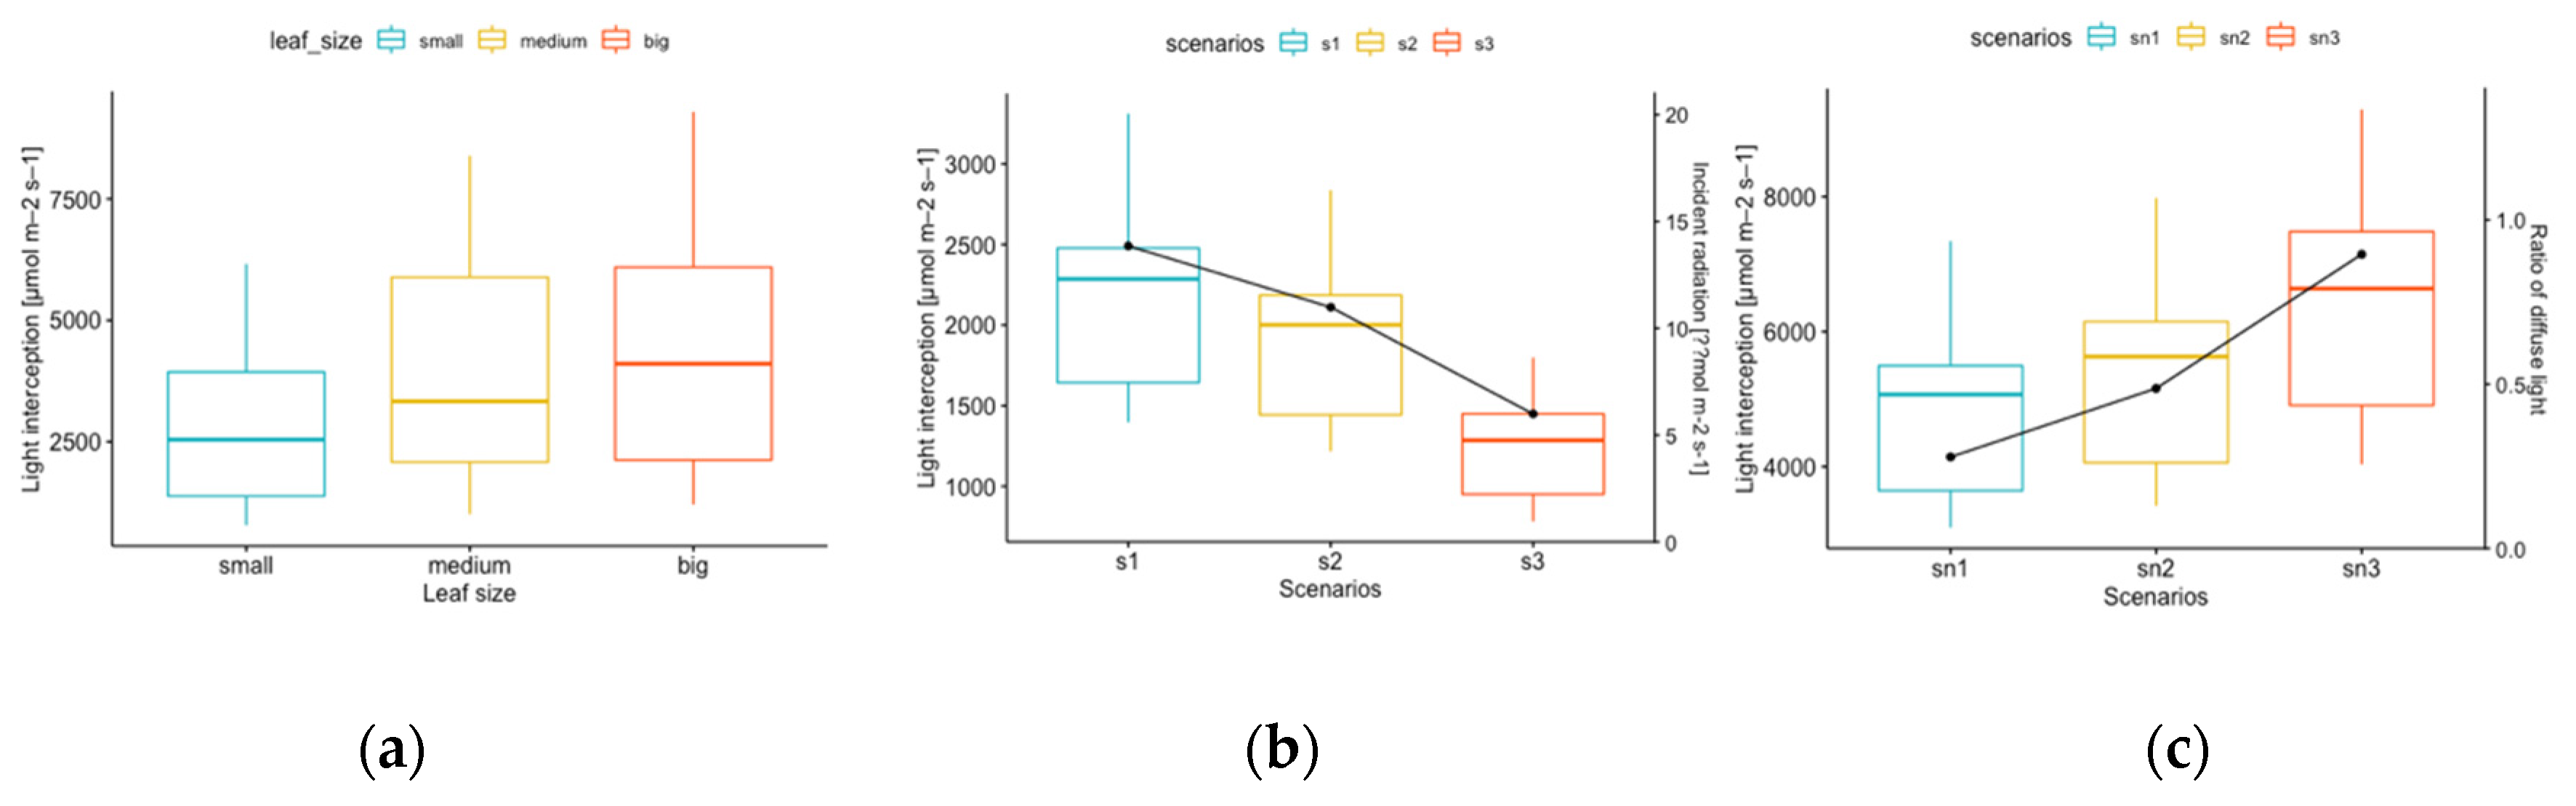
3.1. The Simulated Results of Light Interception
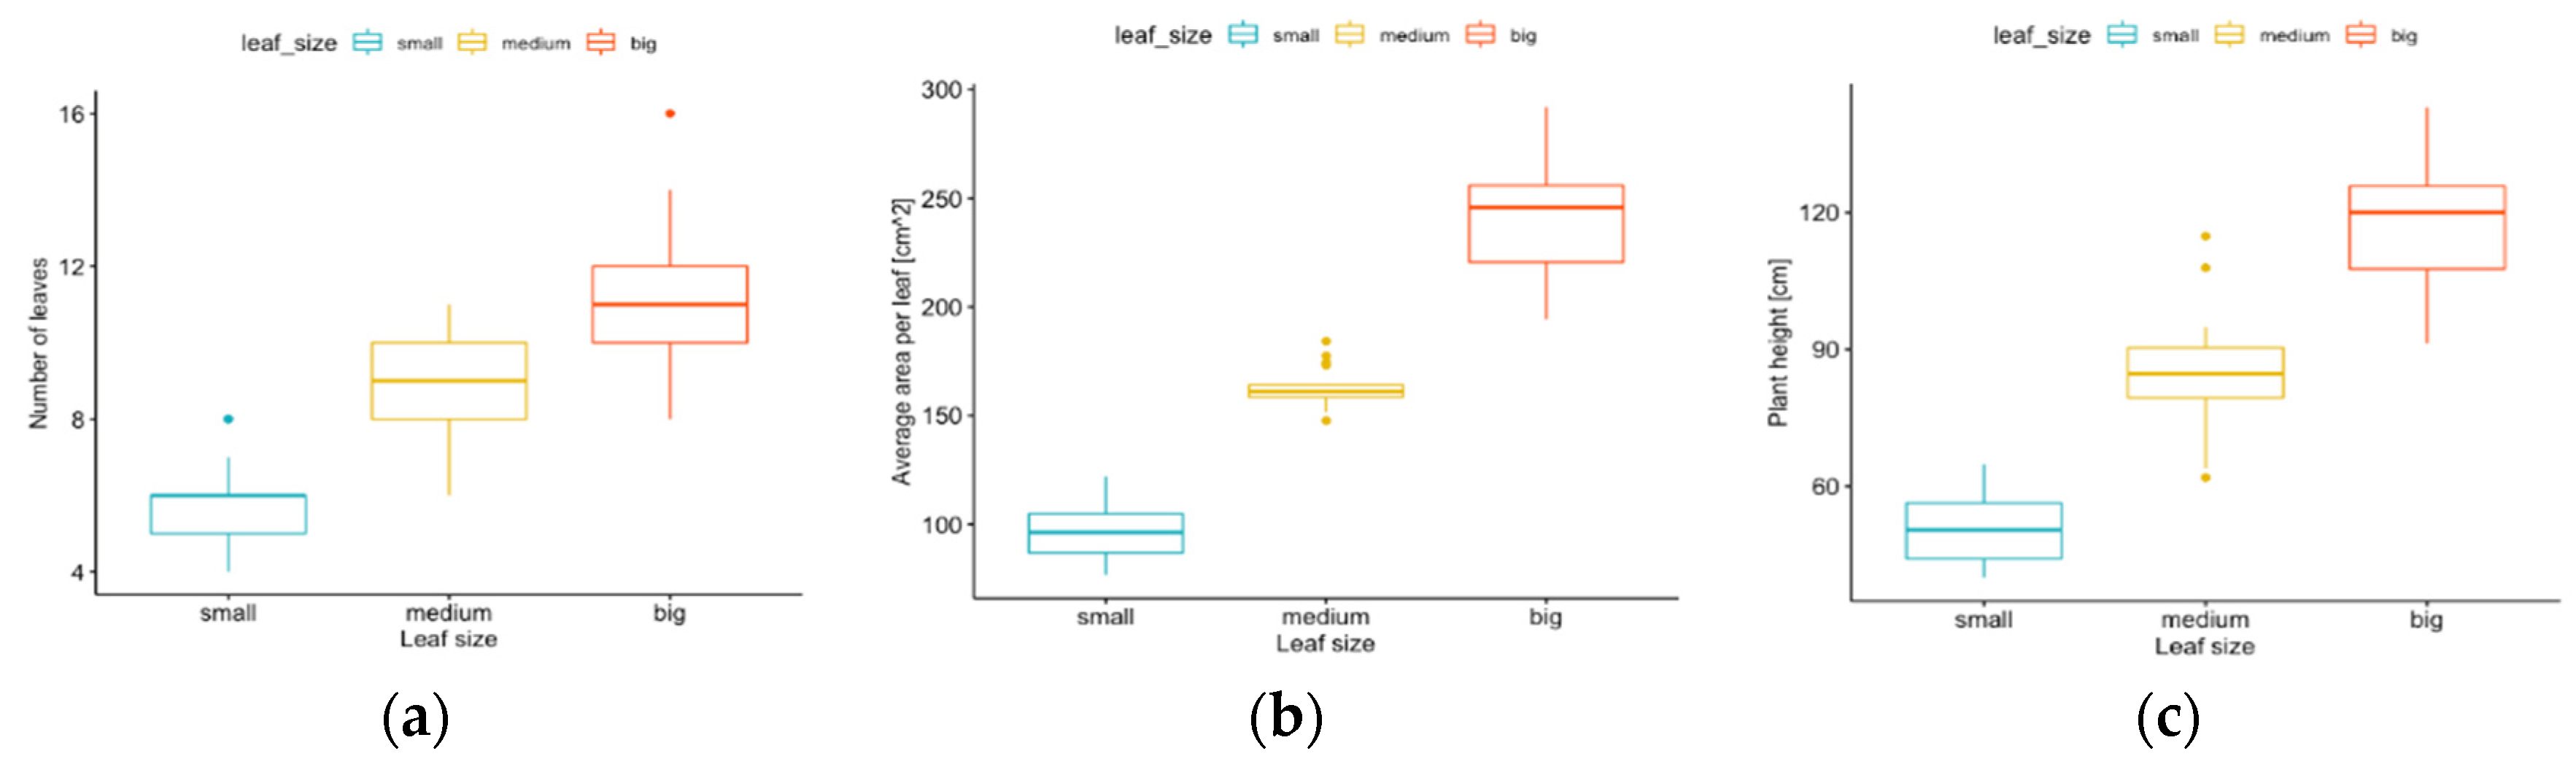
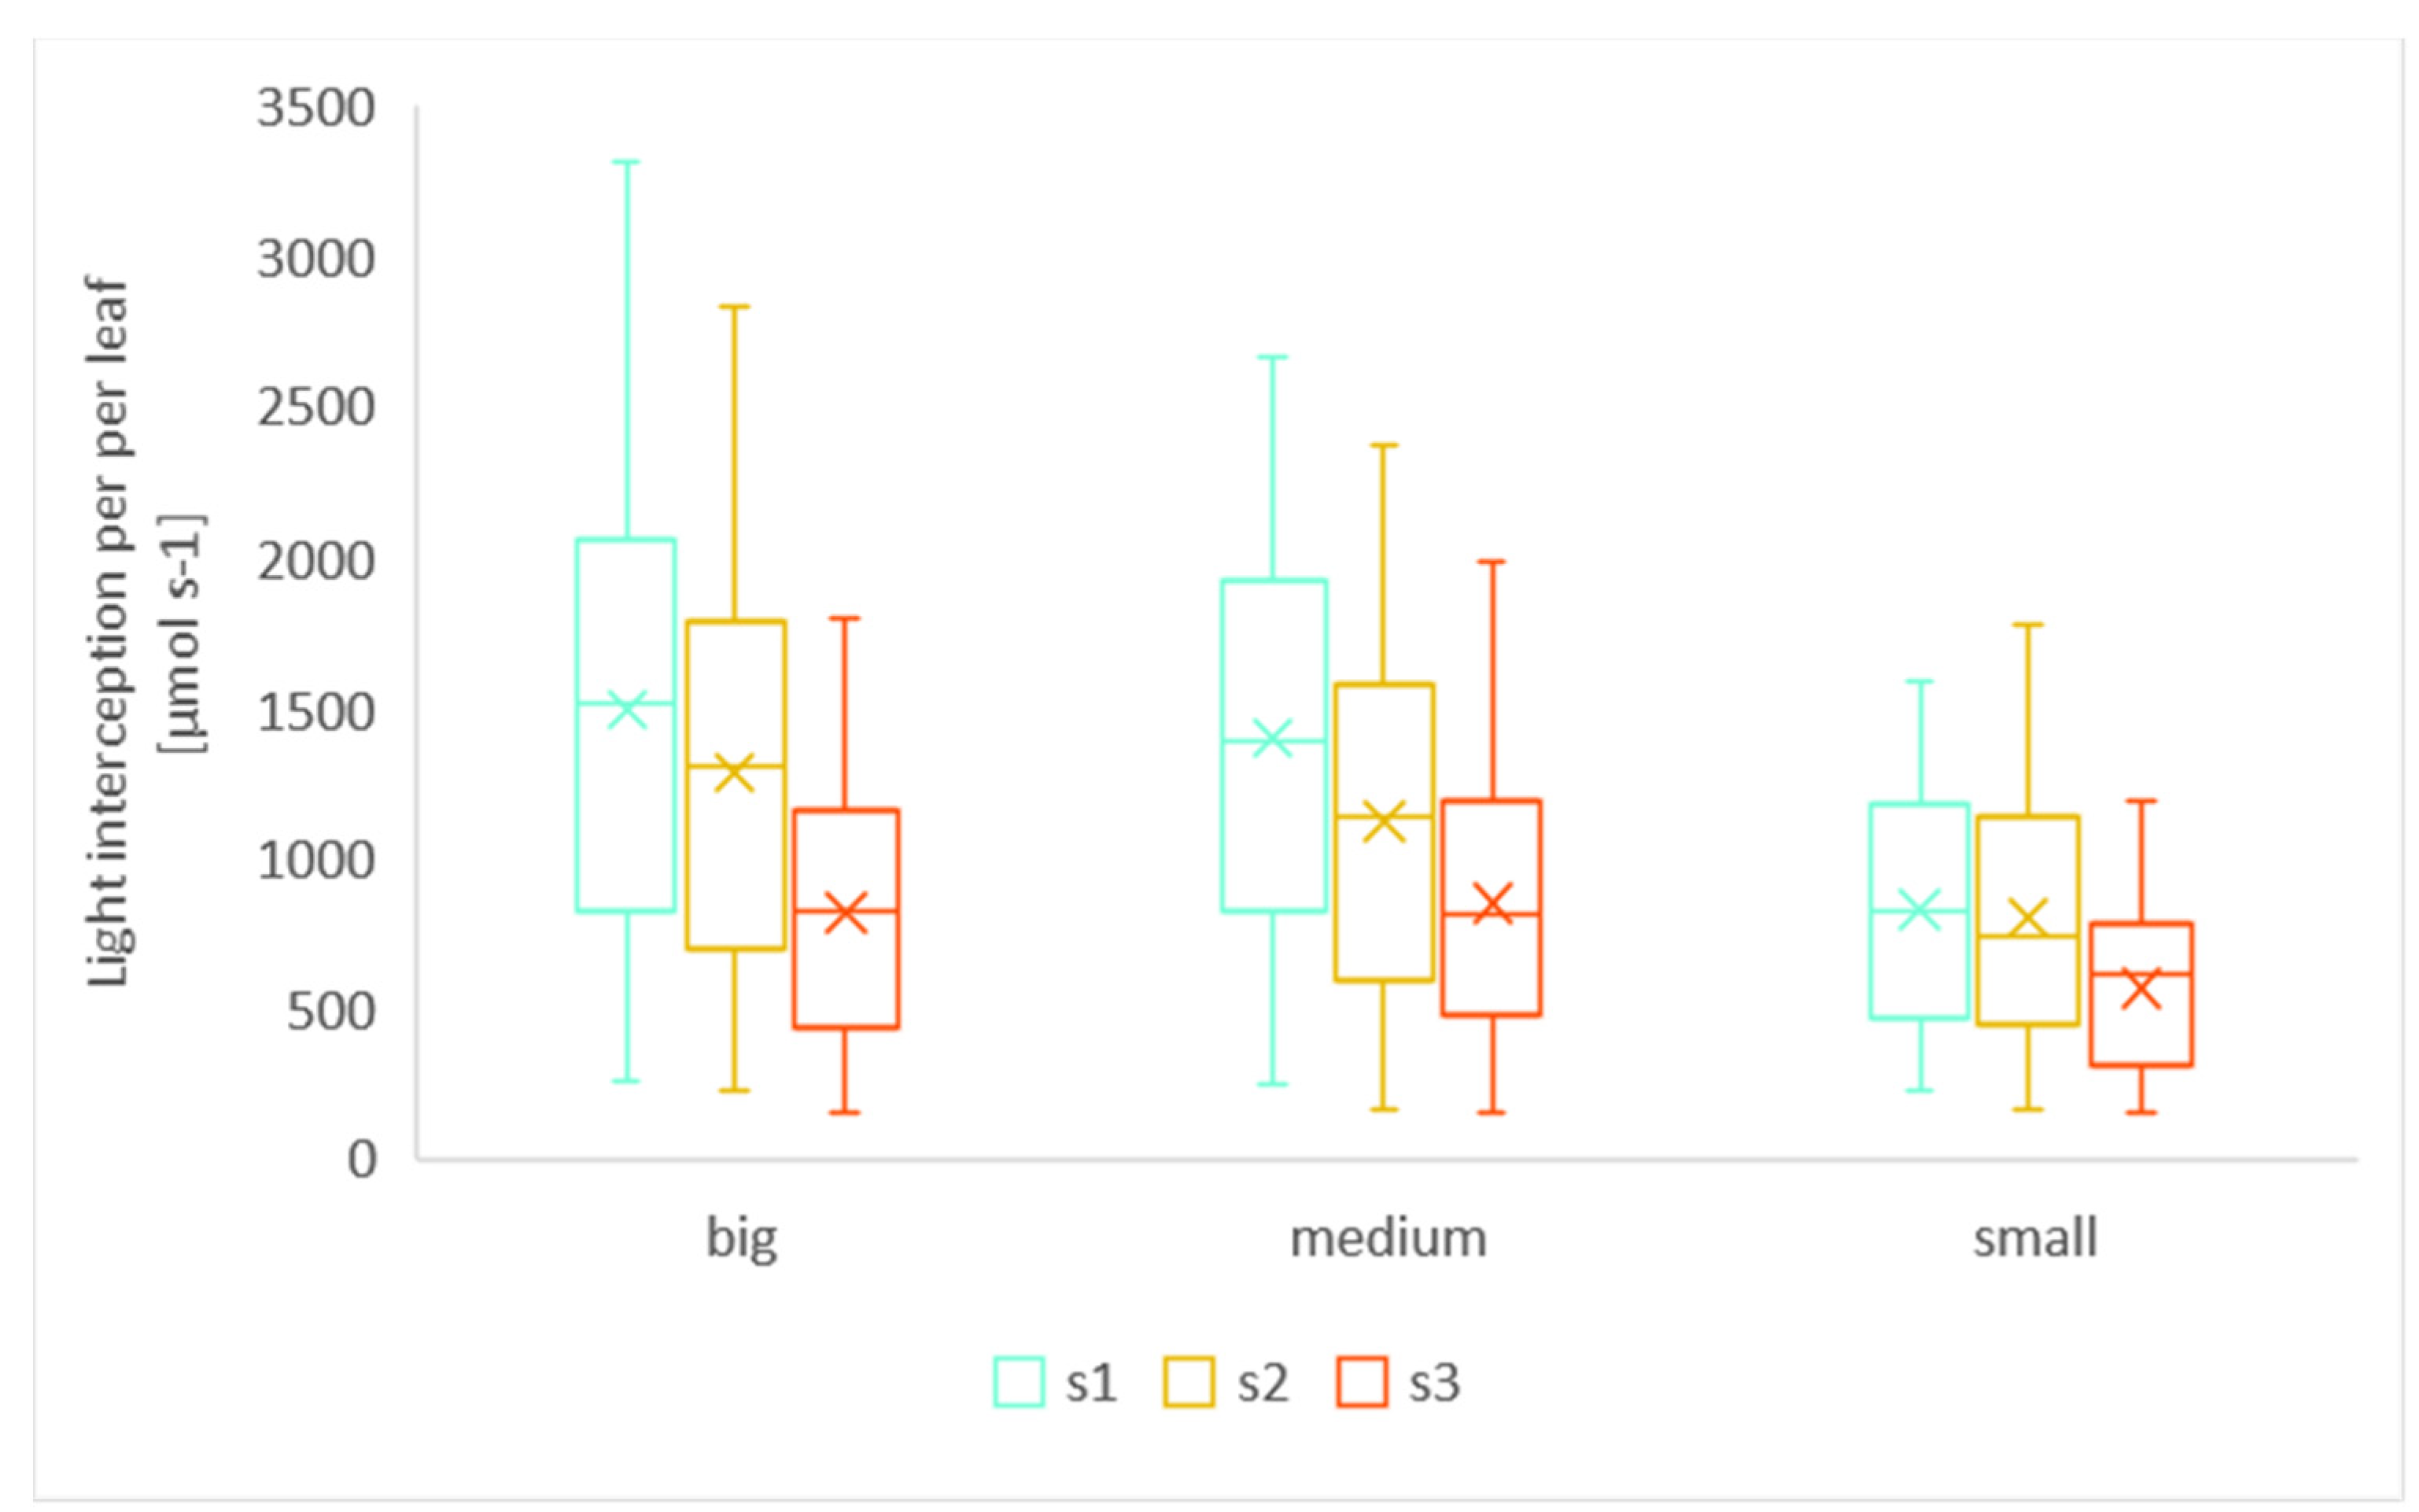
3.1.1. Leaf Size
3.1.2. Scenarios with Different Light Conditions
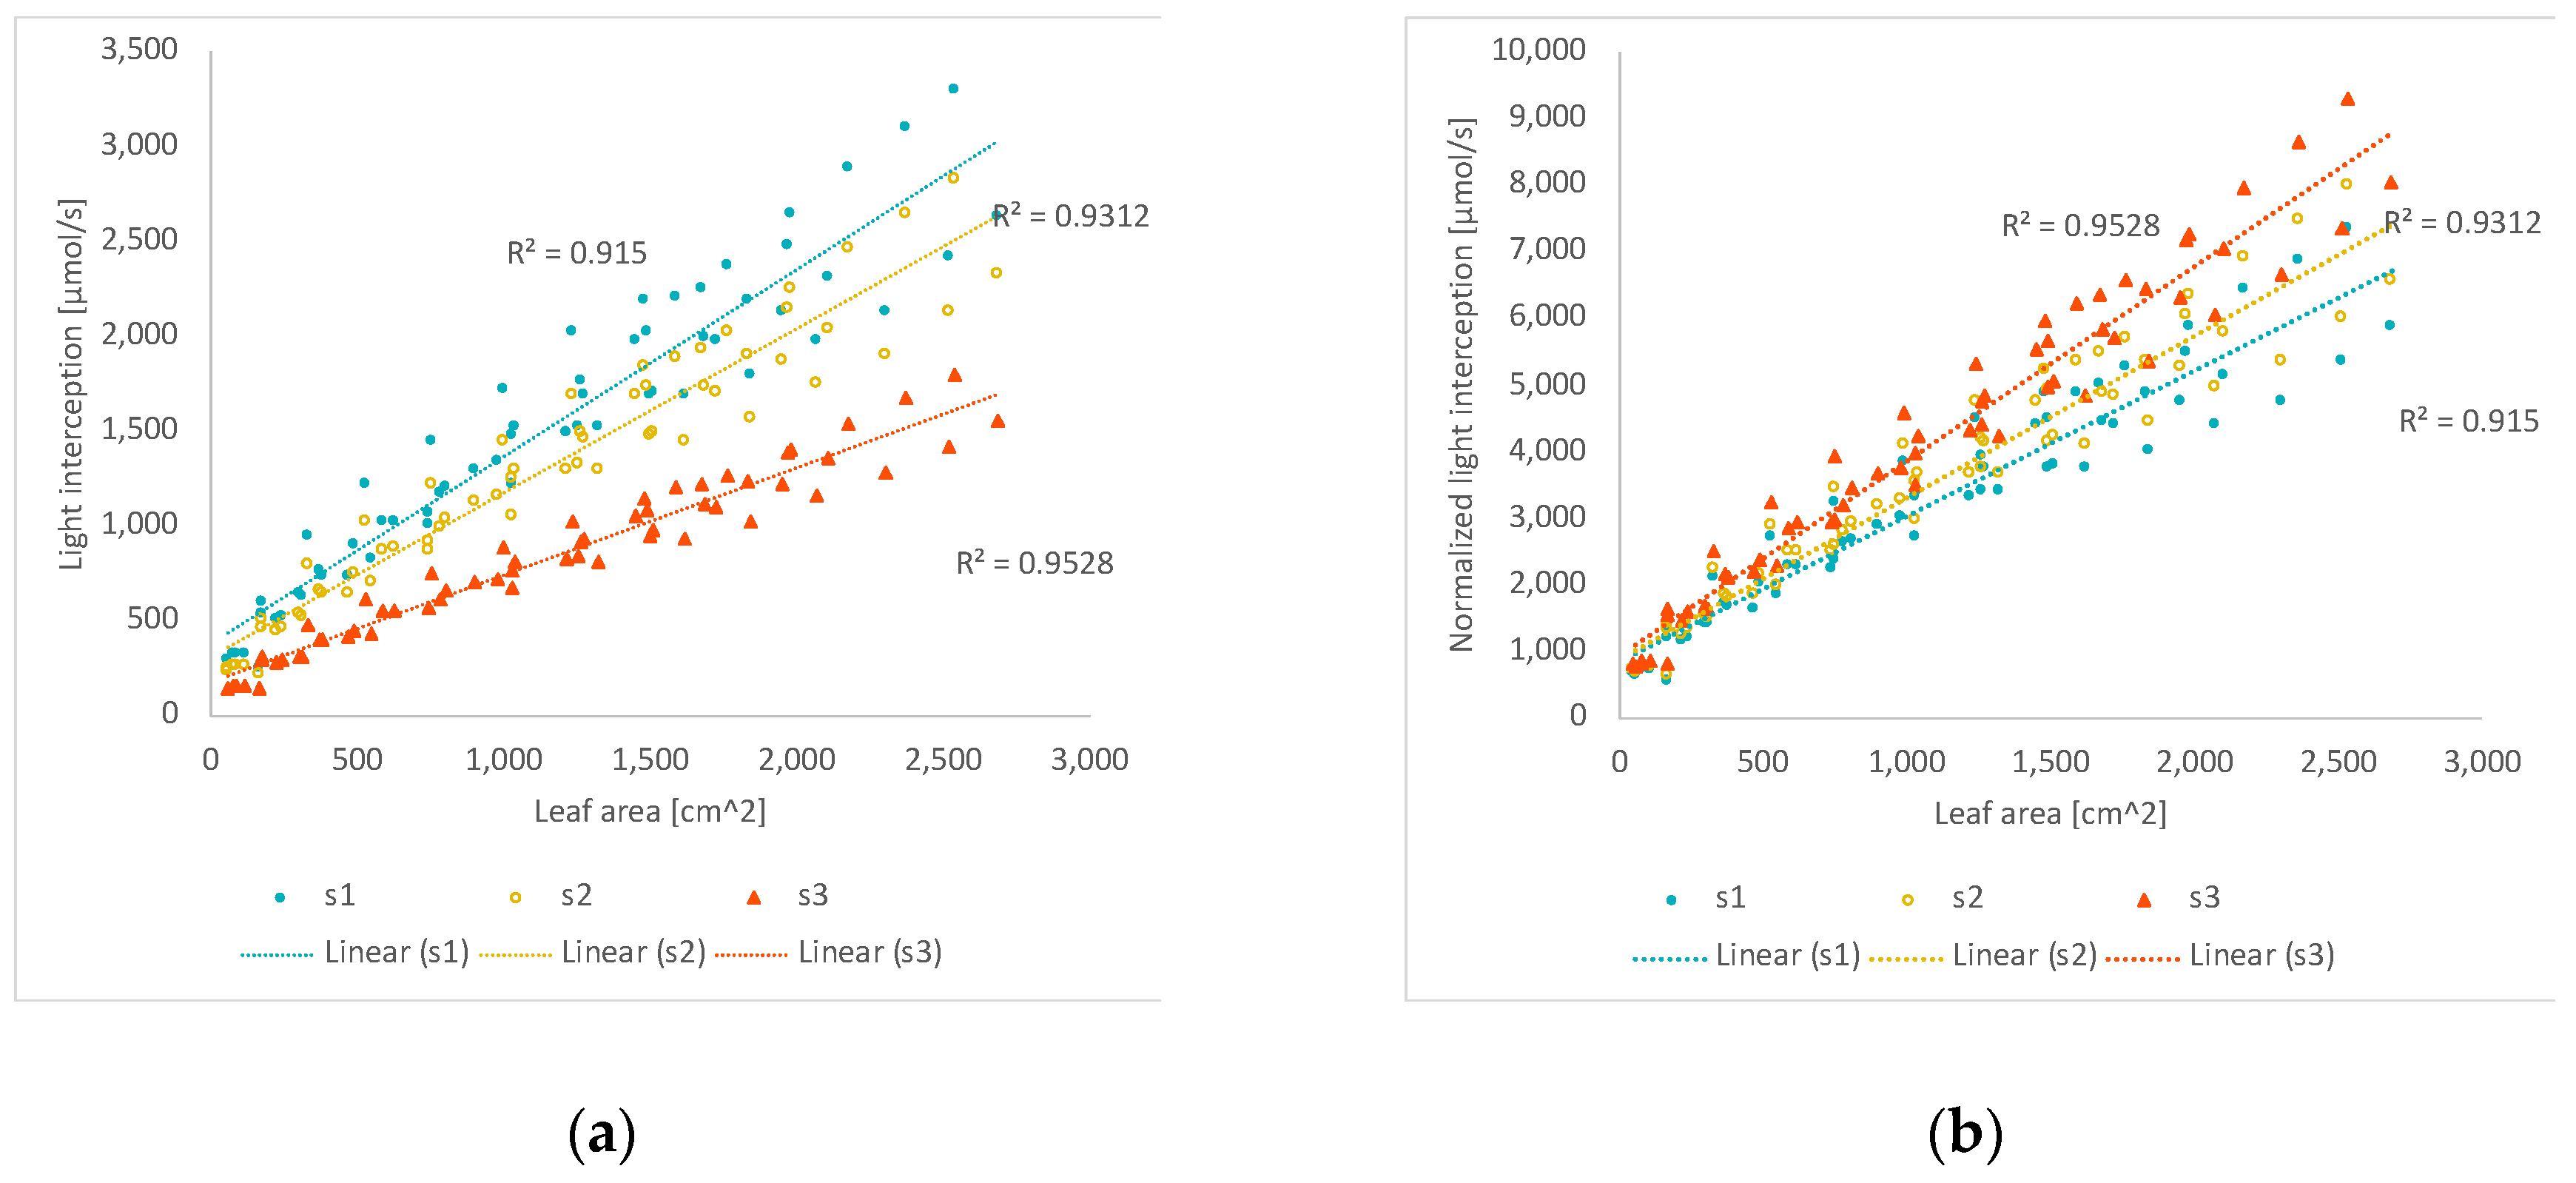
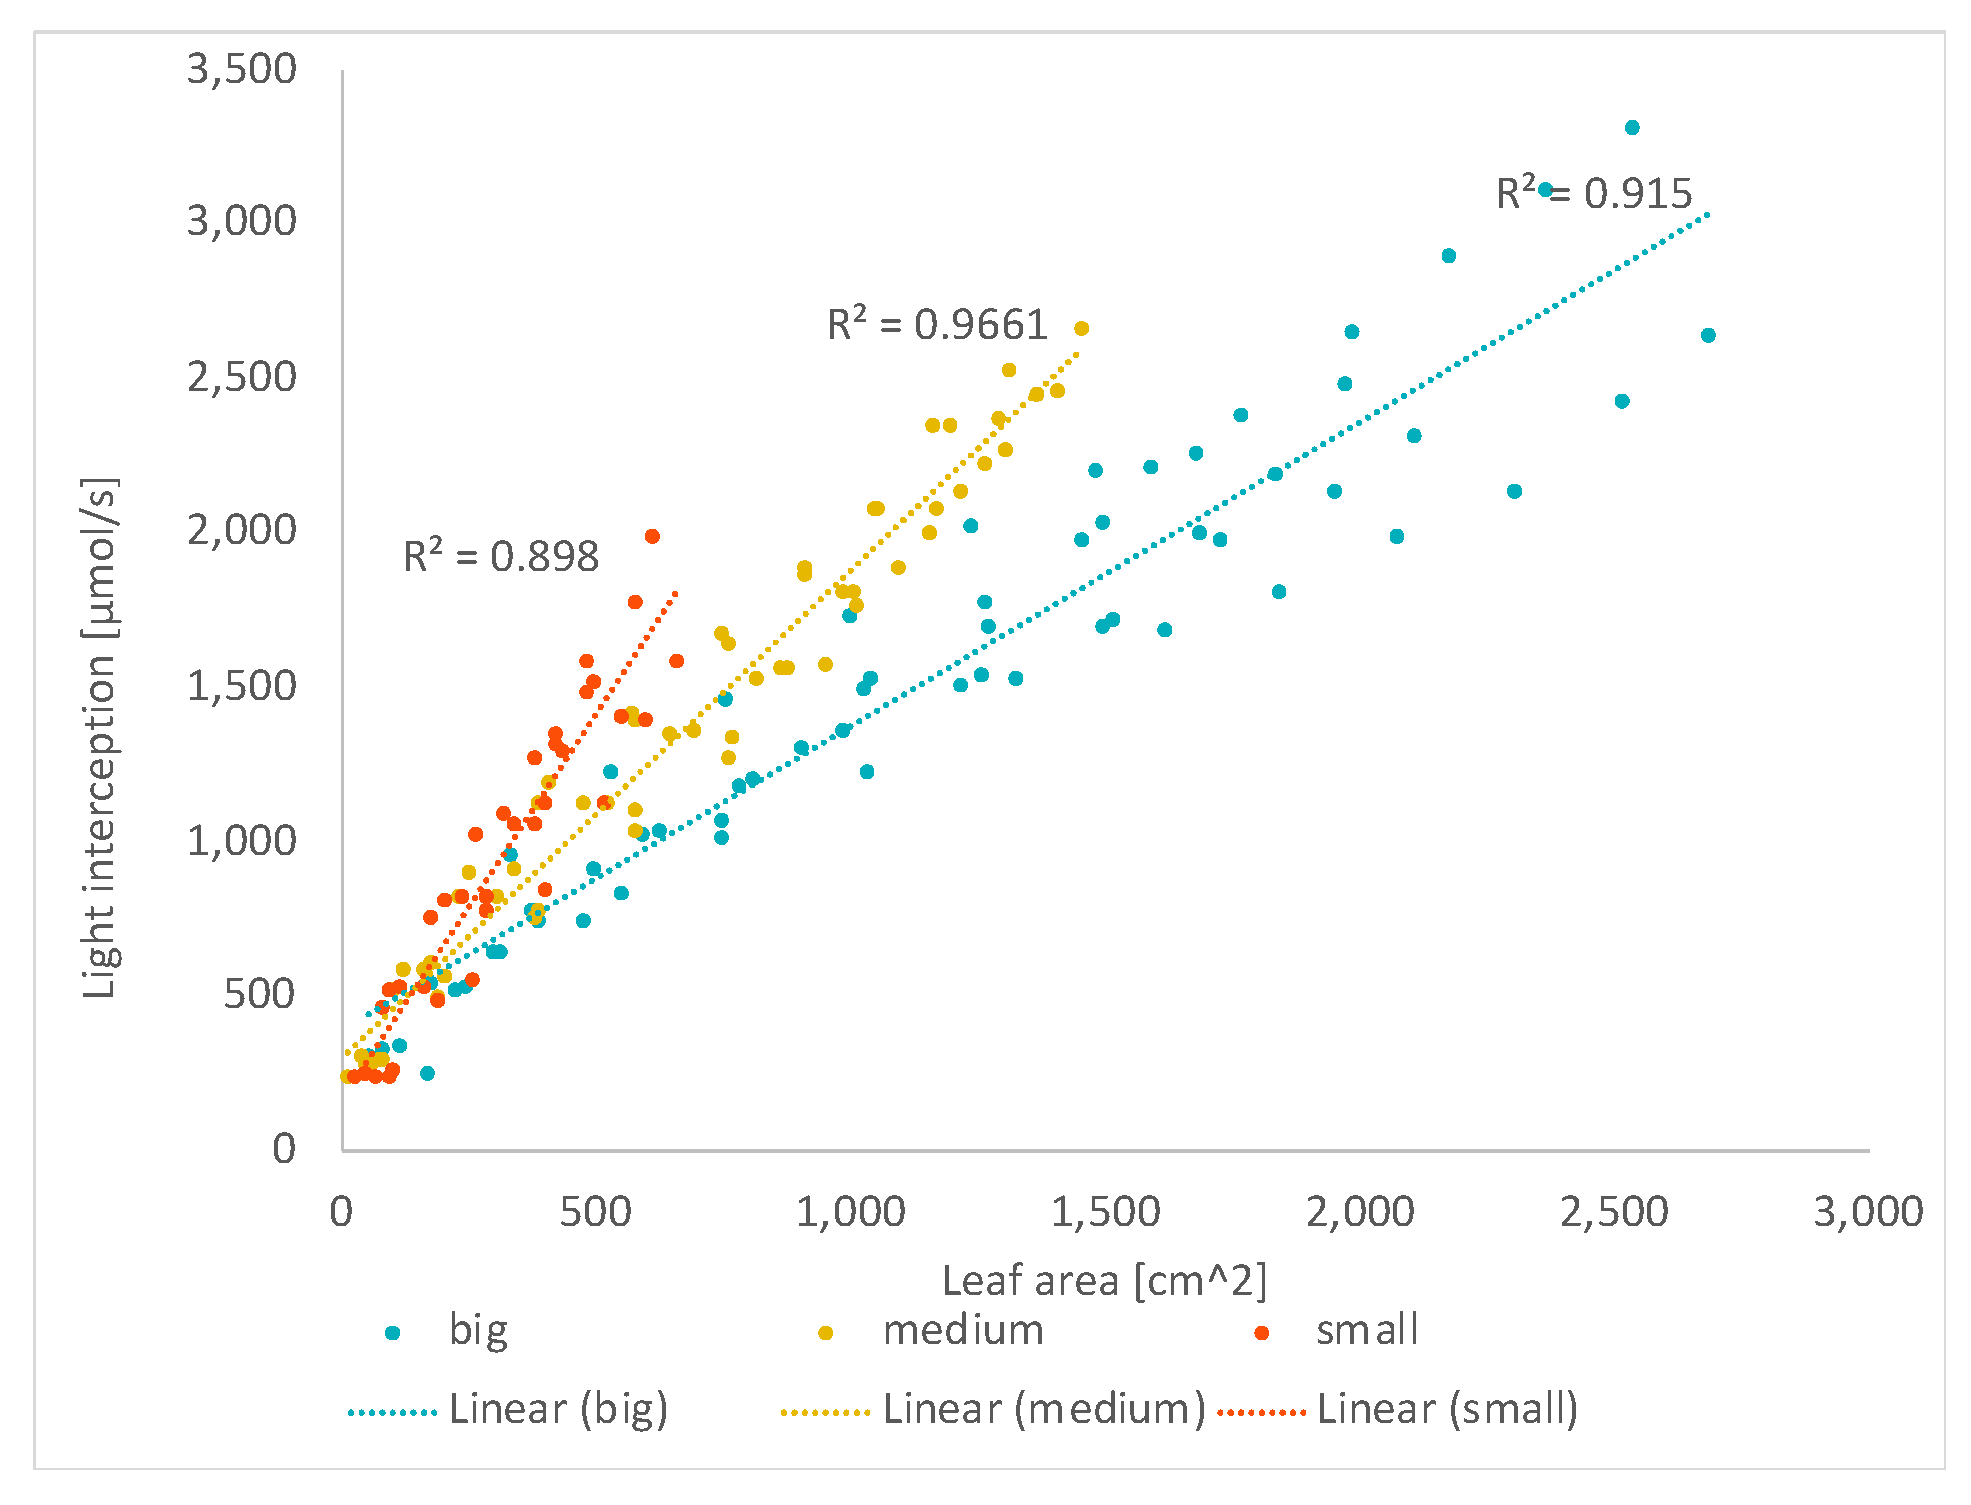
3.2. The Light Interception vs. Leaf Area
3.2.1. Total Leaf Area
3.2.2. Ratios of Diffuse Light
4. Discussion
4.1. The Effect of Radiation
4.2. The Impact of Leaf (Geometry and Area)
4.3. The Impact of Extinction
5. Conclusions
Author Contributions
Funding
Institutional Review Board Statement
Informed Consent Statement
Data Availability Statement
Acknowledgments
Conflicts of Interest
Appendix A

| Internode Length | Leaf Length | Leaf Width | Petiole Length | |
|---|---|---|---|---|
| p value | 0.0827 | 0.2893 | 0.2822 | 0.9416 |


References
- Papadopoulos, A.P. Growing Greenhouse Seedless Cucumbers in Soil and in Soilless Media; Agriculture and Agri-Food Canada: Ottawa, ON, Canada, 1994.
- Ehret, D.; Edwards, D.; Helmer, T.; Lin, W.; Jones, G.; Dorais, M.; Papadopoulos, A. Effects of Oxygen-Enriched Nutrient Solution on Greenhouse Cucumber and Pepper Production. Sci. Hortic. 2010, 125, 602–607. [Google Scholar] [CrossRef]
- Gül, A.; Kidoglu, F.; Anaç, D. Effect of Nutrient Sources on Cucumber Production in Different Substrates. Sci. Hortic. 2007, 113, 216–220. [Google Scholar] [CrossRef]
- Padmanabhan, P.; Cheema, A.; Paliyath, G. Solanaceous Fruits Including Tomato, Eggplant, and Peppers. In Encyclopedia of Food and Health; Elsevier: Amsterdam, The Netherlands, 2016; pp. 24–32. ISBN 978-0-12-384953-3. [Google Scholar]
- Wang, N.; Li, Z. Wireless Sensor Networks (WSNs) in the Agricultural and Food Industries. In Robotics and Automation in the Food Industry; Elsevier: Amsterdam, The Netherlands, 2013; pp. 171–199. ISBN 978-1-84569-801-0. [Google Scholar]
- Warren Wilson, J.; Hand, D.W.; Hannah, M.A. Light Interception and Photosynthetic Efficiency in Some Glasshouse Crops. J. Exp. Bot. 1992, 43, 363–373. [Google Scholar] [CrossRef]
- Kar, S.; Tanaka, R.; Korbu, L.B.; Kholová, J.; Iwata, H.; Durbha, S.S.; Adinarayana, J.; Vadez, V. Automated Discretization of ‘Transpiration Restriction to Increasing VPD’ Features from Outdoors High-Throughput Phenotyping Data. Plant Methods 2020, 16, 140. [Google Scholar] [CrossRef]
- Sun, Y.; Bossdorf, O.; Grados, R.D.; Liao, Z.; Müller-Schärer, H. Rapid Genomic and Phenotypic Change in Response to Climate Warming in a Widespread Plant Invader. Glob. Change Biol. 2020, 26, 6511–6522. [Google Scholar] [CrossRef]
- Tolley, S.; Yang, Y.; Mohammadi, M. High-Throughput Phenotyping Identifies Plant Growth Differences under Well-Watered and Drought Treatments. J. Integr. Agric. 2020, 19, 2429–2438. [Google Scholar] [CrossRef]
- Zou, J.; Zhang, Y.; Zhang, Y.; Bian, Z.; Fanourakis, D.; Yang, Q.; Li, T. Morphological and Physiological Properties of Indoor Cultivated Lettuce in Response to Additional Far-Red Light. Sci. Hortic. 2019, 257, 108725. [Google Scholar] [CrossRef]
- Kono, M.; Terashima, I. Long-Term and Short-Term Responses of the Photosynthetic Electron Transport to Fluctuating Light. J. Photochem. Photobiol. B Biol. 2014, 137, 89–99. [Google Scholar] [CrossRef]
- Sarlikioti, V.; de Visser, P.H.B.; Marcelis, L.F.M. Exploring the Spatial Distribution of Light Interception and Photosynthesis of Canopies by Means of a Functional–Structural Plant Model. Ann. Bot. 2011, 107, 875–883. [Google Scholar] [CrossRef] [Green Version]
- Marcelis, L.F.M.; Broekhuijsen, A.G.M.; Meinen, E.; Nijs, E.M.F.M.; Raaphorst, M.G.M. New Look at 1% Rule of Thumb. Fruit Veg. Technol. 2005, 5, 24–26. [Google Scholar]
- Ruban, A.V. Plants in Light. Commun. Integr. Biol. 2009, 2, 50–55. [Google Scholar] [CrossRef] [PubMed]
- Smith, H. Light Quality, Photoperception, and Plant Strategy. Annu. Rev. Plant Physiol. 1982, 33, 481–518. [Google Scholar] [CrossRef]
- Smith, I.E.; Savage, M.J.; Mills, P. Shading Effects on Greenhouse Tomatoes and Cucumbers. Acta Hortic. 1984, 148, 491–500. [Google Scholar] [CrossRef]
- Gijzen, H. Short-Term Crop Responses. In Greenhouse Climate Control; Wageningen Press: Wageningen, The Netherlands, 1995; pp. 16–62. [Google Scholar]
- Salisbury, F.B.; Ross, C.W. Photosynthesis: Environmental and Agricultural Aspects. In Plant physiology; Wadsworth Publishing Company: Belmont, CA, USA, 1992; pp. 249–265. [Google Scholar]
- Heuvelink, E.; Marcelis, L.F.M. Influence of Assimilate Supply on Leaf Formation in Sweet Pepper and Tomato. J. Hortic. Sci. 1996, 71, 405–414. [Google Scholar] [CrossRef]
- Marcelis, L.F.M. Leaf Formation in Cucumber (Cucumis Sativus L.) as Influenced by Fruit Load, Light and Temperature. Gartenbauwissenschaft 1993, 58, 124–129. [Google Scholar]
- Hemming, S.; Dueck, T.; Janse, J.; van Noort, F. The Effect of Diffuse Light on Crops. Acta Hortic. 2008, 801, 1293–1300. [Google Scholar] [CrossRef] [Green Version]
- Trouwborst, G.; Oosterkamp, J.; Hogewoning, S.W.; Harbinson, J.; van Ieperen, W. The Responses of Light Interception, Photosynthesis and Fruit Yield of Cucumber to LED-Lighting within the Canopy. Physiol. Plant. 2010, 138, 289–300. [Google Scholar] [CrossRef]
- Baldocchi, D.D.; Wilson, K.B.; Gu, L. How the Environment, Canopy Structure and Canopy Physiological Functioning Influence Carbon, Water and Energy Fluxes of a Temperate Broad-Leaved Deciduous Forest—An Assessment with the Biophysical Model CANOAK. Tree Physiol. 2002, 22, 1065–1077. [Google Scholar] [CrossRef] [Green Version]
- Niinemets, Ü. Photosynthesis and Resource Distribution through Plant Canopies. Plant Cell Environ. 2007, 30, 1052–1071. [Google Scholar] [CrossRef]
- Chen, T.-W.; Henke, M.; de Visser, P.H.B.; Buck-Sorlin, G.; Wiechers, D.; Kahlen, K.; Stützel, H. What Is the Most Prominent Factor Limiting Photosynthesis in Different Layers of a Greenhouse Cucumber Canopy? Ann. Bot. 2014, 114, 677–688. [Google Scholar] [CrossRef] [Green Version]
- Zheng, K. Preliminary Application of Diffuse Light Film in a Chinese Solar Greenhouse. Acta Hortic. 2018, 1227, 249–256. [Google Scholar] [CrossRef]
- Jongschaap, R.E.E.; Dueck, T.A.; Marissen, N.; Hemming, S.; Marcelis, L.F.M. Simulating Seasonal Patterns of Increased Greenhouse Crop Production by Conversion of Direct Radiation into Diffuse Radiation. Acta Hortic. 2006, 718, 315–322. [Google Scholar] [CrossRef] [Green Version]
- Kahlen, K. Towards Functional-Structural Modelling of Greenhouse Cucumber. In Functional-Structural Plant Modelling in Crop Production; Vos, J., Marcelis, L.F.M., De Visser, P.H.B., Struik, P.C., Evers, J.B., Eds.; Springer: Dordrecht, The Netherlands, 2007; pp. 209–217. ISBN 978-1-4020-6032-8. [Google Scholar]
- Monsi, M. On the Factor Light in Plant Communities and Its Importance for Matter Production. Ann. Bot. 2004, 95, 549–567. [Google Scholar] [CrossRef] [PubMed] [Green Version]
- Thornley, J.H.M.; Hand, D.W.; Warren Wilson, J. Modelling Light Absorption and Canopy Net Photosynthesis of Glasshouse Row Crops and Application to Cucumber. J. Exp. Bot. 1992, 43, 383–391. [Google Scholar] [CrossRef]
- Qian, T.; Zheng, X.; Guo, X.; Wen, W.; Yang, J.; Lu, S. Influence of Temperature and Light Gradient on Leaf Arrangement and Geometry in Cucumber Canopies: Structural Phenotyping Analysis and Modelling. Inf. Processing Agric. 2019, 6, 224–232. [Google Scholar] [CrossRef]
- Furbank, R.T.; Tester, M. Phenomics—Technologies to Relieve the Phenotyping Bottleneck. Trends Plant Sci. 2011, 16, 635–644. [Google Scholar] [CrossRef]
- Kahlen, K.; Wiechers, D.; Stützel, H. Modelling Leaf Phototropism in a Cucumber Canopy. Funct. Plant Biol. 2008, 35, 876. [Google Scholar] [CrossRef] [Green Version]
- Kim, D.; Kang, W.H.; Hwang, I.; Kim, J.; Kim, J.H.; Park, K.S.; Son, J.E. Use of Structurally-Accurate 3D Plant Models for Estimating Light Interception and Photosynthesis of Sweet Pepper (Capsicum annuum) Plants. Comput. Electron. Agric. 2020, 177, 105689. [Google Scholar] [CrossRef]
- Wiechers, D.; Kahlen, K.; Stützel, H. Evaluation of a Radiosity Based Light Model for Greenhouse Cucumber Canopies. Agric. For. Meteorol. 2011, 151, 906–915. [Google Scholar] [CrossRef]
- Iwakiri, S.; Inayama, M. Studies on the Canopy Photosynthesis of the Horticultural Crops in Controlled Environment. J. Agric. Meteorol. 1974, 30, 17–26. [Google Scholar] [CrossRef]
- Qian, T.; Lu, S.; Zhao, C.; Guo, X.; Wen, W. Computational Experiments of Light Distribution and Photosynthesis in Cucumber (Cucumis sativus L.) Canopy. In Proceedings of the 2012 IEEE 4th International Symposium on Plant Growth Modeling, Simulation, Visualization and Applications, IEEE, Shanghai, China, 31 October–3 November 2012; pp. 403–408. [Google Scholar]
- Qian, T.; Zheng, X.; Yang, J.; Xu, Y.; Wang, Y.; Zhou, Q.; Lu, S.; Ding, X. Optimal Utilization of Light Energy in Semiclosed Greenhouse Using Three-Dimensional Cucumber Model. Sci. Program. 2020, 2020, 1–12. [Google Scholar] [CrossRef]
- Pei, X.; Li, S.; Zhang, F.; Cai, R. Study on leaf area calculation and its correlation with plant height of cucumber in greenhouse. Chin. Agric. Sci. Bull. 2005, 8, 80–82. [Google Scholar]
- Stanghellini, C.; Ooster, B.; Heuvelink, E. Greenhouse Horticulture: Technology for Optimal Crop Production; Wageningen Academic Publishers: Wageningen, The Netherlands, 2019. [Google Scholar]
- Wen, W.; Guo, X.; Li, B.; Wang, C.; Wang, Y.; Yu, Z.; Wu, S.; Fan, J.; Gu, S.; Lu, X. Estimating Canopy Gap Fraction and Diffuse Light Interception in 3D Maize Canopy Using Hierarchical Hemispheres. Agric. For. Meteorol. 2019, 276–277, 107594. [Google Scholar] [CrossRef]
- Yang, X.; Li, J.; Jiang, X.; Tong, X.; Yu, Q. Relationships between Diffuse Radiation Fraction and Light Use Efficiency and Gross Primary Productivity of Winter Wheat. Chin. J. Agrometeorol. 2018, 39, 462–467. [Google Scholar] [CrossRef]
- Marcelis, L.F.M.; Heuvelink, E.; Goudriaan, J. Modelling Biomass Production and Yield of Horticultural Crops: A Review. Sci. Hortic. 1998, 74, 83–111. [Google Scholar] [CrossRef]
- Janse, J.; van Paassen, R.A.; Berkhout, B.A. Optimalisering Belichting Bij Komkommer: Onderzoek 2003–2004; Praktijkonderzoek Plant & Omgeving B.V.: Lelystad, The Netherlands, 2004. [Google Scholar]
- Janse, J.; van Paassen, R.A.F.; Berkout, B. Verdere optimalisering belichting bij komkommer: Onderzoek 2004–2005. Prakt. Plant Omgeving 2005. Available online: https://edepot.wur.nl/295707 (accessed on 27 January 2022).
- Zhang, D.; Zhang, L.; Liu, J.; Han, S.; Wang, Q.; Evers, J.; Liu, J.; van der Werf, W.; Li, L. Plant Density Affects Light Interception and Yield in Cotton Grown as Companion Crop in Young Jujube Plantations. Field Crops Res. 2014, 169, 132–139. [Google Scholar] [CrossRef]
- Mao, L.; Zhang, L.; Zhao, X.; Liu, S.; van der Werf, W.; Zhang, S.; Spiertz, H.; Li, Z. Crop Growth, Light Utilization and Yield of Relay Intercropped Cotton as Affected by Plant Density and a Plant Growth Regulator. Field Crops Res. 2014, 155, 67–76. [Google Scholar] [CrossRef]
- Casal, J.J.; Sanchez, R.A.; Deregibus, V.A. The Effect of Plant Density on Tillering: The Involvement of R/FR Ratio and the Proportion of Radiation Intercepted per Plant. Environ. Exp. Bot. 1986, 26, 365–371. [Google Scholar] [CrossRef]
- Heuvelink, E. Dry Matter Partitioning in Tomato: Validation of a Dynamic Simulation Model. Ann. Bot. 1996, 77, 71–80. [Google Scholar] [CrossRef]
- Peters, H.R. The Ecological Implications of Body Size; Cambridge University Press: New York, NY, USA, 1983. [Google Scholar]
- Milla, R.; Reich, P.B. The Scaling of Leaf Area and Mass: The Cost of Light Interception Increases with Leaf Size. Proc. R. Soc. B 2007, 274, 2109–2115. [Google Scholar] [CrossRef] [PubMed] [Green Version]
- King, D.A. The Adaptive Significance of Tree Height. Am. Nat. 2015, 135, 809–828. [Google Scholar] [CrossRef]
- Ruberti, I.; Sessa, G.; Ciolfi, A.; Possenti, M.; Carabelli, M.; Morelli, G. Plant Adaptation to Dynamically Changing Environment: The Shade Avoidance Response. Biotechnol. Adv. 2012, 30, 1047–1058. [Google Scholar] [CrossRef] [PubMed]
- Gratani, L. Plant Phenotypic Plasticity in Response to Environmental Factors. Adv. Bot. 2014, 2014, 208747. [Google Scholar] [CrossRef] [Green Version]
- Ackerly, D. 10—Allocation, Leaf Display, and Growth in Fluctuating Light Environments. In Plant Resource Allocation; Bazzaz, F.A., Grace, J., Eds.; Physiological Ecology; Academic Press: San Diego, CA, USA, 1997; pp. 231–264. ISBN 978-0-12-083490-7. [Google Scholar]
- Li, S.; van der Werf, W.; Zhu, J.; Guo, Y.; Li, B.; Ma, Y.; Evers, J.B. Estimating the Contribution of Plant Traits to Light Partitioning in Simultaneous Maize/Soybean Intercropping. J. Exp. Bot. 2021, 72, 3630–3646. [Google Scholar] [CrossRef]
- Wang, Y.P.; Jarvis, P.G. Description and Validation of an Array Model—MAESTRO. Agric. For. Meteorol. 1990, 51, 257–280. [Google Scholar] [CrossRef]
- Wang, Y.P.; Leuning, R. A Two-Leaf Model for Canopy Conductance, Photosynthesis and Partitioning of Available Energy. I. Model Description and Comparison with a Multi-Layered Model. Agric. For. Meteorol. 1998, 91, 89–111. [Google Scholar] [CrossRef]
- Luo, X.; Chen, J.M.; Liu, J.; Black, T.A.; Croft, H.; Staebler, R.; He, L.; Arain, M.A.; Chen, B.; Mo, G.; et al. Comparison of Big-Leaf, Two-Big-Leaf, and Two-Leaf Upscaling Schemes for Evapotranspiration Estimation Using Coupled Carbon-Water Modeling. J. Geophys. Res. Biogeosci. 2018, 123, 207–225. [Google Scholar] [CrossRef]


| Scenarios | Date | Total Radiation (MJ/m2) | Indoor Incident PAR (µmol/m2s) | Ratio of Diffuse Light |
|---|---|---|---|---|
| s1 | 3 June 2019 | 29.48 | 426.41 | 27.8% |
| s2 | 9 June 2019 | 23.38 | 336.16 | 48.7% |
| s3 | 10 June 2019 | 12.75 | 183.18 | 89.6% |
| Leaf Size | Scenarios | k | kn | b | bn | R2 |
|---|---|---|---|---|---|---|
| big | 1 | 0.9878 | 2.1909 | 382.97 | 849.40 | 0.9150 |
| big | 2 | 0.8633 | 2.4287 | 315.70 | 888.19 | 0.9312 |
| big | 3 | 0.5667 | 2.9257 | 180.79 | 933.43 | 0.9528 |
| medium | 1 | 1.5774 | 3.4985 | 301.17 | 667.98 | 0.9661 |
| medium | 2 | 1.4000 | 3.9386 | 251.47 | 707.48 | 0.9692 |
| medium | 3 | 0.9402 | 4.8542 | 146.52 | 756.50 | 0.9736 |
| small | 1 | 2.4971 | 5.5385 | 167.17 | 370.76 | 0.8980 |
| small | 2 | 2.1881 | 6.1558 | 154.43 | 434.46 | 0.8909 |
| small | 3 | 1.4338 | 7.4029 | 109.30 | 564.33 | 0.8706 |
Publisher’s Note: MDPI stays neutral with regard to jurisdictional claims in published maps and institutional affiliations. |
© 2022 by the authors. Licensee MDPI, Basel, Switzerland. This article is an open access article distributed under the terms and conditions of the Creative Commons Attribution (CC BY) license (https://creativecommons.org/licenses/by/4.0/).
Share and Cite
Zhang, Y.; Yang, J.; van Haaften, M.; Li, L.; Lu, S.; Wen, W.; Zheng, X.; Pan, J.; Qian, T. Interactions between Diffuse Light and Cucumber (Cucumis sativus L.) Canopy Structure, Simulations of Light Interception in Virtual Canopies. Agronomy 2022, 12, 602. https://doi.org/10.3390/agronomy12030602
Zhang Y, Yang J, van Haaften M, Li L, Lu S, Wen W, Zheng X, Pan J, Qian T. Interactions between Diffuse Light and Cucumber (Cucumis sativus L.) Canopy Structure, Simulations of Light Interception in Virtual Canopies. Agronomy. 2022; 12(3):602. https://doi.org/10.3390/agronomy12030602
Chicago/Turabian StyleZhang, Yingyu, Juan Yang, Marinus van Haaften, Linyi Li, Shenglian Lu, Weiliang Wen, Xiuguo Zheng, Jian Pan, and Tingting Qian. 2022. "Interactions between Diffuse Light and Cucumber (Cucumis sativus L.) Canopy Structure, Simulations of Light Interception in Virtual Canopies" Agronomy 12, no. 3: 602. https://doi.org/10.3390/agronomy12030602