Article

Poultry Litter and Inorganic Fertilization: Effects on Biomass Yield, Metal and Nutrient Concentration of Three Mixed-Season Perennial Forages

1
Adaptive Cropping Systems Laboratory, USDA-ARS, Beltsville, MD 20705, USA
2
Agriculture Research Station, College of Agriculture, Virginia State University, Petersburg, VA 23806, USA
*
Author to whom correspondence should be addressed.
Agronomy 2022, 12(3), 570; https://doi.org/10.3390/agronomy12030570
Submission received: 31 January 2022 / Revised: 18 February 2022 / Accepted: 22 February 2022 / Published: 25 February 2022
(This article belongs to the Special Issue Soil Healthy in Agro-Ecosystems II)

Abstract

:
Poultry litter and fertilizers are normally added as soil amendments. The effects of poultry litter and inorganic fertilizers on three mixed-season perennial forages were studied for two years in the field to understand growth dynamics, metals, and nutrient uptake. The primary objective was to investigate the heavy metal and nutrient concentrations, biomass yield and forage potential of a cool-season forage, stinging nettle (Urtica dioica L.), relative to warm-season forages, bermudagrass (Cynodon dactylon (L.) Pers.) and switchgrass (Panicum virgatum L.). Forage cuttings and soil samples were analyzed for heavy metals and nutrients using inductively coupled plasma-optical emission spectroscopy (ICP-OES). Total biomass yield was higher by 66% and 50% in switchgrass and bermudagrass, respectively, compared with stinging nettle for the first year. While the warm-season forages yielded more biomass over the cool-season forage, metal concentrations were significantly higher for all elements in the cool-season forage. Stinging nettle showed greater macro-nutrient uptake with 103.20 kg ha−1, 0.87 kg ha−1, 27.49 kg ha−1 and 32.08 kg ha−1 for Ca, Fe, Mg, and P, except for K with 223.51 kg ha−1 compared with 267.29 kg ha−1 and 283.96 kg ha−1 for switchgrass and bermudagrass, respectively. Heavy metals were also higher in stinging nettle but were within the allowable limits for forages, indicating its potential as a resource for forages and nutrient cycling, particularly when double-cropped with warm-season forages.

1. Introduction

Poultry litter is an important source of organic fertilizer that is normally surface-applied on fields for the improvement of soil quality and increased yield in agricultural production. This is particularly common for pastures and hayfields, where different types of forages are cultivated for ruminant and non-ruminant animal nutrition [1,2,3]. Poultry litter contains valuable nutrients, including trace and non-trace metals, and its application can enhance soil productivity and improve soil quality by improving aggregate formation and stability. It improves water filtration capacity and supplies plant nutrients such as Ca, Mg, and K to soils [4,5,6]. However, poultry litter applied on fields to satisfy one nutrient requirement could result in oversupply and an excess of another [7]. One example is the excess of phosphorus that occurs when poultry litter is applied to provide adequate nitrogen [8,9,10]. This same situation could apply to short-term and long-term or repeated applications that cause the accumulation of heavy metals in the soil and the contamination of surface and groundwater. This is because the amount of poultry litter applied on the fields could exceed the nutrient requirements of those fields and the carrying capacity of the soil, even as the biomass yield of the forages is increased [11].
Heavy metals and other nutrients could also be taken up by forages due to increased poultry litter application and the subsequent concentration of metals in the biomass regardless of the seasonal preference of the forage type (warm or cool season). The heavy metal concentrations in the crop could vary and subsequently depend on the type of manure and the feeding practices of the animals [12]. A review by [13] found a wide variation in mean litter concentrations of Cu (32 to 593 mg Cu kg−1) and Zn (125 to 496 mg Zn kg−1) between various studies in 12 and 7 different experiments. In one study, [14], it was concluded that when dietary Zn content in poultry feed was decreased from 190 to 65 mg kg−1, Zn concentration in broiler manure was reduced by 75%. Similarly, ref. [15] reported a strong correlation between the analyzed nutrients and metals in the feed and in their excreted waste. This was specific for the concentrations of As, Cu, Zn and P in soils that had received surface-applied poultry litter over a 14-year period; the concentrations of these metals in this soil were significantly greater than untreated soil at different depths and tillage conditions [2,16]. This trend was notable and consistent for many perennial forage grasses like bermudagrass (Cynodon dactylon (L.) Pers.) across various studies [17,18,19]. Similar results have also been seen in switchgrass (Panicum virgatum L.) [20]. More nutrient concentrations were also observed in switchgrass and perennial legumes like alfalfa (Medicago sativa L.) grown on poultry-litter-amended soils [21,22]. In comparison with inorganic fertilizers [23], the release and uptake of nutrients [24] as well as increased tissue Cu and Zn concentrations were recorded from lands with poultry litter applications. While soil amendments have been shown to increase heavy metals and affect soil health, amendments could immobilize the uptake of these metals while improving the yield of the crops [25], thereby reducing the accumulation, potential bioavailability, and the harmful effects of these heavy metals [26].
Stinging nettle (Urtica dioica L.) is an erect, herbaceous perennial forb and has been reported to have multiple uses. It is notable for fiber production [27,28,29] and food and medicinal purposes [30,31] and mostly compares with alfalfa in protein content [32,33]. Stinging nettle has been used as a supplement in dried and powdered forms, and is added to the feeds of various animals, including cows for increased milk production [34], horses and pigs for improved health and daily gains [35], as well as feeds for rabbits and captive gorillas [36,37]. When cut and dried, it was confirmed to be an excellent source of nutritious livestock feed [32].
However, agronomic research on its use as an alternative forage source is limited. Nevertheless, its biomass yield and quality depend on the availability of significant amounts of nitrogen (N), and it has been reported to have a tendency of accumulating heavy metals [38,39]. Additionally, studies on its biomass yield, trace metals (As, Cd, Cu, Mn, Zn) and nutrients (Ca, Mg, K, P) in response to poultry litter applications relative to other forages have not been done. Therefore, the objective of this study was to evaluate the forage potential of stinging nettle relative to bermudagrass and switchgrass, as well as relative biomass yield, nutrient, and heavy metal concentrations in mixed-season perennial forages planted in poultry litter- and inorganic fertilizer-applied fields.

2. Materials and Methods

2.1. Site Description, Experimental Design and Preparation

The experiment was conducted at Randolph Farm of Virginia State University located in the Tri-Cities area of Central Virginia (37.1° N; 77.3° W) at an elevation of 45 m above sea level. The soil type at the site is a Bourne series fine sandy loam (mixed, semiactive, thermic Typic Fragiudults). The research area was conventionally tilled and divided into 12 0.008-hectare plots with 3 m buffer stripes between plots. Each plot was treated as an experimental unit, and the forage treatments (switchgrass + poultry litter, bermudagrass + poultry litter, stinging nettle + poultry litter) were distributed in a completely randomized design (CRD) with four replicates per treatment, mostly due to the homogenous nature of the research area and the desired homogeneity of the experimental treatments. The perennials were planted in the spring (27 March) and emerged within the first 10 to 14 days after planting.
A composite soil sample formed by mixing 20 core samples collected from the plots to a depth of 15 cm was analyzed to characterize initial soil conditions. The poultry litter used was also analyzed, and, together with the initial soil conditions, used to determine and calculate plant-available nitrogen (PAN) and other nutrients for the experimental layout (Table 1). The NO3-N and the NH4-N of the initial soil analyzed were also shown to be 0.56 mg kg−1 and 6.62 mg kg−1, respectively, while the Cd content was not detectable.
In line with the objective, each experimental plot received a uniform manual application of poultry litter and inorganic fertilizer from urea (CO(NH2)2) in the spring (21 March) for the required rate of 136 kg N ha−1 before the establishment of the study and before the perennials were planted. Subsequently, plots received a split-surface application of poultry litter to supply 68 kg N ha−1 and inorganic fertilizer from sodium nitrate (NaNO3) to supply 68 kg N ha−1 in the spring (24 March) and early fall (30 August/2 September), respectively, for the total target rate of 136 kg N ha−1 annually (Table 2). Watering was done as needed via drip irrigation, and weeds were controlled manually. Rainfall, temperature, and relative humidity data were recorded for the duration of the study (Figure 1). Necessary physiological parameters and agronomic data and traits were visually monitored throughout the study.

2.2. Initial Soil and Poultry Litter Analyses

The preliminary analysis of the composite soil samples used to determine PAN described the initial soil condition as well as the poultry litter (Table 1). The poultry litter was analyzed for total N before each application in order to calculate the required N for application. Urea was used as the first inorganic fertilizer to supplement poultry litter, and sodium nitrate was used after the plants were established to avoid the potential for burns that could result from urea fertilizer applications (Table 2).

2.3. Field Sampling and Analyses

Soil Samples

A total of 5 soil core samples were collected and composited from the 0–15 cm and 15–30 cm depths of each plot 90 days after the spring manure and fertilizer applications. The samples were air-dried and crushed to pass a 2-mm sieve. The soil pH was measured in a 1:2 (material: deionized water, v/v) suspension after equilibration using a glass electrode. Electrical conductivity (EC) was determined in a 1:2 (material: deionized water, v/v) suspension using an Orion conductivity meter [40,41]. Mehlich-3 (M3) extractable nutrients and metals (Ca, Cu, Fe, K, Mg, Mn, P, Pb and Zn) were determined as described by [42]. After extractions, samples were analyzed using inductively coupled plasma-optical emission spectroscopy (ICP-OES). All soil samples analyzed were processed with blanks and the in-house soil standard sample. The in-house standard was produced from a field soil which was rigorously and repeatedly analyzed for its chemical properties as well as its M3 extractable nutrients and metal contents. The soil standard sample is used with blanks in between all other soil samples to monitor the accuracy and reproducibility of soil analyses done in the laboratory. Our results were within the established percentage range of 80% to 100% for the in-house standard soil.

2.4. Forage/Plant Samples

Forage harvest was completed three times for the season on a specified cutting frequency. A prolonged harvest interval of 45 days was considered valuable for nutrient or metal removal and uptake through the biomass. Therefore, at 35 days after planting, and on a bimonthly basis of about 45 days, a 1-m quadrate was randomly placed in each plot, and the biomass was manually harvested to a 10–12 cm stubble. Each quadrate space provided the first, second and third harvest (cuttings) or regrowth where applicable for the forage samples. A complete set of sequential harvesting was not possible in switchgrass due to insufficient regrowth resulting from the cessation of seasonal growth. Fresh biomass weights were recorded, and subsamples were collected and oven-dried at 60 °C to constant weight for the determination of dry matter yield. Dried samples were ground in a cyclone mill to pass a 1-mm-screen prior to analyses. Elemental concentrations in plant tissues were determined using the dry ashing method, whereby 2 g of each sample was heated at 480 °C for 16 h, then digested using concentrated nitric acid (HNO3) and 3 M hydrochloric acid (HCl). The digest was filtered through Whatman No. 40 filter paper, and the filtrate was brought to a volume of 25 mL with 0.1 M HCl. The concentration of Ca, Cu, Fe, K, Mg, Mn, P, Pb and Zn in each extract was analyzed using ICP-OES. For quality assurance, blanks and apple leaf standards from the National Institute of Standards and Technology (NIST), Gaithersburg, MD, were included for each analysis. The recovery percentage of the elements ranged from 100% to 77% for all the elements analyzed, except Fe, which was not listed with the apple leaf NIST. The recovery percentages for Ca, K, Cu, Mn, P, Mg, Pb and Zn were 100, 96, 93, 87, 85, 78, 77 and 77%, respectively.

2.5. Data Analyses

Analysis of variance was used to determine statistically significant differences among treatments using the PROC GLM, SAS version 9.4. [43]. Separation of means was performed using Duncan’s multiple range tests at p ≤ 0.05 [44].

3. Results and Discussion

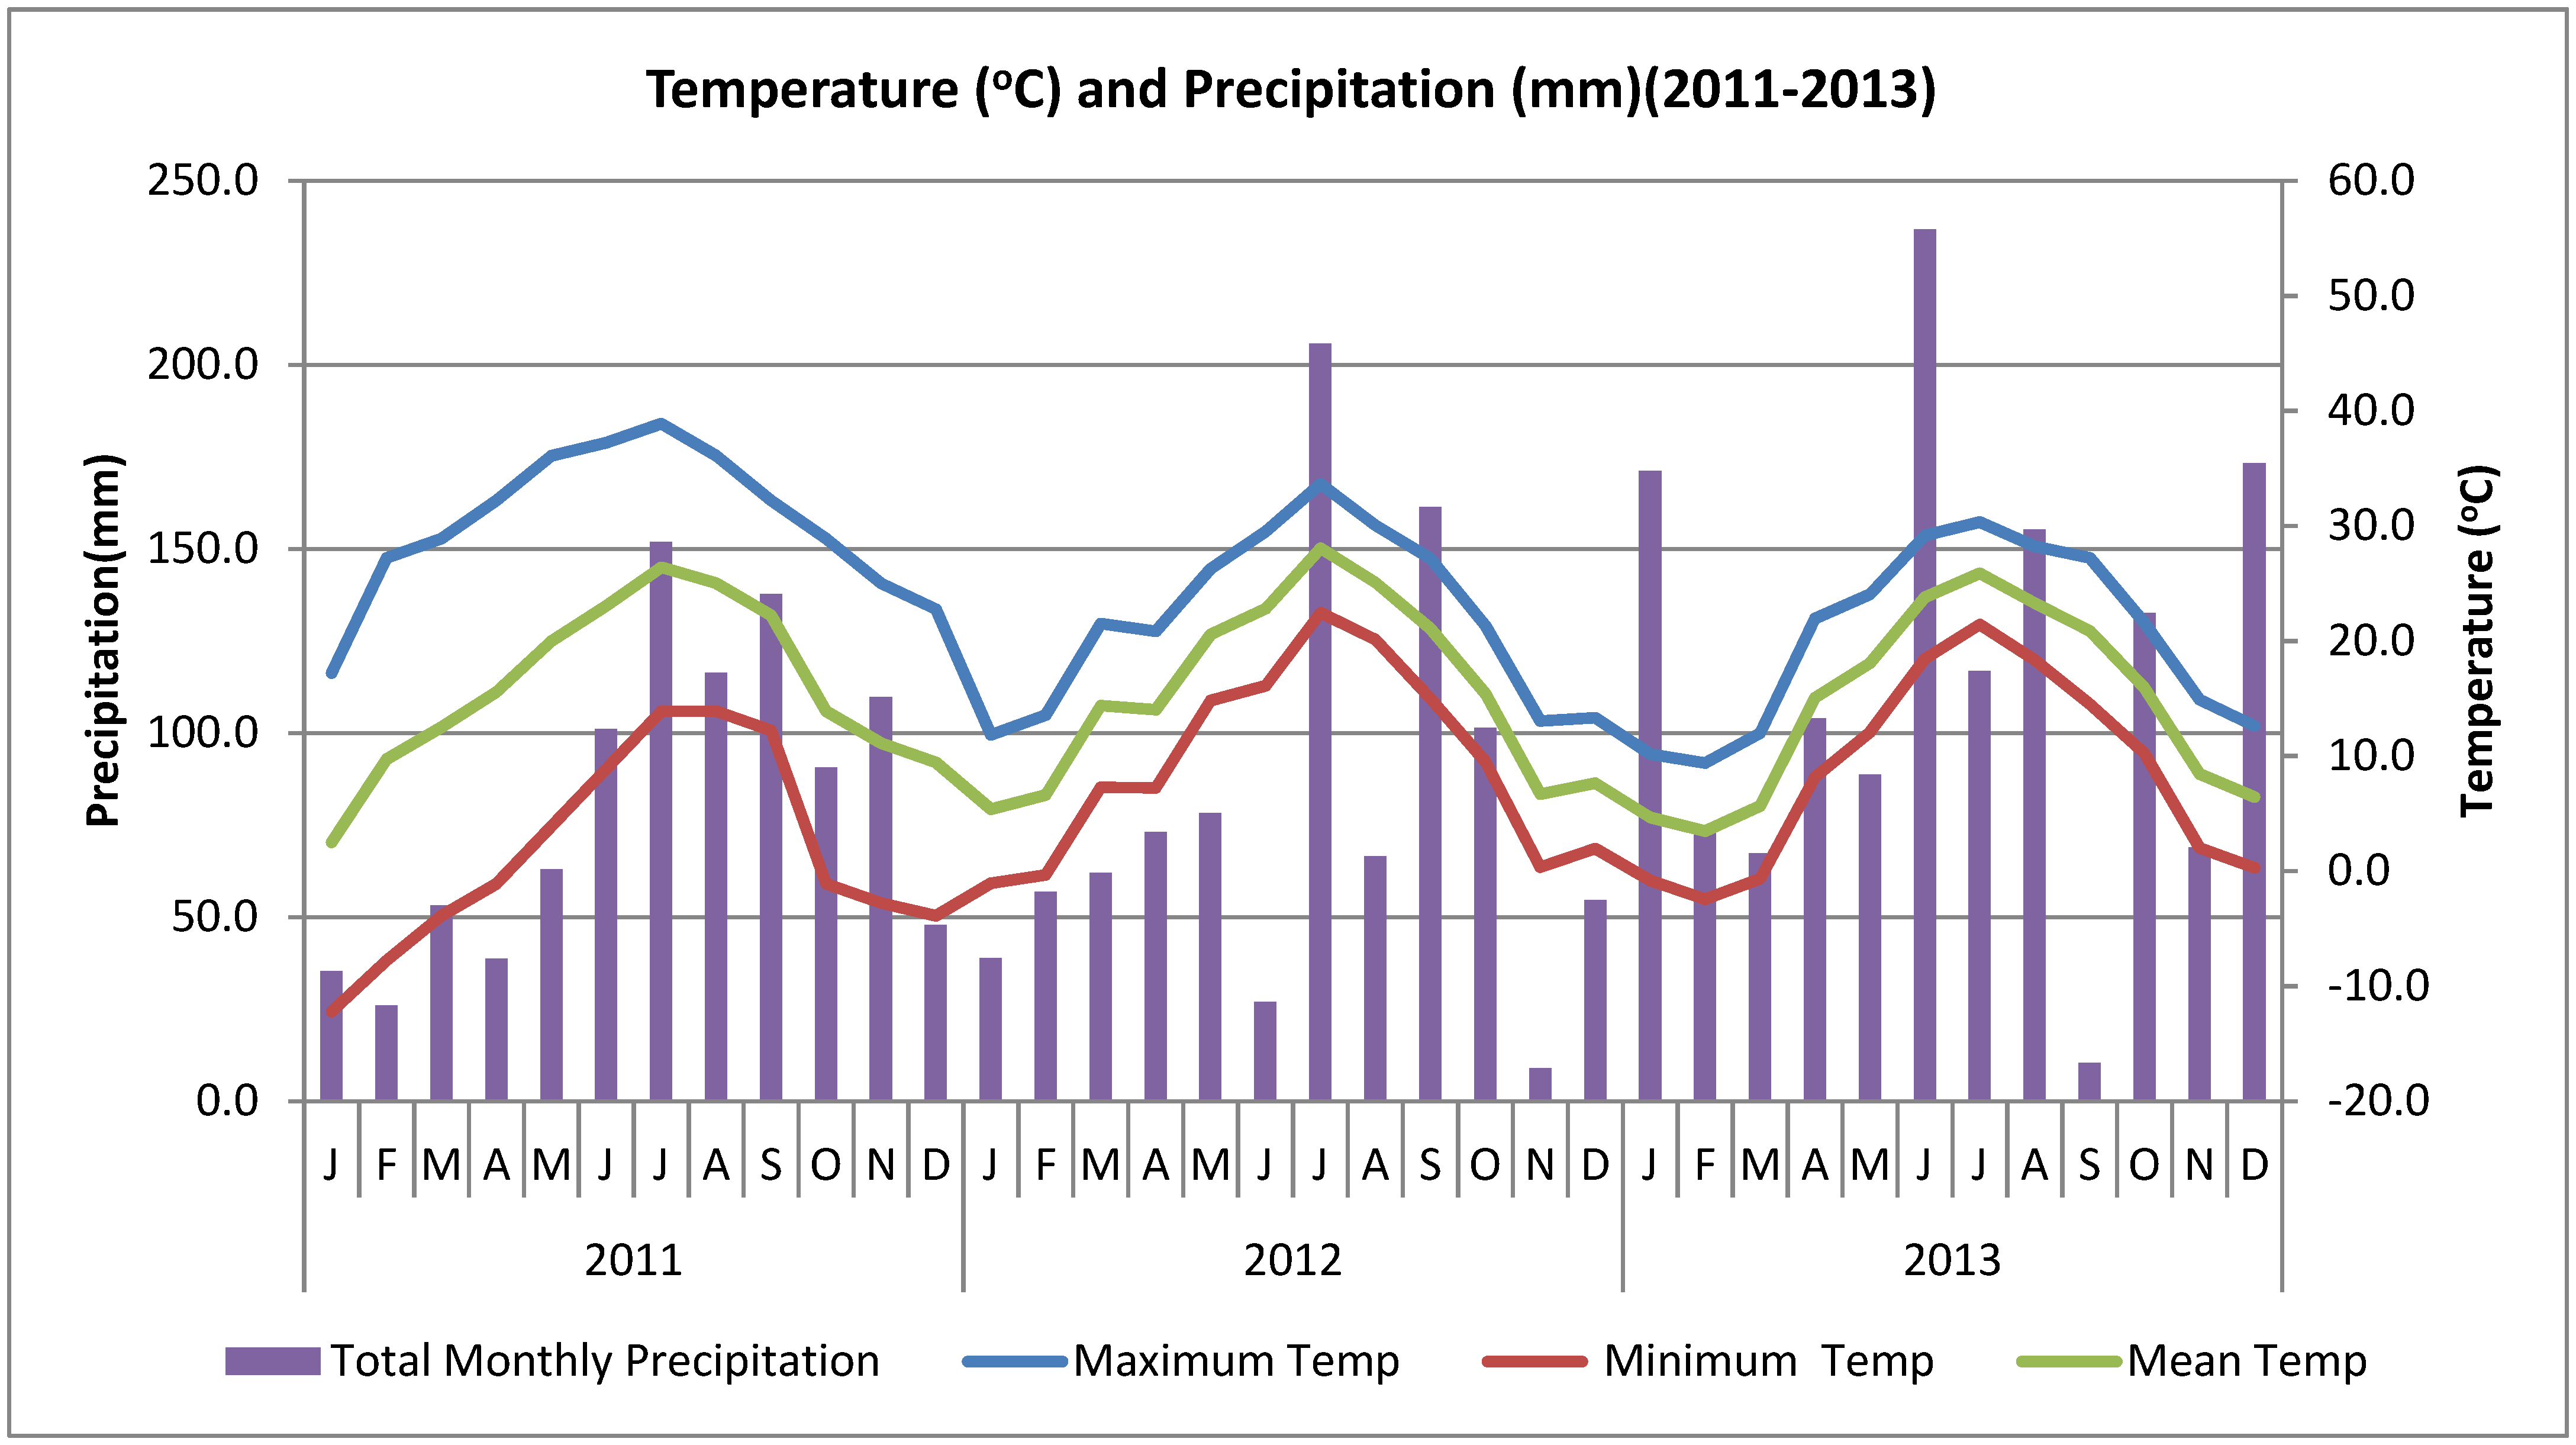
3.1. Precipitation, Temperature and Forage Productivity

Monthly precipitation (mm) and temperature (°C) records of the three-year experimental region are shown in Figure 1. Precipitation at the site was lower in the first 2 years during the growing season with a range of 39–151 mm and 27–205 mm for 2011 and 2012. Precipitation then increased slightly in the third year to a range of 10–236 mm, constituting a total rainfall for the three years of 752 mm, 775 mm and 911 mm, respectively. The temperature ranged from −10 °C to about 40 °C, with a mean of 21 °C, 20 °C and 19 °C for the three years, respectively, as shown in Figure 1. The temperature was not limiting for the warm-season forage grasses. Furthermore, it is likely that precipitation was sufficient and did not result in drought for the forages based on the rainfall recorded for the period. This is because bermudagrass is known to survive in climates with an annual rainfall of 635–2540 mm [45], while switchgrass can tolerate conditions of drought to about 510 mm annually [46]. Similarly, stinging nettle needs 430–860 mm of precipitation annually [47] to reach its growth potential. Climatic factors, among others, affect crop growth, and, based on the research and conclusion for many warm-season forages crops, the presented levels are considered adequate precipitation [19,48,49] without the propensity to reduce yield. The annual precipitation was therefore supplemented with drip irrigation as needed.

3.2. Biomass Yield, Nutrient and Metal Concentrations

3.2.1. Year One Harvests/Cuttings

As shown in Table 3, which presents the dry biomass yield for the first cutting, yield was higher by 66% and 50% in switchgrass and bermudagrass, respectively, compared with stinging nettle, while switchgrass was 33% higher than bermudagrass. A similar trend was observed in the second cutting, but for the third cutting, bermudagrass, the warm-season forage, had a higher yield that was significantly different from switchgrass by 75% and stinging nettle by 90%. The bermudagrass as the warm-season forage had a significantly higher yield than stinging nettle by 59% and 79% for the fourth and fifth cuttings, respectively. The dry biomass yield reveals a higher percentage for the warm-season forages and grasses than the cool-season stinging nettle for the five cuttings. Studies have shown that forage yield is generally higher for the first cutting than other times of the year. In a 4-cut system, the first cutting usually makes up about 35–38% of the year’s total forage yield [50], particularly in a monoculture or with variants of one forage. Cutting height can also affect bermudagrass yield and quality. Results of a study on cutting height and frequency indicated that cutting height and frequency interact to affect the productivity, quality, and composition of bermudagrass-crabgrass mixtures [51]. However, with different forage types, like grasses and forbs, or monocots and dicots, and seasonal types of warm and cool seasons, there could be variations between cuttings.
The nutrient and metal concentrations of Ca, Cu, Fe, K, Mg, Mn, P, Pb and Zn in the plant samples shown in Table 3 for the first cutting reveal a significantly higher concentration of all the elements in the cool-season than in the warm-season forage samples, except for Pb. The differences were at percentages of 90%Ca, 30%Cu, 39%K, 68%Mg, 31%Mn, 55%P, and 21%Zn, with a high 300%Fe and a decrease in Pb being an exception. When the total uptake was considered, stinging nettle showed a greater nutrient uptake of macronutrients for the first cuttings of the two years over bermudagrass and switchgrass, with 103.20 kg ha−1, 0.87 kg ha−1, 27.49 kg ha−1 and 32.08 kg ha−1 for Ca, Fe, Mg, and P, respectively. An exception was seen for K, with 223.51 kg ha−1 compared with 267.29 kg ha−1 and 283.96 kg ha−1 for switchgrass and bermudagrass, respectively. The uptake of micronutrients was higher for the warm-season grasses, particularly with switchgrass. A similar trend was observed for all the five cuttings, except for Cu, for which inconsistencies were present from the second cutting, and Mn, for which inconsistencies were observed during the fourth and fifth cuttings.
Table 4 shows the average yield over the five months of cuttings. Significant differences were observed between the warm months and the cool months for both types of forage crops being considered. Nutrient and metal concentrations, however, indicated that the cool-season forage had significantly higher levels relative to the warm-season forages, except for Pb, for which there was no difference.
When the average yield of individual forages was considered, as shown in Table 5, the warm-season forages recorded significantly higher yield than the cool-season crop. The cool-season forage had a significantly higher concentrations of all elements except for Pb. The relative nutrient and metal concentration followed the same trend for both the warm- and cool-season forages. For the first year, the order of nutrient and metal concentration was K > Ca > P > Mg > Fe > Mn > Cu > Zn > Pb for stinging nettle and K > Ca > P > Mg > Mn > Fe > Zn > Cu > Pb for bermudagrass and switchgrass, with an expected indication that the concentrations of the macro elements were more than that of the micro-elements. These results might be related to the growth and development of the specific forage.

3.2.2. Year Two Harvests/Cuttings

Table 3, for year 2, shows the dry biomass yield and corresponding nutrient contents as well as metal concentrations of the five cuttings during the second year. The biomass yield for the first cutting was significantly higher for the warm-season than for the cool-season forage. The second and third cuttings followed the same trend, and since the fourth and fifth cuttings were between just the bermudagrass and stinging nettle, the bermudagrass had a higher yield than the stinging nettle. Overall, bermudagrass recorded a consistently higher yield compared to stinging nettle and switchgrass for the first cutting, while switchgrass had the highest yield for the second and third cuttings.
The nutrient and metal concentrations from the forage samples shown in Table 3, year 2, appear to follow trends reported for the first year, with the cool-season forage having significantly higher concentrations of the elements than the warm-season grasses. The exceptions in the second year for metal and nutrient concentration levels were Cu and Mn, which were lower, as well as Pb, for which the cool-season forage had the lowest values.
The average of all the cuttings over the months for the second year presented in Table 4 shows that forages from the warm-season cuttings had significantly higher yields than the cool-season cuttings. Nutrient and metal concentrations were higher in the second year, apart from Mn, which was slightly lower in the cool-season forage.
Considering the average yield of specific forages for the second year, Table 5 indicates that switchgrass had a higher yield than bermudagrass, which had more biomass than stinging nettle. The nutrient and metal concentrations were higher for all forages, but their contents in stinging nettle were significantly higher than in switchgrass and the bermudagrass except for Pb. The contents were in the order of K > Ca > P > Mg > Fe > Mn > Cu > Zn > Pb for stinging nettle, K > Ca > Mg > P > Fe > Mn > Zn > Cu > Pb for switchgrass, and K > Ca > P > Mg > Fe> Mn > Zn > Cu > Pb for bermudagrass. In Table 6, the sources of variations, interactions and the significant levels of the variables are shown. Almost all the treatment effects were significant, as were the interactions. Mn did not show any significance except for the treatment for the first year, while the biomass, K, Ca, and P indicated a non-significance for treatment in the second year. Pb also demonstrated non-significance in the first year. The elements that were not significant did not show any level.
From the results of the analyses, the biomass yield depended on the maturity of the plant and when it was harvested. The biomass yield of these three forages exhibited both specific and general attributes because changes in the foliage appearance were observed over time as plants grew and matured. The stinging nettle exhibited a growth pattern where the foliage increased as the crop matured and declined substantially as the stem matured. This is because of the high proportion of the leaves to the stem in young plants. As the plant grows and matures, the proportion of the leave changes and the stem lengthens and becomes fibrous, increasing its total proportion in the biomass [52,53], which might reduce the nutrient and metal concentrations present in the leaves. However, the bermudagrass and switchgrass did not exhibit such growth patterns, so the total biomass yield decreased due to seasonal changes. In a study to determine accurate and precise measurements of plant maturity, switchgrass exhibited a sigmoidal development pattern, with phases that were related closely to temperature and rainfall patterns [54]. Therefore, the plant’s growth rate is closely tied to climate, but the timing of reproductive development is linked to photoperiod [55]. Much like the growth stages and biomass yield, the nutrient and elemental concentrations of forage crops also depend on the maturity and time of harvest. In a study to determine the effect of different harvesting times on the chemical composition of stinging nettle, it was found that stinging nettle harvested in April had the highest levels of P, K, Fe, Zn, samples collected in July contained the highest levels of Mn, and samples collected in September had the highest amounts of Ca and Mg [31]. These findings agree with the observations made in this study. Overall, at all stages of growth, the stinging nettle had higher levels of all the elements measured compared to switchgrass and bermudagrass, suggesting that it has great potential for use in nutrient removal or cycling as well as environmental sustainability. However, if the yield is low, the plants may not take up much of the metals on a mass basis.
Stinging nettle has been shown to be very nutritious. Stinging nettle hay contains 21 to 23% crude protein, 3 to 5% crude fats, 35 to 39% non-nitrogen extracts, 9 to 21% crude fiber, and 19 to 29% ash. Amino acids in dehydrated stinging nettle meal are nutritionally superior to those of dehydrated alfalfa (Medicago sativa L.) meal [56]. With good management and favorable weather, bermudagrass can produce crude protein levels ranging from 8–16% and total digestible nutrient content of 55% or higher. The nutrient of switchgrass is said to be as high as 16–17% crude protein if harvested correctly. In a study, the crude protein content of switchgrass ranged from a high of 17% in the early growing season to a low of 4% at forage maturity [57], while total digestible nutrients ranged from 63% in the early season to 55% at forage maturity.
Forage quality is associated with nutrients, protein, digestibility, fiber, mineral, and vitamins, among other factors, and it generally depends on the time of harvest and age of the plant or stage of maturity. This is because forages possess a mixture of chemical, physical, and structural characteristics that determine the quality of that pasture. Forage quality also varies, not only among different forage species but also among varieties of specific forage species. Furthermore, the forage quality of a specific variety can also vary due to field and management conditions.

3.3. Nutrient and Metal Concentrations in the Soil after Harvests

Results for the first-year analysis of composite soil samples after harvests are shown in Table 7. Soil pH and EC were not significantly different, with respective readings being 6.06, 6.22 and 5.88 in bermudagrass, switchgrass and stinging nettle plots for pH, and 72.3 µS cm−1, 90.1 µS cm−1, and 78.2 µS cm−1 for EC, respectively. Similarly, no significant differences in the nutrient and metal contents were observed among treatment plots, but Ca, Mg, and P contents were found to be slightly higher in switchgrass plots.
Table 8 shows the pH and EC values of the soil, as well as the nutrient and metal concentrations separated between the topsoil and subsoil for each forage crop. For the first year, the topsoil had a slightly higher pH and EC than the subsoil, but although the pH difference was significant for all forages, the EC showed significant differences between the top and subsoil only for switchgrass and bermudagrass. The same trend was found for nutrient and metal concentrations, with the topsoil being slightly higher than the subsoil for all elements except for Fe, Mn and Pb. While the analyses of the first year (Table 8) showed a slightly significant difference between the top and subsoil for the forage crops, except Cu and Fe, the analyses of the second year also indicated a slight increase in the topsoil but did not show any significant differences among all the forage crops. This difference between the topsoil and subsoil could be due to the stability of the roots and its underlying soil interactions in the second year of study as well as the seasonal poultry litter and inorganic fertilizer applications of the second year in addition to the split applications, which provided an even distribution for the nutrients and metals. Additionally, nutrients strongly cycled by plants, such as P and K, could be more concentrated in the topsoil (upper 20 cm) than nutrients that are usually less limiting for plants, indicating that the vertical distribution of a limiting nutrient would be shallower as the nutrient becomes more scarce [58].
Similar trends to the first year were observed for the second year as presented in Table 7, but pH values were slightly lower, at 5.81, 5.53 and 5.91, respectively, for bermudagrass, switchgrass and stinging nettle plots, while EC values were slightly higher. However, the nutrient and metal concentrations were lower for all the elements except Ca and K, as well as Mg in the switchgrass treatment (Table 7). Importantly, the heavy metal levels were all within the allowable limits (US EPA 2021, 2000) [59,60].
Based on the results of the topsoil and subsoil discussed for pH and EC in Table 8, as well as the much lower nutrient and metal concentrations except for Ca and K, analyses of the interactions done between each soil from the forage crop plot and the soil depth were also not significant for the two seasons (table not shown). Overall, the sources of variations and interactions of the variables for the soil analyses discussed for the first and second years did not show any significance and were not shown.
Based on the two seasons, the slight decrease in pH over time was not considered large enough to affect availability. This is because soil pH plays a critical role in the availability of nutrients to plants or uptake from the soil [61]. Conversely, the EC increased by 28%, 24% and 59% for bermudagrass, switchgrass and stinging nettle plots, respectively. The EC also decreased significantly with increasing depth for all treatments over the seasons. Though it is an important indicator of soil health, affecting crop yield and influencing key soil processes, soil EC is highly variable. The EC is not consistent enough to accurately predict the behavior of the nutrients and elements [62,63]. This is because, in a humid environment, EC is temporal, depends on past management of the field and is typically elevated in the spring/summer shortly after application of soluble fertilizer and reduced in late winter/early spring following winter leaching. The soil analyses also indicated that the recovery of the nutrients, particularly P, was lower in bermudagrass plots than switchgrass and stinging nettle plots. The total P uptake for bermudagrass for the first cuttings of the 2 years was shown to be 29.46 kg ha−1, while switchgrass had 30.14 kg ha−1, and uptake for stinging nettle was 32.08 kg ha−1. Similar findings were reported in a previous study on bermudagrass [64]. This might be associated with the influence of the properties of the soil, such as soil texture, which is a sandy loam in this study, so adsorption was not anticipated. Other studies on bermudagrass fertilized with broiler litter indicated that the buildup of soil P is influenced by soil physical and chemical properties. [19,64].
Generally, the analyses of the various components in this study could have a direct relationship with soil health. Sustainable agronomic production depends on healthy soil, which is affected by the physical, chemical, and biological properties of the soil and their combined components, including soil structure, pH and soil biology or organic matter. The concentrations of heavy metals in the soil have a tendency of altering these properties, and when they are out of balance, the soil health deteriorates. Soil biology and micro-organisms play key roles in soil fertility and soil health through organic matter dynamics and nutrient cycling [65,66]. When the soil is exposed to stressful situations, like extreme temperatures, drastic changes in pH or toxins from anthropogenic activities and mining, these organisms could be affected. Microbial viability in the soil decreases with increasing levels of heavy metal content from inorganic fertilization and some pesticides applied on agricultural lands [67,68], thus leading to substantial losses in crop productivity. However, for many of these heavy metals, uptake is influenced by soil characteristics like pH, cation exchange capacity (CEC), soil texture and organic carbon content. Moreover, metal uptake is plant-species dependent and is influenced by interactions of the elements in the soil solution [69,70]. A study of grasses and stinging nettle showed that the most important soil property that influenced metal concentrations in stinging nettle was the clay content, while organic matter (OM) and pH affected the concentrations for grasses [71]. Another study showed that the distribution of heavy metals in the alfalfa cultivated in three areas did not coincide with the average of these metals in the soils [72], suggesting a regional difference in the effect of heavy metals on the plants and their potential uptake. Similarly, research on alfalfa yield and soil properties which utilized flue gas desulfurization gypsum, biochar, bed ash, broiler litter ash and their combinations concluded that the amendments could be effective in reducing the accumulation and potential bioavailability as well as the harmful effects of heavy metals [26], thus preserving the health of the soil.
Experimental results have shown that the intensity of heavy metal accumulation in plants depends on the type of the soil, the species of plants, the physicochemical properties of heavy metals and their content in the soil [73]. This is because the toxicity and tolerance of metals were found to vary with crops and growth stages. While a high concentration of heavy metals could be detrimental to soil health, proper agronomic practices and management of farmlands, as well as the kinds of crops cultivated, will reduce the impact of heavy metals on the soil [74]. Seeking to improve soil health, increase forage productivity, improve forage nutritive value, and net farm profit in a hay production system, a study on soil microbial biomass under different seeding proportions and cropping systems of two forage grasses and one legume concluded that the total aboveground plant biomass was higher in a 50–50% mixture of grass and alfalfa than monoculture alfalfa and monoculture grass and can be used for improving soil health and forage productivity [75]. Similarly, intercropping of pasture ryegrass and forage alfalfa was found to increase the resistance of plants to heavy metals through the reduction of plant oxidative damage and increased antioxidant activity, which can increase biomass, reducing the absorption of Pb in forage plants [76].
The aforementioned scenarios and cropping systems confirm some of the strategies of our study towards a recommendation of double-cropping bermudagrass with a cool-season annual forage which has the potential to remediate high P soil [64]. This points to the potential of our approach for the recovery and recycling of nutrients following a poultry litter/fertilizer application on the soil.

4. Conclusions

This two-year field study compared the agronomic performance of two warm-season forage grasses (bermudagrass and switchgrass) with a potential cool-season forage crop (stinging nettle). While bermudagrass and switchgrass provided a significantly higher biomass yield than stinging nettle, stinging nettle tissue samples contained a higher heavy metal and nutrient concentration than bermudagrass and switchgrass, including a greater uptake of macronutrients over the warm season grasses. Nutrient and metal concentrations were lowest in bermudagrass, and there was no indication of any nutrient overload stemming from the application of poultry litter in the experimental field. Though a high concentration of heavy metals could be detrimental to soil health, employing proper management and cropping systems will sustain the health of the soil. Since the heavy metals and nutrient concentrations ebbed in the grasses and increased in the forbs, we propose mixed cropping of cool- and warm-season forages to mitigate the potential loss of P from surface-applied poultry litter and similar organic materials.
Furthermore, understanding the normal regional levels from agencies like the Environmental Protection Agency (US EPA) or World Health Organization (WHO) and their allowable limits for health concerns, as well as monitoring these levels or limits, would enable producers to maintain soil health and benefit from using manures or inorganic fertilizers for agricultural and environmental sustainability. The general result does not indicate that the concentration of heavy metals would be a problem in the field used for this study nor the crops as forages. Our results also suggest that stinging nettle could be a valuable forage crop comparable to traditional forage crops and could be a viable candidate for use in nutrients and bioremediation of high nutrients in the soil.

Author Contributions

Conceptualization, L.K.R., E.E.C. and N.J.; Methodology, N.J. and E.E.C.; Formal Analysis, E.E.C. and N.J.; Investigation, N.J.; Resources, L.K.R., and V.R.R., writing original draft preparation, N.J., writing review and editing, E.E.C., N.J., D.T., L.K.R., funding acquisition, L.K.R. All authors have read and agreed to the published version of the manuscript.

Funding

This research was funded by USDA-NIFA-1890 Institution Capacity Building Grant award #2010-38821-21479. The APC was funded by USDA-ARS Project number 8042-12000-043-000-D.

Institutional Review Board Statement

Not applicable.

Informed Consent Statement

Not applicable.

Data Availability Statement

Not applicable.

Acknowledgments

The authors wish to thank Michael Brandt for assisting in field preparation and collection of experimental samples. The assistance of Mebrat Gesese in diligently analyzing the various samples collected for this experiment is appreciated.

Conflicts of Interest

The authors declare no conflict of interest.

References

  1. Pederson, G.A.; Brink, G.E.; Fairbrother, T.E. Nutrient Uptake in Plant Parts of Sixteen Forages Fertilized with Poultry Litter. Agron. J. 2002, 94, 895–904. [Google Scholar] [CrossRef]
  2. Ashjaei, S.; Miller, W.P.; Cabrera, M.L.; Hassan, S.M. Arsenic in Soils and Forages from Poultry Litter-Amended Pastures. Int. J. Environ. Res. Public Health 2011, 8, 1534–1546. [Google Scholar] [CrossRef] [PubMed] [Green Version]
  3. Rushing, J.B.; Lemus, R.W.; Maples, J.G.; Lyles, J.C. Impact of poultry litter application on alfalfa grown in Mississippi. Crop. Forage Turfgrass Manag. 2020, 6, 20049. [Google Scholar] [CrossRef]
  4. Kpomblekou-A, K.; Ankumah, R.O.; Ajwa, H.A. Trace and nontrace element contents of broiler litter. Commun. Soil Sci. Plant Anal. 2002, 33, 1799–1811. [Google Scholar] [CrossRef]
  5. Bolan, N.S.; Szogi, A.A.; Chuasavathi, T.; Seshadri, B.; Rothrock, M.J.; Panneerselvam, P. Uses and management of poultry litter. World’s Poult. Sci. J. 2010, 66, 673–698. [Google Scholar] [CrossRef] [Green Version]
  6. Ashworth, A.J.; Chastain, J.P.; Moore, J.P.A. Nutrient characteristics of poultry manure and litter. In Animal Manure: Production, Characteristics, Environmental Concerns, and Management; Waldrip, H.M., Pagliari, P.H., He, Z., Eds.; ASA special publication 67; American Society of Agronomy: Madison, WI, USA, 2019; Volume 67, pp. 63–87. ISBN 9780891183716. [Google Scholar] [CrossRef]
  7. Tsai, C.-C.; Chang, Y.-F. Poultry Litter Biochar as a Gentle Soil Amendment in Multi-Contaminated Soil: Quality Evaluation on Nutrient Preservation and Contaminant Immobilization. Agronomy 2022, 12, 405. [Google Scholar] [CrossRef]
  8. Kingery, W.L.; Wood, C.W.; Delaney, D.P.; Williams, J.C.; Mullins, G.L.; van Santen, E. Implications of Long-Term Land Application of Poultry Litter on Tall Fescue Pastures. J. Prod. Agric. 1993, 6, 390–395. [Google Scholar] [CrossRef]
  9. Anderson, K.R.; Moore, P.A.; Miller, D.M.; DeLaune, P.B.; Edwards, D.R.; Kleinman, P.J.A.; Cade-Menun, B.J. Phosphorus Leaching from Soil Cores from a Twenty-Year Study Evaluating Alum Treatment of Poultry Litter. J. Environ. Qual. 2018, 47, 530–537. [Google Scholar] [CrossRef]
  10. Touhami, D.; McDowell, R.W.; Condron, L.M.; Bouray, M. Nitrogen fertilization effects on soil phosphorus dynamics under a grass-pasture system. Nutr. Cycl. Agroecosyst. 2022. [Google Scholar] [CrossRef]
  11. Xiao, J.; Yin, X.; Sykes, V.R.; He, Z. Differential accumulation of heavy metals in soil profile and corn and soybean grains after 15-year poultry litter application under no-tillage. J. Soils Sediments 2021, 22, 844–858. [Google Scholar] [CrossRef]
  12. Liu, W.-R.; Zeng, D.; She, L.; Su, W.-X.; He, D.-C.; Wu, G.-Y.; Ma, X.-R.; Jiang, S.; Jiang, C.-H.; Ying, G.-G. Comparisons of pollution characteristics, emission situations, and mass loads for heavy metals in the manures of different livestock and poultry in China. Sci. Total Environ. 2020, 734, 139023. [Google Scholar] [CrossRef] [PubMed]
  13. Sims, J.; Wolf, D. Poultry Waste Management: Agricultural and Environmental Issues. Adv. Agron. 1994, 52, 1–83. [Google Scholar] [CrossRef]
  14. Mohanna, C.; Nys, Y. Effect of dietary zinc content and sources on the growth, body zinc deposition and retention, zinc excretion and immune response in chickens. Br. Poult. Sci. 1999, 40, 108–114. [Google Scholar] [CrossRef] [PubMed]
  15. Ukpe, R.A.; Chokor, A.A. Correlation between Concentrations of Some Heavy Metal in Poultry Feed and Waste. Open Access J. Toxicol. 2018, 3, 555609. [Google Scholar] [CrossRef]
  16. Jaja, N.; Mbila, M.; Codling, E.E.; Reddy, S.S.; Reddy, C.K. Trace Metal Enrichment and Distribution in a Poultry Litter-amended Soil under different Tillage Practices. Open Agric. J. 2013, 7, 88–95. [Google Scholar] [CrossRef] [Green Version]
  17. Adeli, A.; Rowe, D.E.; Read, J.J. Effects of Soil Type on Bermudagrass Response to Broiler Litter Application. Agron. J. 2006, 98, 148–155. [Google Scholar] [CrossRef] [Green Version]
  18. Brink, G.E.; Sistani, K.R.; Oldham, J.L.; Kingery, W.E.; Johnson, B. Broiler Litter Application Rate Effects on Bermudagrass Nutrient Uptake and Phosphorus Level of Soils Differing in Application History. J. Sustain. Agric. 2008, 31, 79–94. [Google Scholar] [CrossRef]
  19. Read, J.J.; Lang, D.J.; Adeli, A.; Jenkins, J.N. Managing harvest of ‘Russell’ and ‘Tifton 44’ bermudagrass receiving broiler litter for nutritive value and phosphorus removal. Crop. Forage Turfgrass Manag. 2020, 6, 20013. [Google Scholar] [CrossRef]
  20. Ibrahim, M.; Hong, C.O.; Singh, S.; Kumar, S.; Osborne, S.; Owens, V. Switchgrass Biomass Quality as Affected by Nitrogen Rate, Harvest Time, and Storage. Agron. J. 2017, 109, 86–96. [Google Scholar] [CrossRef] [Green Version]
  21. Dere, A.L.; Stehouwer, R.C.; McDonald, K.E. Nutrient Leaching and Switchgrass Growth in Mine Soil Columns Amended with Poultry Manure. Soil Sci. 2011, 176, 84–90. [Google Scholar] [CrossRef]
  22. Gaston, L.; Blazier, M.; Beasley, J.; Dodla, S.; Felicien, W.; Clason, T. Silvopasture Switchgrass Fertilized with Poultry Litter: Nutrient Removal, Soil Fertility, and Runoff Water Quality. Commun. Soil Sci. Plant Anal. 2019, 50, 948–958. [Google Scholar] [CrossRef]
  23. Pagliari, P.H.; Rosen, C.J.; Strock, J. Turkey Manure Ash Effects on Alfalfa Yield, Tissue Elemental Composition, and Chemical Soil Properties. Commun. Soil Sci. Plant Anal. 2009, 40, 2874–2897. [Google Scholar] [CrossRef]
  24. Tautges, N.E.; Borrelli, K.; Burke, I.C.; Fuerst, E.P. Nitrogen fertility effects of alfalfa, pea green manure, and poultry manure on organic wheat productivity in a semiarid climate. Agroecol. Sustain. Food Syst. 2017, 42, 169–188. [Google Scholar] [CrossRef]
  25. Majeed, A.; Muhmood, A.; Niaz, A.; Ditta, A.; Rajpar, M.N. Comparative efficacy of different biochars and traditional manures in the attenuation of cadmium toxicity in rice (Oryza sativa L.). Arab. J. Geosci. 2022, 15, 209. [Google Scholar] [CrossRef]
  26. Codling, E.E.; Jaja, N. Effects of amendments on soil chemical properties, alfalfa yield and nutrient uptake. J. Plant Nutr. 2021, 45, 33–48. [Google Scholar] [CrossRef]
  27. Vogl, C.; Hartl, A. Production and processing of organically grown fiber nettle (Urtica dioica L.) and its potential use in the natural textile industry: A review. Am. J. Altern. Agric. 2003, 18, 119–128. [Google Scholar] [CrossRef]
  28. Suomela, J.A.; Vajanto, K.; Räisänen, R. Seeking Nettle Textiles—Utilizing a Combination of Microscopic Methods for Fibre Identification. Stud. Conserv. 2018, 63, 412–422. [Google Scholar] [CrossRef] [Green Version]
  29. Bogard, F.; Bach, T.; Abbes, B.; Bliard, C.; Maalouf, C.; Bogard, V.; Beaumont, F.; Polidori, G. A comparative review of Nettle and Ramie fiber and their use in biocomposites, particularly with a PLA matrix. J. Nat. Fibers 2021. [Google Scholar] [CrossRef]
  30. Kregiel, D.; Pawlikowska, E.; Antolak, H. Urtica spp.: Ordinary Plants with Extraordinary Properties. Molecules 2018, 23, 1664. [Google Scholar] [CrossRef] [Green Version]
  31. Paulauskienė, A.; Tarasevičienė, Ž.; Laukagalis, V. Influence of Harvesting Time on the Chemical Composition of Wild Stinging Nettle (Urtica dioica L.). Plants 2021, 10, 686. [Google Scholar] [CrossRef]
  32. Bekele, B.; Melesse, A.; Beyan, M.; Berihun, K. The effect of feeding stinging nettle (Urtica simensis S.) leaf meal on feed intake, growth performance and carcass characteristics of hubbard broiler chickens. Glob. J. Sci. Front. Res. 2015, 15. Available online: https://globaljournals.org/GJSFR_Volume15/1-The-Effect-of-Feeding.pdf (accessed on 15 February 2022).
  33. Kreitzman, M.; Toensmeier, E.; Chan, K.M.A.; Smukler, S.; Ramankutty, N. Perennial Staple Crops: Yields, Distribution, and Nutrition in the Global Food System. Front. Sustain. Food Syst. 2020, 4, 216. [Google Scholar] [CrossRef]
  34. Humphries, D.J.; Reynolds, C.K. The effect of adding stinging nettle (Urtica dioica) haylage to a total mixed ration on performance and rumen function of lactating dairy cows. Anim. Feed. Sci. Technol. 2014, 189, 72–81. [Google Scholar] [CrossRef]
  35. Grela, E.R.; Krusiński, R.; Matras, J. Efficacy of diets with antibiotic and herb mixture additives in feeding of growing-finishing pigs. J. Anim. Feed Sci. 1998, 7, 171–175. [Google Scholar] [CrossRef] [Green Version]
  36. Tennie, C.; Hedwig, D.; Call, J.; Tomasello, M. An experimental study of nettle feeding in captive gorillas. Am. J. Primatol. 2008, 70, 584–593. [Google Scholar] [CrossRef]
  37. Pałka, S.; Otwinowska-Mindur, A.; Migdał, Ł.; Kmiecik, M.; Wojtysiak, D. Effect of a Diet Supplemented with Nettle (Urtica dioica L.) or Fenugreek (Trigonella foenumgraecum L.) on the Post-Slaughter Traits and Meat Quality Parameters of Termond White Rabbits. Animals 2021, 11, 1566. [Google Scholar] [CrossRef]
  38. Tack, F.; Verloo, M. Metal contents in stinging nettle (Urtica dioica L.) as affected by soil characteristics. Sci. Total Environ. 1996, 192, 31–39. [Google Scholar] [CrossRef] [Green Version]
  39. Codling, E.E.; Rutto, K.L. Stinging nettle (Urtica dioica L.) growth and mineral uptake from lead-arsenate contaminated orchard soils. J. Plant Nutr. 2014, 37, 393–405. [Google Scholar] [CrossRef]
  40. Thomas, G.W. Soil pH and Soil Acidity. In Methods of Soil Analysis; Sparks, D.L., Ed.; SSSA: Madison, WI, USA, 1996; pp. 475–490. [Google Scholar]
  41. Rhoades, J.D. Salinity: Electrical Conductivity and Total Dissolved Solids. In Methods of Soil Analysis; Sparks, D.L., Ed.; SSSA: Madison, WI, USA, 1996; pp. 417–435. [Google Scholar]
  42. Sparks, D.L. Mehlich III Method. In Methods of Soil Analysis; Sparks, D.L., Ed.; ASA and SSSA: Madison, WI, USA, 1996; pp. 739–768. [Google Scholar]
  43. Statistical Analysis System (SAS). SAS, Proc Mixed, 9.4th ed.; SAS Institute: Cary, NC, USA, 2012. [Google Scholar]
  44. Steel, R.G.D.; Torrie, J.H. Duncan’s New Multiple Range Test. In Principles and Procedures of Statistic; McGraw-Hill: New York, NY, USA, 1980; pp. 187–188. [Google Scholar]
  45. Duble, R.L. Bermudagrass: The sports turf of the South. Aggie Horticulture 2007. Available online: https://aggie-horticulture.tamu.edu/plantanswers/turf/publications/Bermuda.html (accessed on 12 February 2022).
  46. Holman, J.; Gillen, R.; Moyer, J.L. Kansas Switchgrass Production Handbook; Agricultural Experiment Station and Cooperative Extension Service; Kansas State University: Manhattan, KS, USA, 2011; Available online: https://bookstore.ksre.ksu.edu/pubs/mf3018.pdf (accessed on 13 February 2022).
  47. Henning, T.; Quandt, D.; Grosse-Veldmann, B.; Monro, A.; Weigend, M. Weeding the nettles II: A delimitation of “Urtica dioica L.” (Urticaceae) based on morphological and molecular data, including a rehabilitation of Urtica gracilis Ait. Phytotaxa 2014, 162, 61–83. [Google Scholar] [CrossRef]
  48. Brink, G.E.; Sistani, K.R.; Rowe, D.E. Nutrient Uptake of Hybrid and Common Bermudagrass Fertilized with Broiler Litter. Agron. J. 2004, 96, 1509–1515. [Google Scholar] [CrossRef] [Green Version]
  49. Global Biodiversity Information Facility. Available online: https://www.gbif.org/ (accessed on 3 November 2021).
  50. Fransen, S.; Kugler, J.; Evans, D.W.; Ford, W.P. Alfalfa irrigation management. In Drought Advisory, EM4824; Washington State University Cooperative Extension; Washington State University: Pullman, WA, USA, 2001; Available online: http://pubs.wsu.edu (accessed on 12 February 2022).
  51. Aiken, G.E.; Sladden, S.E.; Bransby, D.I. Cutting Height and Frequency Effects on Composition, Yield, and Quality of a Bermudagrass-Crabgrass Mixture. J. Prod. Agric. 1995, 8, 79–83. [Google Scholar] [CrossRef]
  52. Mueller, S.; Teuber, L. Alfalfa Growth and Development. In Irrigated Alfalfa Management in Mediterranean and Desert Zones; Summers, C., Putnam, D., Eds.; University of California Division of Agriculture and Natural Resources: Oakland, CA, USA, 2007. [Google Scholar]
  53. Sena, K.L.; Goff, B.; Davis, D.; Smith, S.R. Switchgrass Growth and Forage Quality Trends Provide Insight for Management. Crop. Forage Turfgrass Manag. 2018, 4. [Google Scholar] [CrossRef]
  54. Sanderson, M.A. Morphological Development of Switchgrass and Kleingrass. Agron. J. 1992, 84, 415–419. [Google Scholar] [CrossRef]
  55. Parrish, D.J.; Fike, J.H. The Biology and Agronomy of Switchgrass for Biofuels. Crit. Rev. Plant Sci. 2005, 24, 423–459. [Google Scholar] [CrossRef]
  56. Bassett, I.J.; Crompton, C.W.; Woodland, D.W. The biology of Canadian weeds Urtica dioica L. Can. J. Plant Sci. 1977, 57, 491–498. [Google Scholar] [CrossRef]
  57. Ball, D.M.; Collins, M.; Lacefield, G.D.; Martin, N.P.; Mertens, D.A.; Olson, K.E.; Putnam, D.H.; Under-sander, D.J.; Wolf, M.W. Understanding Forage Quality; American Farm Bureau Federation Publication: Park Ridge, IL, USA, 2001. Available online: https://fyi.extension.wisc.edu/forage/files/2017/04/FQ.pdf (accessed on 14 February 2022).
  58. Jobbágy, E.G.; Jackson, R.B. The distribution of soil nutrients with depth: Global patterns and the imprint of plants. Biogeochemistry 2001, 53, 51–77. [Google Scholar] [CrossRef]
  59. US EPA. Ecological Soil Screening Level Metal Contaminants. 2021. Available online: https://www.epa.gov/chemical-research/ecological-soil-screening-level-metal-contaminants (accessed on 16 February 2022).
  60. US EPA. Heavy Metal Soil Contamination. Soil Quality—Urban Technical Note No. 3. 2000. Available online: https://semspub.epa.gov/work/03/2227185.pdf (accessed on 16 February 2022).
  61. Penn, C.; Camberato, J. A Critical Review on Soil Chemical Processes that Control How Soil pH Affects Phosphorus Availability to Plants. Agriculture 2019, 9, 120. [Google Scholar] [CrossRef] [Green Version]
  62. Corwin, D.; Lesch, S. Apparent soil electrical conductivity measurements in agriculture. Comput. Electron. Agric. 2005, 46, 11–43. [Google Scholar] [CrossRef]
  63. Othaman, N.N.C.; Isa, M.N.M.; Ismail, R.C.; Ahmad, M.I.; Hui, C.K. Factors that affect soil electrical conductivity (EC) based system for smart farming application. AIP Conf. Proc. 2020, 2203, 020055. [Google Scholar] [CrossRef]
  64. Read, J.J.; Lang, D.J.; Adeli, A.; Jenkins, J.N. Harvest Management Effects on ‘Tifton 44’ Bermudagrass Phosphorus Removal and Nutritive Value. Agron. J. 2018, 110, 879–889. [Google Scholar] [CrossRef]
  65. Srivastava, V.; Sarkar, A.; Singh, S.; Singh, P.; Araujo, A.; Singh, R.P. Agroecological Responses of Heavy Metal Pollution with Special Emphasis on Soil Health and Plant Performances. Front. Environ. Sci. 2017, 5, 64. [Google Scholar] [CrossRef] [Green Version]
  66. Fierer, N.; Wood, S.; de Mesquita, C.P.B. How microbes can, and cannot, be used to assess soil health. Soil Biol. Biochem. 2021, 153, 108111. [Google Scholar] [CrossRef]
  67. Wang, Y.; Shi, J.; Wang, H.; Lin, Q.; Chen, X.; Chen, Y. The influence of soil heavy metals pollution on soil microbial biomass, enzyme activity, and community composition near a copper smelter. Ecotoxicol. Environ. Saf. 2007, 67, 75–81. [Google Scholar] [CrossRef] [PubMed]
  68. Tóth, G.; Hermann, T.; Da Silva, M.; Montanarella, L. Heavy metals in agricultural soils of the European Union with implications for food safety. Environ. Int. 2016, 88, 299–309. [Google Scholar] [CrossRef]
  69. Kabata-Pendias, A. Trace Elements in Soils and Plants, 4th ed.; CRC Press: Boca Raton, FL, USA, 2010. [Google Scholar]
  70. Adriano, D.C. Trace Elements in Terrestrial Environments Biogeochemistry, Bioavailability and Risks of Metals, 2nd ed.; Springer: New York, NY, USA, 2001. [Google Scholar]
  71. Boshoff, M.; De Jonge, M.; Scheifler, R.; Bervoets, L. Predicting As, Cd, Cu, Pb and Zn levels in grasses (Agrostis sp. and Poa sp.) and stinging nettle (Urtica dioica) applying soil–plant transfer models. Sci. Total Environ. 2014, 493, 862–871. [Google Scholar] [CrossRef] [PubMed]
  72. Rezaeian, M.; Moghadam, M.T.; Kiaei, M.M.; Zadeh, H.M. The effect of heavy metals on the nutritional value of Alfalfa: Comparison of nutrients and heavy metals of Alfalfa (Medicago sativa) in industrial and non-industrial areas. Toxicol. Res. 2019, 36, 183–193. [Google Scholar] [CrossRef] [PubMed]
  73. Grytsyuk, N.; Arapis, G.; Perepelyatnikova, L.; Ivanova, T.; Vynograds’ka, V. Heavy metals effects on forage crops yields and estimation of elements accumulation in plants as affected by soil. Sci. Total Environ. 2006, 354, 224–231. [Google Scholar] [CrossRef] [PubMed]
  74. Santos, F.T.; Costa, M.S.S.M.; Costa, L.A.M.; Trindade, H.; Tonial, L.M.S.; Lorin, H.E.F.; Goufo, P. Spectroscopic and Physicochemical Characterization of Poultry Waste-Based Composts and Charcoal–Compost Mixtures for the Prediction of Dry Matter Yield of Giant of Italy Parsley. Agronomy 2022, 12, 256. [Google Scholar] [CrossRef]
  75. Dhakal, D.; Islam, M.A. Grass-Legume Mixtures for Improved Soil Health in Cultivated Agroecosystem. Sustainability 2018, 10, 2718. [Google Scholar] [CrossRef] [Green Version]
  76. Cui, T.; Fang, L.; Wang, M.; Jiang, M.; Shen, G. Intercropping of Gramineous Pasture Ryegrass (Lolium perenne L.) and Leguminous Forage Alfalfa (Medicago sativa L.) Increases the Resistance of Plants to Heavy Metals. J. Chem. 2018, 2018, 7803408. [Google Scholar] [CrossRef] [Green Version]
Figure 1. Monthly precipitation (mm) and temperature (°C) records of the experimental region during the study and growing seasons from 2011–2013 (usclimatedata.com).
Agronomy 12 00570 g001
Table 1. Initial experimental plot analysis for soil and poultry litter.
ComponentpHECCaCdCuFeKMgMnPPbZn
µS cm−1mg kg−1
Soil6.0650238nd0.8314313935.89.5974.91.2
Poultry Litter6.5817,43015,308 0.14241170425,32753,79251211,8840.83318
Table 2. Poultry litter (PL) and inorganic fertilizer (IF) rates and sequence of applications.
Application SequenceDateTotal N (%)Amount of PL AppliedAmount of IF Applied
PLIFkg plot−1
First applicationSpring-Year 11.7046-0-032.01.18
Second applicationSpring-Year 23.8816-0-07.011.70
Third applicationFall-Year 22.4916-0-010.931.70
Table 3. Nutrient and metal concentrations in switchgrass (SG), bermudagrass (BG) and stinging nettle (SN) cuttings for the first and second year.
TreatmentsCuttingYieldCaCuFeKMgMnPPbZn
kg ha−1mg kg−1
Year 1
SG17221 ± 2912 a2528 ± 201 b15.90 ± 2.3 b47.08 ± 11.4 b18,116 ± 2637 b1830 ± 358 c51.63 ± 28 bc2703 ± 180 b2.00 ± −0.24 a18.10 ± 3.6 c
BG14807 ± 1490 b2590 ± 134 b13.07 ± 1.31 c52.68 ± 8.8 b22,103 ± 2746 b2073 ± 236 b74.03 ± 27 bc2966 ± 438 b1.32 ± −0.12 b22.98 ± 2.3 b
SN12425 ± 1000 c26,169 ± 2508 a18.71 ± 2.7 a250.35 ± 108 a36,312 ± 3367 a6429 ± 1293 a109 ± 75 ab6599 ± 278 a0.59 ± 0.23 c29.23 ± 7.2 a
SG28786 ± 1765 a1943 ± 80 b9.85± 1.5 b51.68 ± 15.7 a10,488 ± 2262 c1531 ± 272 b109 ± 50 b1342 ± 93 c1.58 ± 0.28 ab9.08 ± 1.9 c
BG27198 ± 635 ab3318 ± 310 b11.01 ± 0.7 a28.10 ± 3.9 a18,197 ± 2017 b1650 ± 53 b132 ± 64 ab2170 ± 38 b1.26 ± 0.19 b18.18 ± 2.7 ab
SN23364 ± 1149 c16,846 ± 1334 a7.65 ± 1.9 bc60.05 ± 17.0 a40,860 ± 3886 a3482 ± 343 a198 ± 122 a4048 ± 560 a0.53 ± 0.37 c15.40 ± 2.8 ab
SG32152 ± 1277 b2478 ± 372 c9.20 ± 1.26 b33.98 ± 3.9 c9673 ± 357 c1561 ± 235 bc120 ± 86 a1459 ± 193 c1.12 ± 0.27 a10.15 ± 2.0 b
BG38834 ± 1017 a13,629 ± 1139 b10.67 ± 0.74 ab141.48 ± 8.5 b20,861 ± 1831 b1227 ± 92 c61.9 ± 46 b1962 ± 81 b1.27 ± 0.07 a19.03 ± 2.1 a
SN3851 ± 492 c18,644 ± 2502 a7.36 ± 0.69 c472.15 ± 85 a41,940 ± 3153 a4184 ± 972 a76.6 ± 44 b4733 ± 208 a0.43 ± 0.22 b20.60 ± 2.0 a
BG410,426 ± 2020 a2576 ±329 b11.89 ± 1.95 a39.30 ± 15 b13,813 ± 2268 b1298 ± 263 b139 ± 95 a1785 ± 190 b1.93 ± 0.46 a14.70 ± 1.3 b
SN44200 b ± 117422,584 ± 737 a8.23 ± 0.72 b416.73 ± 188 a34,693 ± 3191 a4799 ± 254 a66 ± 24 b5562 ± 303 a0.33 ± 0.20 b21.73 ± 2.0 a
BG55703 ± 568 a2805 ± 181 b14.79 ± 2.3 a38.75 ± 2.2 b14,075 ± 907 b1491 ± 270 b175.5 ± 112 a2012 ± 90 b2.00 ± 0.30 a17.68 ± 2.4 a
SN51192 ± 600 b29,036 ± 737 a10.81 ± 0.48 ab582.48 ± −282 a41,775 ± 7719 a5907 ± 366 a39.7 ± 12 b7463 ± 850 a0.43 ± 0.18 b18.83 ± 2.2 a
Year 2
SG16777 ± 660 b2224 ± 263 b4.78 ± 0.58 b72.3 ± 2.76 b20,138 ± 2552 c1619 ± 167 b69.7 ± 26.8 ab1567 ± 188 b0.49 ± 0.09 ab15.3 ± 3.5 b
BG18057 ± 4366 a2316 ± 144 b6.25 ± 0.21 b63.8 ± 3.34 c22,057 ± 1904 c1675 ± 144 b40.3 ± 20.3 bc1887 ± 144 b0.25 ± 0.18 b16.5 ± 0.9 b
SN12925 ± 825 c13,556 ± 1818 a14.30 ± 1.63 a89.0 ± 20.87 a46,294 ± 4252 a4066 ± 404 a63.6 ± 10.6 c5499 ± 320 a0.20 ± 0.24 b23.2 ± 1.3 a
SG28575 ± 3919 a1512 ± 140 bc2.45 ± 0.17 b58.0 ± 8.98 b7940 ± 1360 c952 ± 50 c66.7± 34.8 a840 ± 48 c0.24 ± 0.16 b7.3 ± 1.3 c
BG27644 ± 4941 ab2297 ± 480 b4.20 ± 0.56 b77.2 ± 14.77 a15,779 ± 2763 b1245 ± 220 b47.1 ± 18.1 b1540 ± 372 b0.40 ± 0.07 a14.8 ± 3.4 b
SN22895 ± 731 c12,603 ± 2323 a11.47 ± 3.15 a50.7 ± 7.79 b44,981 ± 8877 a3419 ± 599 a62.8 ± 11.7 a5217 ±638 a0.15 ± 0.18 bc19.2 ± 2.8 a
SG36651 ± 757 a1961 ± 365 b3.20 ± 0.14 c68.6 ± 33.76 a9488 ± 938 b1246 ± 220 b43.8 ± 25.7 ab1069 ± 188 c0.40 ± 0.11 b8.6 ± 2.1 c
BG35259 ± 661 b2911 ± 373 b5.75 ± 1.16 b72.2 ± 20.02 a8865 ± 3533 b1593 ± 342 b63.3 ± 28.0 a1523 ±286 b0.42 ± 0.15 a21.8 ± 3.4 a
SN34620 ± 284 c13,102 ± 8773 a11.73 ± 2.16 a71.2 ± 13.77 a38,373 ± 13,612 a4790 ± 3131 a35.9 ± 22.4 c5918 ± 3871 a0.21 ± 0.03 c16.3 ± 9.7 b
BG41203 ± 529 a3756 ± 709 b7.62 ± 0.91 ab99.9 ± 13.28 a14,926 ± 4896 b2355 ± 727 b52.7 ± 24.9 b2051 ± 419 b0.60 ± 0.11 a28.2 ± 3.3 a
SN4814 ± 131 b14,808 ± 2198 a9.52 ± 2.46 a79.4 ± 16.41 ab40,031 ± 3940 a4837 ± 768 a76.3 ± 15.2 a5114 ± 459 a0.53 ± 0.15 ab20.0 ± 0.8 ab
BG55016 ± 1876 a3595 ± 3.5 b7.40 ± 0.20 b80.6 ± 6.35 ab15,473 ± 2511 b2383 ± 19 b42.4 ± 16.1 a3041 ± 72 b0.50 ± 0.04 a25.5 ± 0.9 a
SN52566 ± 565 b20,333 ± 5286 a11.67 ± 1.72 a96.9 ± 6.27 a43,072 ± 2333 a6202 ± 834 a41.2 ± 9.5 a6863 ± 315 a0.01 ± 0.01 b21.1 ± 1.9 ab
Means within columns and cutting with the same letters are not significant at p < 0.05 levels with ± Standard Deviation.
Table 4. Nutrient and metal concentrations averaged over forage cuttings for the first and second year.
MonthsCuttingYieldCaCuFeKMgMnPPbZn
kg ha−1mg kg−1
Year 1
May14818 c10,426 c15.90 a116.7 c25,551 ab3.44 ab78.2 b4089 b1.30 a23.43 a
July26449 b7369 d9.52 c46.6 c23,181 b2.22 c146.2 a2521 d1.12 ab14.22 c
August33946 d11,582 bc9.07 c215.9 b24,158 b2.32 c86.2 b2718 d0.94 b16.60 b
Sep47313 a12,580 b10.08 c228.0 ab24,253 b3.05 b102.8 ab3673 c1.13 ab18.21 b
Oct53447 e15,921 a12.80 b310.6 a27,925 a3.70 a107.6 ab4737 a1.21 a18.25 b
Year 2
May15919 ab6032 b8.37 a75.0 bc29,496 a2454 b57.9 ab2984 bc0.31 b18.3 b
July26371 a5471 b6.04 b62.0 c22,900 bc1872 b58.9 ab2532 c0.26 b13.8 c
August34481 c5992 b6.89 b70.7 c18,909 c2543 b47.7 ab2837 bc0.34 b15.5 bc
Sept41009 e9282 a8.57 a89.6 a27,478 ab3596 a64.5 a3583 b0.56 a24.1 a
Oct53791 d11,964 a9.54 a88.8 ab29,273 a4293 a41.8 b4952 a0.25 a23.3 a
Means within columns and cutting with the same letters are not significant at p < 0.05 levels.
Table 5. Nutrient and metal concentrations averaged over forage crops for the first and second year.
CropsYieldCaCuFeKMgMnPPbZn
kg ha−1mg kg−1
Year 1
Switchgrass6053 b2314 c11.65 ab44.2 b12,759 c1641 b101 a1835 c1.57 a12.4 c
Bermudagrass7393 a4984 b12.29 a60.1 b17,810 b1548 b112 a2179 b1.56 a18.5 b
Stinging Nettle2496 c22,654 a10.56 b356 a39,116 a4960 a98 a5681 a0.46 b21.2 a
Year 2
Switchgrass7334 a1899 b3.44 c66.3 b12,522 b1273 b60.1 a1159 c0.38 a10.4 b
Bermudagrass5436 b2975 b6.24 b78.6 a15,420 b1851 b49.1 a2008 b0.43 a21.3 a
Stinging Nettle2147 c14,880 a11.70 a77.4 a42,550 a4663 a56.0 a5722 a0.22 b19.9 a
Means within columns with the same letters are not significant at p < 0.05 levels.
Table 6. F statistics and significance levels for treatments and cuttings for the first and second year.
BiomassCaCuFeKMgMnPPbZn
Source of VariationF Values
Year 1
Treatment9.06 ***57.3 ***7.09 ***6.4 ***5.44 ***7.90 ***2.65 *19.6 ***5.94 ***2.45 *
Cuttings12.6 ***52.2 ***29.5 ***10.2 ***2.87 *17.5 ***1.7373.5 ***3.1814.9 ***
Crop67.6 ***1138 ***4.79 *47.8 ***323 ***259 ***0.21627 ***115 ***34.8 ***
Treatment * cutting * crop6.05 ***236 ***14.2 ***14.9 ***57.6 ***52.9 ***1.94139 ***23.2 ***12.0 ***
Year 2
Treatment1.211.093.54 **2.8 *1.00.781.610.303.68 **5.34 ***
Cutting8.26 ***7.76 ***8.83 ***5.8 ***8.2 ***9.3 ***1.626.61 ***7.68 ***16.16 ***
Crop16.1 ***92.2 ***121 ***0.36171 ***51.0 ***1.0314.7 ***15.7 ***22.5 ***
Treatment * cutting * crop20.0 ***18.5 ***24.7 ***3.4 **31.7 ***12.0 ***1.514.7 ***7.0 ***11.8 ***
*** Significant at the 0.0001 probability level; ** significant at the 0.001 probability level; * significant at the 0.05 probability level.
Table 7. Soil pH, EC, nutrient and metals from forage plots for the first and second year.
CroppHECCaCuFeKMgMnPPbZn
µS cm1mg kg−1
Year 1
Bermudagrass6.06 ab72.3 a227 b1.84 a347 ab191 a46.2 b21.2 a185 b10.4 a2.39 a
Switchgrass6.22 a90.1 a301 a1.86 a383 a202 a62.2 a24.0 a254 a11.7 a2.92 a
Stinging Nettle5.88 b78.2 a211 b1.51 a318 b174 a40.7 b19.5 a172 b11.2 a2.01 a
Year 2
Bermudagrass5.81 ab101 b322 a1.11 a149 a241 a51.9 a19.1 a160 a5.50 a2.35 a
Switchgrass5.53 b118 ab327 a1.12 a150 a212 a50.7 a13.5 a125 a5.24 a2.10 a
Stinging Nettle5.91 a193 a295 a1.20 a129 a210 a45.8 a13.6 a122 a6.30 a1.98 a
Means within columns with the same letters are not significant at p < 0.05 levels.
Table 8. Soil pH, EC, nutrient and metal concentrations on soil depth from switchgrass (SG), bermudagrass (BG) and stinging nettle (SN) plots for the first and second year.
CropsDepthpHECCaCuFeKMgMnPPbZn
cm µS cm−1mg kg−1
Year 1
SG0–156.47 ± 0.28 a100 ± 26 a357 ± 108 a2.20 ± 0.61 a381 ± 51 a265 ± 69 a74 ± 21 a27.7 ± 8.6 a304 ± 43 a12.0 ± 2.7 a4.16 ± 1.85 a
15–305.97 ± 0.18 b83 ± 15 b245 ± 54 b1.52 ± 0.35 a386 ± 58 a139 ± 52 a50 ± 12 b20.2 ± 3.7 ab203 ± 43 b11.4 ± 2.7 a1.69 ± 0.53 b
BG0–156.30 ± 0.48 a85 ± 64 a271 ± 80 a2.11 ± 1.12 a364 ± 63 a231 ± 151 a56 ± 26 a22.7 ± 3.6 a235 ± 98 a11.0 ± 1.4 a3.20 ± 2.60 a
15–305.82 ± 0.36 b55 ± 31 b183 ± 52 b1.57 ± 0.43 a330 ± 86 a152 ± 79 a36 ± 16 b19.6 ± 5.2 ab134 ± 47 b9.8 ± 1.4 a1.61 ± 0.52 b
SN0–156.13 ± 0.24 a83 ± 26 a242 ± 73 a1.66 ± 0.55 a311 ± 69 a208 ± 65 a48 ± 11 a18.6 ± 4.3 a201 ± 27 a10.3 ± 1.0 a2.48 ± 0.87 a
15–305.62 ± 0.57 b77 ± 36 a179 ± 66 b1.35 ± 0.22 a324 ± 104 a140 ± 53 b34 ± 11 ab20.4 ± 6.2 ab144 ± 33 b12.3 ± 3.2 a1.54 ± 0.35 ab
Year 2
SG0–155.67 ± 0.41 a75 ± 26 a304 ± 84 a1.47 ± 0.66 a154 ± 26 a225 ± 47 a48 ± 18 a13.9 ± 7.4 a154 ± 62 a5.6 ± 2.0 a2.47 ± 1.70 a
15–305.44 ± 0.15 a80 ± 48 a350 ± 84 a0.93 ± 0.12 a147 ± 48 a198 ± 5.5 ab54 ± 21 a13.0 ± 1.6 a93 ± 72 ab4.8 ± 0.6 a1.72 ± 0.68 a
BG0–155.59 ± 0.53 a75 ± 40 a367 ± 84 a1.34 ± 0.49 a155 ± 39 a273 ± 107 a65 ± 25 a13.5 ± 4.4 a176 ± 90 a5.2 ± 1.3 a3.25 ± 3.00 a
15–305.28 ± 0.35 a45 ± 17 a277 ± 59 a0.98 ± 0.33 a149 ± 45 a209 ± 18 ab39 ± 8.0 a24.6 ± 27.0 a144 ± 73 a5.8 ± 1.2 a1.44 ± 0.60 b
SN0–155.75 ± 0.41 a67 ± 9 a309 ± 75 a1.44 ± 0.41 a126 ± 13 a219 ± 25 a51 ± 12 a12.1 ± 1.3 a150 ± 27 a5.9 ± 1.6 a2.79 ± 0.70 a
15–305.39 ± 0.74 a57 ± 13 a281 ± 107 a1.10 ± 0.41 a133 ± 35 a202 ± 12 ab41 ± 14 a15.1 ± 9.1 a94 ± 39 ab6.7 ± 3.4 a1.16 ± 0.27 a
Means within columns with the same letters are not significant at p < 0.05 levels with ± standard deviation.
Publisher’s Note: MDPI stays neutral with regard to jurisdictional claims in published maps and institutional affiliations.

