Article

Effect of Clay Mineralogy and Soil Organic Carbon in Aggregates under Straw Incorporation

1
Key Laboratory of Arable Land Conservation (Middle and Lower Reaches of Yangtze River), Ministry of Agriculture, Huazhong Agricultural University, Wuhan 430070, China
2
Breeding Base for State Key Laboratory of Land Degradation and Ecological Restoration in Northwest China, Ningxia University, Yinchuan 750021, China
3
State Key Laboratory of High-Efficiency Coal Utilization and Green Chemical Engineering, College of Chemistry and Chemical Engineering, Ningxia University, Yinchuan 750021, China
4
Department of Agronomy, The University of Haripur, Haripur 22620, Pakistan
*
Author to whom correspondence should be addressed.
Agronomy 2022, 12(2), 534; https://doi.org/10.3390/agronomy12020534
Submission received: 18 January 2022 / Revised: 13 February 2022 / Accepted: 14 February 2022 / Published: 21 February 2022

Abstract

:
The interaction between soil organic carbon (SOC) and clay minerals is a critical mechanism for retaining SOC and protecting soil fertility and long-term agricultural sustainability. The SOC composition and minerals speciation in clay fractions (<2 μm) within soil aggregates under straw removed (T) and straw incorporation (TS) conditions were analyzed by X-ray diffraction, Fourier transform infrared spectra and X-ray photoelectron spectroscopy. The TS treatment promoted enrichment of clay in aggregates. The TS increased the contents of SOC (27.0–86.6%), poorly crystalline Fe oxide (Feo), and activity of Fe oxides (Feo/Fed); whereas, it reduced the concentrations of free Fe oxide (Fed) in the clay fractions within aggregates. Straw incorporation promoted the accumulation of aromatic-C and carboxylic-C in the clay fraction within aggregates. The relative amount of hydroxy-interlayered vermiculite, aliphatic-C, and alcohol-C in the clay fractions within the macroaggregates was higher than that microaggregates, whereas the relative amounts of illite, kaolinite, Fe(III), and aromatic-C had a reverse tendency. The hydroxy-interlayered vermiculite in clay fractions showed positive correlation with the amounts of C–C(H) (r = 0.93) and C–O (r = 0.96 *, p < 0.05). The concentration of Feo and Feo/Fed ratio was positively correlated with the amounts of C=C and C(O)O content in clay within aggregates. Long-term straw incorporation induced transformation of clay minerals and Fe oxide, which was selectively stabilized straw-derived organic compounds in clay fractions within soil aggregates.

1. Introduction

Stabilization of soil organic carbon (SOC) plays a key role in agricultural soil fertility and mitigation of global warming [1,2,3]. Soil aggregates physically protect SOC against mineralization, which decreases the availability of organic compounds for microorganisms, extracellular enzymes, and oxidation processes [4,5]. However, the smaller sized soil particles, such as clay fractions (<2 μm), can retain higher amounts of organic carbon as compared with larger particles [6,7]. Stabilization of SOC results from the formation of organo–mineral associations, especially the adsorption of SOC by clay mineral aggregates and chemical reactions between SOC and surfaces of clay particles [6,7,8]. The SOC is bonded to the mineral surface by hydrogen (H)-bonding, hydrophobic interactions, van der Waals attraction, ligand exchange, and polyvalent cation bridging [9,10]. The stabilization and decomposition rates of SOC are influenced by the Fe (oxyhydr)oxides as well as the type of phyllosilicates in soil [11]. More than 70% of the SOC inventory exists in close association with minerals, which can protect organic carbon from microbial degradation in agricultural soils [12,13,14,15,16].
The clay-sized fraction usually contains a mixture of phyllosilicate minerals in natural soils. The phyllosilicate minerals have been recognized to have substantial effects on stabilization of SOC due to the active surface properties (specific surface area, charge density) [17]. The specific surface area (SSA) and cation exchange capacity (CEC) of phyllosilicate minerals generally decrease in the order of smectite or vermiculite (2:1 type) > illite (2:1 type) > kaolinite (1:1 type) [18,19]. Therefore, the phyllosilicates with contrasting properties should have different abilities in stabilizing SOC [18,20]. The relative importance of different clay minerals for stabilizing SOC remains an open question. The current knowledge is based on limited and conflicting data, but it is generally accepted that the SOC-stabilizing capacity of clay minerals decreases in the following order: allophane > smectite > illite > kaolinite [21]. The previous reports also indicated that dissolved organic matter (DOM) mineralization was higher in 1:1 phyllosilicate amended sand compared with 2:1 phyllosilicate amended sand. DOM mineralization was similar for illite and smectite-dominated soils [22]. Stability of SOC in soil was negatively correlated with crystallite size of illite (r = −0.46, p < 0.01), suggesting that lower crystallite size of illite leads to greater stability of clay-humus C [23]. However, to our knowledge, no systematic investigation of stabilization of SOC through the interaction of organic carbon with soil minerals in different aggregate-sized classes, recovered from the same soil, has been carried out so far.
In addition to phyllosilicate minerals, the iron (Fe) (oxyhydr)oxides also play an important role in the stabilization of SOC in natural soils. It is well documented that Fe (oxyhydr)oxides contents correlate significantly with SOC contents and stabilization [15,24,25,26]. The sorption coefficients of DOC on crystalline Fe (oxyhydr)oxide, such as hematite and goethite, were 0.85 and 2.6–4.0 mol C kg−1, respectively [27,28]. In addition to the simple sorption, some research has highlighted the importance of organo–mineral complexes for SOC sequestration [29]. Long-term application of organic amendments significantly increased the poorly crystalline Fe minerals, such as ferrihydrite, may preferentially retain aromatic organic compounds of SOC in soil aggregates and water-dispersible colloids [12,13,30]. Another study showed that aliphatic soil organic matter was stabilized by association with Fe (oxyhydr)oxide [31]. Mechanisms of SOC stabilization by Fe (oxyhydr)oxide have been extensively investigated but remain controversial. Therefore, exploring the mechanisms underlying the formation of organo–Fe complexes from Fe (oxyhydr)oxides and organic compounds is needed.
Long-term straw incorporation might differentially affect the stability of organic carbon present in a soil as a whole [32,33,34,35], and especially that present in the organo–mineral fraction [35]. Our previous results showed that long-term straw incorporation improved the stability of aggregates by influence SOC and Fe (oxyhydr)oxides in rice–rape cropping systems [36,37]. However, the molecular structure of SOC, species of clay minerals, and interactions between these components have not been examined extensively in clay fractions within aggregates under long-term straw incorporation. Straw incorporation is hypothesized to influence clay mineral composition, which may selectively stabilize straw-derived organic compounds in clay fractions within soil aggregates. The objectives of the present study were to determine the following: (1) the mineral composition and speciation of Fe (oxyhydr)oxides in clay fractions within aggregates; (2) the contents and composition of SOC in clay fractions within aggregates; (3) the interaction between mineral composition and the SOC in clay fractions within macroaggregates (>250 μm) and microaggregates (53–250 μm) influenced by long-term straw incorporation in a paddy soil.

2. Materials and Methods

2.1. Experimental Design and Sampling

The long-term field experiment was started in 2007 in Dajing (latitude 29°59′21″ N, longitude 115°36′53″ E), Wuxue, Hubei Province, China. The soil derived from quaternary sediment and is classified as an Alfisol, based on the USDA Soil Taxonomy (Soil Survey Staff, 2010), with a loam texture (40.0% sand, 42.7% silt, and 17.3% clay). The mean annual precipitation, temperature, and evaporation are 1489 mm (mainly from July to September), 16.9 °C, and 1361 mm, respectively. The frost-free period is about 262 days, and the sunshine radiation averages 12.2 MJ m−2 d−1, with an average annual sunshine duration of 1913 h. The predominant clay minerals are kaolinite, illite, and 1.4 nm hydroxy interlayer hydroxyl minerals. It has long been cultivated with winter rape (Brassica napus L.) and summer rice (Oryza sativa L.), which represents one of the main cropping systems in China. The main soil properties of the upper surface horizon (0–20 cm) of the experimental site were as follows: soil pH (water: soil = 2.5:1), 5.23; organic carbon concentration, 19.8 g C kg−1; total nitrogen (N) concentration, 1.92 g N kg−1; total potassium (K) concentration, 6.68 g K kg−1; alkaline hydrolysable N concentration, 129.2 mg N kg−1; Olsen phosphorus (P) concentration, 21.7 mg P kg−1; ammonium acetate-extractable K concentration, 86.1 mg K kg−1. More detailed information on the experiment site can be found in a previous publication [30].
The long-term tillage experiment consisted of four treatments with three replicates each in a randomized complete block design. The plot size was 7 × 6.5 m. We choose two of them: (1) conventional tillage with straw removing (T); (2) conventional tillage with straw incorporation (TS). The conventional tillage treatments consisted of moldboard plowing (20–22 cm) in May and October followed by secondary seedbed preparation by disking (7.5–10 cm) using a disk harrow. After harvesting, residues were chopped into 2–3 cm pieces for rape and 6–7 cm pieces for rice. For the treatments without straw removing, all crop residues were removed from the experiments. In the straw incorporation fields, after the rice and rape harvests, 5250 kg ha−1 rice straw and 4500 kg ha−1 rape straw were applied. All other field management practices were the same for all plots during the experiment. The application of N fertilizer, phosphate fertilizer, and potash in rice and rape was 150 and 210 kg ha−2 as urea (N 46%), 45 and 75 kg ha−2 as superphosphate (P2O5 12%), and 150 and 150 kg ha−2 as potassium chloride (K2O 60%), respectively. Detailed farming methods and the application rates of straw residues and fertilizer can be found in a previous study [30].
Soil samples were collected immediately after the later rice harvest (October 2016). All soil samples were randomly, manually collected from the 0–20 cm soil layer at 10 different locations in 3 independent areas within each experimental plot by using a soil auger (5.0 cm diameter). All samples from each plot were carefully mixed to form a composite, placed in a plastic box, and immediately transported to the laboratory. Moist soils were gently broken apart along the natural break points and passed through a 10 mm sieve. After removing the visible organic residue and stones, the soil samples were air dried at room temperature. One part was used for soil chemical analysis, while the other part was used for the determination of aggregate size distribution.

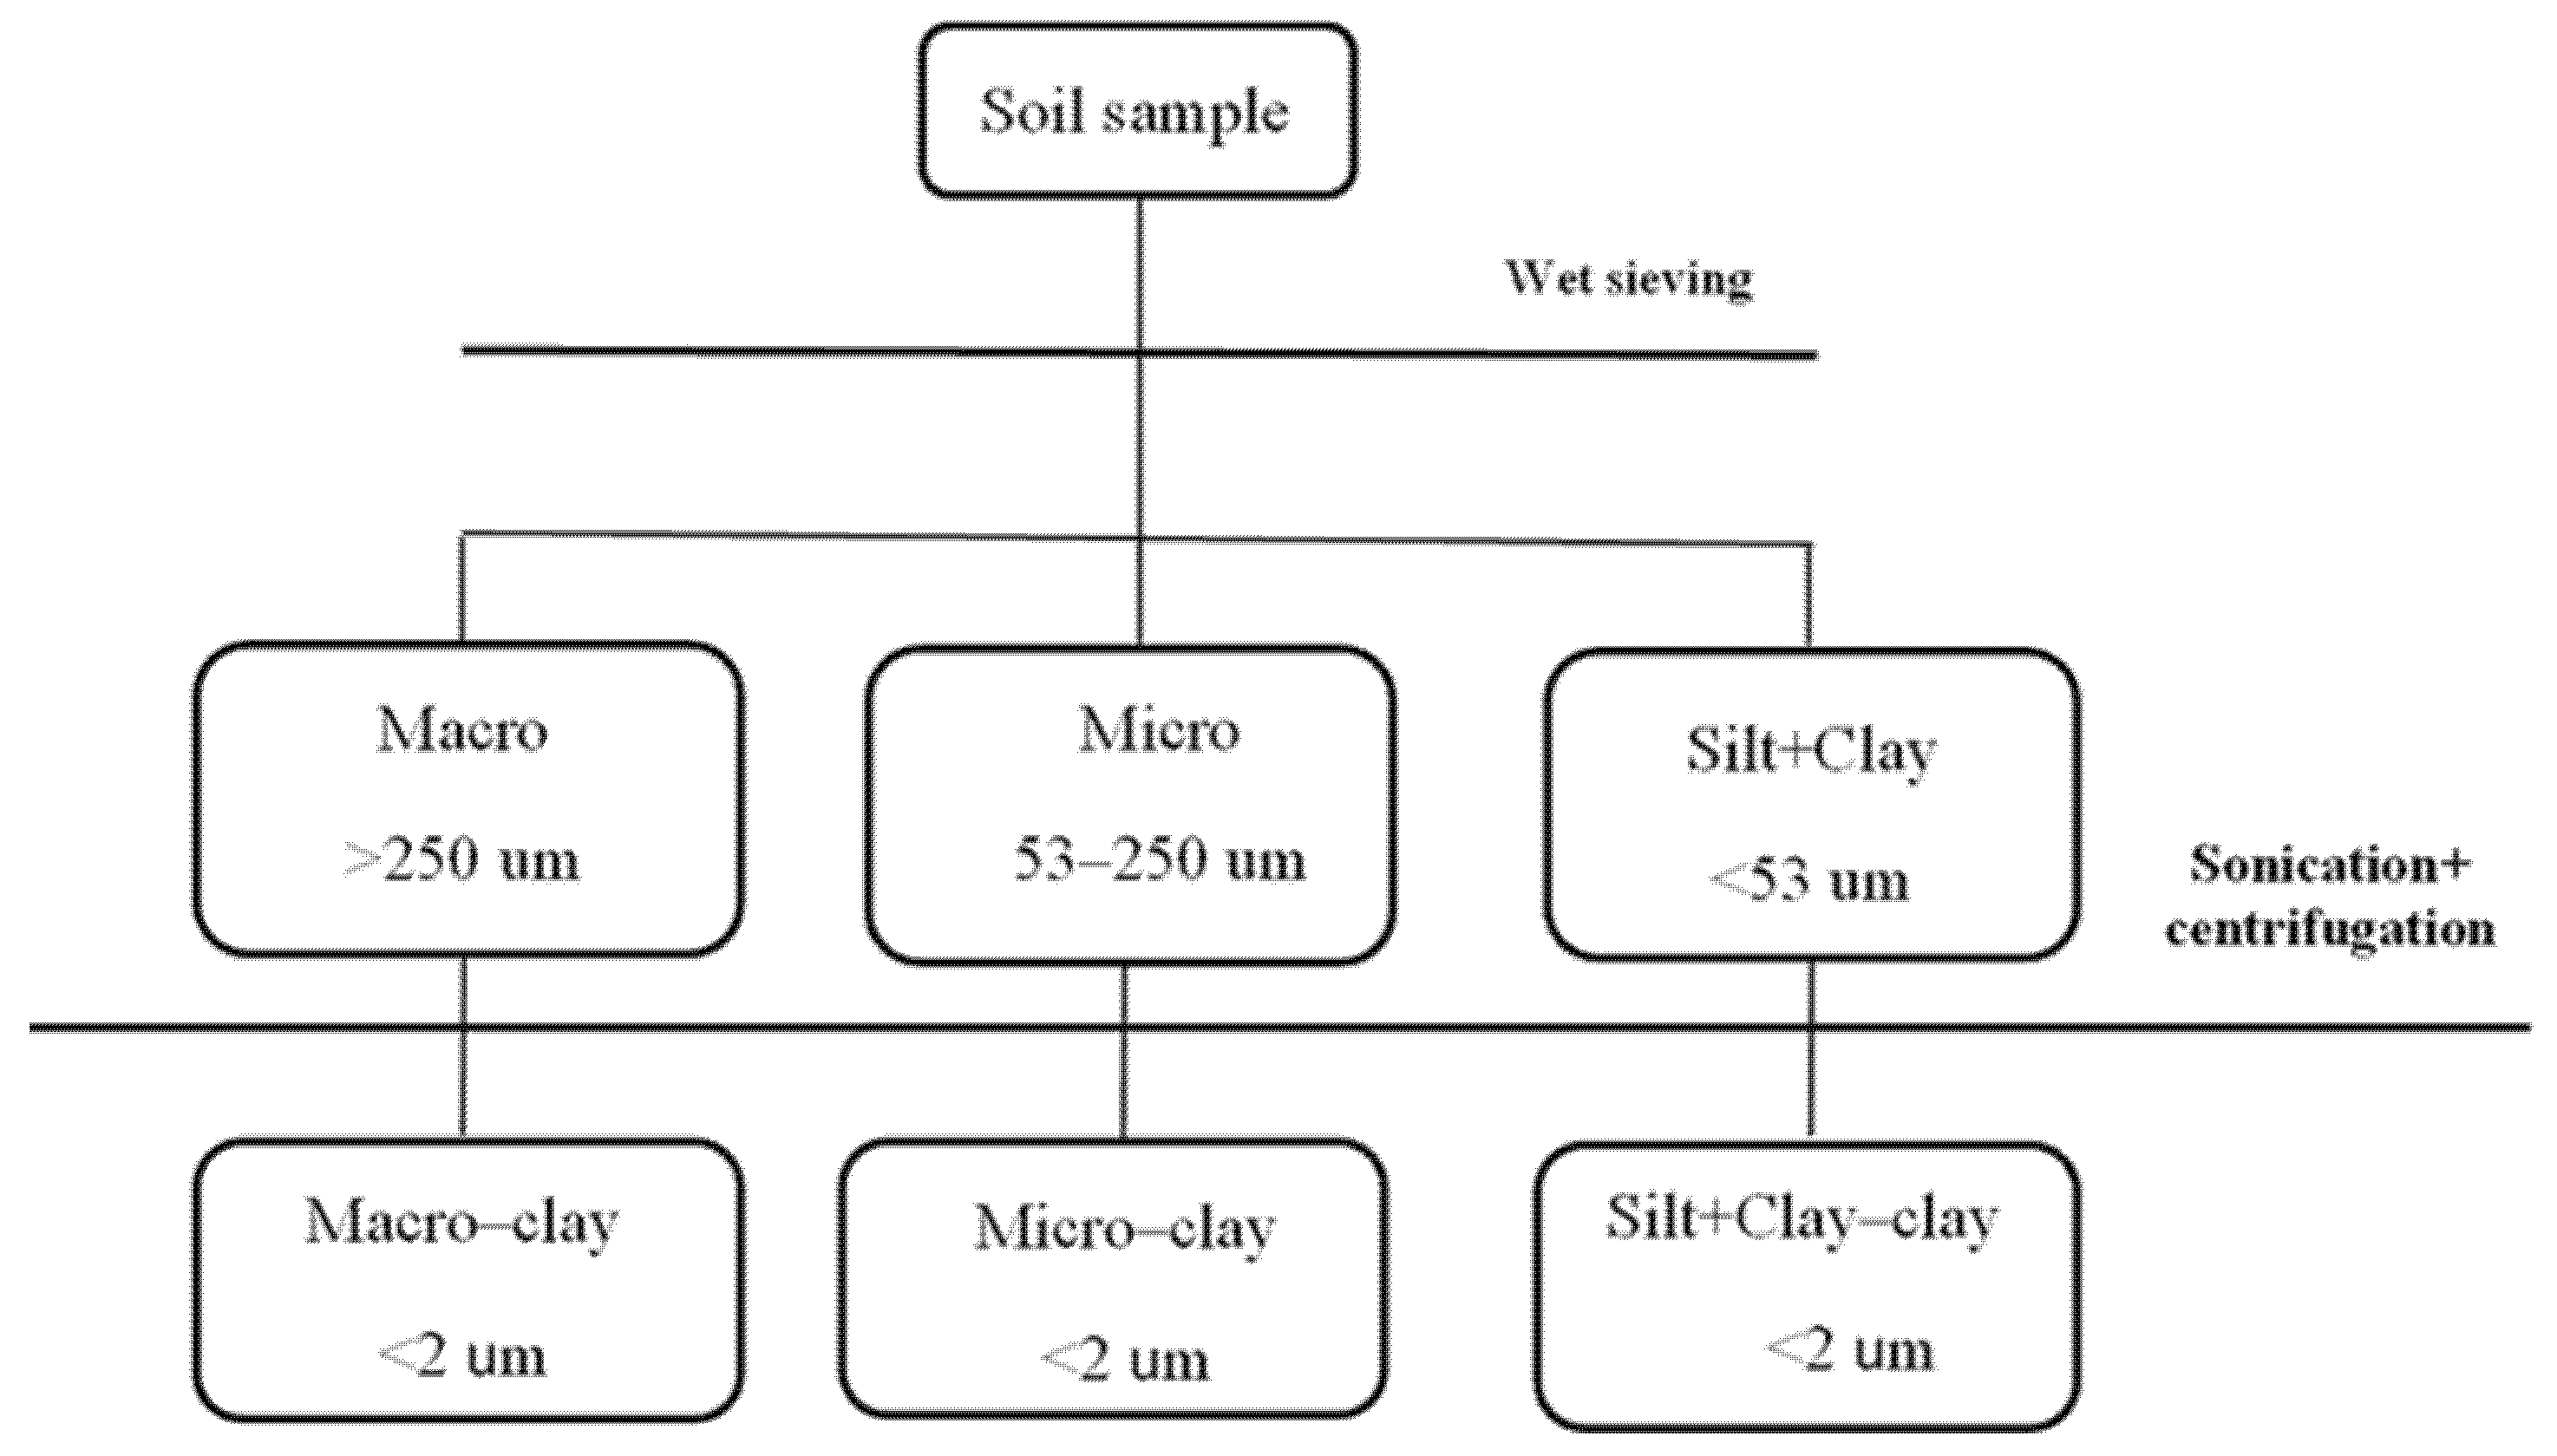
2.2. Extraction of Clay Fractions within Aggregate-Sized Classes

There were 3 classes of aggregates obtained: >250 μm (macroaggregates), 53–250 μm (microaggregates), and <53 μm (silt+clay) (Figure 1). Water-stable soil aggregates were separated according to the wet-sieving method described by Elliott (1986) [38]. For detailed experimental procedures, please refer to the previously published article [30].
The clay fractions (<2 μm) within macroaggregate, microaggregate, and silt+clay size fractions were recovered by sonication–centrifugation methods (Figure 1) [39]. Briefly, a 5 g soil aggregates aliquot were combined with 50 mL of deionized water in 100 mL centrifuge tubes and inverted 10 times by hand. The suspension of aggregates was then completely dispersed by sonication (320 J mL−1) using an ultrasonic cell disruptor (VCX 800, Sonics, Missouri, Branson, US). For macro- and microaggregates, the sonicated suspensions were passed through a 53 μm sieve to recover sand particles (>53 μm). Finally, clay- and silt-sized fractions within macroaggregates and microaggregates, and the silt-sized fraction, were separated by centrifugation. The sand, silt, and clay fractions of each aggregate-sized class were oven-dried at 40 °C and weighed. Three replicates of each aggregate were used to separate the clay fractions.

2.3. The Organic Carbon and Iron Oxide Analysis

The organic carbon concentration in the clay fractions was determined with the K2Cr2O7–FeSO4 oxidation method [40]. The free Fe (oxyhydr)oxide (Fed) and poorly crystalline (oxyhydr)oxide (Feo) in the clay fractions were extracted by dithionite–citrate–bicarbonate (DCB) and oxalate, respectively [41,42]. The Fe concentrations in the extracts were determined using atomic absorption spectroscopy (AA240FS; Agilent, Santa Clara, CA, USA).

2.4. X-ray Diffraction Analyses

To identify phyllosilicate minerals in the clay fractions of natural soils, X-ray diffraction (XRD) was performed after removal of free Al- and Fe-oxides from the fractions by the dithionite–citrate–bicarbonate extraction method [43]. The mineralogical compositions of clay fraction (<2 μm) within macroaggregates and microaggregates were determined by random powder and oriented samples. Prior to XRD analysis, the following treatments were performed on tested samples: Mg-glycol saturation (Mg-gly) and K saturation (K). The Mg and Mg-gly samples were examined at 25 °C. The K-saturated samples were examined at 25 °C, then heated for 2 h at 110 °C, 350 °C, and 550 °C [44]. The random powders on glass slides and the oriented samples were measured by an X-ray diffractometer (D8 Advance, Bruker, Rheinstetten, Germany) with Cu Kα radiation (λ = 1.5418 Å) generated at 40 kV and 40 mA. Diffraction data were recorded in scanning mode and converted to step patterns (with a step of 2° 2θ between 4 and 40° 2θ, using a 60 s counting time per step) [45]. The mineralogical compositions of the clay fractions in the XRD patterns were analyzed using Jade software (Materials Data, Inc., Livermore, CA, USA).
Semi-quantitative estimations of the amounts of clay minerals were based on the XRD results obtained using oriented specimens. The semi-quantitative method consisted of using the Mg-gly saturated diffractograms and focusing on the areas of individual d (001) reflections of clay minerals, in relation to the sum of reflection areas in the diffractograms [46].

2.5. FTIR Analyses

Fourier transform infrared spectra for clay fractions within macroaggregates and microaggregates were obtained for random powder specimens, dispersed in KBr pellets, using a VERTEX70 FTIR spectrometer (Bruker, Hamburg, Germany). The pellets (1 mg sample 100 mg−1 KBr) were prepared from bulk samples (<0.149 mm) that were previously ground in an agate mortar, dried by heating at 105 °C for 24 h, and mixed with KBr powder. Spectra were recorded as an average of 32 scans, with a wavelength resolution of 4 cm−1 in the range of 400–4000 cm−1. A semiquantitative analysis of organic carbon functional groups was realized according to Zhu et al. (2016) and Szymański (2017), as follows [47,48]. The areas of the absorption bands in the FTIR spectra were integrated using the OMNIC 8.0 spectrometer software and were defined as intensities.

2.6. X-ray Photoelectron Spectrometer (XPS)

The major advantage of this spectroscopic method is that XPS provides a quantitative analysis of the chemical composition of the outermost interface layer (0.5–10 nm) of solids [49]. We found that the variation of organic C content among aggregates was consistent for three replicate clay fractions. In contrast, there was no significant difference among three replicate clay fractions within macroaggregates and microaggregates. Therefore, we selected one of the three replicates for elements, C 1s, and Fe 2p analyses.
Pre-dried samples were pressure-mounted onto a conducting indium foil and inspected visually using the instrument’s microscope to identify suitable areas without large mineral grains. Then, samples were excited with non-monochromated Al Kα radiation (Eexc = 1486.6 eV) at an incident angle of 45° and an electron beam spot size of 800 µm (~500 µm2). XPS analysis was performed with an Axis Ultra DLD device (Kratos Analytical, Manchester, UK) using monochromatic Al Kα radiation (1486.6 eV, emission current 20 mA, high voltage 12 kV) in the binding energy (BE) range of 1200–0 eV. The bulk element composition of clay fractions was revealed by scanning from 0 to 1100 eV using a pass energy of 93.90 eV, channel width of 0.4 eV/step, and measurement time of 20 ms/step (exposition time = 10 min); in high-resolution mode, clay fractions were scanned at the C 1s and Fe 2p edge using a pass energy of 11.75 eV, channel width of 0.1 eV/step, and measurement time of 100 ms/step (exposition time = 30 min). Substantial X-ray-induced alteration of clay fractions that could cause false structural C assignments is expected only for exposure times >30 min [50]. The vacuum during measurements was set at ~3 × 10⁻⁹ mbar. The rate of contamination by adventitious C was estimated to be 0.1 atom%/h. Sample charge during analysis led to peak shifts of 63 eV, which were corrected based on the maximum principal C 1s sub-peak centered at 285 eV. Binding energies were determined with an accuracy of ±0.2 eV and calibrated by C 1s peak at 284.8 eV. The background from each spectrum was subtracted using a Shirley-type background. The high-resolution XPS spectra were analyzed and deconvoluted using XPSPEAK software (version 4.1, Hong Kong, China) with a 30% Gaussian–Lorentzian value to optimize the spectra [51,52]. The curve-fitting procedures implemented for high-resolution spectra of Fe 2p and C 1s used 60:40 [53] and 80:20 Gaussian–Lorentzian line shapes, respectively. Full width at half maximum values of all C components were set as free parameters, which were optimized within a constrained range (1.3–2.0 eV) in the peak fitting.
The binding energies of spectral shifts in the core level C 1s were assigned to different chemical components of C as follows: (1) aromatic-C (C=C: 284.6 eV), (2) aliphatic-C (C–C(H): 285 eV), (3) ether or alcohol-C (C–O; 286. 2 eV), (4) ketonic or aldehyde-C (C=O; 287.9 eV), and (5) carboxylic-C (C(O)O; 289 eV) [13,54].

2.7. Statistical Analysis

Statistical analysis was performed using SPSS Statistics for Windows, version 18.0 (SPSS Inc., Chicago, IL, USA). One-way analysis of variance was used to test the variability among different aggregate size fractions; variability between different treatments was determined by the t-test. Differences were considered significant when p < 0.05. Pearson’s correlation coefficients were obtained to examine the relationship between SOC and Feo/Fed in clay fractions. Figures and tables were made with Origin Pro 8.0 (OriginLab, Northampton, MA, USA) and Microsoft Excel 2010 (Microsoft, Redmond, WA, USA), respectively.

3. Results

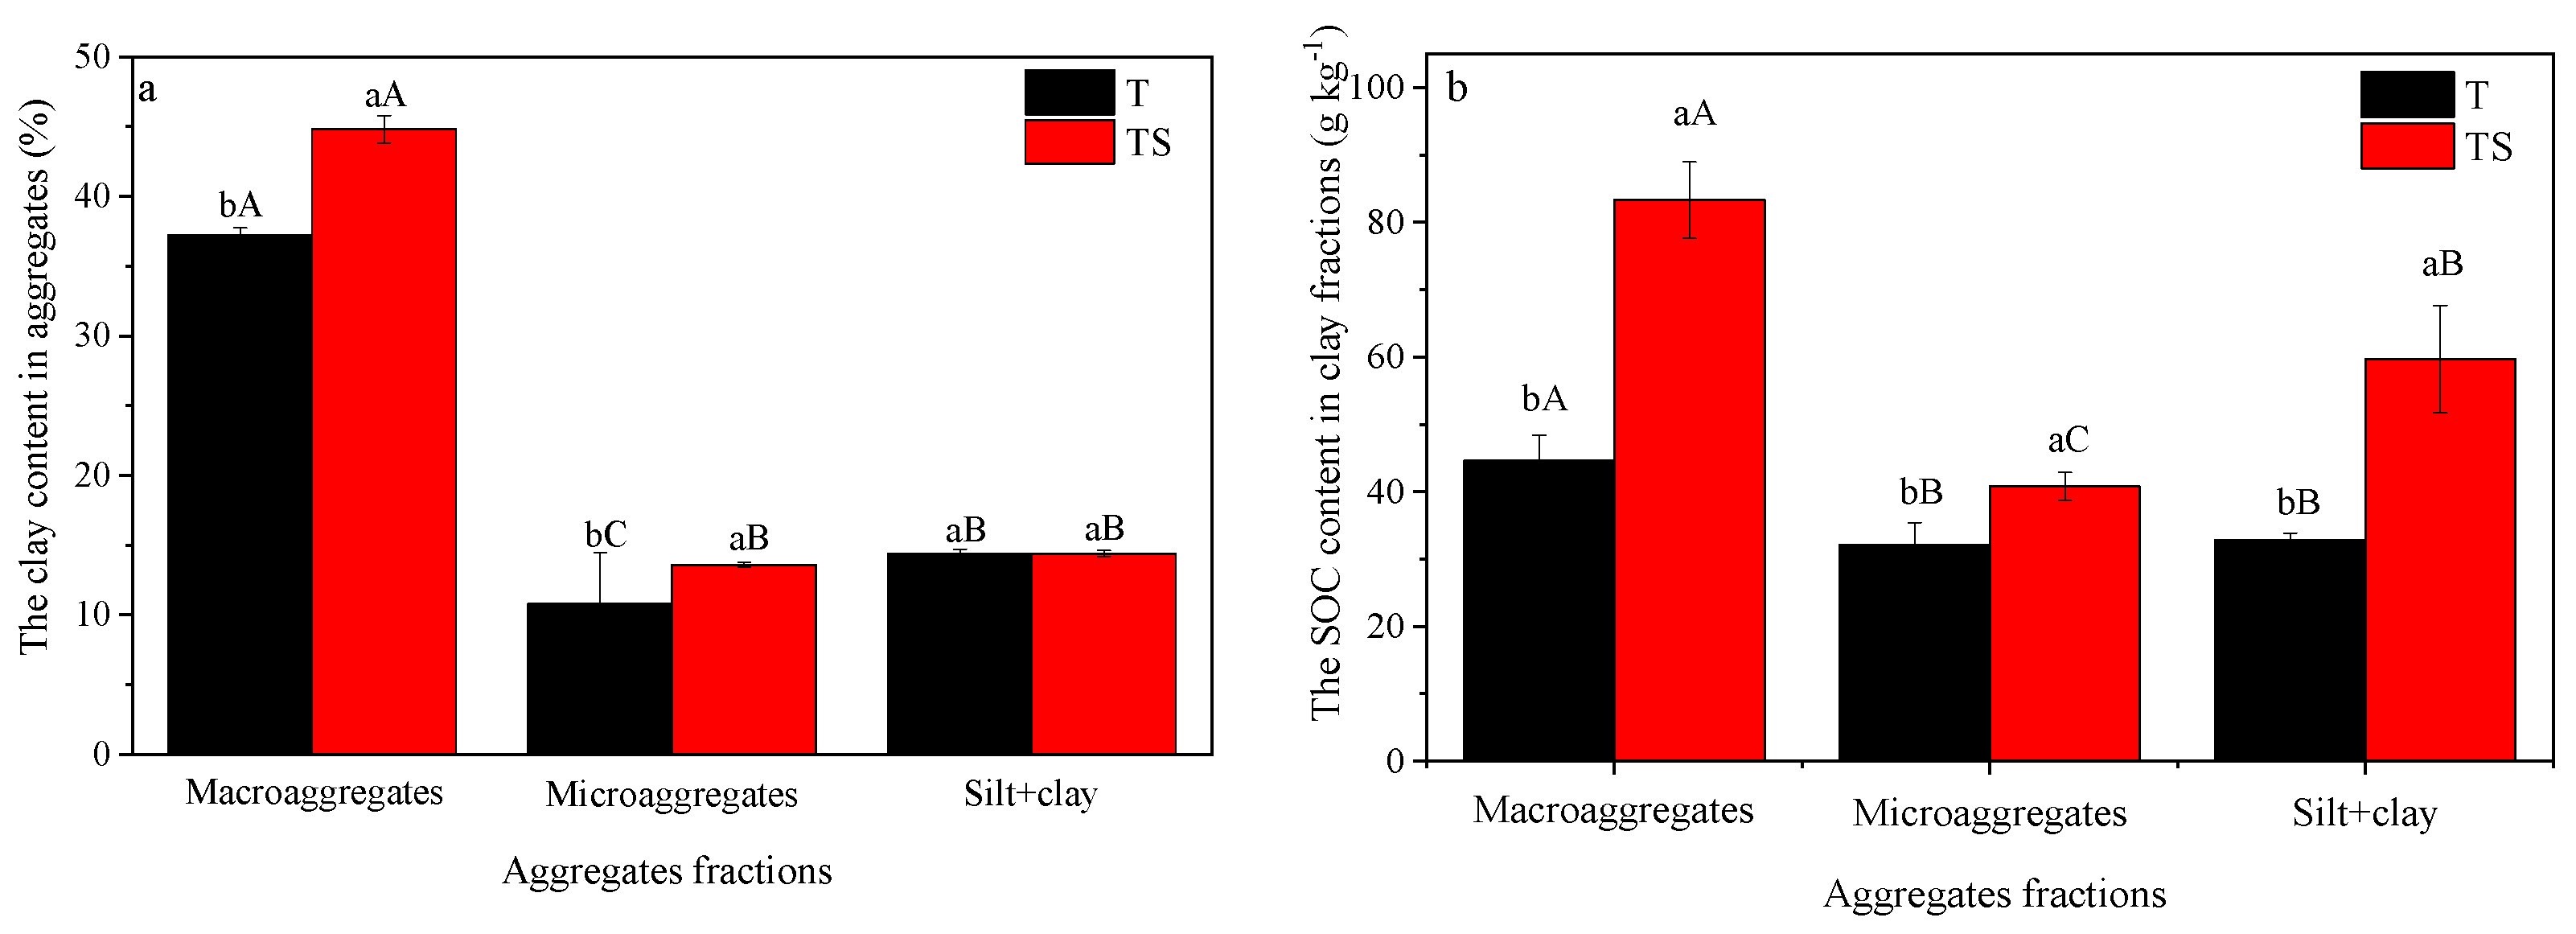
3.1. The Clay Contents in the Aggregates

The clay contents in the aggregates under the T and TS treatments were 10.8–37.2% and 13.65–44.8%, respectively (Figure 2a). The highest clay contents occurred in macroaggregates, while the lowest clay contents were in microaggregates. TS treatment significantly increased clay contents in macroaggregates and microaggregates by 19.4% and 26.9%, respectively, compared with the T treatment (both p < 0.05). However, no significant difference between T and TS treatments was observed in the silt+clay fraction. Consequently, long-term straw incorporation was concluded to promote enrichment of clay in macroaggregates and microaggregates.

3.2. The Contents of Organic Carbon in the Clay Fractions

In both the T and TS treatments, SOC contents were highest in the clay fraction within macroaggregates (44.6 and 83.3 g kg−1) and lowest in the clay fraction within microaggregates (32.1 and 40.8 g kg−1), respectively (Figure 2b). Compared with the T treatment, the SOC in clay within the macroaggregates, microaggregates, and silt+clay fraction in the TS treatment was significantly higher by 86.6%, 27.0%, and 82.0%, respectively (all p < 0.05). The findings demonstrated that straw application enhanced the bonding of clay to organic C, especially to macroaggregates.

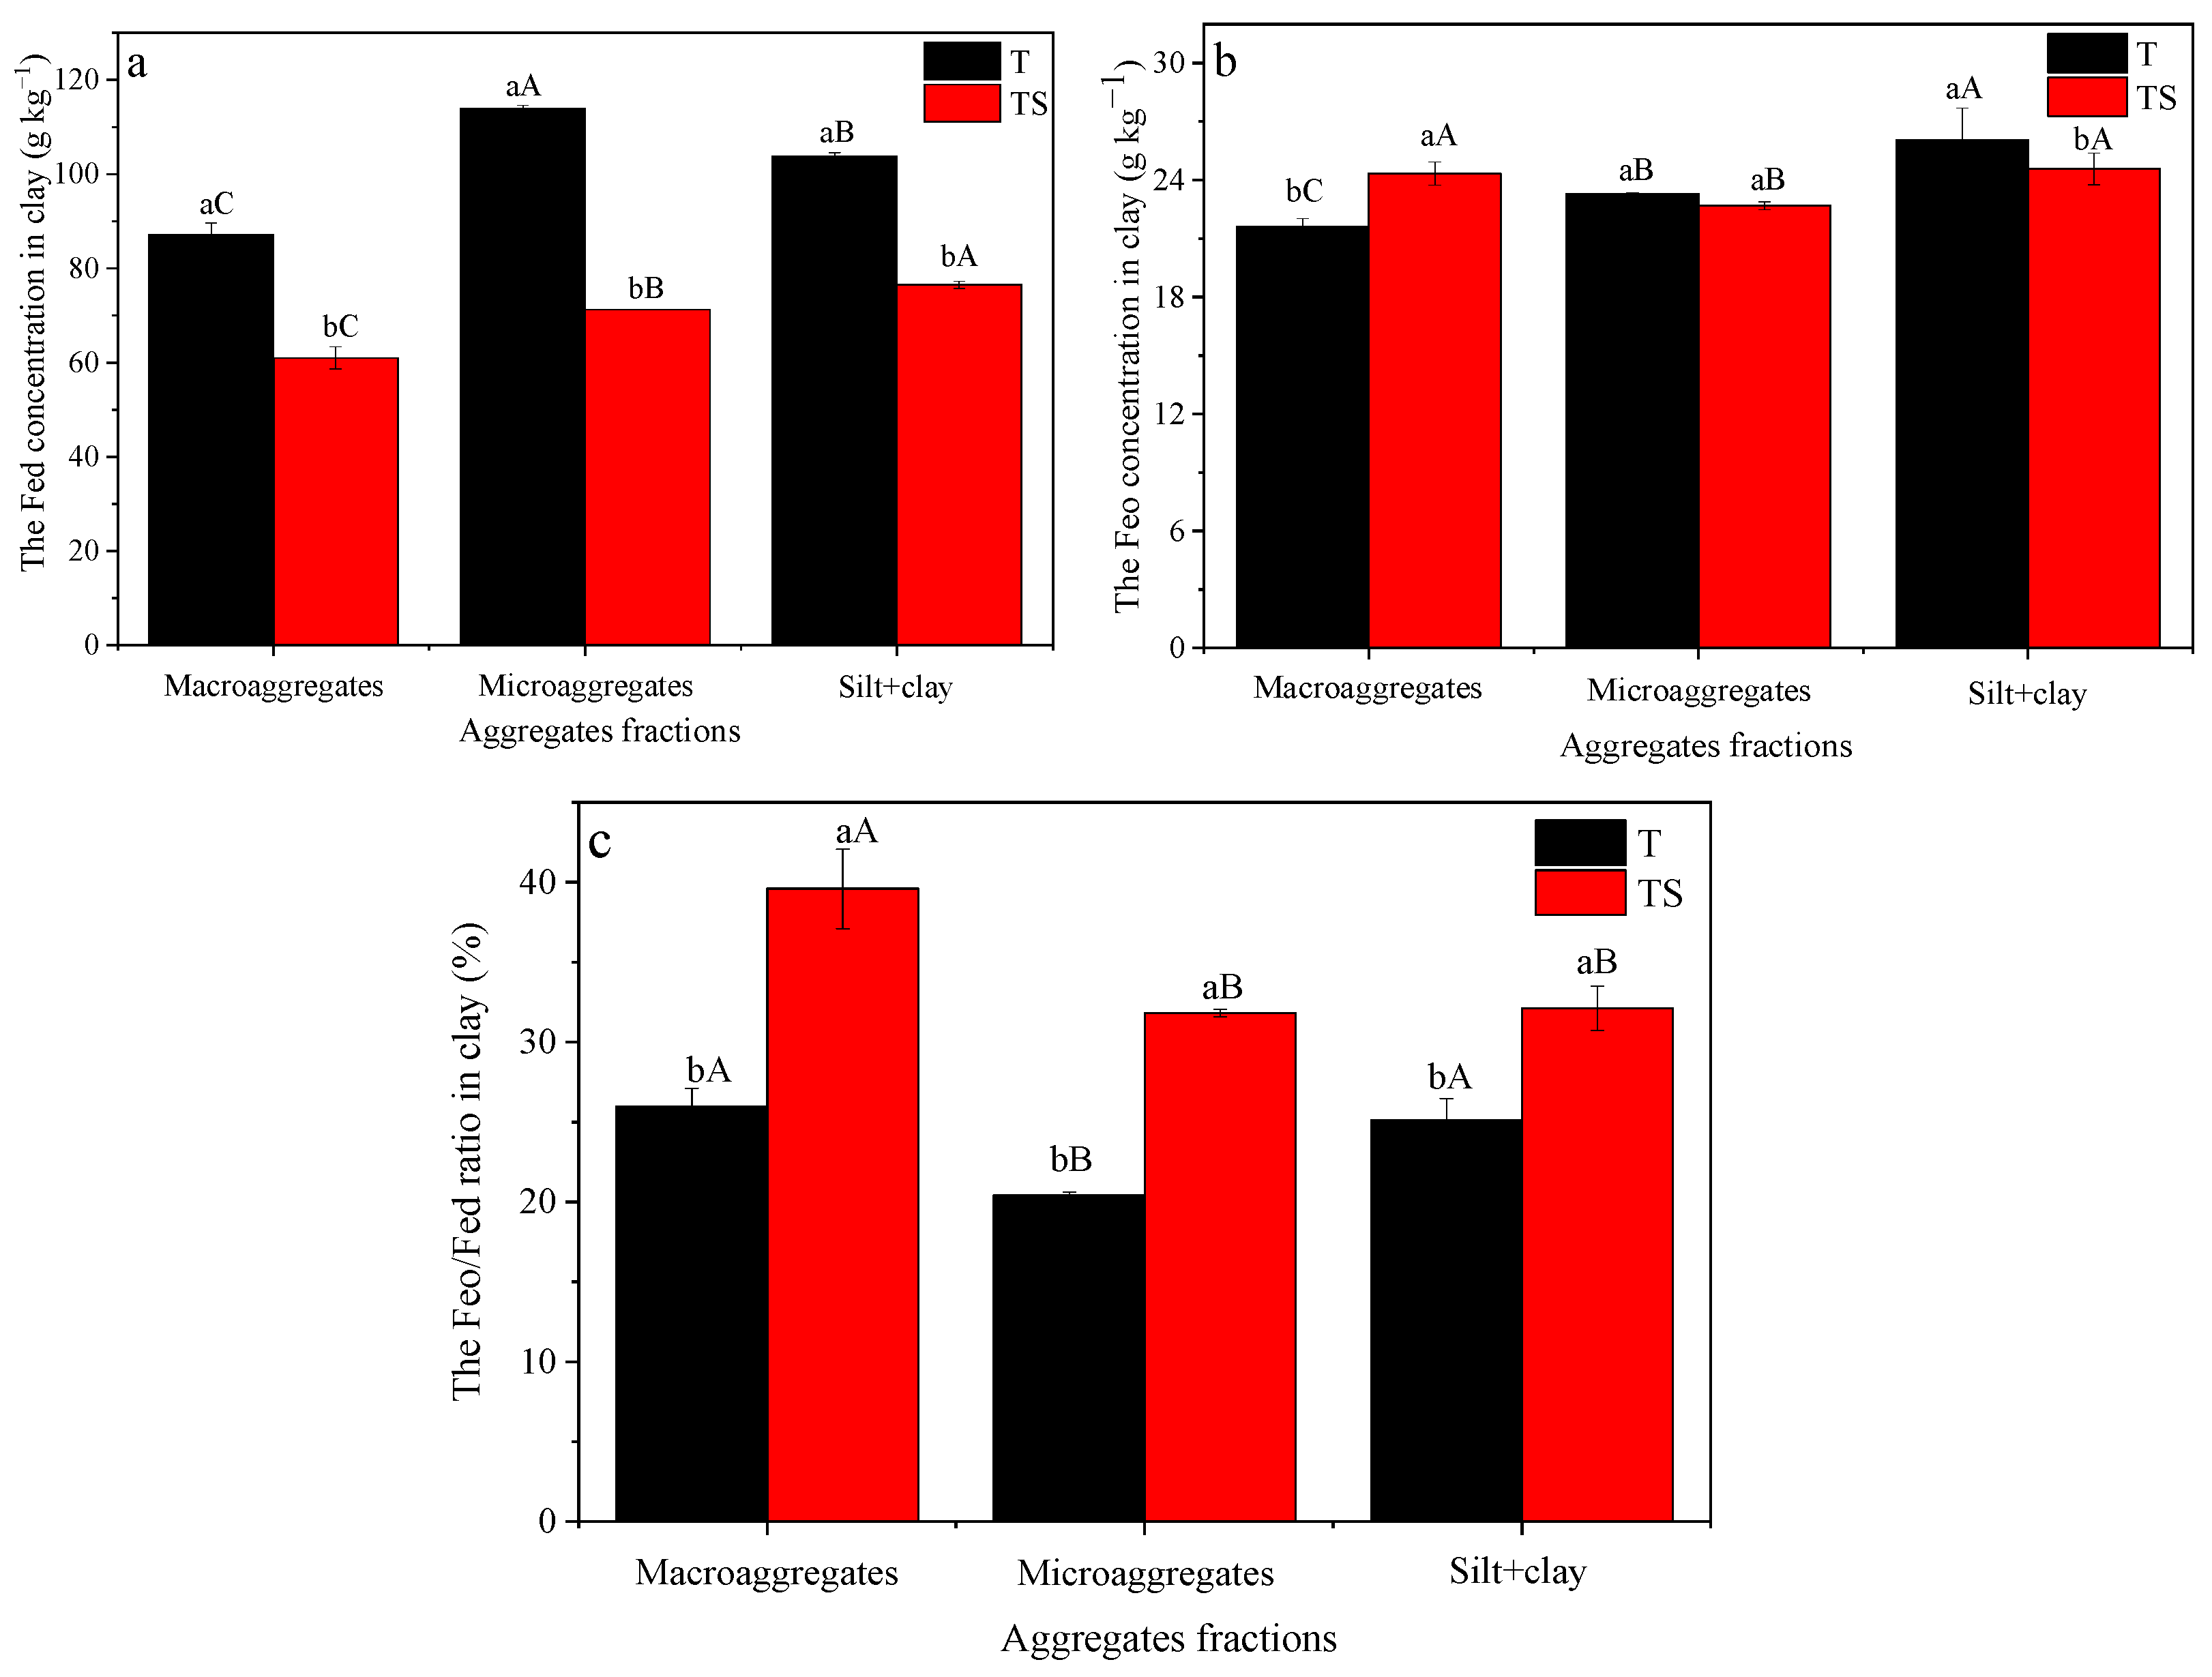
3.3. Fed, Feo, and Feo/Fed Ratio in Clay Fractions within Aggregate-Sized Classes

Fed content was consistently higher in the clay fraction of microaggregates and the silt+clay fraction than in macroaggregates (Figure 3a). Overall, the average Fed content of clay fraction within the aggregate-sized classes in T ranged from 87.15 to 113.90 g kg−1. For TS, these values ranged from 60.97 to 76.49 g kg−1. The lowest Fed content of the clay fraction was observed in the macroaggregates, with values of 87.15 and 60.97 g kg−1 under the T and TS treatments, respectively. The highest Fed content of clay was observed in the microaggregates and the silt+clay under the T and TS treatments, respectively. The Fed content was lower under the TS treatment than under the T treatment; it decreased by 30.04%, 37.45%, and 26.32% in macroaggregates, microaggregates, and silt+clay, respectively.
Under the T treatment, the Feo content of clay fraction was highest in the silt+clay fractions (26.07 g kg−1) and lowest in the macroaggregates (21.63 g kg−1) (Figure 3b). However, under this treatment, the Feo contents of clay in the macroaggregates and silt+clay were higher than the Feo content of clay in the microaggregates. Compared with the T treatment, the TS treatment significantly increased the Feo content of clay in macroaggregates by 12.48% (p < 0.05). Additionally, the TS treatment significantly decreased the Feo content of clay in the silt+clay fraction.
Under the T and TS treatments, the highest Feo/Fed ratio of clay was found in the macroaggregates and the lowest was found in the microaggregates (Figure 3c). Straw return significantly increased the Feo/Fed ratio of clay in all fractions (all p < 0.05). Meanwhile, the Feo/Fed ratio was found to be significantly positively correlated with SOC concentration (R2 = 0.76, p < 0.05) in the clay fractions within aggregates (Figure 4), which suggests that application of straw could efficiently activate the function of Fe oxides, thus preserving SOC.

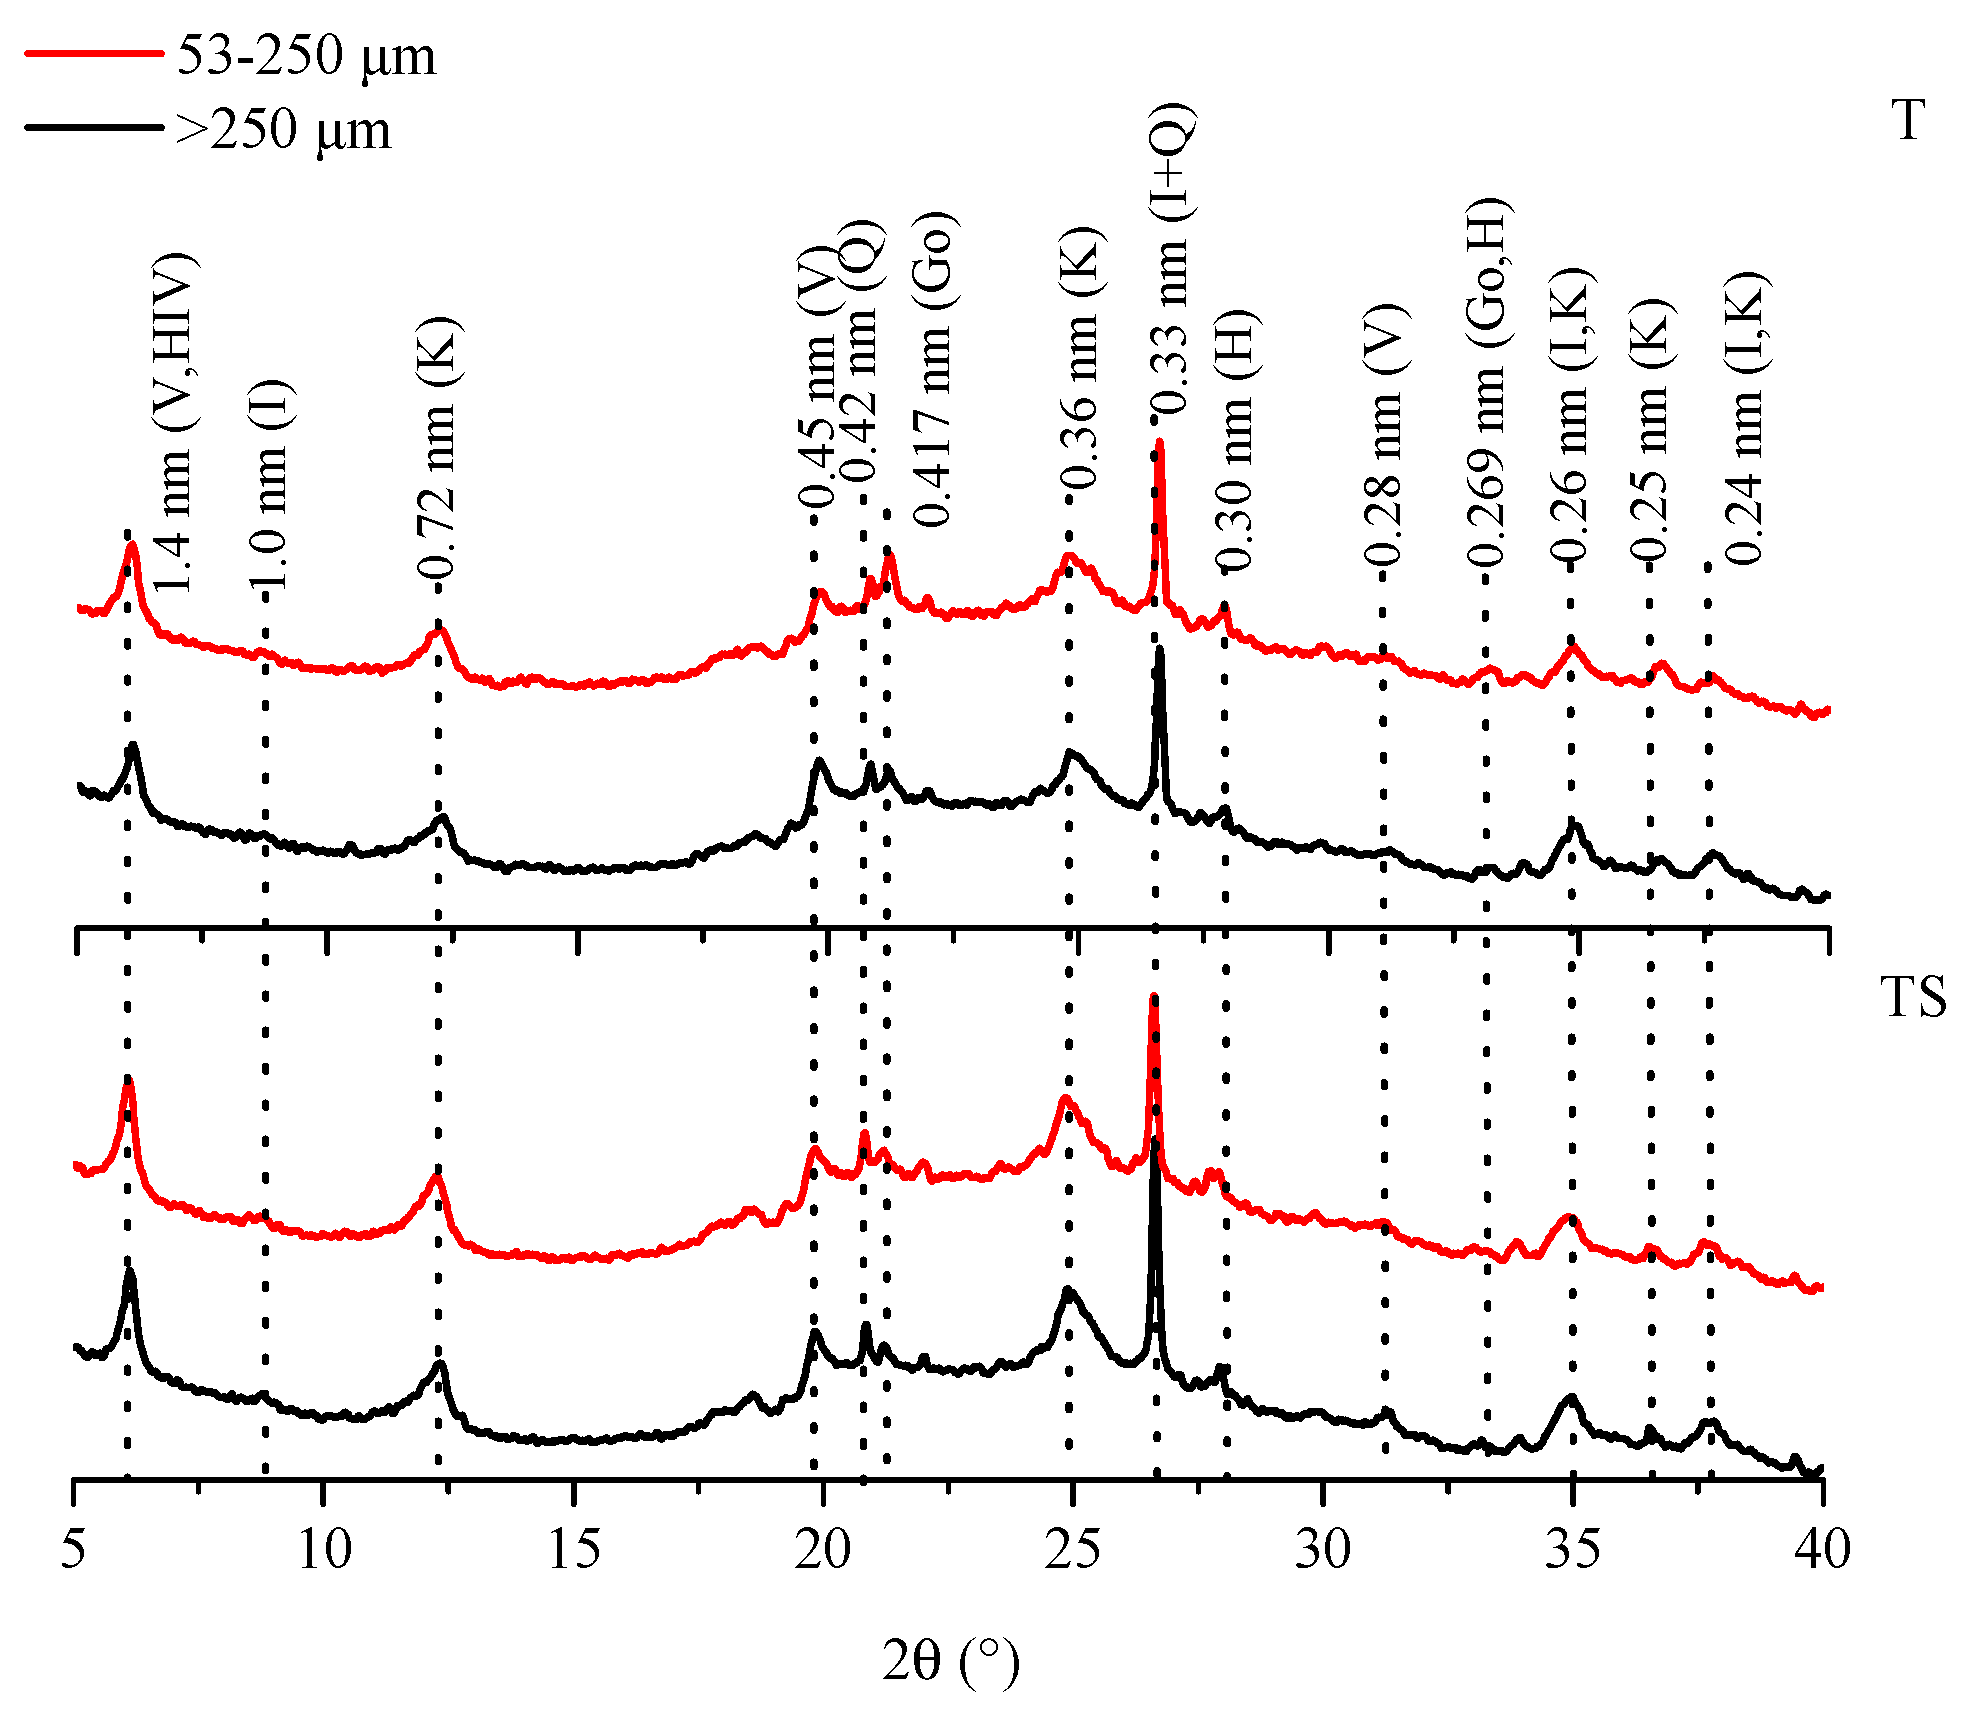
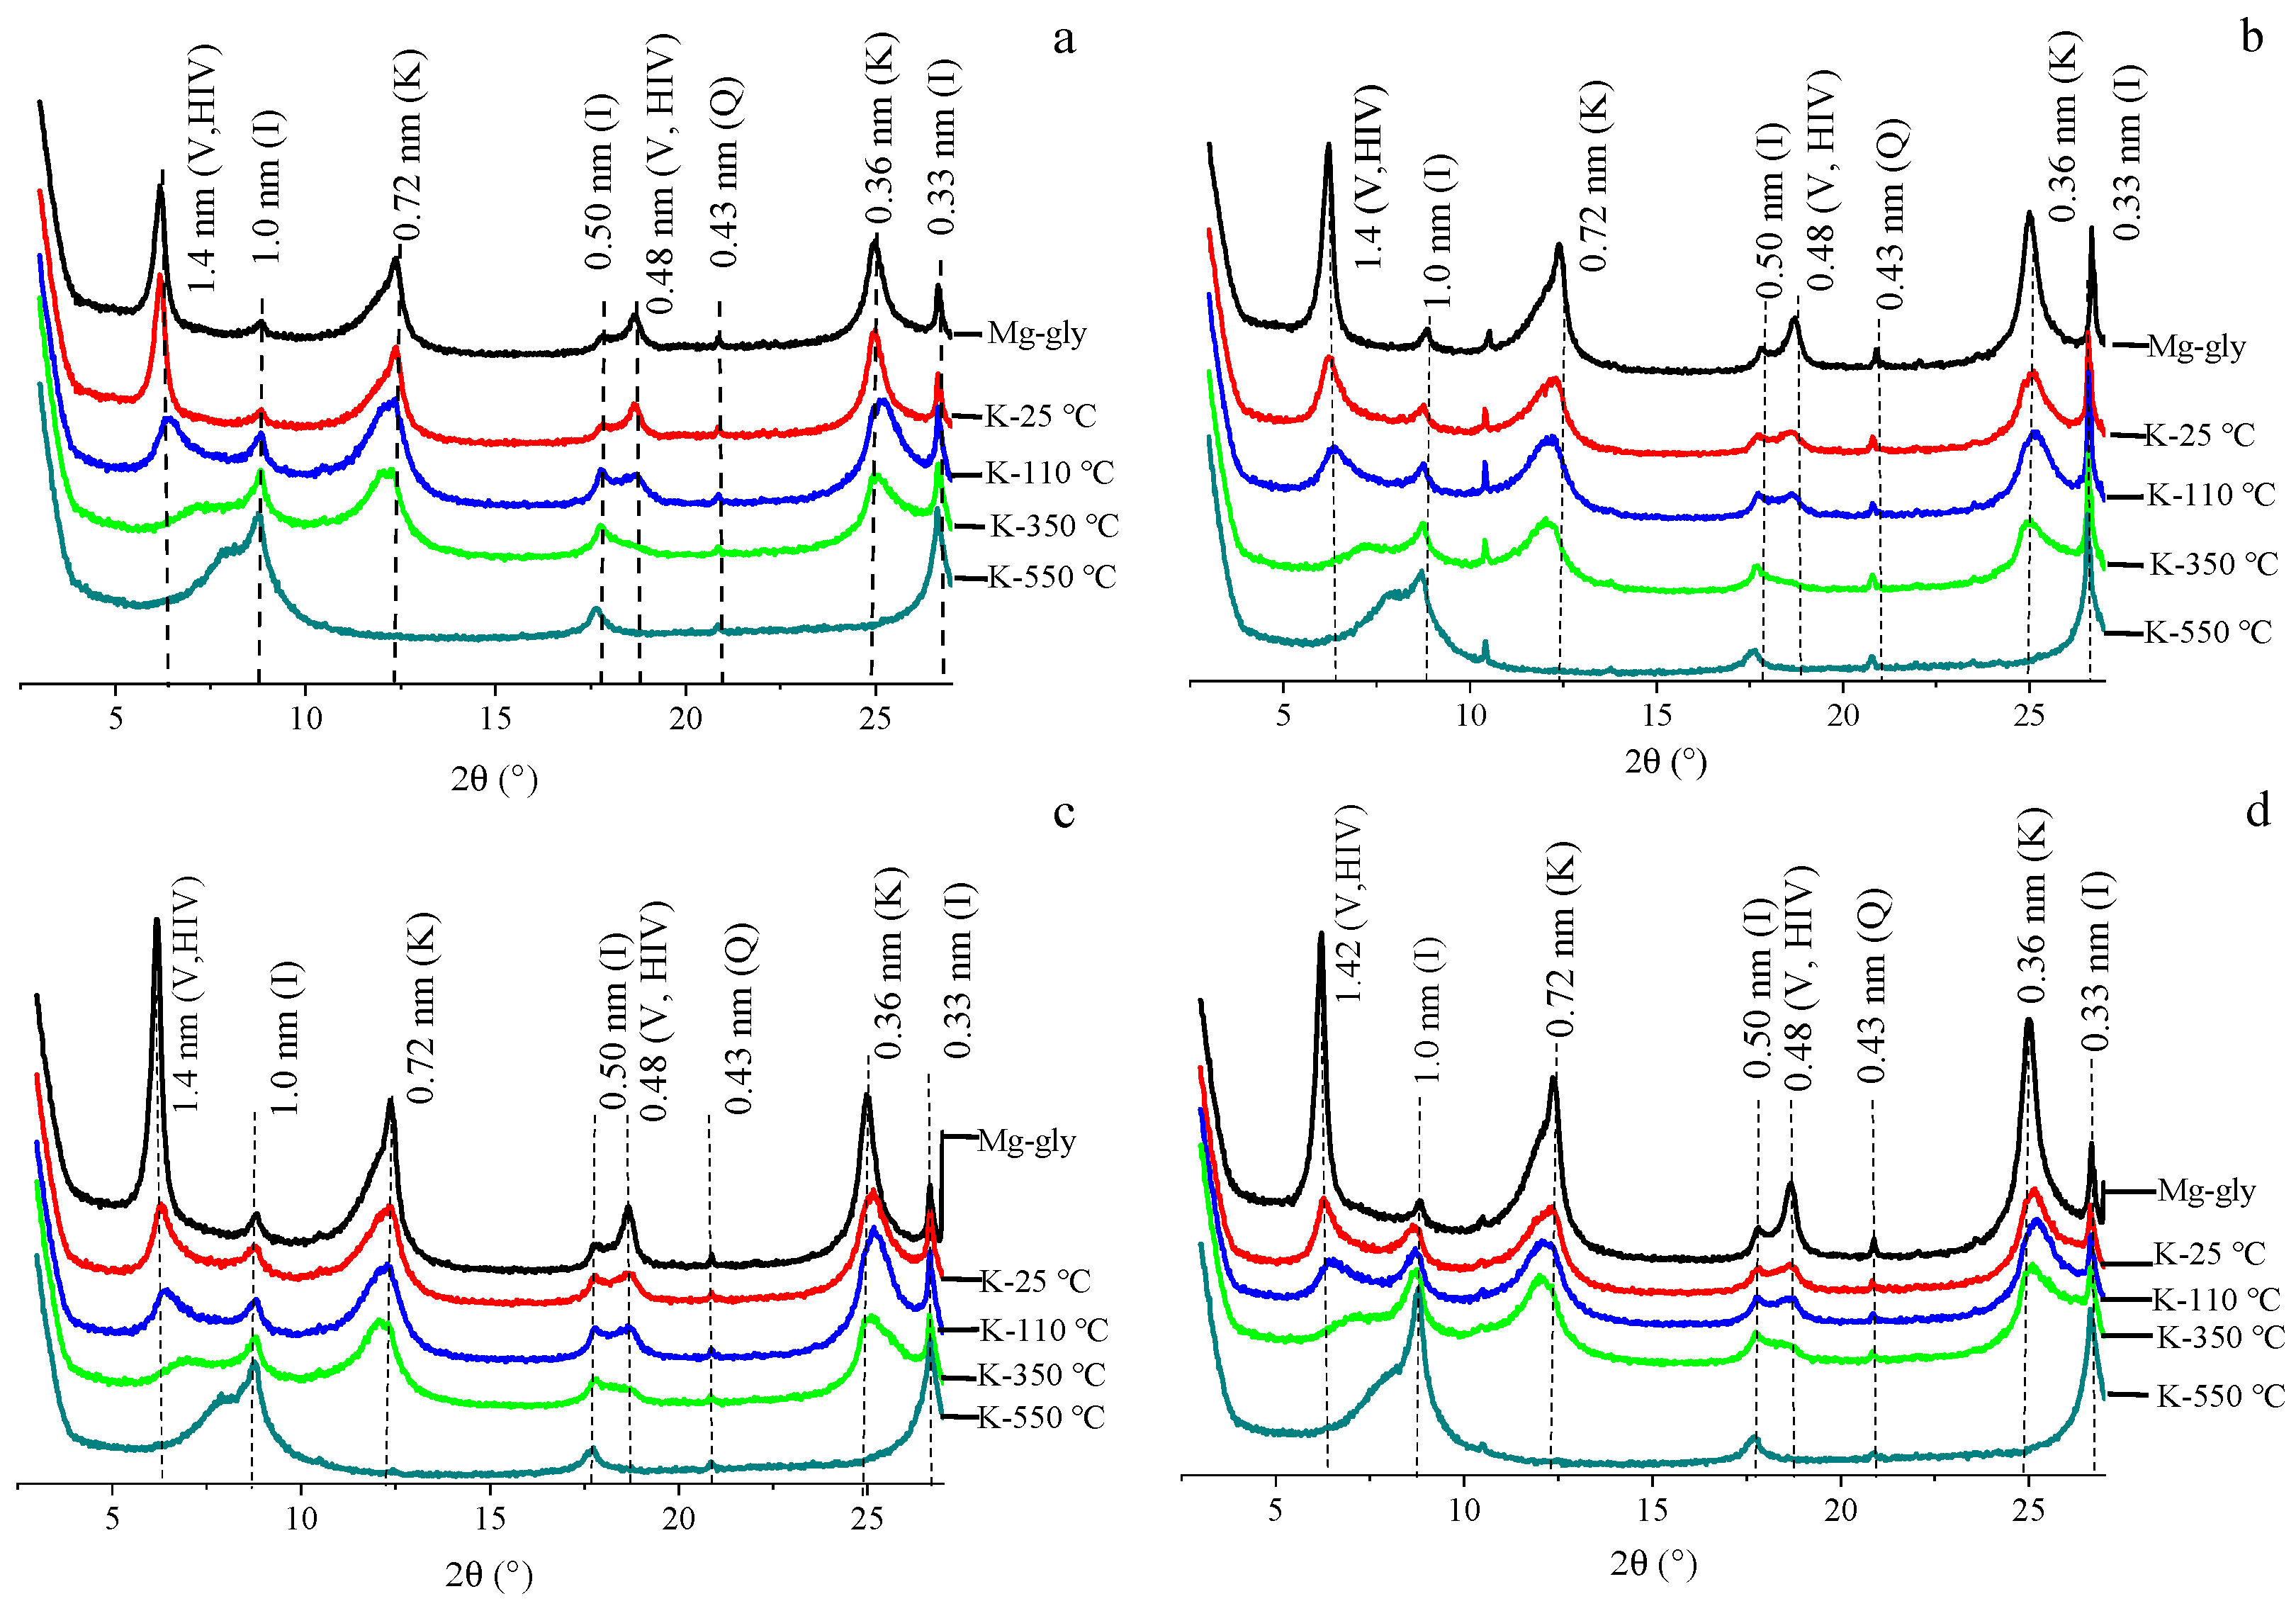
3.4. Mineral Composition of Clay Fractions within Aggregate-Sized Classes

Clay fractions within the aggregate-sized class samples obtained using random powder samples contained quartz, illite (2:1 layer type), kaolinite (1:1 layer type), feldspar, chlorite (2:1:1 layer type), vermiculite, and Fe-bearing minerals (Figure 5). XRD reflection peaks of 0.417 nm and 0.269 nm indicated the presence of goethite and hematite existed in the soil aggregates. The soil macroaggregates and microaggregates had similar mineral composition, indicating that the macroaggregates may have developed from microaggregates. Compared with the T treatment, the TS treatment decreased the peak intensity at 0.417 nm and 0.269 nm, indicating that long-term straw incorporation decreased the concentration of crystalline Fe(hydr)oxides.
The XRD patterns of the clay minerals in the clay size fractions within the aggregate-sized classes were similar under the T and TS treatments (Figure 6). The XRD patterns of the K-saturated clay indicated that illite (d-spacing of 1.0 nm, 0.5 nm, and 0.33 nm), kaolinite (d-spacing of 0.72 nm and 0.357 nm), and quartz (d-spacing of 0.43 nm) were present. The XRD reflection peaks of 1.0 nm, 0.5 nm, and 0.33 nm remained unchanged when the sample was subjected to heating treatments at 110 °C and 550 °C, indicating the presence of illite. The disappearance of reflections at 0.72 nm and 0.357 nm after this sample had been subjected to heating treatment at 550 °C indicated the presence of kaolinite. The 0.72 nm peak was asymmetrical, with a tail in the low-angle region, indicating the possible presence of interstratification with a 2:1 mineral. A reflection at 1.4 nm was identified in the Mg-saturated X-ray patterns of the clay minerals in the clay size fraction within the aggregate-sized classes. This reflection was collapsed to 1.0 nm after K-saturation, indicating the presence of vermiculite (V). A small, broad diffraction reflection between 1.4 and 1.0 nm was detected in the Mg-saturated sample, but collapsed at 1.0 nm after it had been heated at 550 °C, indicating the presence of traces of hydroxy-interlayered vermiculite in the clay size fraction within the aggregate-sized classes.
To illustrate the differences among clay size fractions within the aggregate-sized classes, the results of semi-quantitative analyses of clay minerals are shown in Table 1. The major clay minerals in the clay size fraction within the aggregate-sized class samples were kaolinite (53.6–57.5%), illite (9.97–14.6%), vermiculite (4.10–21.6%), and hydroxy-interlayered vermiculite (10.4–30.6%). The relative amount of hydroxy-interlayered vermiculite in the clay size fraction of the macroaggregate samples was higher than that in the microaggregates, whereas the relative amounts of illite and kaolinite had a reverse tendency. Furthermore, compared with the T treatment, the TS treatment increased the relative amounts of kaolinite and vermiculite; conversely, it decreased the relative amount of illite in all aggregates.

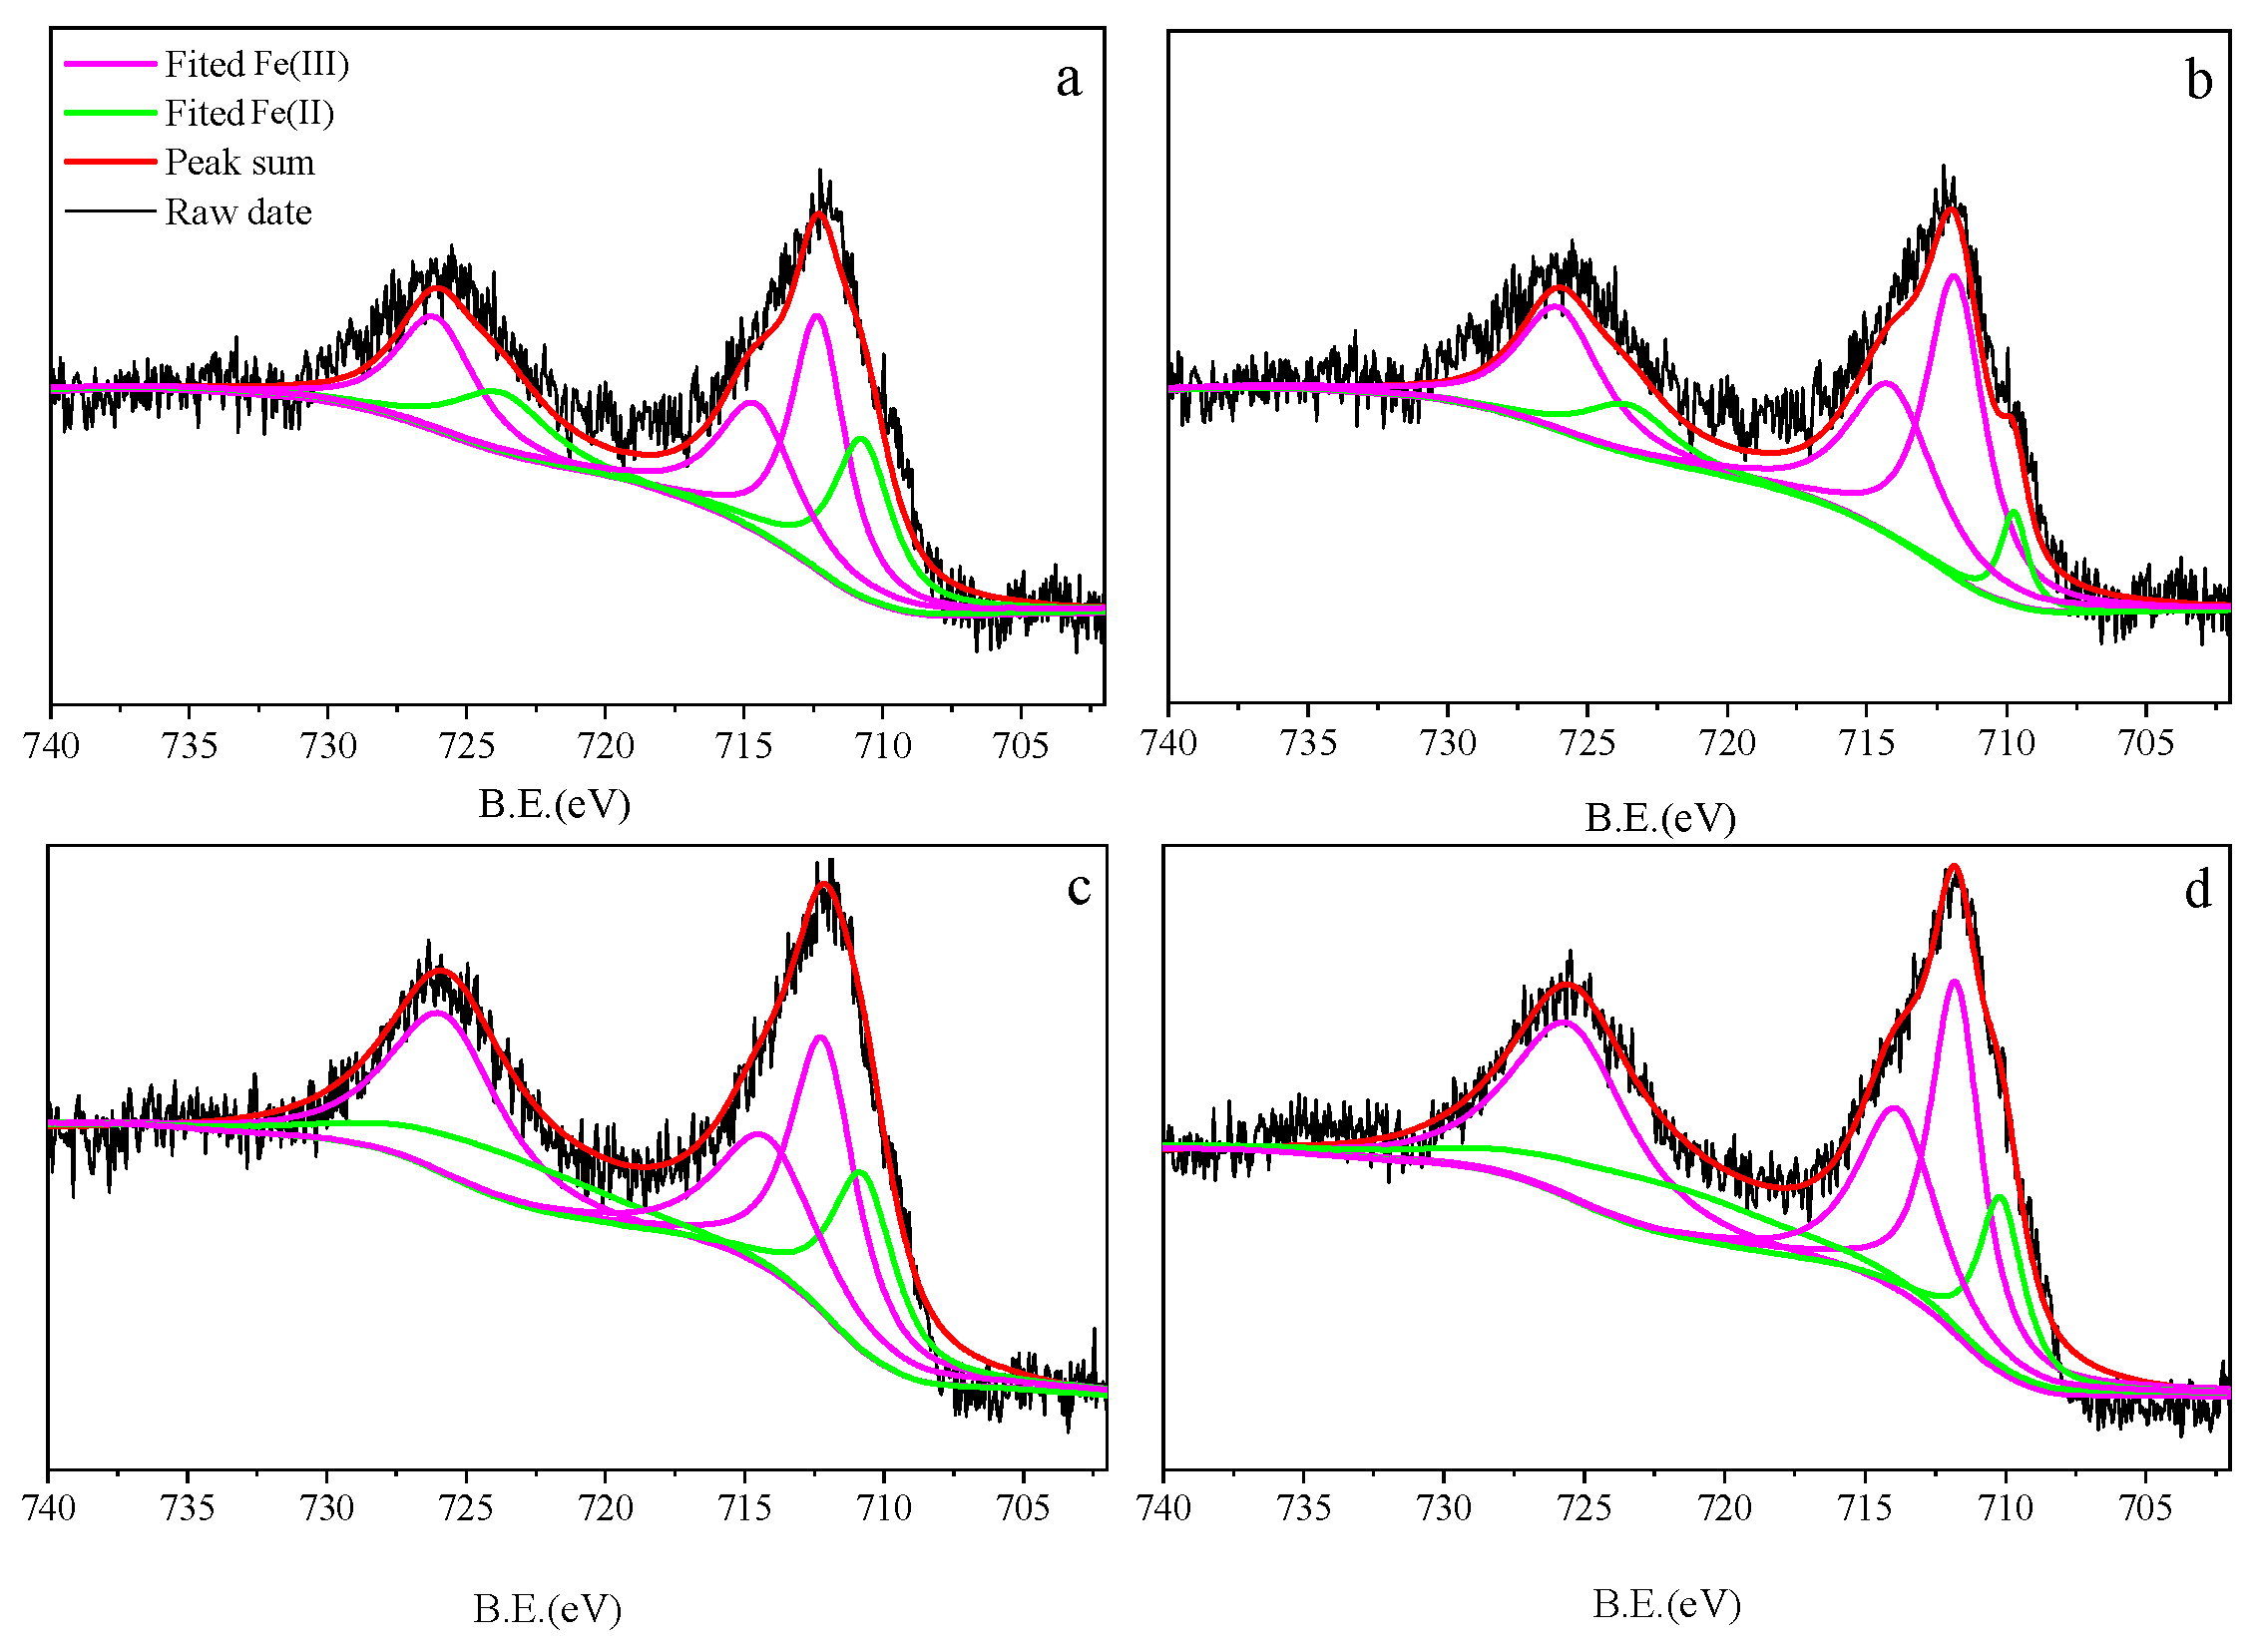
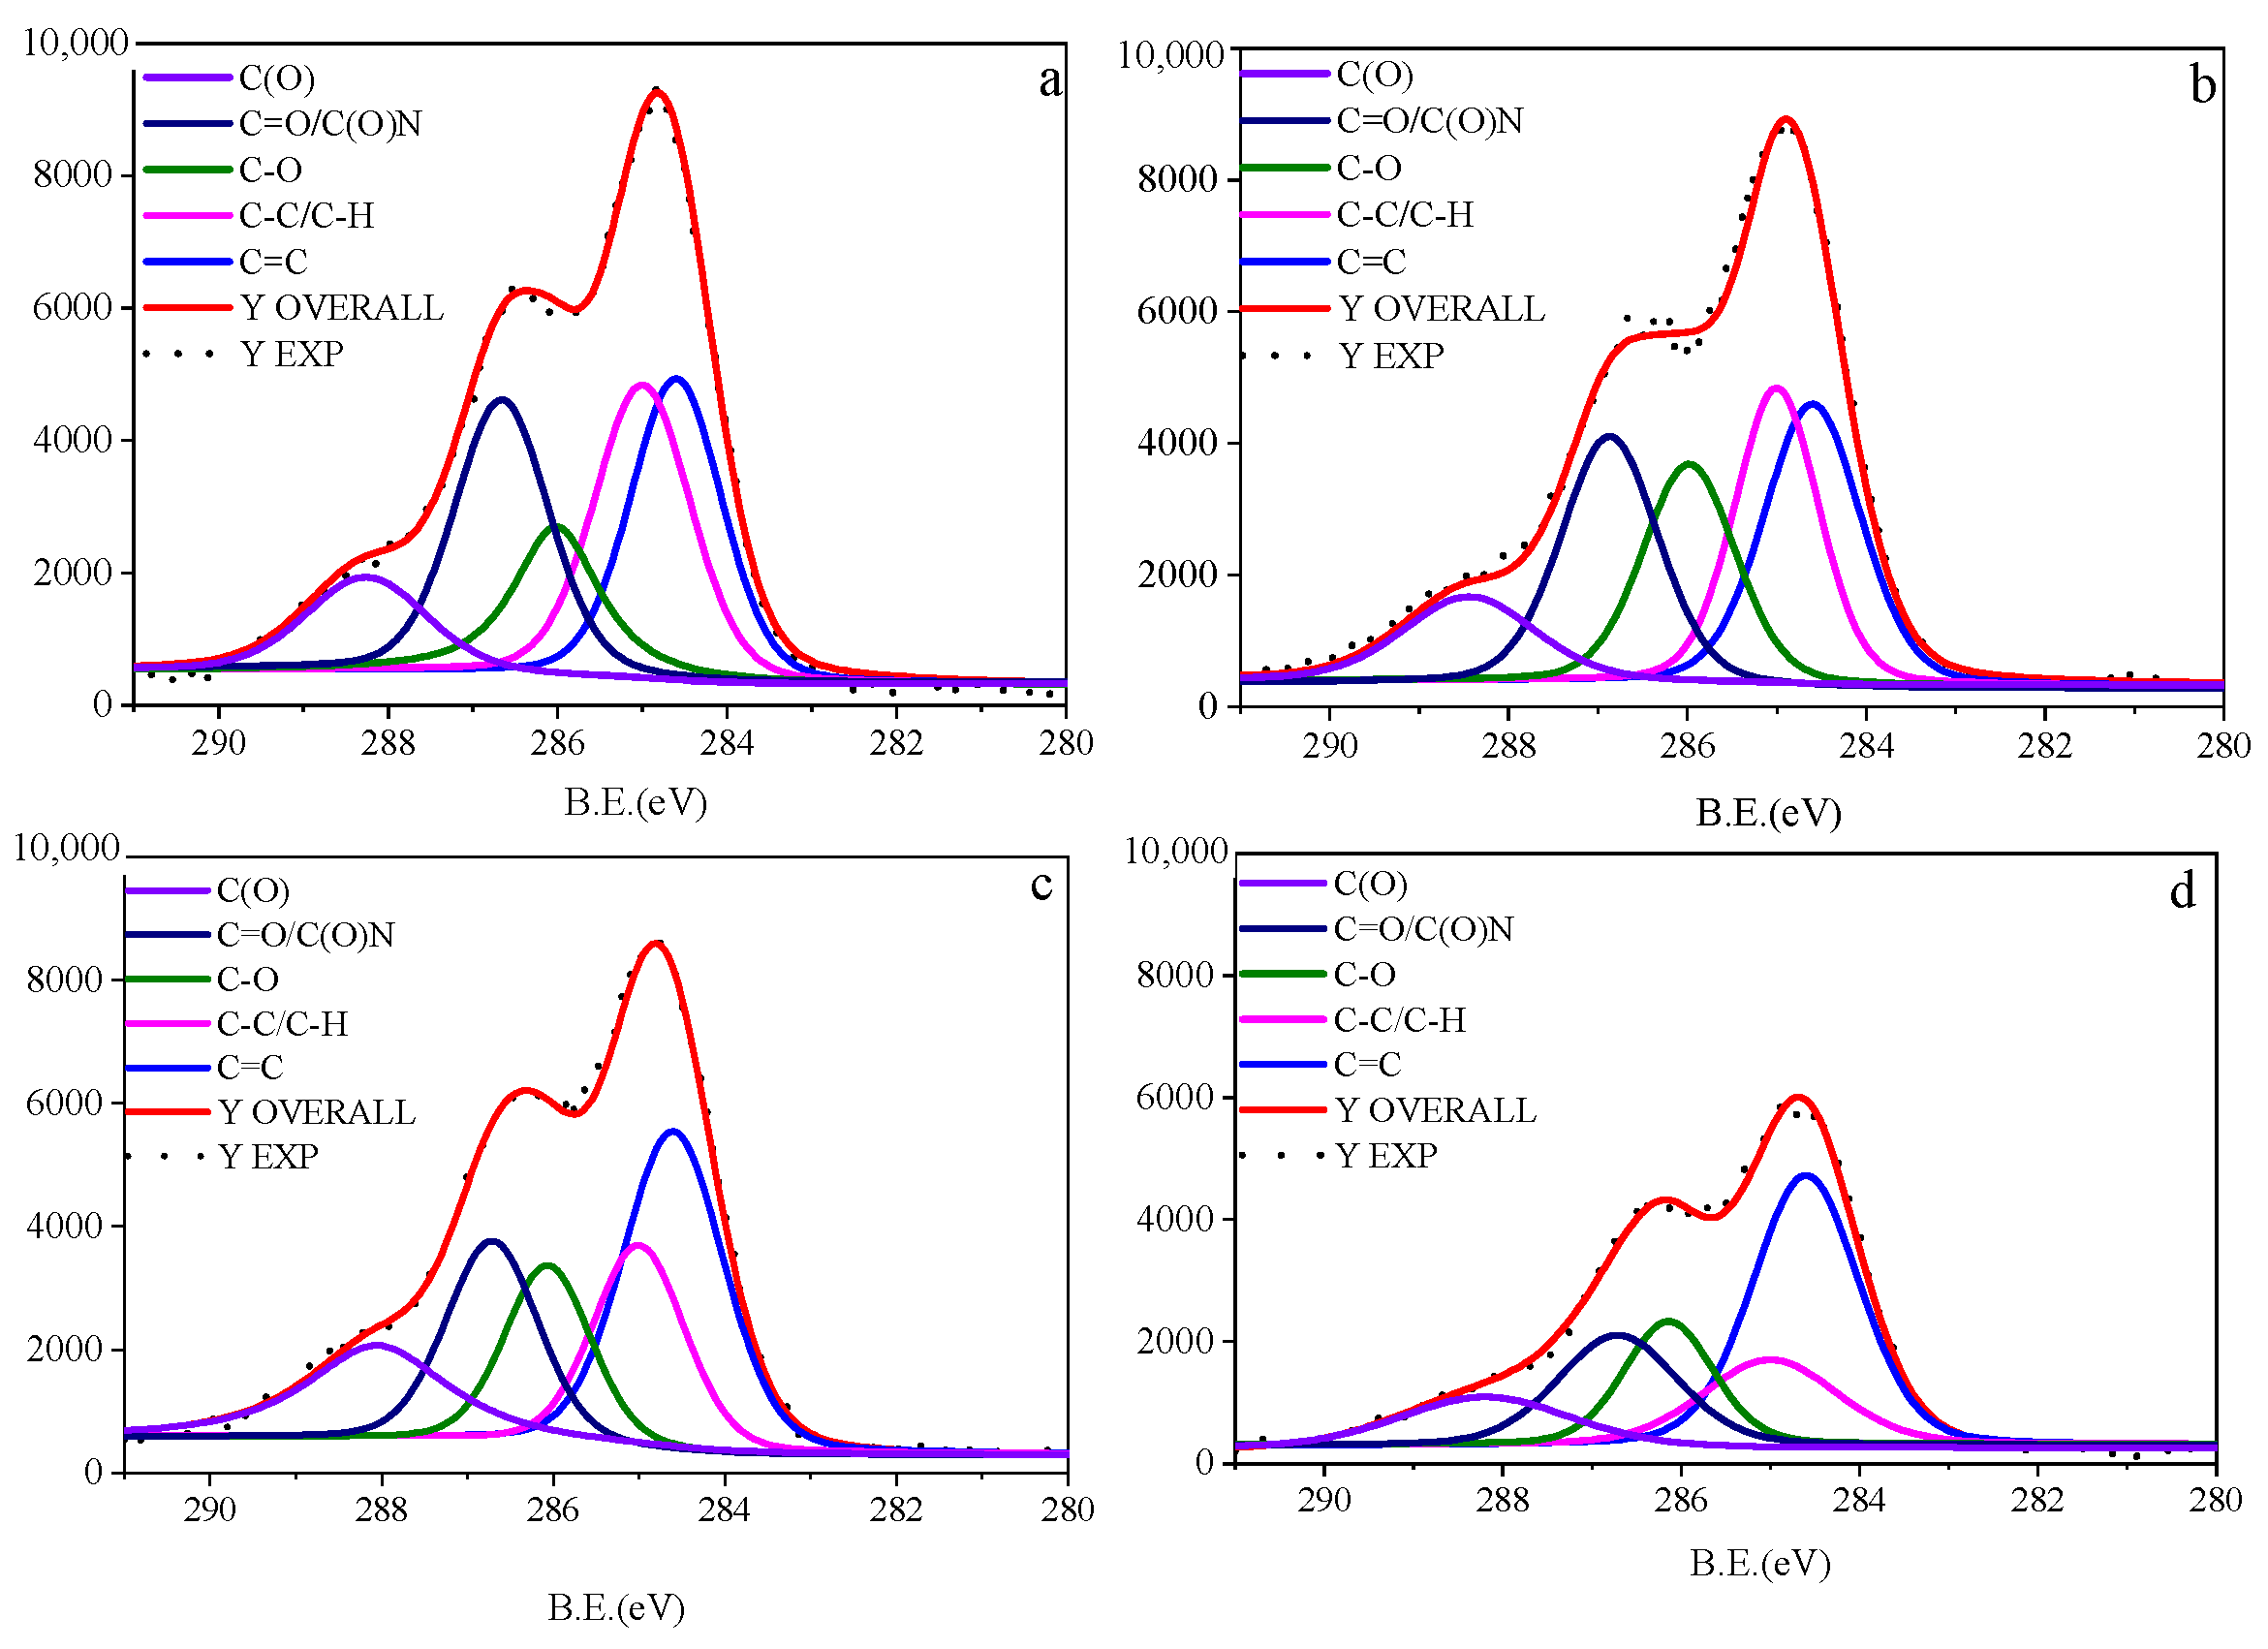
3.5. High-Resolution XPS Spectrum of Fe in Clay Fractions within Aggregates

XPS analysis was performed to establish the absolute binding energy of Fe 2p at the surface of clay fractions within aggregates, and the results are presented in Figure 7. It is commonly accepted that the respective Fe 2p3/2 peak positions of Fe(III) and Fe(II) are at 712.3 and 710.7 eV, whereas the respective Fe 2p1/2 peaks of Fe(III) and Fe(II) are at 726.1 eV and 723.7 eV. Furthermore, the satellite peak position of Fe(III) was 714.6 eV [55,56]. The Fe 2p3/2 peak intensity of Fe(III) at 712.3 eV was higher in clay fractions within microaggregates than in fractions within macroaggregates, whereas the Fe 2p3/2 peak intensity of Fe(II) at 710.7 eV showed the reverse order. Compared with microaggregates, the abundance of Fe-reducing bacteria is reportedly higher in macroaggregates [57,58], and a portion of Fe(III) oxides can be reduced to dissoluble Fe(II) by Fe-reducing bacteria [59]. Moreover, compared with the T treatment, the TS treatment decreased Fe 2p1/2 peak intensities of Fe(II) at 723.7 eV in both macroaggregates and microaggregates.

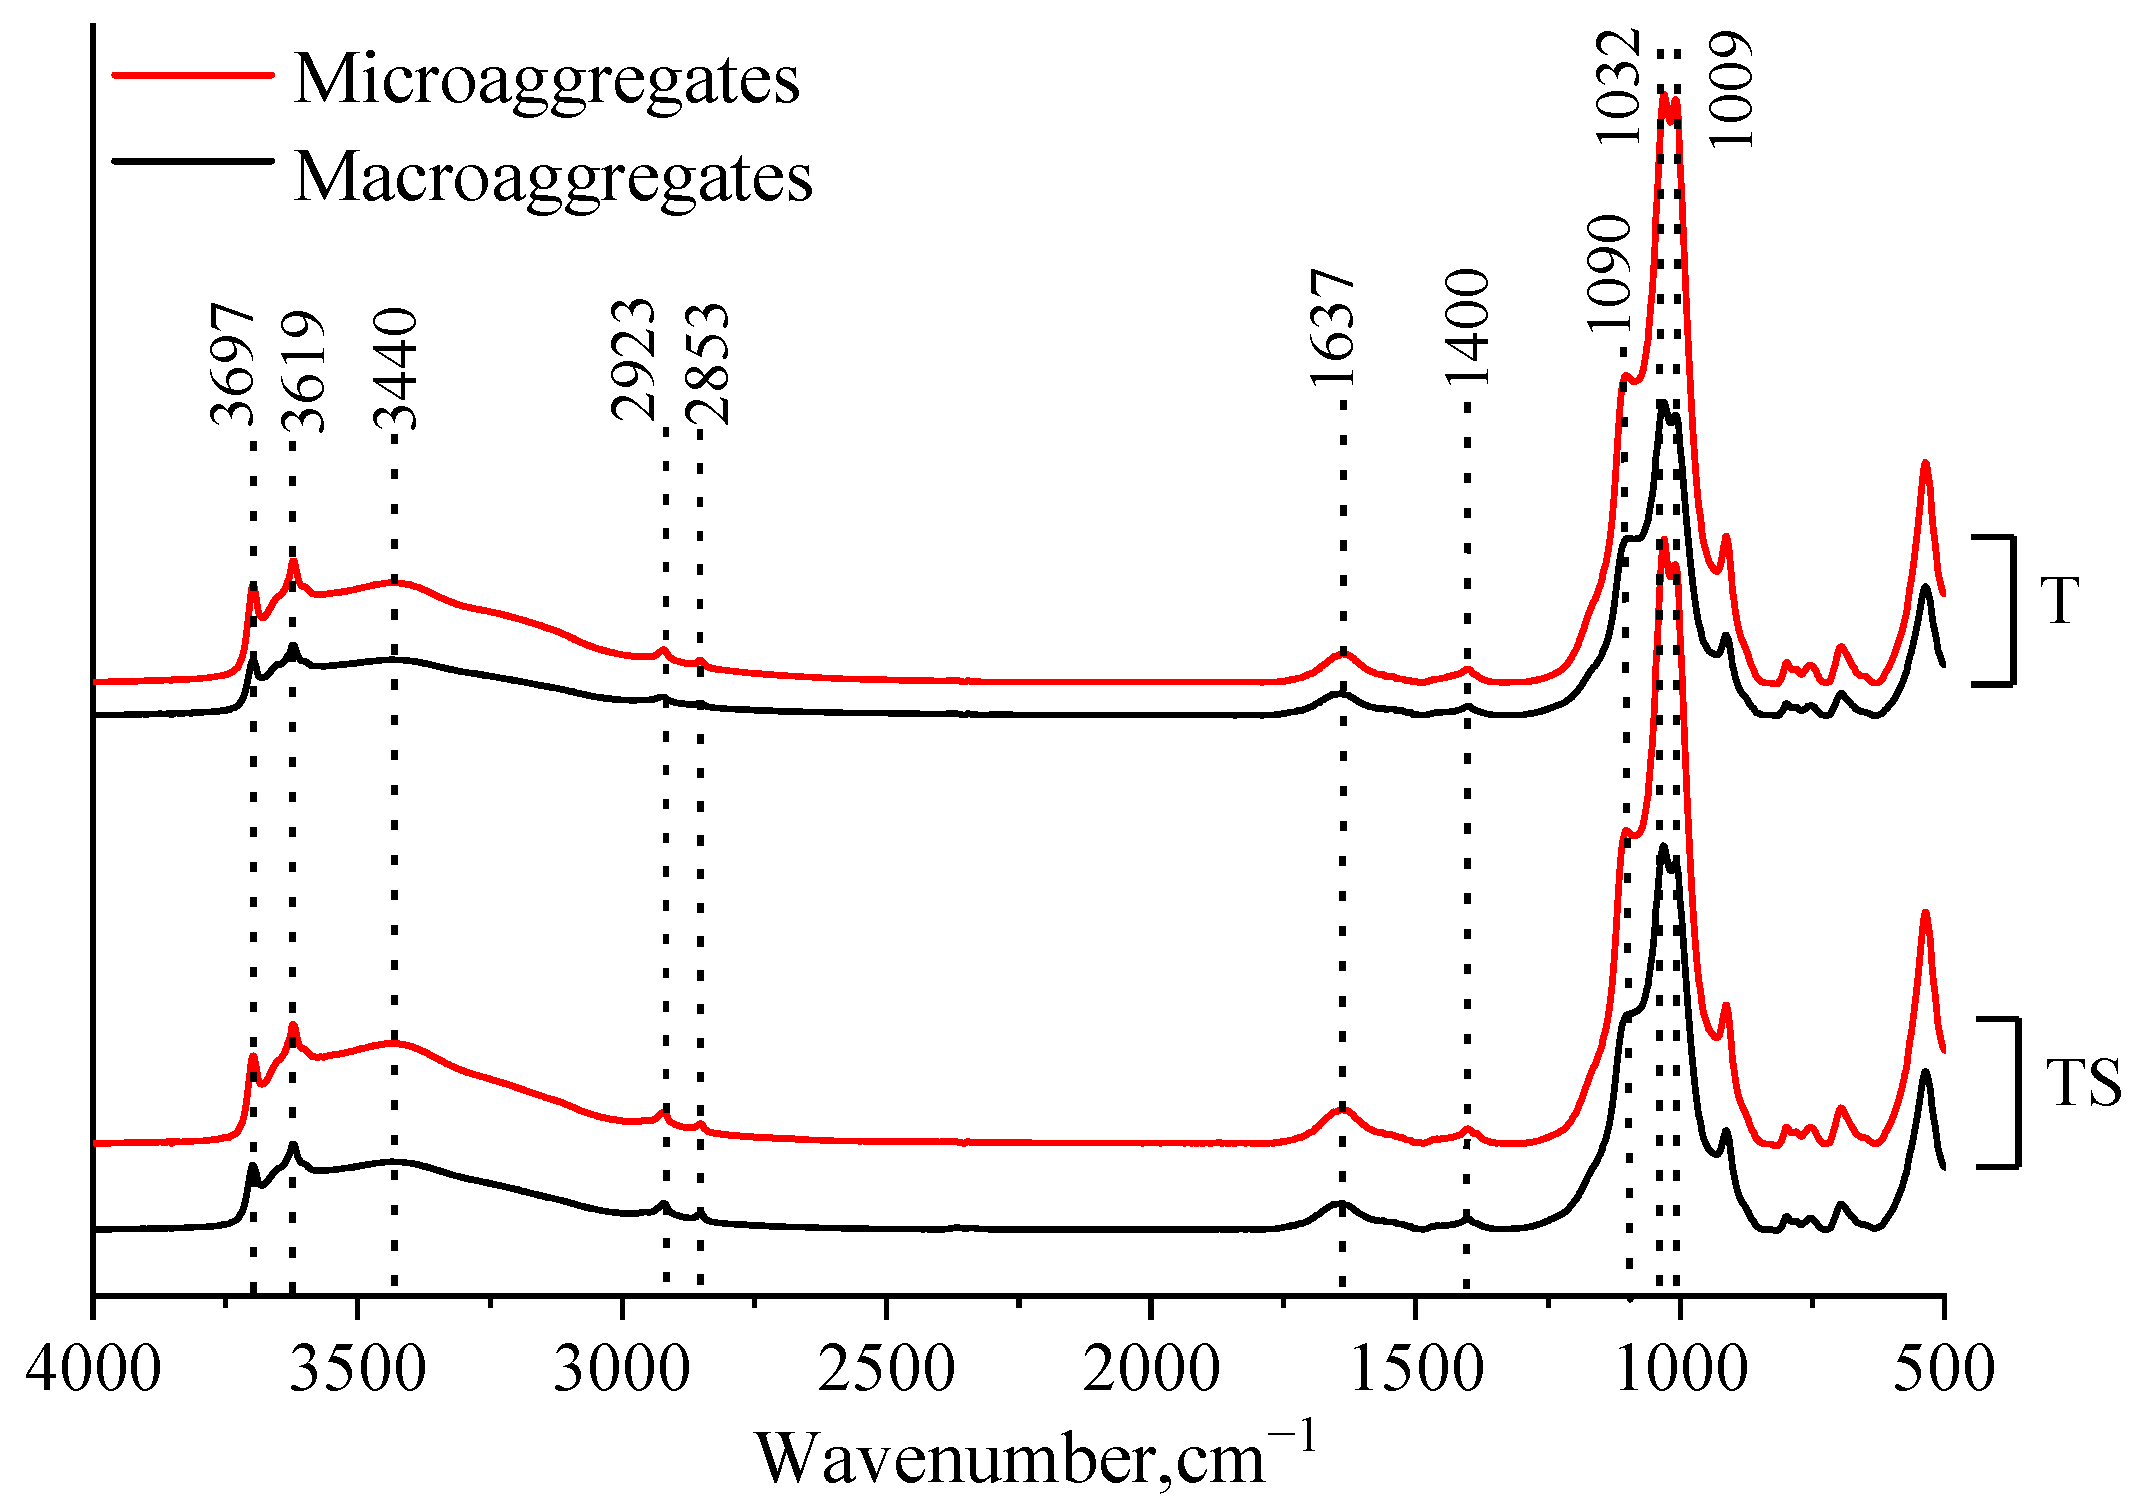
3.6. SOC Species in Clay Fractions within Aggregates by FTIR and XPS Spectroscopy

The FTIR spectra of clay fractions within aggregates were relatively similar (Figure 8). The strong band at 3600–3200 cm−1 was attributed to hydrogen-bonded OH groups in phenol [60,61,62]. The bands at around 2923 and 2853 cm−1 were assigned to the stretching of aliphatic CH3 and CH2, respectively [61,63]. The broad band between 1650 and 1550 cm−1 reflected aromatic C=C vibrations (1637 cm−1) [60,64]. The band at 1400 cm−1 was assigned to C=O stretching of protonated carboxylic acid [65]. Absorption bands at 1090 cm−1 were assumed to correspond with polysaccharides and polysaccharide-like substances [61,66]. Some of the absorption around 1032 cm−1 likely reflected Si-O-Si stretching (that resulted from incomplete dissolution of silicate minerals in the HF treatment) [63,67].
In clay fractions within aggregates, polysaccharides-C was the major organic component, accounting for above 27% of total SOC, followed by phenolics-C about 9% (Table 2). Alkanes-C, aromatic-C, carboxylic-C, and polysaccharides-C contents in aggregates associated clays were consistently higher in macroaggregates than microaggregates, whereas that of phenolics-C and silicate minerals showed an opposite order. Compared with T, TS treatment showed a minute decreased in the relative intensities of alkanes-C by 18.09% and 7.45% in clay fractions within macroaggregates and microaggregates, respectively. In contrast, TS treatment increased the relative intensities of aromatic-C and polysaccharides-C clay fractions within macro- and microaggregates, as compared with T. Meanwhile, TS treatment increased the relative intensities of carboxylic-C by 19.9% in clay fractions within macroaggregates, whereas this decreased by 41.0% in clay fractions within microaggregates.
Compared with the T treatment, the TS treatment increased the amounts of aromatic-C and carboxylic-C, while it decreased the aliphatic-C and ether or alcohol-C in clay fractions within the two aggregates by XPS technique (Figure 9). The amounts of aromatic-C were higher in the clay fractions within microaggregates than in the clay fractions within macroaggregates, whereas the amounts of aliphatic-C and ether or alcohol-C exhibited the reverse trend.
The XPS C 1s peak-fitting results demonstrated that aliphatic-C (C–C/H) (15.5–30.8%) and aromatic-C (C=C) (23.8–39.5%) were dominant in clay fractions within macroaggregates and microaggregates under the T treatment, respectively (Table 3). Aromatic-C (C=C) was the major organic compounds under the TS treatment; these had abundances of 31.7% and 39.5% in the clay fractions within macroaggregates and microaggregates, respectively. Aliphatic-C (C–C/H) and alcohol-C (C–O) were consistently higher in clay fractions within macroaggregates than in fractions within microaggregates. However, aromatic-C (C=C) showed a reverse trend under the T and TS treatments. Compared with the T treatment, TS treatment increased the relative amounts of aromatic-C (C=C) by 33.3% and 55.0% and carboxylic-C (C(O)O) by 107.0% and 18.6% in clay fraction within macroaggregates and microaggregates, respectively. In clay fraction within macroaggregates and microaggregates, TS treatment decreased aliphatic-C (C–C/H) by 40.6% and 33.0% and alcohol-C (C–O) by 41.5% and 20.5%, respectively, compared with the T treatment.

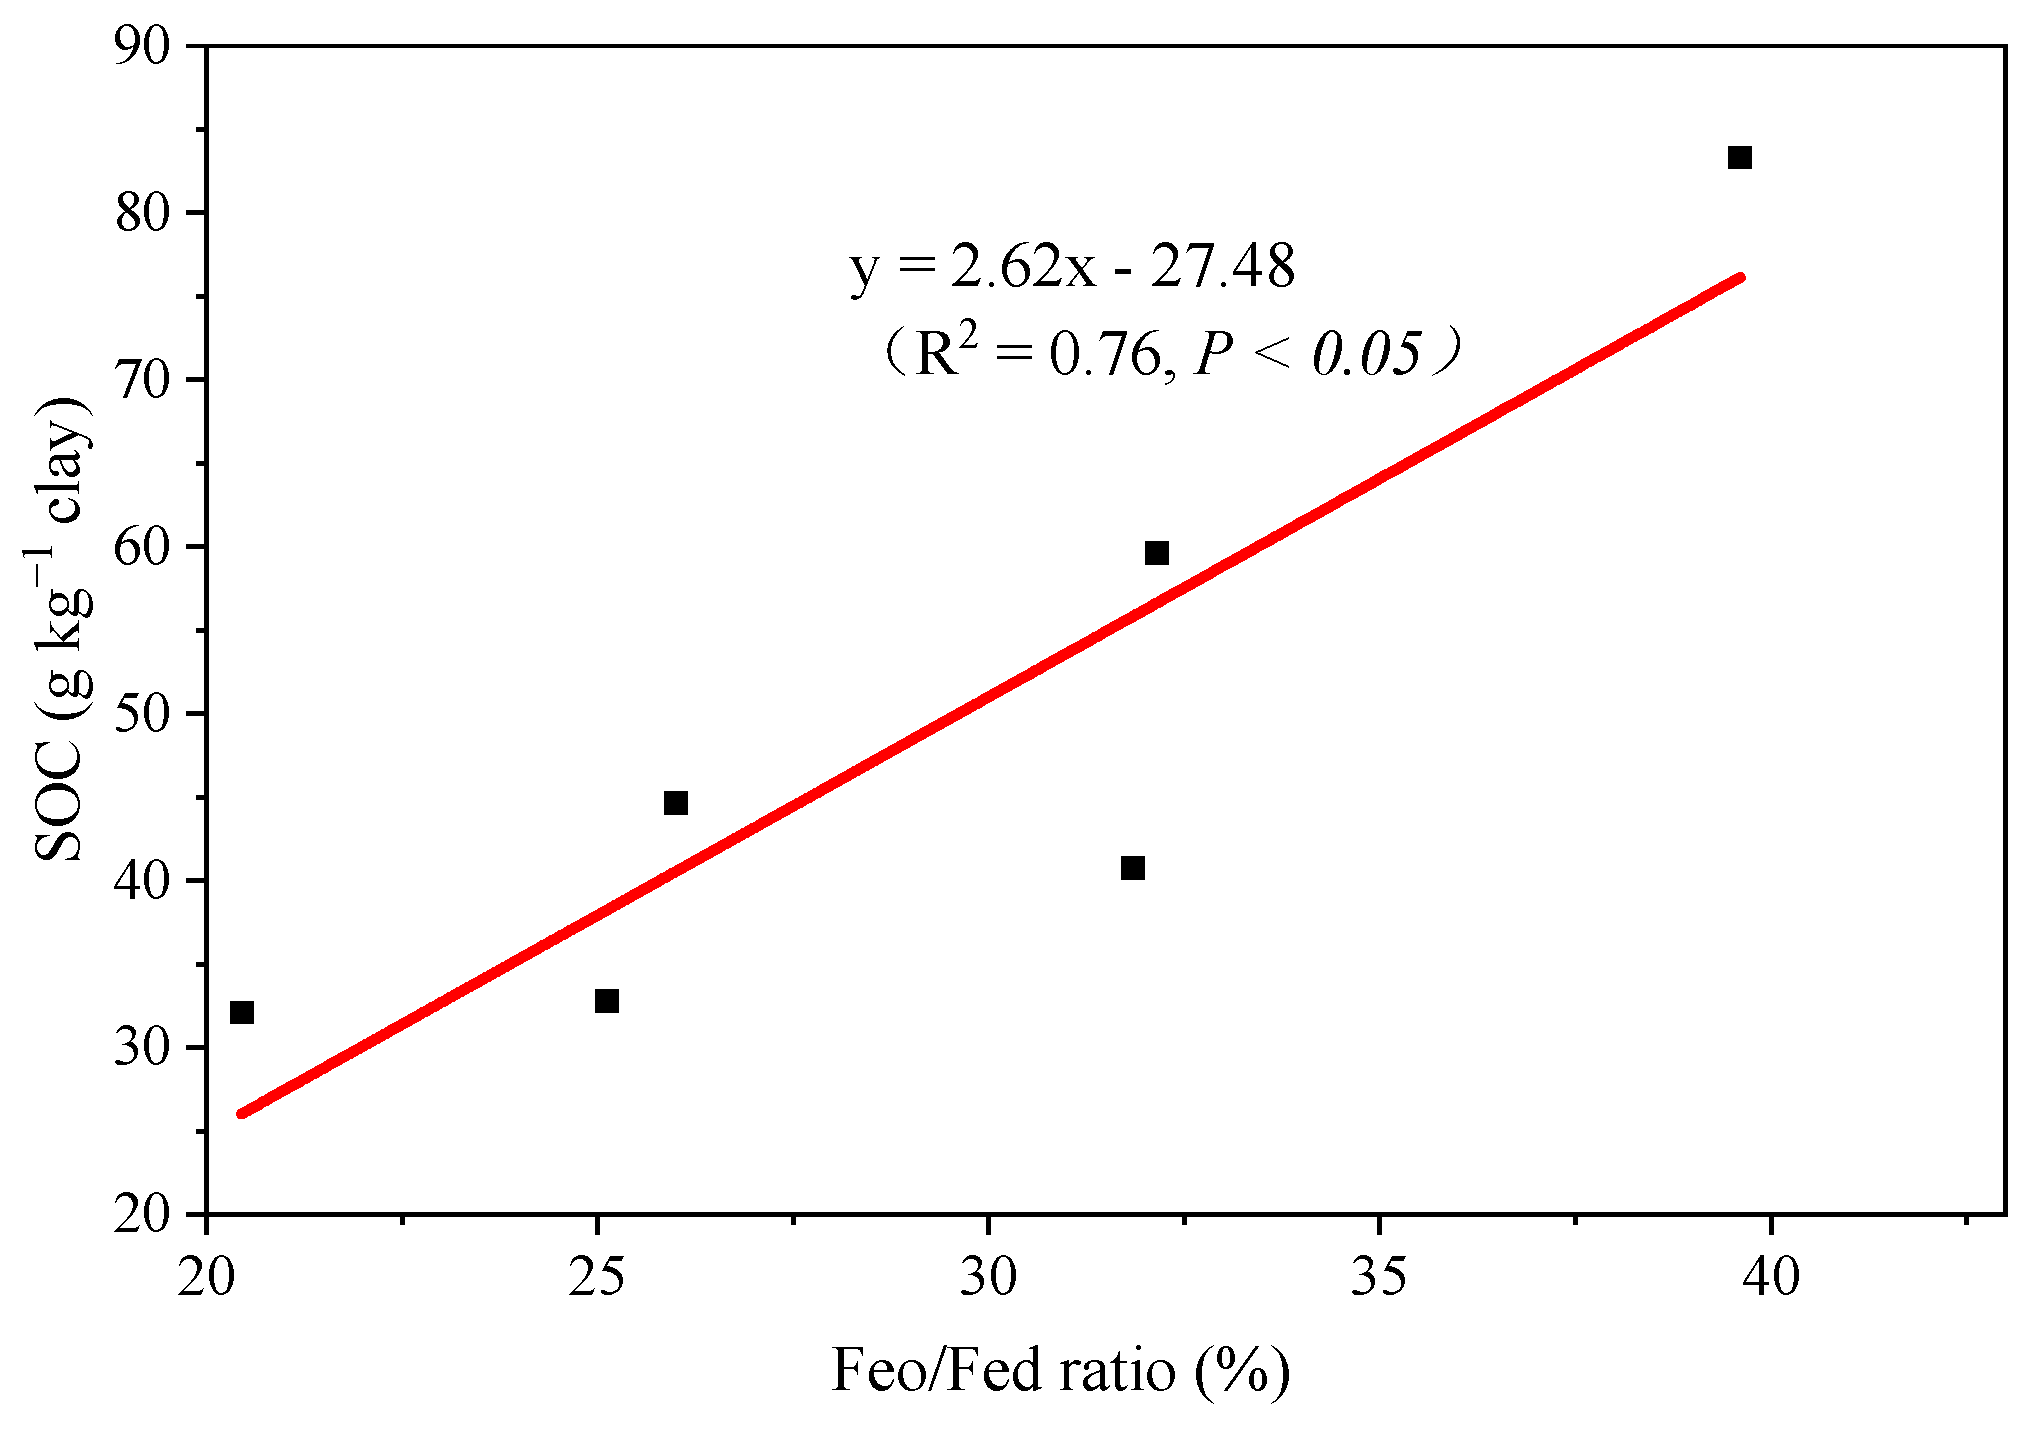
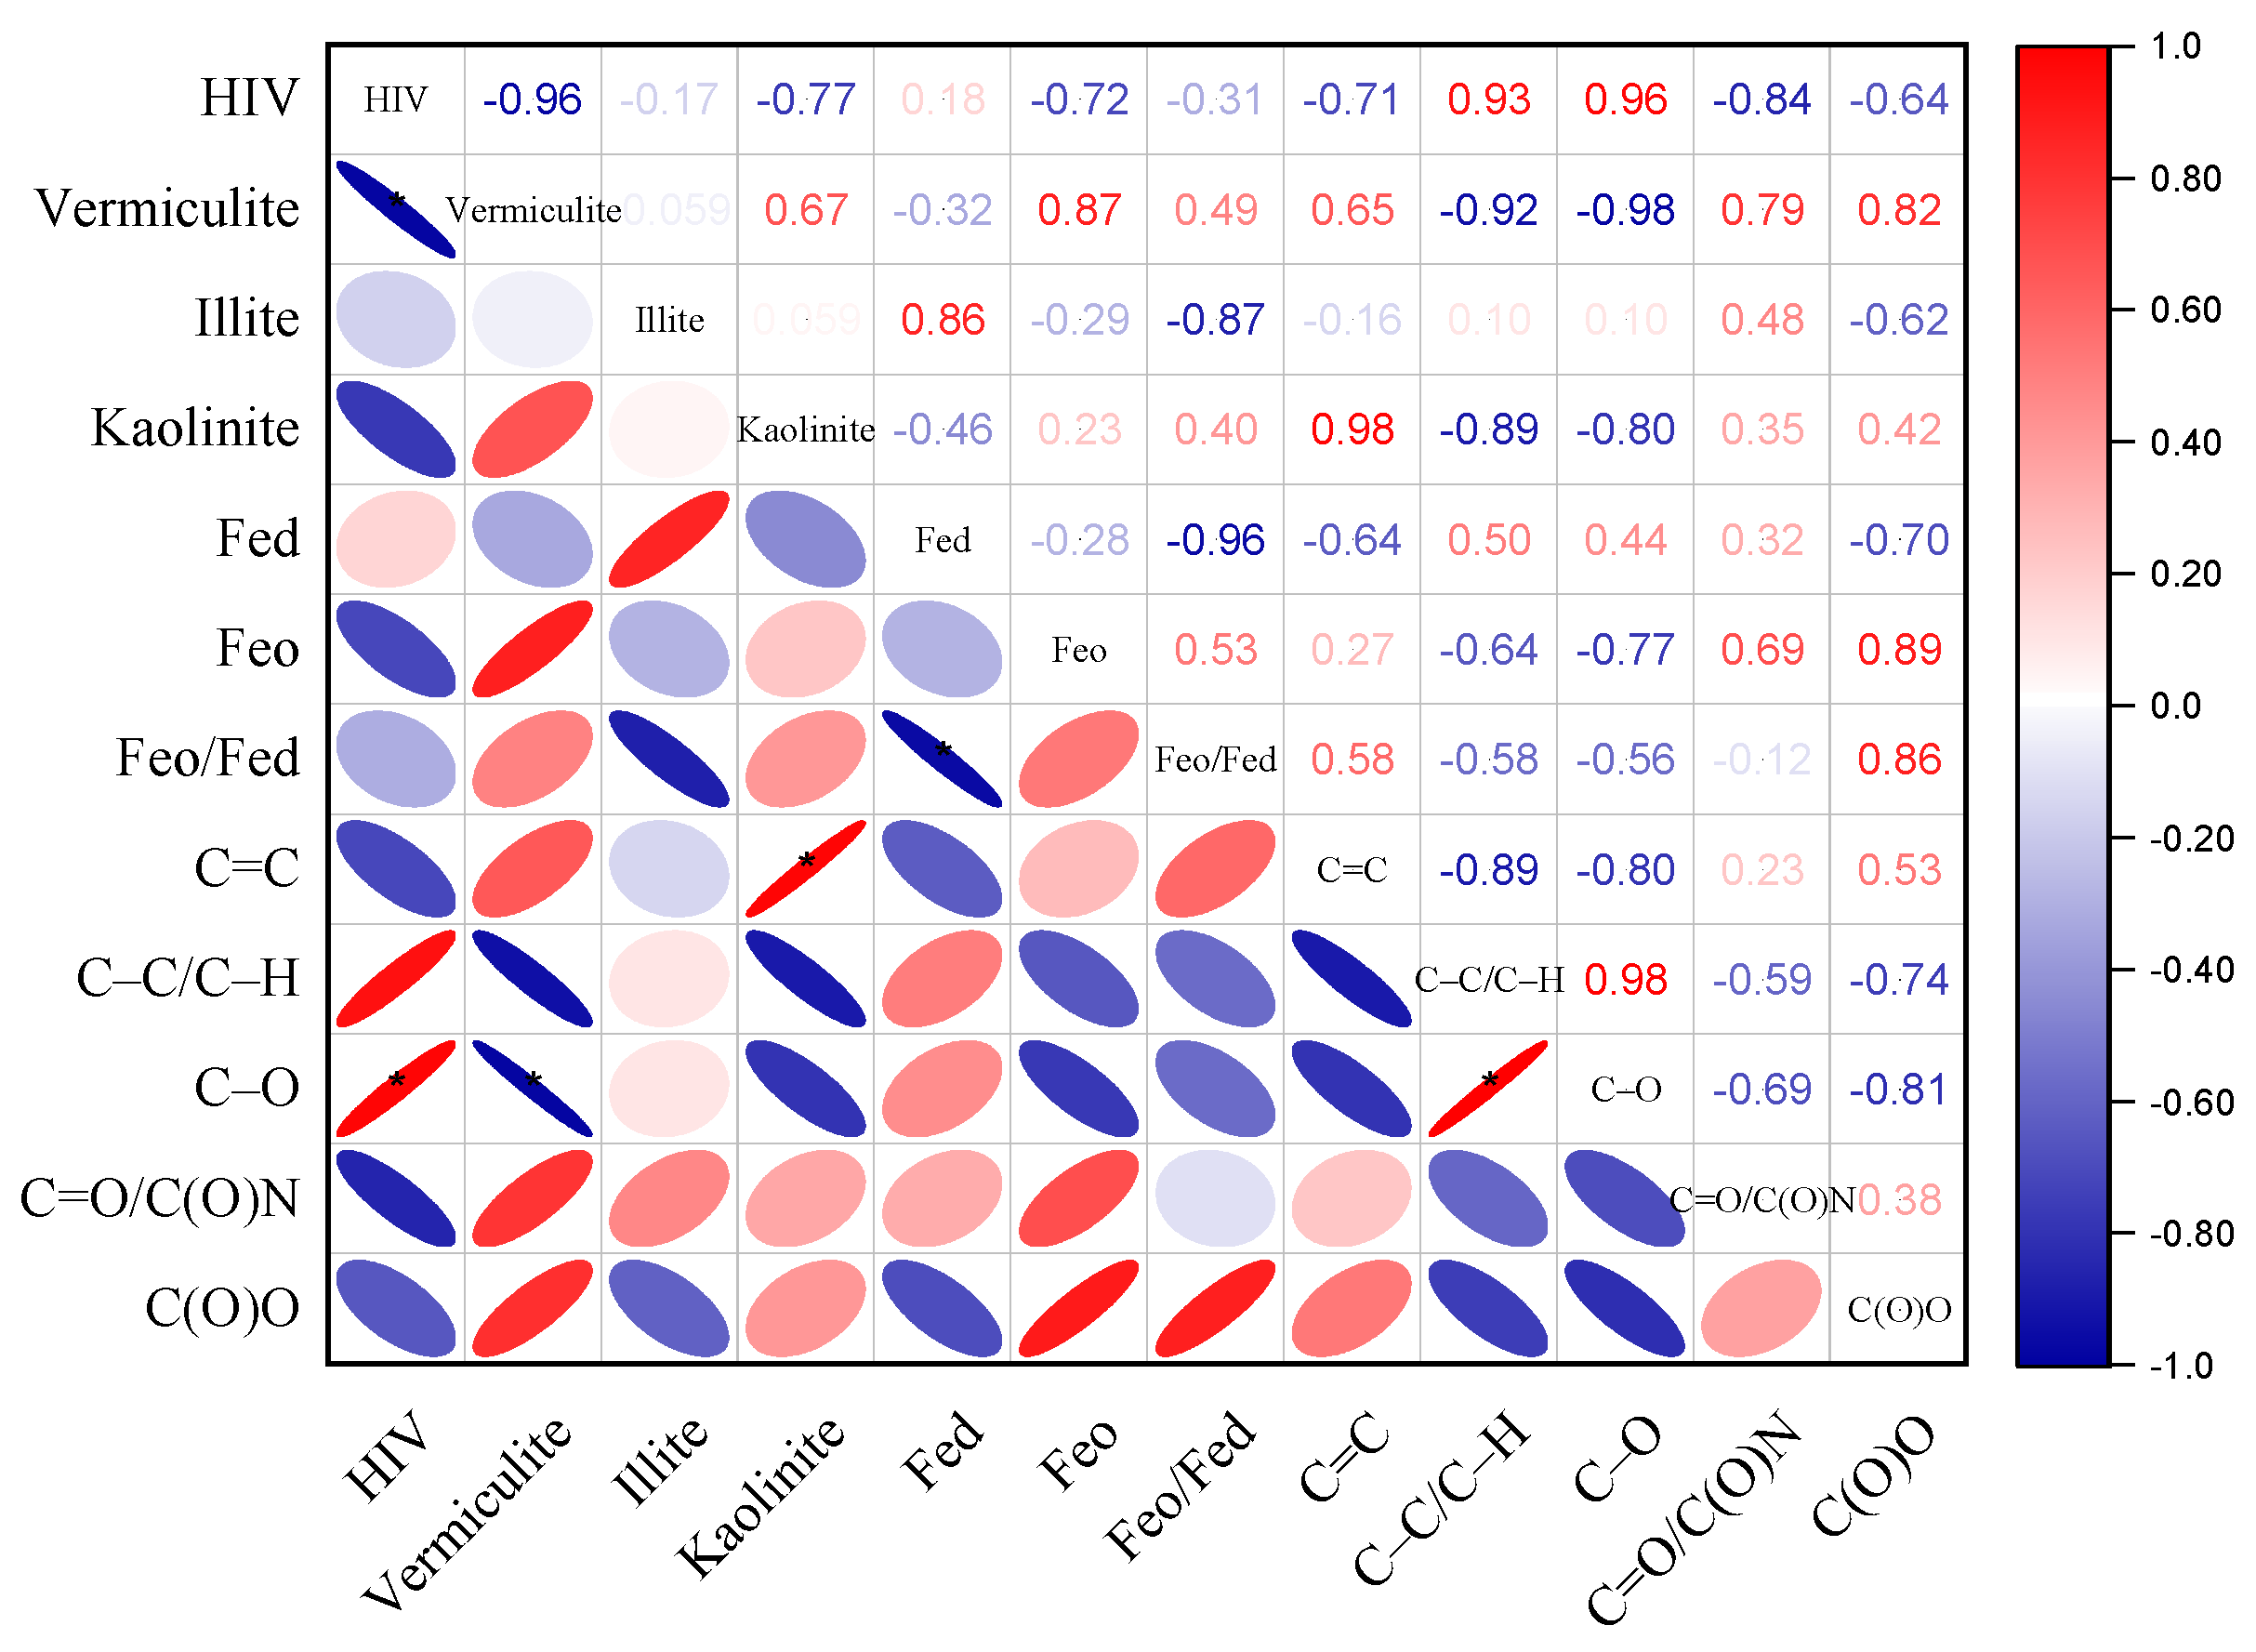
3.7. Relation between the Relative Percentages of Clay Minerals, Fe (oxyhydr)oxides, and Different Organic Functional Groups

The hydroxy-interlayered vermiculite in clay fractions showed positive correlation with the amounts C–C(H) (r = 0.93) and C–O (r = 0.96 *, p < 0.05) (Figure 10), implying that the hydroxy-interlayered vermiculite preferentially binds aliphatic and alcohol organic compounds to form organo–mineral complexes. In addition, the kaolinite was significantly (r = 0.98 *, p < 0.05) positively correlated with the amounts of C=C in clay within aggregates. The concentration of Feo and Feo/Fed ratio was positively correlated with the amounts of C=C and C(O)O content in clay within aggregates.

4. Discussion

Macroaggregates were enriched in hydroxy-interlayered vermiculite (Table 1), suggesting that their formation is promoted by the reactivity of this mineral phases. This may be explained by high CEC and high a SSA of hydroxy-interlayered vermiculite [68]. In addition, several authors also have shown that SSA and surface charge properties of soil mineral phases control mineral–organic interactions [17,22]. We found that the SOC contents was higher in the clay fraction within macroaggregates than that in microaggregates (Figure 2b). Due to the negatively charged external surface of hydroxy-interlayered vermiculite and of organic matter can be mutually bound with polyvalent cations, which permits the formation of organo–mineral complexes. Meanwhile, hydroxy-interlayered vermiculite in clay fractions showed positive correlation with the amounts C–C(H) and C–O (Figure 10), implying that the hydroxy-interlayered vermiculite preferentially binds aliphatic and alcohol organic compounds to form organo–mineral complexes. In the interlayer space of 2:1 clay minerals, polar organic functional groups are usually present in form of water bridging complexes with nearby metal cations [69,70]. Intercalation of organic compounds into the interlayer space of swelling clay minerals has been previously reported in pedological environments by some researchers [6], interlayer clay–organic complexes have been most often found between 2:1 clays mineral and organic carbon compounds in sediments [71,72], or between swelling component of mixed-layer clays and organic carbon in soils [73]. Therefore, the results of this study indicate that clay mineral governed the distribution of the organic component in organic–mineral complexes.
The near-surface of clay fractions within microaggregates contained more Fe(III) than the near-surface of clay fractions within macroaggregates. The Fe 2p3/2 peak position of Fe(III) peak intensity at 712.3 eV was higher in clay fractions within microaggregates than in those within macroaggregates, whereas the Fe 2p3/2 peak position of Fe(II) at 710.7 eV showed the reverse order (Figure 7). This is potentially due to adsorption of Fe(III) on negative charge sites of clay, causing the flocculation of fine particles into microaggregates [74]. Furthermore, macroaggregates exhibit greater potential for anoxic environments for Fe-reducing microbes [57,58]. When anoxic conditions are achieved, anaerobic respiration with available electron acceptors is initiated, leading to the biologically mediated reduction of Fe(III)-oxide mineral sand the formation of soluble Fe(II) [59].
The reduction of Fe(III) (oxyhydr)oxides is lowest in microaggregates due to the presence of aromatic-C interacting with Fe-oxides through strong coordination complexation and aromatic-ring-based interactions [75,76]. When compared with the macroaggregates, a higher amount of aromatic-C existed in clay fractions within the microaggregates (Table 3); the formation of Fe(III)–aromatic complexes may have restricted the reduction of Fe(III) to Fe(II). The accumulation of Fe(III) ions in the clay fraction within microaggregates may also have changed the soil surface properties and thus influenced SOC stabilization processes. Fe(III) polymerization could trap large amounts of organic matter, thus stabilizing the organic matter (especially dissolved organic C) against microbial mineralization [77,78,79]. More aromatic-C contents were found to be stabilized by higher Fe(III) in clay fractions within microaggregates, presumably through the formation of Fe(III)–aromatic complexes. Organic matter release is positively correlated with the extent of Fe(III) reduction [80]. Additionally, the reaction of Fe(III) with organic C may promote flocculation or coating phenomena, resulting in the stabilization of organic C in fine silt and clay [81].
The long-term straw incorporation significantly increased the Feo/Fed ratio in the clay fraction within aggregates (Figure 3c), indicating that organic material input could increase the Fe mineral availability [24,82]. One possible reason is that Fe in Fe oxides is likely to serve as an alternative electron acceptor for microbial respiration, resulting in the reductive dissolution of solid Fe phases under the fluctuating redox conditions that occur in paddy soils when straw is incorporated [83,84]. Subsequently, the oxidative precipitation of Fe(II) with dissolved organic compounds upon drainage of the paddy fields promoted the formation of organo–Fe complexes, which not only initialized a short-range-ordered Fe minerals but also protected organic matter from microbial degradation [85,86]. Long-term straw incorporation significantly improved the growth and activity of soil microorganisms in the rice–wheat cropping system [87], and thus accelerated the transformation of soil minerals and promoted the formation of short-range-ordered Fe minerals [88,89,90], which in turn may enhance the organo–mineral associations [82,91]. Furthermore, it has been reported that straw is decomposed by microorganisms to produce low molecular weight acids [92], which drives the transformation of minerals from well-ordered crystalline phase to short-range-ordered Fe minerals phases to form organo–Fe mineral complexes that prevent recrystallization [76]. It follows that straw incorporation induced transformation of Fe-bearing minerals in clay fractions.
The concentration of Feo/Fed ratio was positively correlated with the SOC content in the clay within aggregates (Figure 4), implying that the application of straw may facilitate the association of SOC with Fe oxides and eventually increase the content of SOC. Amorphous and poorly crystalline minerals may have greater capacity to stabilize SOC than crystalline minerals [89,93], by providing extensive surface area and complexation capacity for organic biomolecules to form metastable and intermediate complexes [94]. Organic substance coupled with the repeated redox cycles transforms Fe oxide minerals and increases their surface reactivity, which contributes to paddy soil SOC sequestration potential [82,91]. Meanwhile, Feo and Feo/Fed ratio was positively correlated with the abundance of aromatic-C (C=C) and carboxylic-C (C(O)O) in clay within aggregates (Figure 10), suggesting that the higher contents of poorly crystalline Fe minerals and Fe mineral availability promoted the selective adsorption of aromatic-C and carboxylic-C compounds in clay. Our results also confirmed the findings by Huang et al. (2018) and Kramer et al. (2012), who found that aromatic-C and carbonyl-C content increased with increasing short-range-order mineral content, and the ability of aromatic and carbonyl-rich functional groups to bind to certain soil minerals [88,95]. These aromatic structures, which are most resistant to biodegradation, were found to be occluded preferentially onto reactive, poorly crystalline Fe-oxides; this might be a major mechanism for long-term SOC sequestration in soil [12].

5. Conclusions

Long-term straw incorporation can promote clay enrichment in both macroaggregates and microaggregates. Straw incorporation increased SOC contents in clay fractions within aggregates by 27.0–86.6%. Clay concentration determined the distribution of SOC in the soil aggregates. Straw incorporation increased the concentration of poorly crystalline Fe oxide and activity of Fe oxide in clay fractions. Under straw incorporation, the relative amounts of aromatic-C (C=C) and carboxylic-C (C(O)O) in clay fractions within the aggregate-sized classes were increased. The hydroxy-interlayered vermiculite promoted the accumulation of aliphatic-C and alcohol-C in macroaggregates, whereas poorly crystalline Fe oxide and Fe mineral availability promoted the selective adsorption of aromatic-C and carboxylic-C compounds by the formation of organo–mineral complexes under straw incorporation. These findings should facilitate better understanding of the effects of clay mineral on SOC stabilization in clay fractions within macroaggregates and microaggregates under long-term straw incorporation.

Author Contributions

B.X., L.H., X.L. and J.L. supervised and designed the project; B.X. performed the experiment and collected data; R.G. and M.K. helped in data formal analysis and preparation of the manuscript; S.F. and M.K. reviewed the manuscript. All authors have read and agreed to the published version of the manuscript.

Funding

This research was funded by the National Natural Science Foundation of People’s Republic of China, grant number 41977020; the special fund for Agro-scientific Research in the Public Interest, grant number 201503123; China Agriculture Research System of MOF and MARA, grant number CARS-22 and the Natural Science Foundation of Ningxia Province, grant number 2021AAC03024.

Data Availability Statement

Not applicable.

Conflicts of Interest

The authors declare no conflict of interest.

References

  1. Lal, R. Soil carbon sequestration impacts on global climate change and food security. Science 2004, 304, 1623–1627. [Google Scholar] [CrossRef] [PubMed] [Green Version]
  2. Wiesmeier, M.; Urbanski, L.; Hobley, E.U.; Lang, B.; Kögel-Knabner, I. Soil organic carbon storage as a key function of soils—A review of drivers and indicators at various scales. Geoderma 2019, 333, 149–162. [Google Scholar] [CrossRef]
  3. Bünemann, E.K.; Bongiorno, G.; Bai, Z.; Creamer, R.E.; De Deyn, G.; de Goede, R.; Fleskens, L.; Geissen, V.; Kuyper, T.W.; Mäder, P.; et al. Soil quality—A critical review. Soil Biol. Biochem. 2018, 120, 105–125. [Google Scholar] [CrossRef]
  4. Li, N.; Long, J.; Han, X.; Yuan, Y.; Sheng, M. Molecular characterization of soil organic carbon in water-stable aggregate fractions during the early pedogenesis from parent material of mollisols. J. Soil Sediments 2020, 20, 1869–1880. [Google Scholar] [CrossRef]
  5. Mustafa, A.; Minggang, X.; Ali Shah, S.A.; Abrar, M.M.; Nan, S.; Baoren, W.; Zejiang, C.; Saeed, Q.; Naveed, M.; Mehmood, K.; et al. Soil aggregation and soil aggregate stability regulate organic carbon and nitrogen storage in a red soil of southern china. J. Environ. Manag. 2020, 270, 110894. [Google Scholar] [CrossRef]
  6. Hong, H.; Chen, S.; Fang, Q.; Algeo, T.J.; Zhao, L. Adsorption of organic matter on clay minerals in the Dajiuhu peat soil chronosequence, South China. Appl. Clay Sci. 2019, 178, 105125. [Google Scholar] [CrossRef]
  7. Angst, G.; Mueller, K.E.; Kögel-Knabner, I.; Freeman, K.H.; Mueller, C.W. Aggregation controls the stability of lignin and lipids in clay-sized particulate and mineral associated organic matter. Biogeochemistry 2017, 132, 307–324. [Google Scholar] [CrossRef]
  8. Baldock, J.A.; Skjemstad, J.O. Role of the soil matrix and minerals in protecting natural organic materials against biological attack. Org. Geochem. 2000, 31, 697–710. [Google Scholar] [CrossRef]
  9. Schmidt, M.; Torn, M.S.; Abiven, S.; Dittmar, T.; Guggenberger, G.; Janssens, I.A.; Kleber, M.; Kögel-Knabner, I.; Lehmann, J.; Manning, D. Persistence of soil organic matter as an ecosystem property. Nature 2011, 478, 49–56. [Google Scholar] [CrossRef] [Green Version]
  10. Lützow, M.; Kögel-Knabner, I.; Ekschmitt, K.; Matzner, E.; Flessa, H. Stabilization of organic matter in temperate soils: Mechanisms and their relevance under different soil conditions—A review. Eur. J. Soil Sci. 2010, 57, 426–445. [Google Scholar] [CrossRef]
  11. Saidy, A.R.; Smernik, R.J.; Baldock, J.A.; Kaiser, K.; Sanderman, J. The sorption of organic carbon onto differing clay minerals in the presence and absence of hydrous iron oxide. Geoderma 2013, 209–210, 15–21. [Google Scholar] [CrossRef]
  12. Huang, X.; Tang, H.; Kang, W.; Yu, G.; Ran, W.; Hong, J.; Shen, Q. Redox interface-associated organo-mineral interactions: A mechanism for c sequestration under a rice-wheat cropping system. Soil Biol. Biochem. 2018, 120, 12–23. [Google Scholar] [CrossRef]
  13. Wen, Y.; Liu, W.; Deng, W.; He, X.; Yu, G. Impact of agricultural fertilization practices on organo-mineral associations in four long-term field experiments: Implications for soil C sequestration. Sci. Total Environ. 2019, 651, 591–600. [Google Scholar] [CrossRef]
  14. Schrumpf, M.; Kaiser, K.; Guggenberger, G.; Persson, T.; Kögel-Knabner, I.; Schulze, E.D. Storage and stability of organic carbon in soils as related to depth, occlusion within aggregates, and attachment to minerals. Biogeosci. Disc. 2012, 9, 13085–13133. [Google Scholar] [CrossRef] [Green Version]
  15. Kleber, M.; Mikutta, R.; Torn, M.S.; Jahn, R. Poorly crystalline mineral phases protect organic matter in acid subsoil horizons. Eur. J. Soil Sci. 2005, 56, 717–725. [Google Scholar] [CrossRef]
  16. Giannetta, B.; Plaza, C.; Zaccone, C.; Vischetti, C.; Rovira, P. Ecosystem type effects on the stabilization of organic matter in soils: Combining size fractionation with sequential chemical extractions. Geoderma 2019, 353, 423–434. [Google Scholar] [CrossRef]
  17. Barré, P.; Fernandez-Ugalde, O.; Virto, I.; Velde, B.; Chenu, C. Impact of phyllosilicate mineralogy on organic carbon stabilization in soils: Incomplete knowledge and exciting prospects. Geoderma 2014, 235–236, 382–395. [Google Scholar] [CrossRef]
  18. Singh, M.; Sarkar, B.; Sarkar, S.; Churchman, J.; Beerling, D.J. Stabilization of soil organic carbon as influenced by clay mineralogy. Adv. Agron. 2017, 148, 33–84. [Google Scholar]
  19. Wilson, L.; Patey, I. The influence of individual clay minerals on formation damage of reservoir sandstones: A critical review with some new insights. Clay Miner. 2018, 49, 147–164. [Google Scholar] [CrossRef]
  20. Powers, J.S.; Corre, M.; Twine, T.E.; Veldkamp, E. Geographic bias of field observations of soil carbon stocks with tropical land-use changes precludes spatial extrapolation. Proc. Natl. Acad. Sci. USA 2011, 108, 6318–6322. [Google Scholar] [CrossRef] [Green Version]
  21. Basile-Doelsch, I.; Amundson, R.; Stone, W.E.E.; Masiello, C.A.; Bottero, J.Y.; Colin, F.; Masin, F.; Borschneck, D.; Meunier, J.D. Mineralogical control of organic carbon dynamics in a volcanic ash soil on La Reunion. Eur. J. Soil Sci. 2005, 56, 689–703. [Google Scholar] [CrossRef]
  22. Saidy, A.R.; Smernik, R.J.; Baldock, J.A.; Kaiser, K.; Sanderman, J.; Macdonald, L.M. Effects of clay mineralogy and hydrous iron oxides on labile organic carbon stabilisation. Geoderma 2012, 173–174, 104–110. [Google Scholar] [CrossRef]
  23. Das, R.; Purakayastha, T.J.; Das, D.; Ahmed, N.; Kumar, R.; Biswas, S.; Walia, S.S.; Singh, R.; Shukla, V.K.; Yadava, M.S.; et al. Long-term fertilization and manuring with different organics alter stability of carbon in colloidal organo-mineral fraction in soils of varying clay mineralogy. Sci. Total Environ. 2019, 684, 682–693. [Google Scholar] [CrossRef] [PubMed]
  24. Huang, X.; Jiang, H.; Li, Y.; Ma, Y.; Tang, H.; Ran, W.; Shen, Q. The role of poorly crystalline iron oxides in the stability of soil aggregate-associated organic carbon in a rice–wheat cropping system. Geoderma 2016, 279, 1–10. [Google Scholar] [CrossRef]
  25. Ping, W.; Wang, J.; Hui, Z.; Yue, D.; Zhang, Y. The role of iron oxides in the preservation of soil organic matter under long-term fertilization. J. Soil Sediments 2019, 19, 588–598. [Google Scholar]
  26. Eusterhues, K.; Rumpel, C.; Kögel-Knabner, I. Stabilization of soil organic matter isolated via oxidative degradation. Org. Geochem. 2005, 36, 1567–1575. [Google Scholar] [CrossRef]
  27. Kaiser, K.; Guggenberger, G. Sorptive stabilization of organic matter by microporous goethite: Sorption into small pores vs. Surface complexation. Eur. J. Soil Sci. 2007, 58, 45–59. [Google Scholar] [CrossRef]
  28. Tipping, E. The adsorption of aquatic humic substances by iron oxides. Geochim. Cosmochim. Acta 1981, 45, 191–199. [Google Scholar] [CrossRef]
  29. Souza, I.F.; Archanjo, B.S.; Hurtarte, L.C.C.; Oliveros, M.E.; Gouvea, C.P.; Lidizio, L.R.; Achete, C.A.; Schaefer, C.E.R.; Silva, I.R. Al-/Fe-(hydr)oxides–organic carbon associations in oxisols—From ecosystems to submicron scales. Catena 2017, 154, 63–72. [Google Scholar] [CrossRef]
  30. Xue, B.; Huang, L.; Huang, Y.; Kubar, K.A.; Lu, J. Straw management influences the stabilization of organic carbon by fe (oxyhydr)oxides in soil aggregates. Geoderma 2020, 358, 113987. [Google Scholar] [CrossRef]
  31. Adhikari, D.; Yang, Y. Selective stabilization of aliphatic organic carbon by iron oxide. Sci. Rep. 2015, 5, 11214. [Google Scholar] [CrossRef] [PubMed] [Green Version]
  32. Zhao, C.; Zhang, Y.; Liu, X.; Ma, X.; Meng, Y.; Li, X.; Quan, X.; Shan, J.; Zhao, W.; Wang, H. Comparing the effects of biochar and straw amendment on soil carbon pools and bacterial community structure in degraded soil. J. Soil Sci. Plant Nutr. 2019, 20, 751–760. [Google Scholar] [CrossRef]
  33. Zhao, X.; Virk, A.L.; Ma, S.T.; Kan, Z.R.; Qi, J.Y.; Pu, C.; Yang, X.G.; Zhang, H.L. Dynamics in soil organic carbon of wheat-maize dominant cropping system in the north china plain under tillage and residue management. J. Environ. Manag. 2020, 265, 110549. [Google Scholar] [CrossRef] [PubMed]
  34. Chen, S.; Yang, P.; Zhang, Y.; Dong, W.; Hu, C.; Oenema, O. Responses of cereal yields and soil carbon sequestration to four long-term tillage practices in the North China plain. Agronomy 2022, 12, 176. [Google Scholar] [CrossRef]
  35. Sun, Q.; Meng, J.; Sarkar, B.; Lan, Y.; Lin, L.; Li, H.; Yang, X.; Yang, T.; Chen, W.; Wang, H. Long-term influence of maize stover and its derived biochar on soil structure and organo-mineral complexes in Northeast China. Environ. Sci. Pollut. Res. Int. 2020, 27, 28374–28383. [Google Scholar] [CrossRef]
  36. Kubar, K.A.; Huang, L.; Lu, J.; Li, X.; Xue, B.; Yin, Z. Long-term tillage and straw returning effects on organic c fractions and chemical composition of soc in rice-rape cropping system. Arch. Agron. Soil Sci. 2018, 65, 125–137. [Google Scholar] [CrossRef]
  37. Xue, B.; Huang, L.; Huang, Y.; Yin, Z.; Li, X.; Lu, J. Effects of organic carbon and iron oxides on soil aggregate stability under different tillage systems in a rice–rape cropping system. Catena 2019, 177, 1–12. [Google Scholar] [CrossRef]
  38. Elliott, E.T. Aggregate structure and carbon nitrogen and phosphorus in native and cultivated soils. Soil Sci. Soc. Am. J. 1986, 50, 627–633. [Google Scholar] [CrossRef]
  39. Fernández-Ugalde, O.; Barré, P.; Hubert, F.; Virto, I.; Girardin, C.; Ferrage, E.; Caner, L.; Chenu, C. Clay mineralogy differs qualitatively in aggregate-size classes: Clay-mineral-based evidence for aggregate hierarchy in temperate soils. Eur. J. Soil Sci. 2013, 64, 410–422. [Google Scholar] [CrossRef]
  40. Walkley, A.J.; Black, I.A. An examination of the degtjareff method for determining soil organic matter, and a proposed modification of the chromic acid titration method. Soil Sci. 1934, 37, 29–38. [Google Scholar] [CrossRef]
  41. Lalonde, K.; Mucci, A.; Ouellet, A.; Gélinas, Y. Preservation of organic matter in sediments promoted by iron. Nature 2012, 483, 198–200. [Google Scholar] [CrossRef] [PubMed] [Green Version]
  42. McKeague, J.A.; Day, J.H. Dithionite- and oxalate-extractable Fe and al as aids in differentiating various classes of soils. Can. J. Soil Sci. 1966, 46, 13–22. [Google Scholar] [CrossRef]
  43. Mehra, O.P.; Jackson, M.L. Iron oxide removal from soils and clays by a dithionite-citrate system buffered with sodium bicarbonate. Clay Miner. 1960, 7, 317–327. [Google Scholar] [CrossRef]
  44. Jackson, M.L. Soil Chemical Analysis—Advanced Course: A Manual of Methods Useful for Instruction and Research in Soil Chemistry, Physical Chemistry of Soils, Soil Fertility and Soil Genesis; Department of Soil Sciences, University of Wisconsin: Madison, WI, USA, 1979. [Google Scholar]
  45. Zhang, Z.Y.; Huang, L.; Liu, F.; Wang, M.K.; Fu, Q.L.; Zhu, J. Characteristics of clay minerals in soil particles of two Alfisols in China. Appl. Clay Sci. 2016, 120, 51–60. [Google Scholar] [CrossRef]
  46. Bailey, S.; Brindely, G.; Brown, G. Crystal structures of clay minerals and their X-ray identification. Earth-Sci. Rev. 1980, 18, 84–85. [Google Scholar]
  47. Szymański, W. Chemistry and spectroscopic properties of surface horizons of arctic soils under different types of tundra vegetation—A case study from the fuglebergsletta coastal plain (SW spitsbergen). Catena 2017, 156, 325–337. [Google Scholar] [CrossRef]
  48. Zhu, F.; Li, Y.; Xue, S.; Hartley, W.; Wu, H. Effects of iron-aluminium oxides and organic carbon on aggregate stability of bauxite residues. Environ. Sci. Pollut. Res. Int. 2016, 23, 9073–9081. [Google Scholar] [CrossRef]
  49. Ferguson, G.S.; Whitesides, G.M. Thermal reconstruction of the functionalized interface of polyethylene carboxylic acid and its derivatives. In Modern Approaches to Wettability; Springer: Boston, MA, USA, 1992; pp. 143–177. [Google Scholar]
  50. Dengis, P.B.; Gerin, P.A.; Rouxhet, P.G. X-ray photoelectron spectroscopy analysis of biosurfaces: Examination of performances with yeast cells and related model compounds. Colloid Surf. B 1995, 4, 199–211. [Google Scholar] [CrossRef]
  51. Zhao, Q.; Adhikari, D.; Huang, R.; Patel, A.; Wang, X.; Tang, Y.; Obrist, D.; Roden, E.E.; Yang, Y. Coupled dynamics of iron and iron-bound organic carbon in forest soils during anaerobic reduction. Chem. Geol. 2016, 464, 118–126. [Google Scholar] [CrossRef]
  52. Gentsch, N.; Mikutta, R.; Shibistova, O.; Wild, B.; Schnecker, J.; Richter, A.; Urich, T.; Gittel, A.; Šantrůčková, H.; Bárta, J. Properties and bioavailability of particulate and mineral-associated organic matter in Arctic permafrost soils, Lower Kolyma Region, Russia. Eur. J. Soil Sci. 2015, 66, 722–734. [Google Scholar] [CrossRef]
  53. Wilson, D.; Langell, M. Xps analysis of oleylamine/oleic acid capped Fe3O4 nanoparticles as a function of temperature. Appl. Surf. Sci. 2014, 303, 6–13. [Google Scholar] [CrossRef]
  54. Mikutta, R.; Schaumann, G.E.; Gildemeister, D.; Bonneville, S.; Kramer, M.G.; Chorover, J.; Chadwick, O.A.; Guggenberger, G. Biogeochemistry of mineral–organic associations across a long-term mineralogical soil gradient (0.3–4100kyr), Hawaiian islands. Geochim. Cosmochim. Acta 2009, 73, 2034–2060. [Google Scholar] [CrossRef]
  55. Fu, H.; Zhang, H.; Sui, Y.; Hu, N.; Ding, D.; Ye, Y.; Li, G.; Wang, Y.; Dai, Z. Transformation of uranium species in soil during redox oscillations. Chemosphere 2018, 208, 846–853. [Google Scholar] [CrossRef] [PubMed]
  56. Xu, H.; Sun, Y.; Li, J.; Li, F.; Guan, X. Aging of zerovalent iron in synthetic groundwater: X-ray photoelectron spectroscopy depth profiling characterization and depassivation with uniform magnetic field. Environ. Sci. Technol. 2016, 50, 8214. [Google Scholar] [CrossRef] [PubMed]
  57. Reeve, J.R.; Schadt, C.W.; Carpenterboggs, L.; Kang, S.; Zhou, J.; Reganold, J.P. Effects of soil type and farm management on soil ecological functional genes and microbial activities. ISME J. 2010, 4, 1099. [Google Scholar] [CrossRef] [PubMed] [Green Version]
  58. Zhang, X.; Xin, X.; Zhu, A.; Yang, W.; Zhang, J.; Ding, S.; Lan, M.; Shao, L. Linking macroaggregation to soil microbial community and organic carbon accumulation under different tillage and residue managements. Soil Tillage Res. 2018, 178, 99–107. [Google Scholar] [CrossRef]
  59. Mejia, J.; Roden, E.E.; Ginder-Vogel, M.A. Influence of oxygen and nitrate on Fe (hydr)oxide mineral transformation and soil microbial communities during redox cycling. Environ. Sci. Technol. 2016, 50, 3580–3588. [Google Scholar] [CrossRef] [Green Version]
  60. Hergert, H.L. Infrared spectra of lignin and related compounds. II. Conifer lignin and model compounds 1, 2. J. Org. Chem. 1960, 25, 405–413. [Google Scholar] [CrossRef]
  61. Artz, R.R.E.; Chapman, S.J.; Robertson, A.H.J.; Potts, J.M.; Laggoun-Défarge, F.; Gogo, S.; Comont, L.; Disnar, J.R.; Francez, A.J. FTIR spectroscopy can be used as a screening tool for organic matter quality in regenerating cutover peatlands. Soil Biol. Biochem. 2008, 40, 515–527. [Google Scholar] [CrossRef]
  62. Mao, J.; Fang, X.; Schmidt-Rohr, K.; Carmo, A.M.; Hundal, L.S.; Thompson, M.L. Molecular-scale heterogeneity of humic acid in particle-size fractions of two Iowa soils. Geoderma 2007, 140, 17–29. [Google Scholar] [CrossRef]
  63. Chen, X.; Xu, Y.; Gao, H.J.; Mao, J.; Chu, W.; Thompson, M.L. Biochemical stabilization of soil organic matter in straw-amended, anaerobic and aerobic soils. Sci. Total Environ. 2018, 625, 1065–1073. [Google Scholar] [CrossRef] [PubMed]
  64. Madari, B.E.; Reeves, J.B.; Machado, P.L.O.A.; Guimaraes, C.M.; Torres, E. Mid-and near-infrared spectroscopic assessment of soil compositional parameters and structural indices in two Ferralsols. Geoderma 2006, 136, 245–259. [Google Scholar] [CrossRef]
  65. Parker, F.S. Applications of Infrared Spectroscopy in Biochemistry, Biology, and Medicine; Springer: Boston, MA, USA, 1971. [Google Scholar]
  66. Peltre, C.; Bruun, S.; Du, C.; Thomsen, I.K.; Jensen, L.S. Assessing soil constituents and labile soil organic carbon by Mid-infrared photoacoustic spectroscopy. Soil Biol. Biochem. 2014, 77, 41–50. [Google Scholar] [CrossRef]
  67. Russell, J.D. Infrared methods. In A Hand Book of Determinative Methods in Clay Mineralogy; Wilson, M.J., Ed.; Blackie and Son Ltd.: New York, NY, USA, 1987. [Google Scholar]
  68. He, Z.; Lin, H.; Hao, J.; Kong, X.; Tian, K.; Bei, Z.; Tian, X. Impact of vermiculite on ammonia emissions and organic matter decomposition of food waste during composting. Bioresour. Technol. 2018, 263, 548–554. [Google Scholar] [CrossRef] [PubMed]
  69. Lanson, B.; Ferrage, E.; Hubert, F.; Prêt, D.; Ranger, J. Experimental aluminization of vermiculite interlayers: An X-ray diffraction perspective on crystal chemistry and structural mechanisms. Geoderma 2015, 249–250, 28–39. [Google Scholar] [CrossRef]
  70. Sutton, R.; Sposito, G. Molecular simulation of humic substance–Ca-montmorillonite complexes. Geochim. Cosmochim. Acta 2006, 70, 3566–3581. [Google Scholar] [CrossRef]
  71. Berthonneau, J.; Grauby, O.; Abuhaikal, M.; Pellenq, R.J.M.; Ulm, F.J.; Van Damme, H. Evolution of organo-clay composites with respect to thermal maturity in type ii organic-rich source rocks. Geochim. Cosmochim. Acta 2016, 195, 68–83. [Google Scholar] [CrossRef]
  72. Kennedy, M.J.; Pevear, D.R.; Hill, R.J. Mineral surface control of organic carbon in black shale. Science 2002, 295, 657–660. [Google Scholar] [CrossRef] [Green Version]
  73. Skiba, M.; Szczerba, M.; Skiba, S.; Bish, D.L.; Grybos, M. The nature of interlayering in clays from a podzol (spodosol) from the tatra mountains, poland. Geoderma 2011, 160, 425–433. [Google Scholar] [CrossRef]
  74. Shanmuganathan, R.T.; Oades, J.M. Modification of soil physical properties by manipulating the net surface charge on colloids through addition of Fe(III) polycations. J. Soil Sci. 1982, 33, 451–465. [Google Scholar] [CrossRef]
  75. Duckworth, O.W.; Martin, S.T. Surface complexation and dissolution of hematite by C1-C6 dicarboxylic acids at pH= 5.0. Geochim. Cosmochim. Acta 2001, 65, 4289–4301. [Google Scholar] [CrossRef]
  76. Keiluweit, M.; Bougoure, J.J.; Nico, P.S.; Pett-Ridge, J.; Weber, P.K.; Kleber, M. Mineral protection of soil carbon counteracted by root exudates. Nat. Clim. Change 2015, 5, 588–595. [Google Scholar] [CrossRef]
  77. Chen, C.; Dynes, J.J.; Wang, J.; Sparks, D.L. Properties of Fe-organic matter associations via coprecipitation versus adsorption. Environ. Sci. Technol. 2014, 48, 13751–13759. [Google Scholar] [CrossRef] [PubMed]
  78. Riedel, T.; Zak, D.; Biester, H.; Dittmar, T. Iron traps terrestrially derived dissolved organic matter at redox interfaces. Proc. Natl. Acad. Sci. USA 2013, 110, 10101–10105. [Google Scholar] [CrossRef] [PubMed] [Green Version]
  79. Sodano, M.; Said-Pullicino, D.; Fiori, A.F.; Catoni, M.; Martin, M.; Celi, L. Sorption of paddy soil-derived dissolved organic matter on hydrous iron oxide–vermiculite mineral phases. Geoderma 2016, 261, 169–177. [Google Scholar] [CrossRef]
  80. Zhang, J.; Dong, H.; Zeng, Q.; Agrawal, A. The role of Fe(III) bioreduction by methanogens in the preservation of organic matter in smectite. Chem. Geol. 2014, 389, 16–28. [Google Scholar] [CrossRef] [Green Version]
  81. Giannetta, B.; Zaccone, C.; Plaza, C.; Siebecker, M.G.; Rovira, P.; Vischetti, C.; Sparks, D.L. The role of Fe(III) in soil organic matter stabilization in two size fractions having opposite features. Sci. Total Environ. 2019, 653, 667–674. [Google Scholar] [CrossRef]
  82. Huang, X.; Feng, C.; Zhao, G.; Ding, M.; Kang, W.; Yu, G.; Ran, W.; Shen, Q. Carbon sequestration potential promoted by oxalate extractable iron oxides through organic fertilization. Soil Sci. Soc. Am. J. 2017, 81, 1359–1370. [Google Scholar] [CrossRef] [Green Version]
  83. Bonneville, S.; Van Cappellen, P.; Behrends, T. Microbial reduction of iron(III) oxyhydroxides: Effects of mineral solubility and availability. Chem. Geol. 2004, 212, 255–268. [Google Scholar] [CrossRef]
  84. Frenzel, P.; Bosse, U.; Janssen, P.H. Rice roots and methanogenesis in a paddy soil: Ferric iron as an alternative electron acceptor in the rooted soil. Soil Biol. Biochem. 1999, 31, 421–430. [Google Scholar] [CrossRef]
  85. Ginn, B.; Meile, C.; Wilmoth, J.; Tang, Y.; Thompson, A. Rapid iron reduction rates are stimulated by high-amplitude redox fluctuations in a tropical forest soil. Environ. Sci. Technol. 2017, 51, 3250–3259. [Google Scholar] [CrossRef] [PubMed]
  86. Yu, G.; Xiao, J.; Hu, S.; Polizzotto, M.L.; Zhao, F.; Mcgrath, S.P.; Li, H.; Ran, W.; Shen, Q. Mineral availability as a key regulator of soil carbon storage. Environ. Sci. Technol. 2017, 51, 4960–4969. [Google Scholar] [CrossRef] [PubMed]
  87. Zhao, J.; Tian, N.; Yong, L.; Xiong, W.; Ran, W. Responses of bacterial communities in arable soils in a rice-wheat cropping system to different fertilizer regimes and sampling times. PLoS ONE 2014, 9, e85301. [Google Scholar] [CrossRef] [PubMed]
  88. Kramer, M.G.; Sanderman, J.; Chadwick, O.A.; Chorover, J.; Vitousek, P.M. Long-term carbon storage through retention of dissolved aromatic acids by reactive particles in soil. Glob. Change Biol. 2012, 18, 2594–2605. [Google Scholar] [CrossRef]
  89. Torn, M.S.; Trumbore, S.E.; Chadwick, O.A.; Vitousek, P.M.; Hendricks, D.M. Mineral control of soil organic carbon storage and turnover. Nature 1997, 389, 170–173. [Google Scholar] [CrossRef]
  90. Xiao, J.; Wen, Y.; Li, H.; Hao, J.; Shen, Q.; Ran, W.; Mei, X.; He, X.; Yu, G. In situ visualisation and characterisation of the capacity of highly reactive minerals to preserve soil organic matter (som) in colloids at submicron scale. Chemosphere 2015, 138, 225–232. [Google Scholar] [CrossRef]
  91. Wissing, L.; Kölbl, A.; Häusler, W.; Schad, P.; Cao, Z.H.; Kögel-Knabner, I. Management-induced organic carbon accumulation in paddy soils: The role of organo-mineral associations. Soil Tillage Res. 2013, 126, 60–71. [Google Scholar] [CrossRef]
  92. Kumari, A.; Kapoor, K.K.; Kundu, B.S.; Mehta, R.K. Identification of organic acids produced during rice straw decomposition and their role in rock phosphate solubilization. Plant Soil Environ. 2008, 54, 72–77. [Google Scholar] [CrossRef] [Green Version]
  93. Paul, S.; Flessa, H.; Veldkamp, E.; López-Ulloa, M. Stabilization of recent soil carbon in the humid tropics following land use changes: Evidence from aggregate fractionation and stable isotope analyses. Biogeochemistry 2008, 87, 247–263. [Google Scholar] [CrossRef] [Green Version]
  94. Berhe, A.A.; Suttle, K.B.; Burton, S.D.; Banfield, J.F. Contingency in the direction and mechanics of soil organic matter responses to increased rainfall. Plant Soil. 2012, 358, 371–383. [Google Scholar] [CrossRef]
  95. Han, L.; Sun, K.; Keiluweit, M.; Yang, Y.; Yang, Y.; Jin, J.; Sun, H.; Wu, F.; Xing, B. Mobilization of ferrihydrite-associated organic carbon during fe reduction: Adsorption versus coprecipitation. Chem. Geol. 2019, 503, 61–68. [Google Scholar] [CrossRef]
Figure 1. Schema about the fractionation of soil aggregates and extraction of clay fractions (<2 µm) within aggregates. Macroaggregates (Macro, >250 μm), microaggregates (Micro, 53–250 μm), and silt+clay fractions (Silt+clay, <53 μm).
Agronomy 12 00534 g001
Figure 2. The clay content (a) and organic carbon contents in clay fractions (b) within aggregates under the conventional tillage without straw (T) and conventional tillage with straw incorporation (TS). Macroaggregates: >250 μm; microaggregates: 53–250 μm; silt+clay: <53 μm. Values are means ± SE, n = 3. Different capital and lowercase letters indicate significant differences between different aggregate fractions for the same treatment and between different treatments for the same aggregate fraction, respectively, at p < 0.05 according to Duncan’s multiple range test.
Agronomy 12 00534 g002
Figure 3. The Fed (a) and Feo (b) concentration and Feo/Fed ratio (c) in clay fractions within aggregate-sized classes under the conventional tillage without straw (T) and conventional tillage with straw incorporation (TS). Macroaggregates > 250 μm; microaggregates: 53–250 μm; silt+clay: <53 μm. Values are means ± SE, n = 3. Different capital and lowercase letters indicate significant differences between different aggregate fractions for the same treatment and between different treatments for the same aggregate fraction, respectively, at p < 0.05 according to Duncan’s multiple range test.
Agronomy 12 00534 g003
Figure 4. Correlation between Feo/Fed ratio and SOC concentration in the clay within aggregates.
Agronomy 12 00534 g004
Figure 5. X-ray diffraction spectra of minerals for clay fractions within macroaggregates (>250 μm) and microaggregates (53–250 μm) using a powder specimen slide of soil under the conventional tillage without straw (T) and conventional tillage with straw incorporation (TS). Q—quartz; Go—goethite; K—kaolinite; I—illite; H—hematite; V— vermiculite; HIV—hydroxy-interlayered vermiculite.
Agronomy 12 00534 g005
Figure 6. X-ray diffraction spectra of minerals for clay fractions within macroaggregates (>250 μm) and microaggregates (53–250 μm) using an oriented specimen slide of soil under the conventional tillage without straw (T) and conventional tillage with straw incorporation (TS). V—vermiculite; I—illite; K—kaolinite; Q—quartz; HIV—hydroxy-interlayered vermiculite; (a) T, macroaggregates; (b) T, microaggregates; (c) TS, macroaggregates; (d) TS, microaggregates.
Agronomy 12 00534 g006
Figure 7. High-resolution XPS spectrum of Fe for clay fractions within macroaggregates (>250 μm) and microaggregates (53–250 μm) of soil under the conventional tillage without straw (T) and conventional tillage with straw incorporation (TS). (a) T, macroaggregates; (b) T, microaggregates; (c) TS, macroaggregates; (d) TS, microaggregates.
Agronomy 12 00534 g007
Figure 8. Fourier transform infrared (FTIR) spectra of clay within macroaggregates (>250 μm) and microaggregates (53–250 μm). T—straw removed; TS—straw incorporation.
Agronomy 12 00534 g008
Figure 9. C 1s X-ray photoelectron spectroscopy (XPS) peak-fitting spectra of clay fractions within macroaggregates (>250 μm) and microaggregates (53–250 μm) of soil under the conventional tillage without straw (T) and conventional tillage with straw incorporation (TS). (a) T, macroaggregates; (b) T, microaggregates; (c) TS, macroaggregates; (d) TS, microaggregates.
Agronomy 12 00534 g009
Figure 10. Pearson correlation coefficients between the relative percentages of clay minerals, Fe (oxyhydr)oxides and different organic functional groups in clay fractions within aggregates. n = 4, * Correlation is significant at p < 0.05.
Agronomy 12 00534 g010
Table 1. Quantitative estimation (%) of minerals in the clay size fraction.
TreatmentsSizes (μm)HIVVermiculiteIlliteKaolinite
TMacroaggregates
>250
30.64.111.853.6
Microaggregates
53–250
13.717.214.654.6
TSMacroaggregates
>250
13.321.610.055.2
Microaggregates
53–250
10.419.312.857.5
T—straw removed; TS—straw incorporation; HIV—hydroxy-interlayered vermiculite.
Table 2. Percentage of total peak intensities at selected wavenumbers from FTIR spectra.
TreatmentsSize (μm)Fraction of Total Peak Intensities at Selected Wavenumbers, cm−1 (%)
Phenolics-C
3619 cm1
Alkanes-C
2923+2853 cm1
Aromatic-C
1637 cm1
Carboxylic-C
1400 cm1
Polysaccharides-C
1090 cm1
Silicate Minerals
1032 cm1
TMacroaggregates
>250
8.82 5.14 3.65 1.51 28.72 52.16
Microaggregates
53–250
8.99 4.16 2.94 1.22 27.97 54.72
TSMacroaggregates
>250
8.71 4.21 3.94 1.81 28.91 52.43
Microaggregates53
–250
8.87 3.85 3.24 0.72 28.11 55.22
T—straw removed; TS—straw incorporation.
Table 3. The relative percentages (%) of different organic functional groups at clay fractions using X-ray photoelectron spectroscopy (XPS).
TreatmentsSize (μm)C=CC–C/C–HC–OC=O/C(O)NC(O)O
TMacroaggregates
>250
23.830.826.011.58.01
Microaggregates
53–250
25.523.218.922.310.1
TSMacroaggregates
>250
31.718.215.218.316.6
Microaggregates
53–250
39.515.515.018.012.0
T—straw removed; TS—straw incorporation.
Publisher’s Note: MDPI stays neutral with regard to jurisdictional claims in published maps and institutional affiliations.

