Article

Dual Response Optimization of Ultrasound-Assisted Oil Extraction from Red Fruit (Pandanus conoideus): Recovery and Total Phenolic Compounds

by
Endah Prasetia Susanti
1,2,
Abdul Rohman
3 and
Widiastuti Setyaningsih
1,*
1
Department of Food and Agricultural Product Technology, Faculty of Agricultural Technology, Gadjah Mada University, Jalan Flora, Bulaksumur, Sleman, Yogyakarta 55281, Indonesia
2
National Agency of Drug and Food Control, Jalan Otonom, District of Abepura, Jayapura 99225, Indonesia
3
Center of Excellence, Institute for Halal Industry and Systems (PUI-PT IHIS), Gadjah Mada University, Jalan Sekip Utara, Senolowo, Sleman, Yogyakarta 55281, Indonesia
*
Author to whom correspondence should be addressed.
Agronomy 2022, 12(2), 523; https://doi.org/10.3390/agronomy12020523
Submission received: 22 January 2022 / Revised: 15 February 2022 / Accepted: 17 February 2022 / Published: 19 February 2022
(This article belongs to the Special Issue Extraction and Analysis of Bioactive Compounds in Crops)

Abstract

:
Red fruit oil (RFO) is a high-value oil that contains functional compounds, mainly phenolic compounds, providing antioxidant activity. Therefore, an optimal extraction method is essential to recover the RFO and phenolic compounds simultaneously. This research aimed to optimize the ultrasound-assisted extraction (UAE) for oil from red fruit using the Box-Behnken design combined with response surface methodology. The studied UAE factors, including sample-to-solvent ratio (1:3, 1:2, and 1:1 g mL−1), extraction temperature (60, 75, and 90 °C), and pulse duty-cycle (0.20, 0.50, and 0.80 s−1). Analysis of variance revealed that the three studied factors significantly influenced the recovered RFO, while the level of total phenolic compounds in the extracts was defined merely by extraction temperature (p < 0.05). These significant factors were then included in the optimization models (R2 > 0.99, lack-of-fit p > 0.05). The proposed UAE setting by the multiresponse optimization was an extraction temperature of 67 °C, a pulse duty-cycle of 0.50 s−1, and a sample-to-solvent ratio of 1:2.5 g mL−1. Subsequently, the extraction kinetic was evaluated, confirming full recovery at 60 min of extraction time. The developed method was then applied to extract six red fruit clones. Mbarugum clones provided high RFO recovery (9.60%), with an uppermost total phenolic compound of (42.63 mg GAE g−1) among the six red fruit clones. Additionally, the resulting RFO showed eminent antioxidant activities, indicated by excellent values of IC50 DPPH (37.69 mg L−1), IC50 FIC (30.43 mg L−1), FRAP reducing power (63.55 mg AAEA g−1), and IC50 ABTS (93.88 mg L−1). In contrast with a wet rendering method, UAE enhanced the RFO recovery by 53.02%, resulting in a higher level of total phenolic compounds. Henceforth, the proposed UAE method is a promising technique to substitute conventional oil production in the food and pharmaceutical industries.

1. Introduction

Red fruit oil (RFO) is extracted from the drupe of Pandanus conoideus, which is a plant native to Papua province, Republic of Indonesia and Papua New Guinea [1,2]. RFO is valuable due to its nutritional and functional constituents, which expose intense natural antioxidants, including phenolic compounds [3]. As primary antioxidants, the compounds aid in protecting body cells from free radical damage to prevent oxidative stress and play an essential role in preventing various diseases, such as heart disease, diabetes, and cancer [2,4]. A previous studies report, the red fruit extract exhibits a strong scavenge DPPH radical with an IC50 value ranging from 5.25 to 53.47 mg L−1. This value is mainly due to the phenolic compounds in the red fruit extract, which contribute 64.5% of free DPPH radical scavenging [5]. Moreover, as RFO receives a higher price in the retail market over some oils extracted from sunflower and palm fruit, it is expected that the RFO will provide further benefits related to the antioxidant activity of phenolic compounds contained in the oil. Hence, it is necessary to evaluate the contributing factors that affect the level of phenolic compounds in RFO throughout the extraction procedure.
Various extraction methods have been reported for the extraction of RFO. In addition to mechanical extraction, wet and dry rendering are the conventional approaches used to produce RFO. Nevertheless, the current extraction method exerts low recovery, with a limited level of phenolic compounds. Mechanical extraction by pressing the drupe of red fruit allows the oil to remain in the matrix, thus leading to a low recovery (7.30% extracted oil from the fruit) [6]. In contrast, wet and dry rendering permits the degradation of the phenolic compounds by oxidation or hydrolysis due to the application of high temperature (≥103 °C) in addition to time-consuming (80 min) extraction [7,8]. In previous reports on bio-oil extractions, a higher temperature and prolonged extraction time contributed to the deterioration of the phenolic compounds and decreased the antioxidant activity of the resulting oils [9,10,11]. Traditionally, water is employed as the extraction solvent by the local RFO producer. Attempts to enhance the recovered oil and phenolic compounds have used an organic solvent, viz., ethyl acetate; however, the resulting oil may contain residual organic compounds [1].
To overcome the drawbacks mentioned above, a new approach in oil production is needed, an extraction method that requires lower temperature, a safer solvent, and shorter extraction times. Some extraction techniques appeared as potential alternative methods, such as microwave-assisted extraction (MAE), pressurized liquid extraction (PLE), and ultrasound-assisted extraction (UAE). Among these techniques, UAE seems to be the most suitable for extracting oil containing high phenolic compounds from red fruit, as a moderate temperature is applied. Additionally, UAE has been proven successful in extracting phenolic-rich oil from radish seed [12], Moringa peregrina seed [9], Cannabis sativa seed [10], and olive [13].
In keeping with the stability of the phenolic compounds in question, some extraction factors also influence the oil recovery, i.e., the technique used, solvent composition, extraction time, and temperature [14]. In addition, as the UAE method features cavitation, leading to breaking of the cell walls and accelerating the extraction process [15,16,17], the duty-pulse cycle that defines the release of cavitation could affect the extraction recovery. Therefore, to obtain the optimum extraction process that may provide production cost efficiency, the influencing UAE variables can be evaluated using the Box-Behnken design (BBD) and optimized by Response Surface Methodology (RSM).
Henceforth, this study applied BBD in conjunction with RSM to optimize UAE variables for recovering RFO that contains high total phenolic compounds (TPC) from red fruit. Moreover, UAE kinetics were studied to determine the optimum extraction time. Finally, the optimized method was subsequently used to extract phenolic-rich oil in six clones of red fruit samples.

2. Materials and Methods

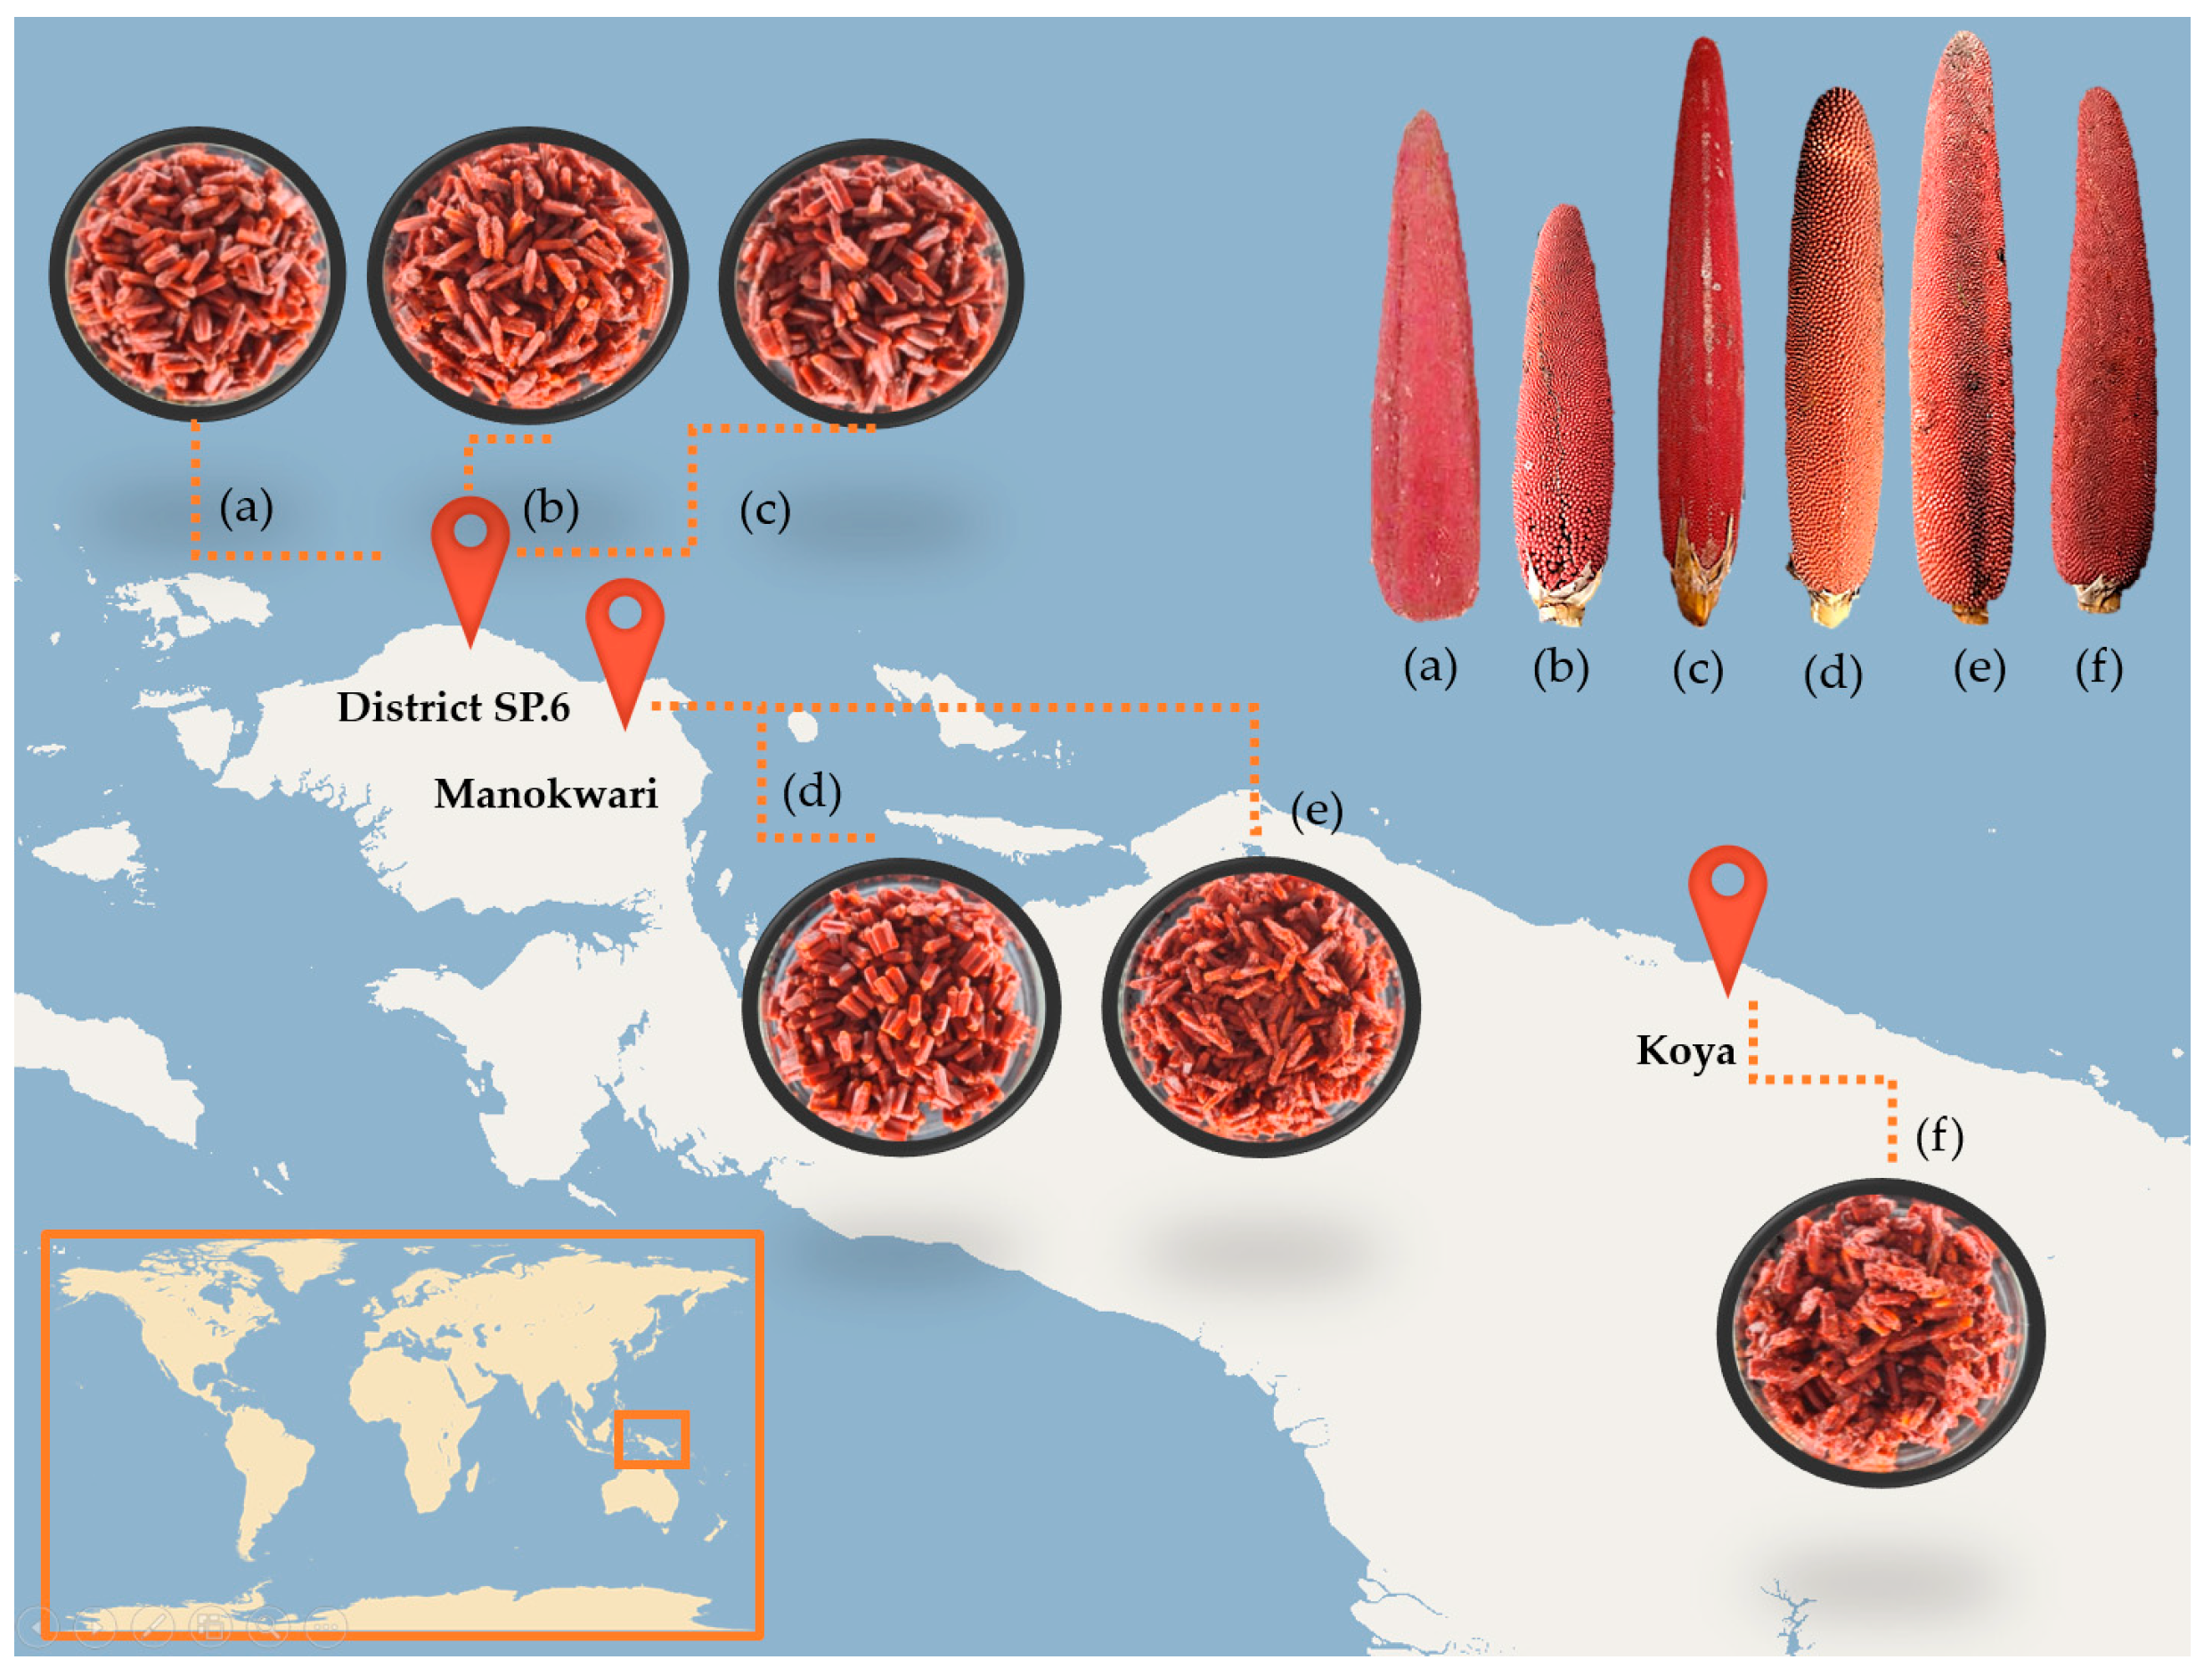
2.1. Red Fruit Samples

The Mbarugum clone red fruit from Jayapura, Papua Province, was used for the method development. For the method application, samples of five freshly harvested clones of red fruit were collected from Manokwari, West Papua Province, Indonesia (Figure 1), including Monsor, Monsrus, Memeri, Menjib Rumbai, and Edewewits clones. The red fruit was harvested seven months after pollination. Before the extraction, the red fruit was peeled to separate the drupe from the pedicel; then, the drupe was stored in a freezer at −20 °C until further use.

2.2. Ultrasound-Assisted Extraction (UAE)

The equipment used for the UAE experiments was the UP200St ultrasonic device (Hielscher, Teltow, Germany), with a probe of 7 mm diameter. The ultrasound waves were applied at 200 W, 24 kHz, with a 100% available power setting. At the same time, the other UAE factors were varied based on the design of experiments (DOE). The temperature of the UAE process was controlled utilizing a Frigiterm J.P. water bath (Selecta, Barcelona, Spain), which can operate in the range of −10 to 100 °C. The drupe of red fruit was accurately weighed (10 g) and poured into a 50 mL polypropylene tube, with water as the extraction solvent, at a ratio sample-to-solvent (1:3, 1:2, and 1:1) corresponding to the DOE. Once the extraction was completed (60 min), the oil was separated from water and solid material using a centrifuge (DLAB Scientific DM0636, Rowland, NC, USA) running at 3000 rpm for 15 min. The RFO was then evaporated in a rotary evaporator (IKA, Stauten, Germany) at 40 °C to completely remove the extraction solvent. The resulting RFO as the extraction yield was calculated using the following equation:
Yield   ( % ) = mass   oil   extract   ( g ) mass   of   fresh   weight   drupe   ( g )   ×   100

2.3. Wet Rendering Method

The drupe of red fruit was extracted based on the typical procedure of wet rendering performed by oil industries in Papua, Indonesia. The sample was weighed (10 g) and transferred into a 100 mL glass beaker filled with 20 mL water. The mixture was then heated at 103 °C for 20 min and filtered. The seeds were retained in the filter, while the remaining pulp was reheated at 103 °C for 60 min [7,8]. After the extraction process, the RFO was separated from the water and solid residues by centrifuge (DLAB Scientific DM0636: City of Industry, CA, USA) at 3000 rpm for 15 min [6]. The extract was evaporated in a rotary evaporator (IKA: Staufen im Breisgau, Germany) at 40 °C to obtain pure RFO.

2.4. Determination of Total Phenolic Compounds (TPC)

The total phenolic compounds (TPC) of RFO were quantified by spectrophotometer UV-Vis Genesys-10S (Thermo Scientific: Waltham, MA, USA). The measurement was performed by adding 0.4 mL of 7.5% Folin-Ciocalteu (Merck: Darmstadt, Germany) to a 0.2 mL oil sample solution. The mixture was allowed to stand for 5–8 min. Subsequently, 4 mL of 7% Na2CO3 (Merck, Darmstadt, Germany) was added, and the mixture volume was adjusted to 10 mL by water. The resulting solution was incubated for 2 h at room temperature in the absence of light. After the incubation, the sample absorbance was measured by a spectrophotometer at 725 nm [3,5]. A measurement of a blank sample was conducted with the same procedure. Gallic acid from Sigma-Aldrich (Steinheim, Germany) was used as the standard compound. The calibration curve for gallic acid ( y = 0.1075 x 0.1358 ) was built based on 9 observations of a series concentration ranging from 2 to 18 mg L−1, with the coefficient of determination (R2) higher than 0.99. The TPC result was expressed as mg of Gallic acid equivalents per gram of sample (mg GAE g−1). All the experiments were done in duplicate.

2.5. Antioxidant Assays

The antioxidant activity of RFO obtained from the six clones of red fruit extracted under the optimal conditions was evaluated using four antioxidant assays, i.e., 2,2-diphenyl-1-picrylhydrazyl (DPPH)-radical scavenging activity (RSA), metal ion chelating (FIC), ferric reducing antioxidant power (FRAP), and 2,2′-Azino-Bis-3-Ethylben zothiazoline-6-Sulfonic Acid (ABTS) assays.

2.5.1. 2,2-Diphenyl-1-picrylhydrazyl (DPPH)-Radical Scavenging Activity (RSA) Assays

DPPH-RSA was measured by adding 1.0 mL of 0.4 mM DPPH solution (Sigma-Aldrich, Steinheim, Germany) to 50 µL diluted RFO in methanol (30, 60, 90, 120, and 150 μg L−1). The mixture solution was then adjusted with methanol to 5 mL. Afterward, the solution was homogenized and left to stand for 30 min at ambient temperature without light. After the incubation, the sample absorbance was measured by a spectrophotometer at 517 nm [5,18]. A measurement of a blank sample was conducted with the same procedure. The calibration curves of Trolox (Merck, Darmstadt, Germany) and ascorbic acid (Sigma-Aldrich, Steinheim, Germany), as positive controls, were prepared over a concentration ranging from 1 to 10 mg L−1, with a high coefficient of determination (R2 > 0.999) for both Trolox ( y = 8.5747 x 4.1615 ) and ascorbic acid ( y = 6.5745 x 1.1750 ). The radical scavenging activity was expressed as the radical scavenging percentage, calculated as shown below:
DPPH-RSA ( % ) = (   1 As Ac   )   ×   100
where As is the absorbance of the sample and Ac is the absorbance of the blank sample.
The antioxidant activity was also evaluated by measuring the DPPH-IC50. The IC50 value is the concentration of sample required to scavenge 50% of DPPH free radicals and was calculated from the plotted graph of radical scavenging activity against the concentration of RFO. The analysis was performed in duplicate, and the results were expressed in mg L−1.

2.5.2. Metal Ion-Chelating Assay

Ferrous ion-chelating (FIC) activity was assessed by adding 50 µL of 2 mM FeCl2 (Merck: Darmstadt, Germany) and 200 µL of 5 mM Ferrozine reagent (Sigma-Aldrich: Steinheim, Germany) to 1 mL RFO in ethanol (30, 60, 90, 120, and 150 μg L−1). The solution was then adjusted to 5 mL with water (Ikapharmindo: Jakarta Timur, Indonesia) and was homogenized. The incubation was performed for 10 min at ambient temperature without light. The sample absorbance was measured by a spectrophotometer at 562 nm [5,19]. A blank sample was measured with the same procedure. EDTA (2–60 mg L−1) from Merck (Darmstadt, Germany) was used to build the calibration curve ( y = 1.1208 x + 24.4739 , R2 = 0.9981). The ability of the antioxidant compounds in the oil sample to chelate the ferrous ions was calculated using the following equation:
Chelating   activity   ( % ) = (   1 As Ac   )   ×   100
where As is the absorbance of the RFO and Ac is the absorbance of the blank sample.
The IC50 value was calculated based on the plotted graph of chelating activity against the concentration of RFO. The analysis was performed in duplicate, and the results were expressed in mg L−1, indicating the concentration of the sample required to chelate 50% of ferrous iron-Ferrozine.

2.5.3. FRAP-Ferric Reducing Antioxidant Power Assay

FRAP reducing power (RP) measurements were performed by adding 0.5 mL of phosphate buffer (200 mM; pH 6.6) from Merck (Darmstadt, Germany) and 0.5 mL of potassium ferricyanide 1% reagent (Merck: Darmstadt, Germany) to the 20 µL diluted RFO in ethanol (3 g L−1) and then incubating at 50 °C in a water bath for 20 min. Subsequently, to the mixture solution was added 0.5 mL of 10% trichloroacetic acid (Sigma-Aldrich: Steinheim, Germany), and it centrifuged at 3000 rpm for 10 min. The resulting supernatant (1 mL) was mixed with 1 mL water and 0.2 mL of 0.1% FeCl3·6H2O (Merck: Darmstadt, Germany). The incubation was performed for 10 min at ambient temperature without light. The sample absorbance was measured by a spectrophotometer at 700 nm [5,20]. Ascorbic acid was used as the standard compound. The calibration curve ( y = 0.9689 x + 3.5606 , R2 = 0.9987) was prepared over a concentration ranging from 5 to 100 mg L−1. The reduction power by antioxidant compounds in the sample, as compared to the standard compound, was calculated using the equation shown below:
FRAP-RP ( % ) = [ 1   (   1 As Ac   ) ]   ×   100
where As is the absorbance of the oil sample and Ac is the absorbance of the standard solution at the maximum studied concentration. Reduction power was expressed as mg ascorbic acid equivalent antioxidant capacity per gram of sample (mg AAEA g−1). The measurements were performed in duplicate.

2.5.4. ABTS Assay

The reagents of 7.6 mM ABTS (Sigma-Aldrich: Steinheim, Germany) and 2.6 mM potassium persulfate (1:1), purchased from Merck (Darmstadt, Germany), were mixed and placed in the darkroom for 12−16 h. ABTS radical scavenging activity was measured by adding 1 mL of the mixed reagent to 0.5 mL diluted RFO in ethanol (0.15, 0.3, 0.6, 0.9, and 1.5 mg L−1). The solution was then adjusted to 5 mL and was homogenized. The incubation was performed for 10 min in a dark room at room temperature. The sample absorbance was measured by a spectrophotometer at 734 nm [21,22]. A blank sample was prepared with the same procedure. Linearity of the standard compounds over a calibration range of 10–100 mg L−1 was achieved with high coefficients of determination (R2 > 0.999) for both Trolox ( y = 0.6158 x + 37.4590 ) and ascorbic acid ( y = 0.6285 x + 35.1678 ). The radical scavenging activity was calculated as shown below:
ABTS-RSA ( % ) = (   1 As Ac   )   ×   100
where As is the absorbance of the oil sample and Ac is the absorbance of the blank. ABTS-IC50 was analyzed in duplicate. The IC50 value is the concentration of the sample (mg L−1) required to scavenge 50% of ABTS free radicals and was calculated from the plotted graph of radical scavenging activity against the concentration of RFO.

2.6. Experimental Design

The Box-Behnken design (BBD) was used to evaluate the effects of the extraction variables on the multiresponse: yield and TPC in RFO extraction. Three independent factors, including extraction temperature (A), pulse-duty cycle (B), and sample-to-solvent ratio (C), each one considered at three levels, were studied. Table 1 includes the design levels of the independent factors.
The full BBD comprised 16 extractions that were performed randomly in duplicate (Table 2). The data resulting from yield determination and TPC analyses of the oil were used to develop a mathematical model, where the response was to fit the following second-order polynomial function:
y = β 0 + i = 1 k β i x i + i = 1 k β i i x i 2 + i = 1 k 1 j = 2 k β i j x i x j + ε
where x i , x j , ,   x k are the UAE factors that influence the extraction efficiency,   y ; β 0 ,   β i i   ( i = 1 ,   2 ,   ,   k ) ,   β i j   ( i = 1 , 2 ,   ,   k ; j = 1 ,   2 ,   , k ) are unknown parameters;   ε   is a random error. The least-square method was used to estimate the β coefficients, while only second-order interactions were considered.

2.7. Statistical Analysis

Response Surface Methodology was performed by STATGRAPHICS Centurion XVII (Statpoint Technologies, Inc.: Warrenton, VA, USA) to optimize the UAE process, obtaining maximum extraction yield and TPC level. Analysis of variance (ANOVA, p < 0.05) was used to determine the significance of the differences between the means. In those cases where ANOVA would point at a particularly significant difference, a Least Significant Difference (LSD, p < 0.05) test was applied to verify differences between means.

3. Results and Discussion

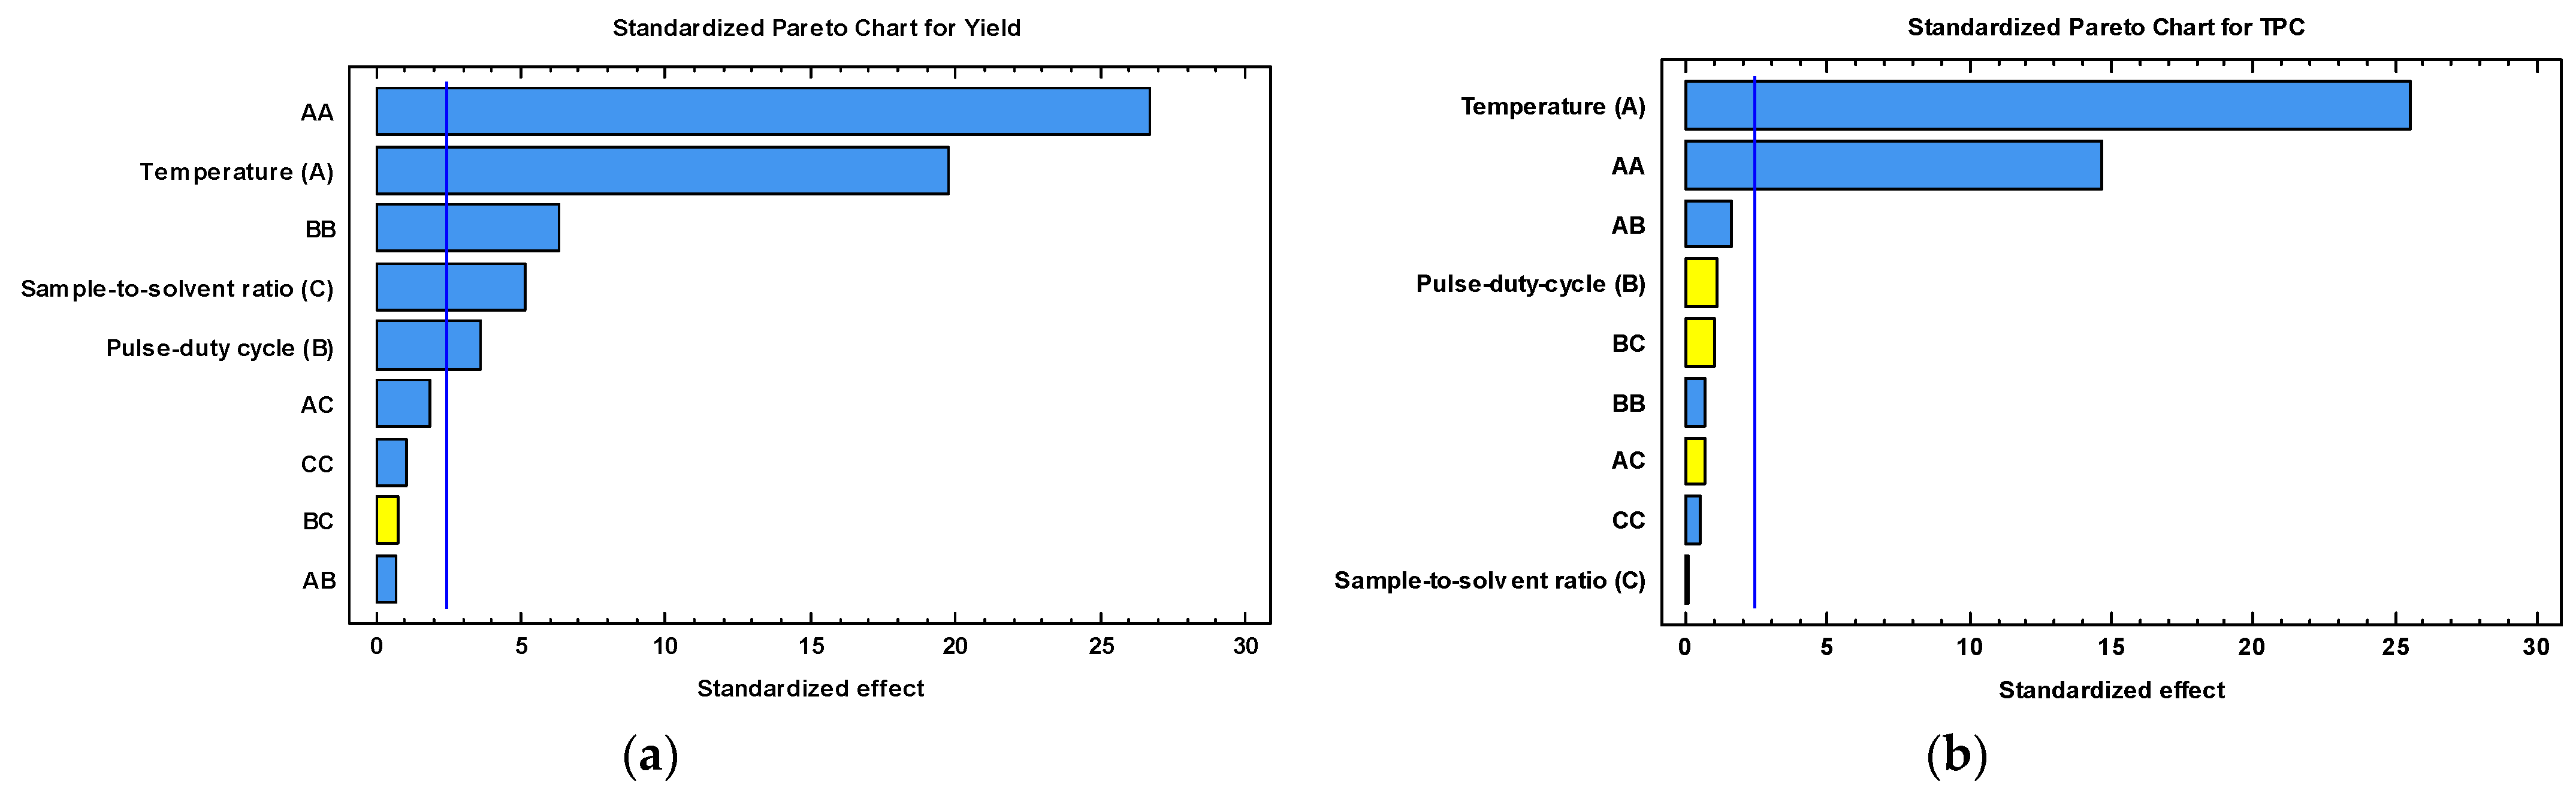
3.1. Optimization of the UAE Method

A Box-Behnken design with 16 experimental runs covering the combinations of the three studied factors was carried out. ANOVA was calculated to determine the statistical significance effects of the studied factors. The standardized effects in descending order of importance are plotted in the Pareto chart (Figure 2). A bar crossing the vertical line indicates the factor or combination of factors that significantly influences the responses.
Based on the results shown in the Pareto chart (Figure 2), significant effects and pathways for optimizing the extraction factors were identified. All the main effects of extraction temperature (A), pulse-duty cycle (B), and sample-to-solvent ratio (C) significantly influenced (p < 0.05) the RFO recovery. Additionally, the quadratic effects of extraction temperature (AA) and pulse-duty cycle (BB) also determined the yield of extracted RFO. However, the effects of interaction between the studied factors (AB, AC, and BC) and the quadratic effects of the pulse-duty cycle (CC) did not significantly influence the extraction yield (p > 0.05). Meanwhile, the TPC levels in the extracted RFO were only regulated (p < 0.05) by the main (A) and quadratic (AA) effects of the extraction temperature.
As the extraction temperature had a negative effect, the increase in the temperature of UAE resulted in a lower extraction yield and TPC (Figure 2). At mild temperatures (~50 °C), plant tissues soften and reduce the cell wall resistance, leading to hydrolysis of bonds between phenolic compounds and cellular components (phenol–polysaccharide) [10,23]. As a result, the solubility of phenolic compounds increases, and higher phenolic content could be extracted. However, when the higher temperature (over 75 °C) was applied, the disintegration of cell walls occurred faster, leading to the loss of thermolabile compounds [24,25].
Significant main (B) and quadratic (BB) effects were also observed for the pulse-duty cycle on the RFO recovery by UAE (p < 0.05). Both effects negatively influenced the extraction yield; hence, the higher the pulse-duty cycle, the lower the RFO recovery (Figure 2a). The pulse-duty cycle sets the ultrasonic waves to break down cells; thus, the extraction solvent could penetrate the cell. This occurrence strengthens the transferred mass because a perfect contact between subject and solvent was achieved [26]. As a result, the oil is easily released from the red fruit matrix, and the yield of RFO is improved. However, at a pulse-duty cycle of 0.80 s−1, the extraction yield decreases because the cavitation is too high, forming an oil in water (O/W) emulsion. The size of oil droplets is smaller during the ultrasound process, which endorses the formation of the O/W emulsion [27].
The sample-to-solvent ratio (C) also contributed negatively to the yield of RFO. The higher the volume of the solvent, the lower the value of the ratio, resulting in a higher yield of the extracted RFO. Water was used as the extraction solvent following the traditional practices by the local RFO producers. The use of water as a green extraction solvent has tremendous benefits, because water is not only inexpensive but also environmentally benign and non-toxic. In addition, the presence of water allows an effective softening of the cell wall and drupe swelling, which further increases the porosity in the matrix for oil to release [28].
In order to obtain the best setting for the studied extraction variables, dual response optimization was performed, with a target of maximizing both RFO yield and the level of TPC in the extract. The aforementioned significant factors were then included in the optimization models.

3.2. Prediction Capability of Regression Model

The RSM results were estimated based on the experimental design generated by BBD, to produce a regression model for each response. These mathematical models were established using only the significant variables to obtain appropriate predictive equations for each response. The resulting equations for the optimization of the UAE process are expressed as follows:
Yield (%) = −46.21 + 1.52A + 0.06B + 2.25C − 0.01A2 − 0.0006B2
TPC (mg GAE g−1) = −63.27 + 3.16A − 0.02A2
where A is the temperature, B is the pulse-duty cycle, and C represents a sample-to-solvent ratio.
The coefficient of determination (R2) of the models was above 0.993, confirming that the model had an excellent fit with the experimental variables. Additionally, the lack-of-fit tested by ANOVA produced values greater than 0.05 for both models, showing the suitability of response data with the models at a 95.0% confidence level [29]. Hence, the models can be used to predict the RFO recovery and TPC levels during the optimization of the UAE factors.

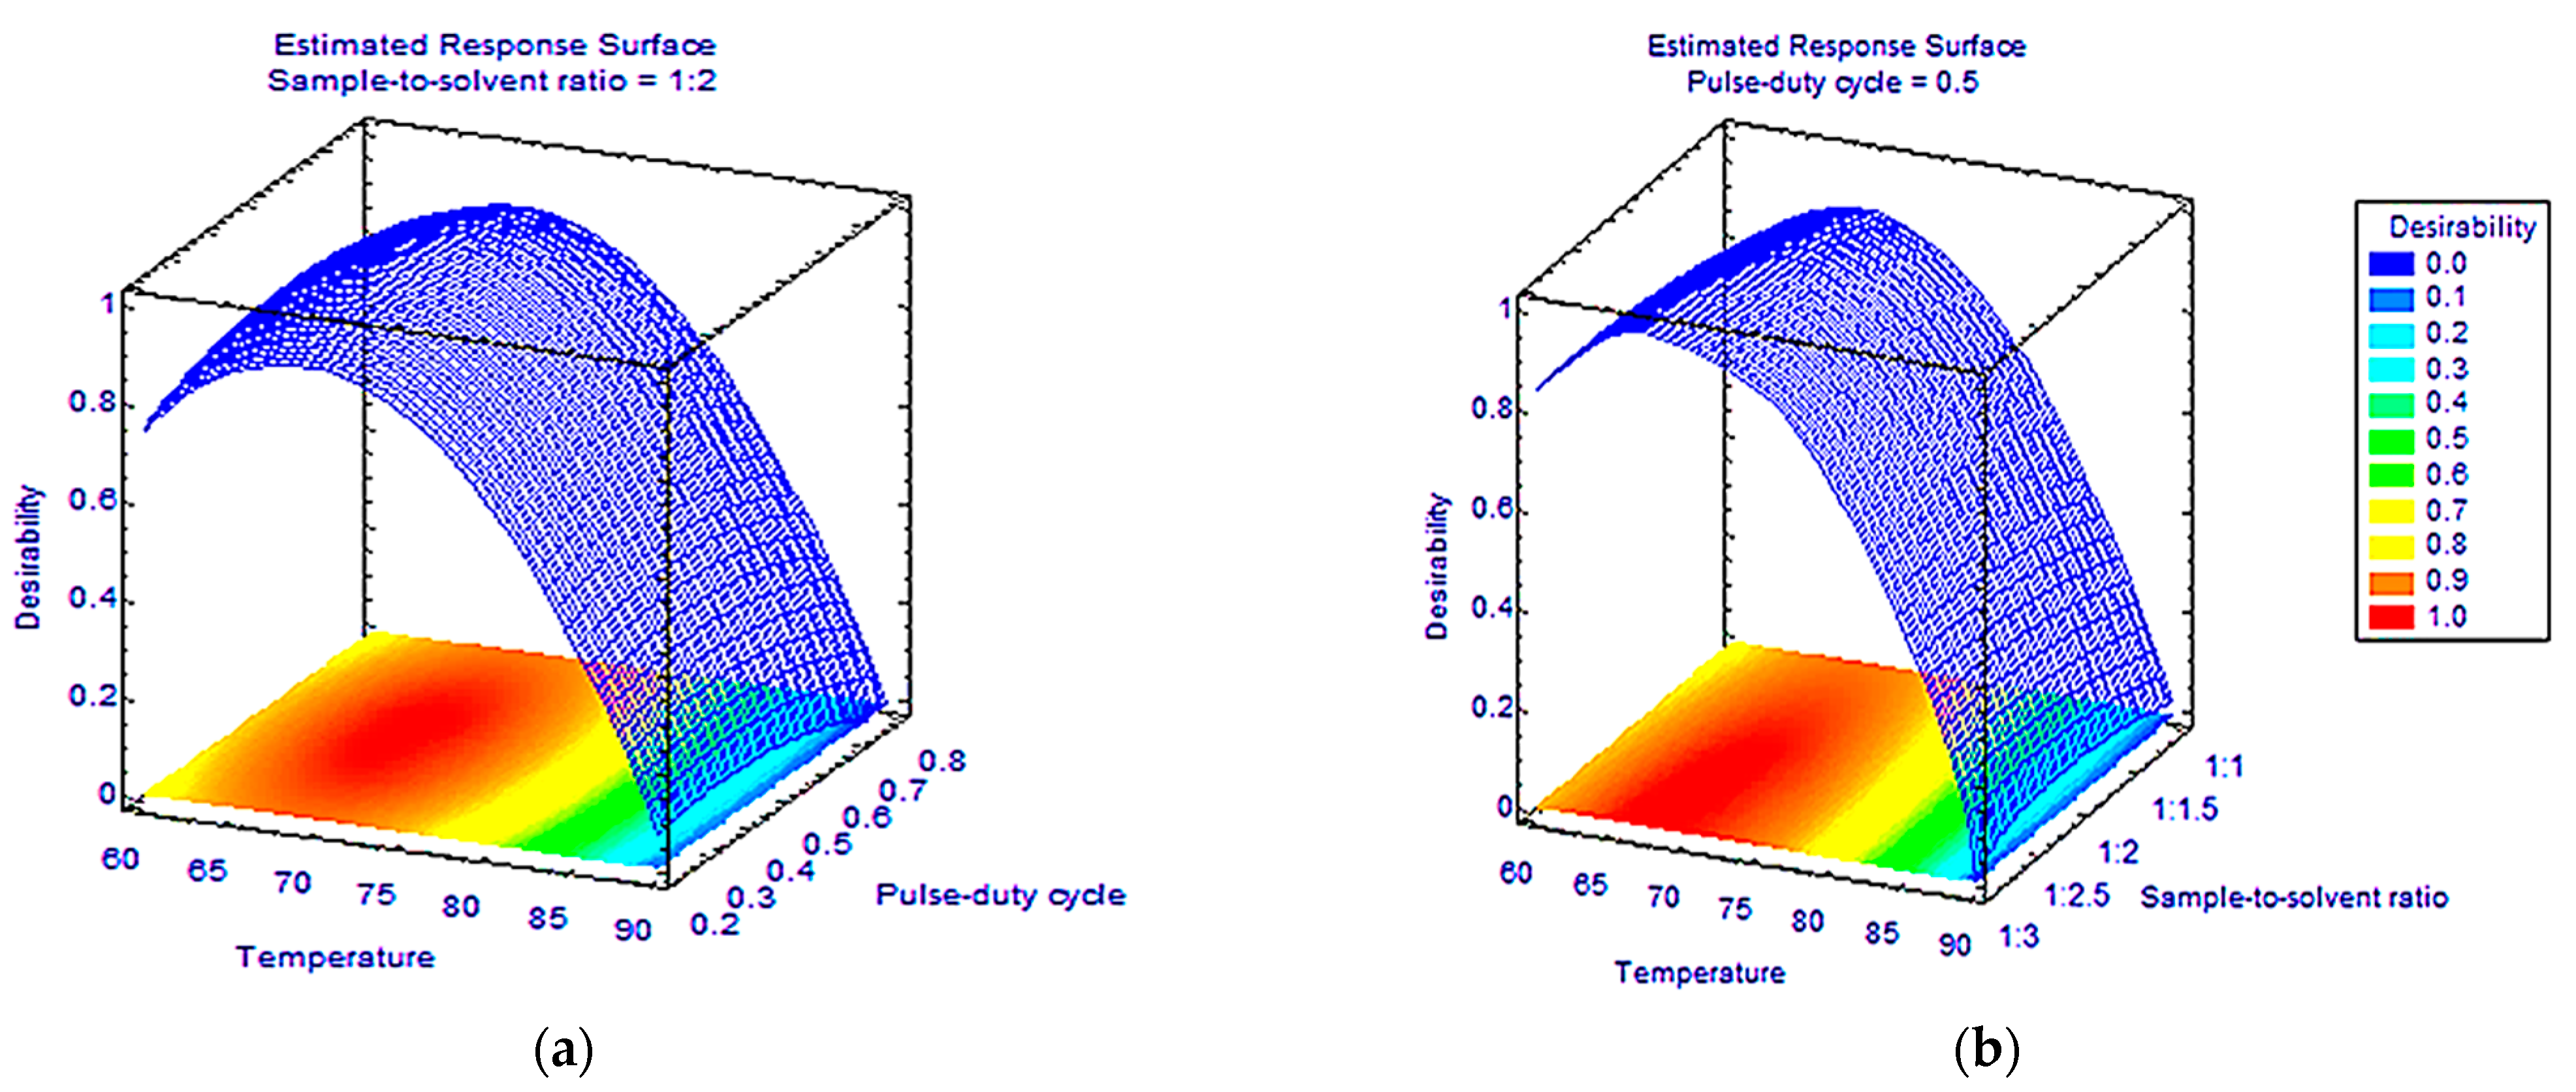
3.3. Dual Response Optimization
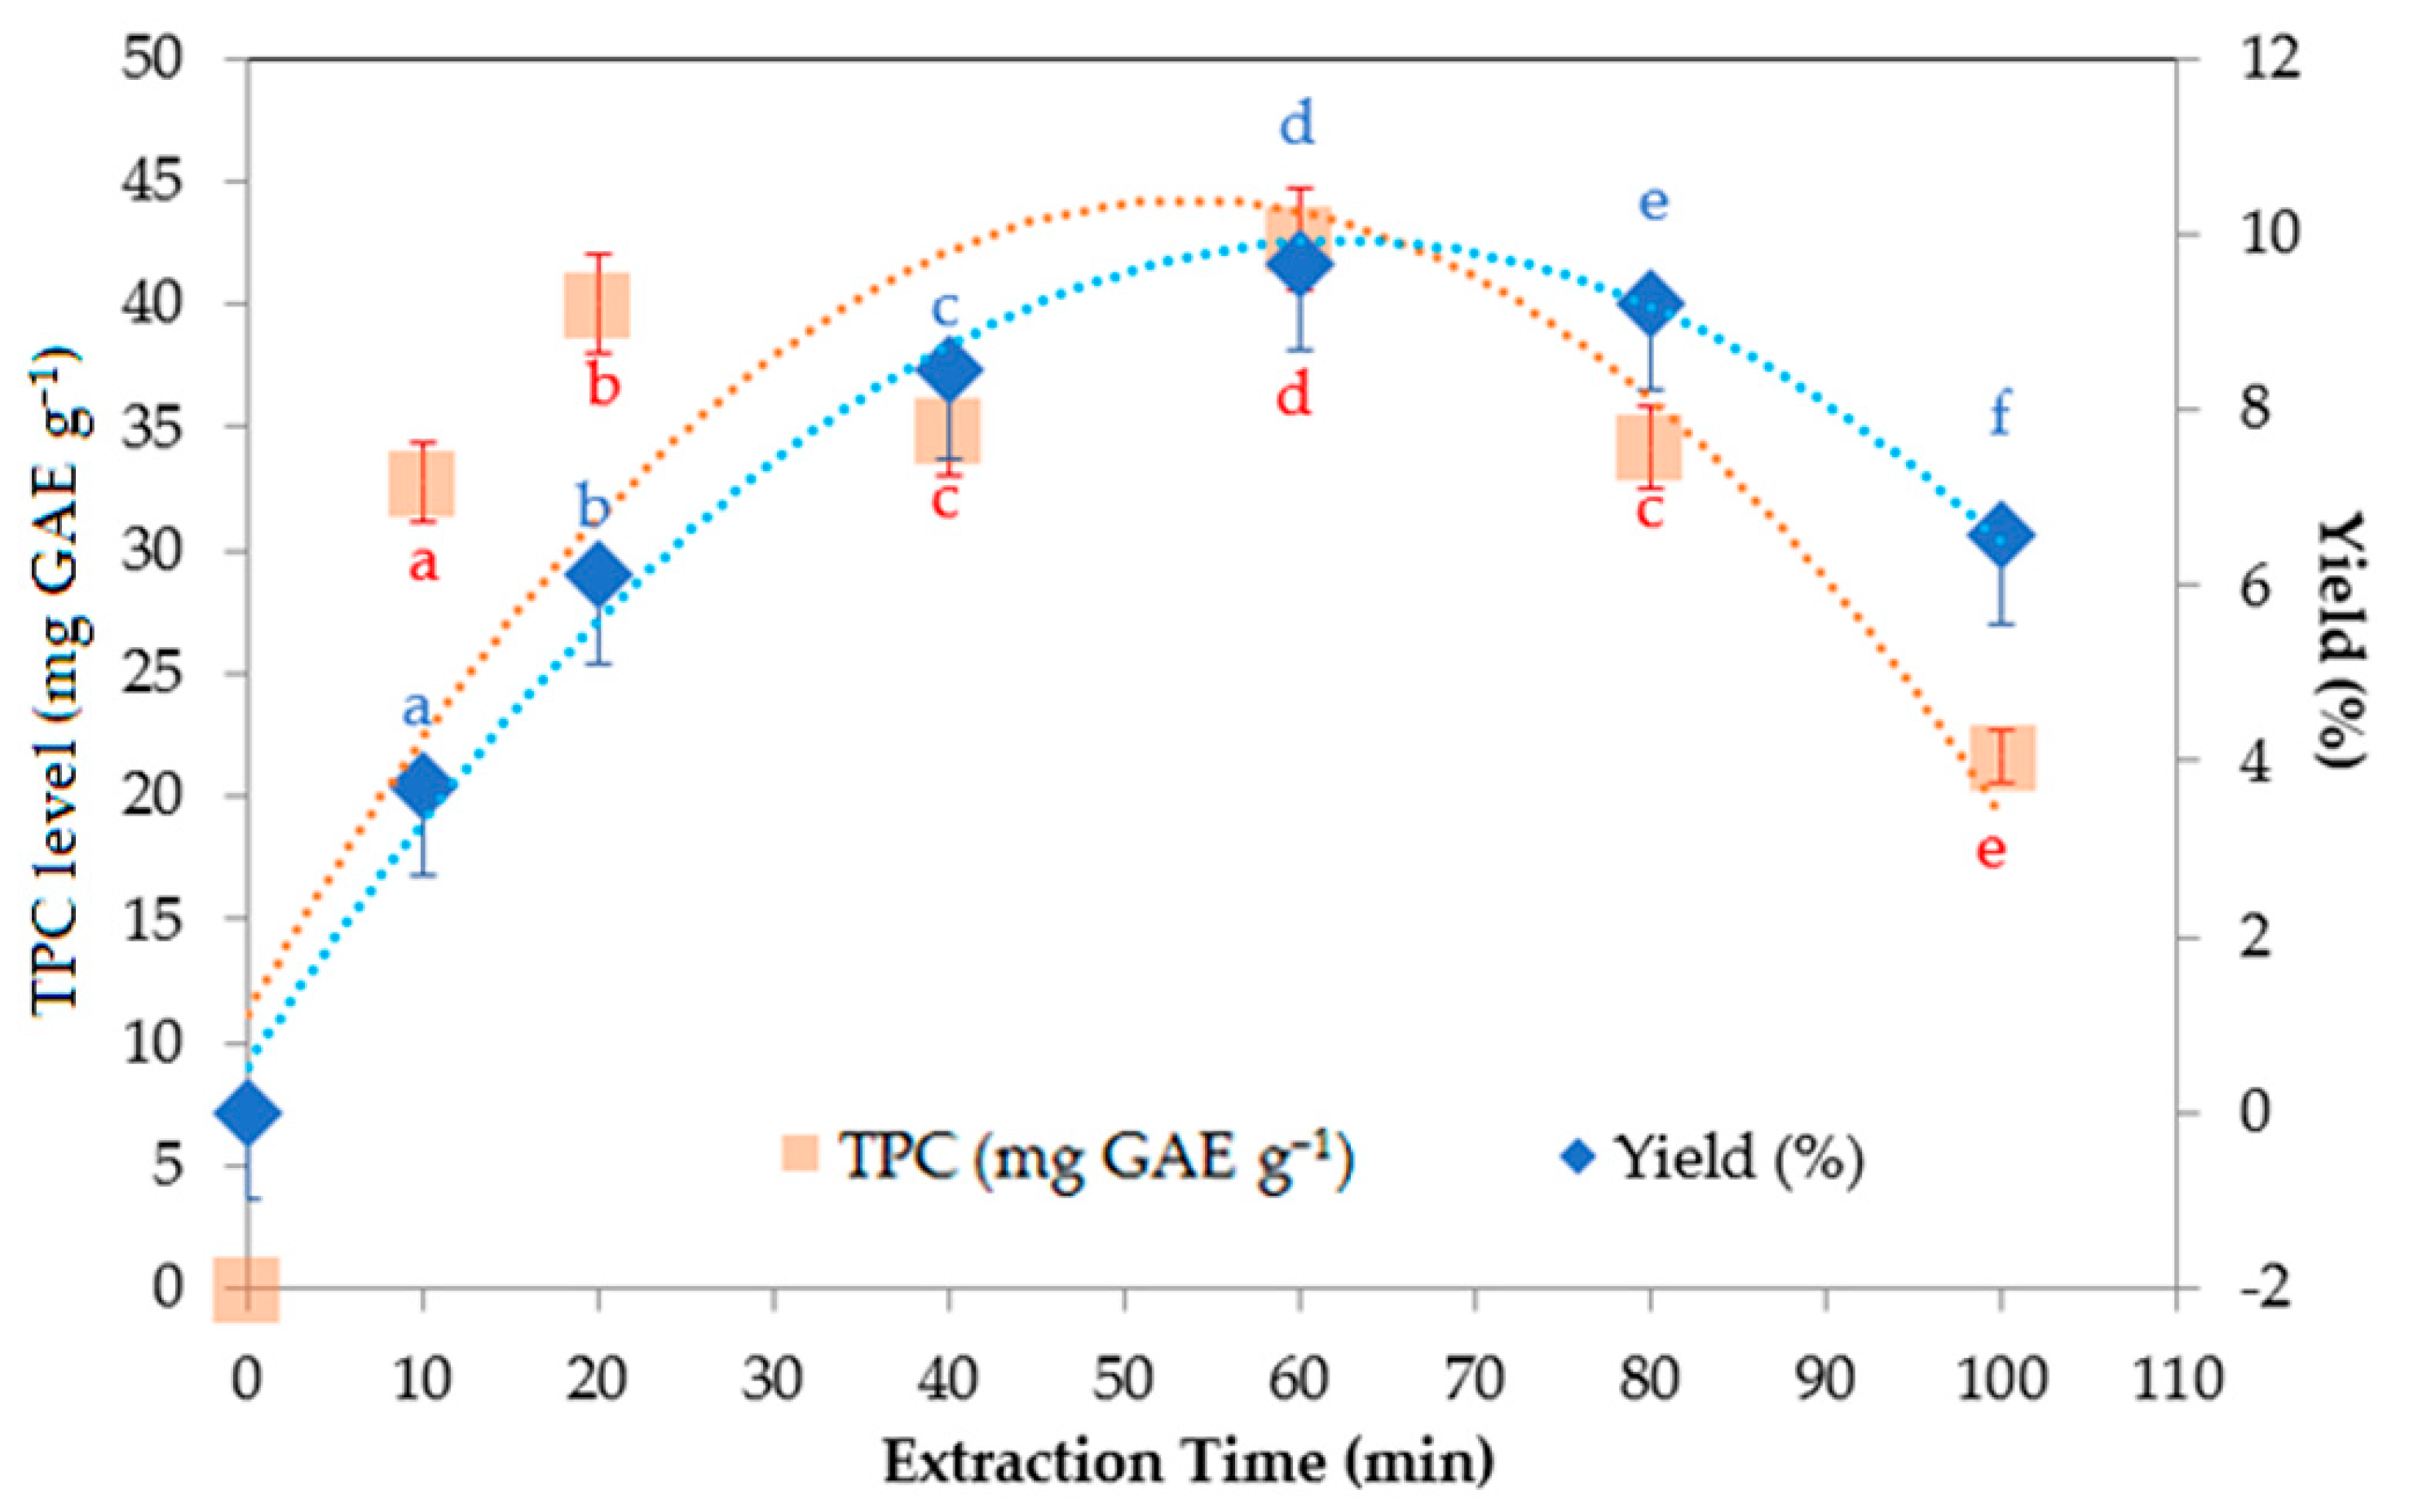
Three-dimensional surface plots were constructed to predict the relationship between the independent and dependent factors based on the prediction models. As the objective of this study was to obtain the maximum RFO yield and the highest level of total phenolic compounds simultaneously, dual response optimization was needed, employing two second-order models of the resulting RSM. The three-dimensional surface graphs were plotted to determine the compromise condition that provided the highest desirability response (Figure 3). The optimum coordinate (–0.514, 0.057, –0.672) proposed by the desirability function was established; thus, the optimized extraction UAE condition recovering the highest RFO and TPC level was achieved applying 67 °C extraction temperature, 0.52 s−1 pulse-duty cycle, and 1:2.5 g mL−1 sample-to-solvent ratio.

3.4. Kinetic Study

Once the three UAE operating variables had been optimized, the extraction kinetics were then assessed to define the optimum extraction time. For this purpose, an extraction time between 10 and 100 min was applied (Figure 4). As a result, the RFO recovery was enhanced by prolonging the extraction time up to 60 min, achieving a yield of 9.66% with a high level of TPC (42.62 mg GAE g−1). In contrast, the RFO recovery and TPC level decreased when the extraction time increased from 60 to 100 min. Former reports have described a significant relationship between oil recovery and TPC levels with extraction time [9,29]. A further increase in extraction time reduced RFO yield and TPC level due to degradation. Since phenolic compounds in RFO are susceptible to long heat exposure, the optimum extraction time was set at 60 min to avoid compound degradation.

3.5. Performance of UAE Method

Confirmation experiments were performed to verify the predicted results by dual response optimization, applying an extraction temperature of 67 °C, a pulse-duty cycle of 0.50 s−1, and sample-to-solvent ratio of 1:2.5 g mL−1 in triplicate. Table 3 compares the actual and predicted values under the optimized UAE condition. The result implies the accuracy of the prediction model, because the RSE values were lower than 5% [10]. Subsequently, the optimized method was applied for a number of red fruit clones from different origins to verify the applicability.

3.6. Application to Real Samples
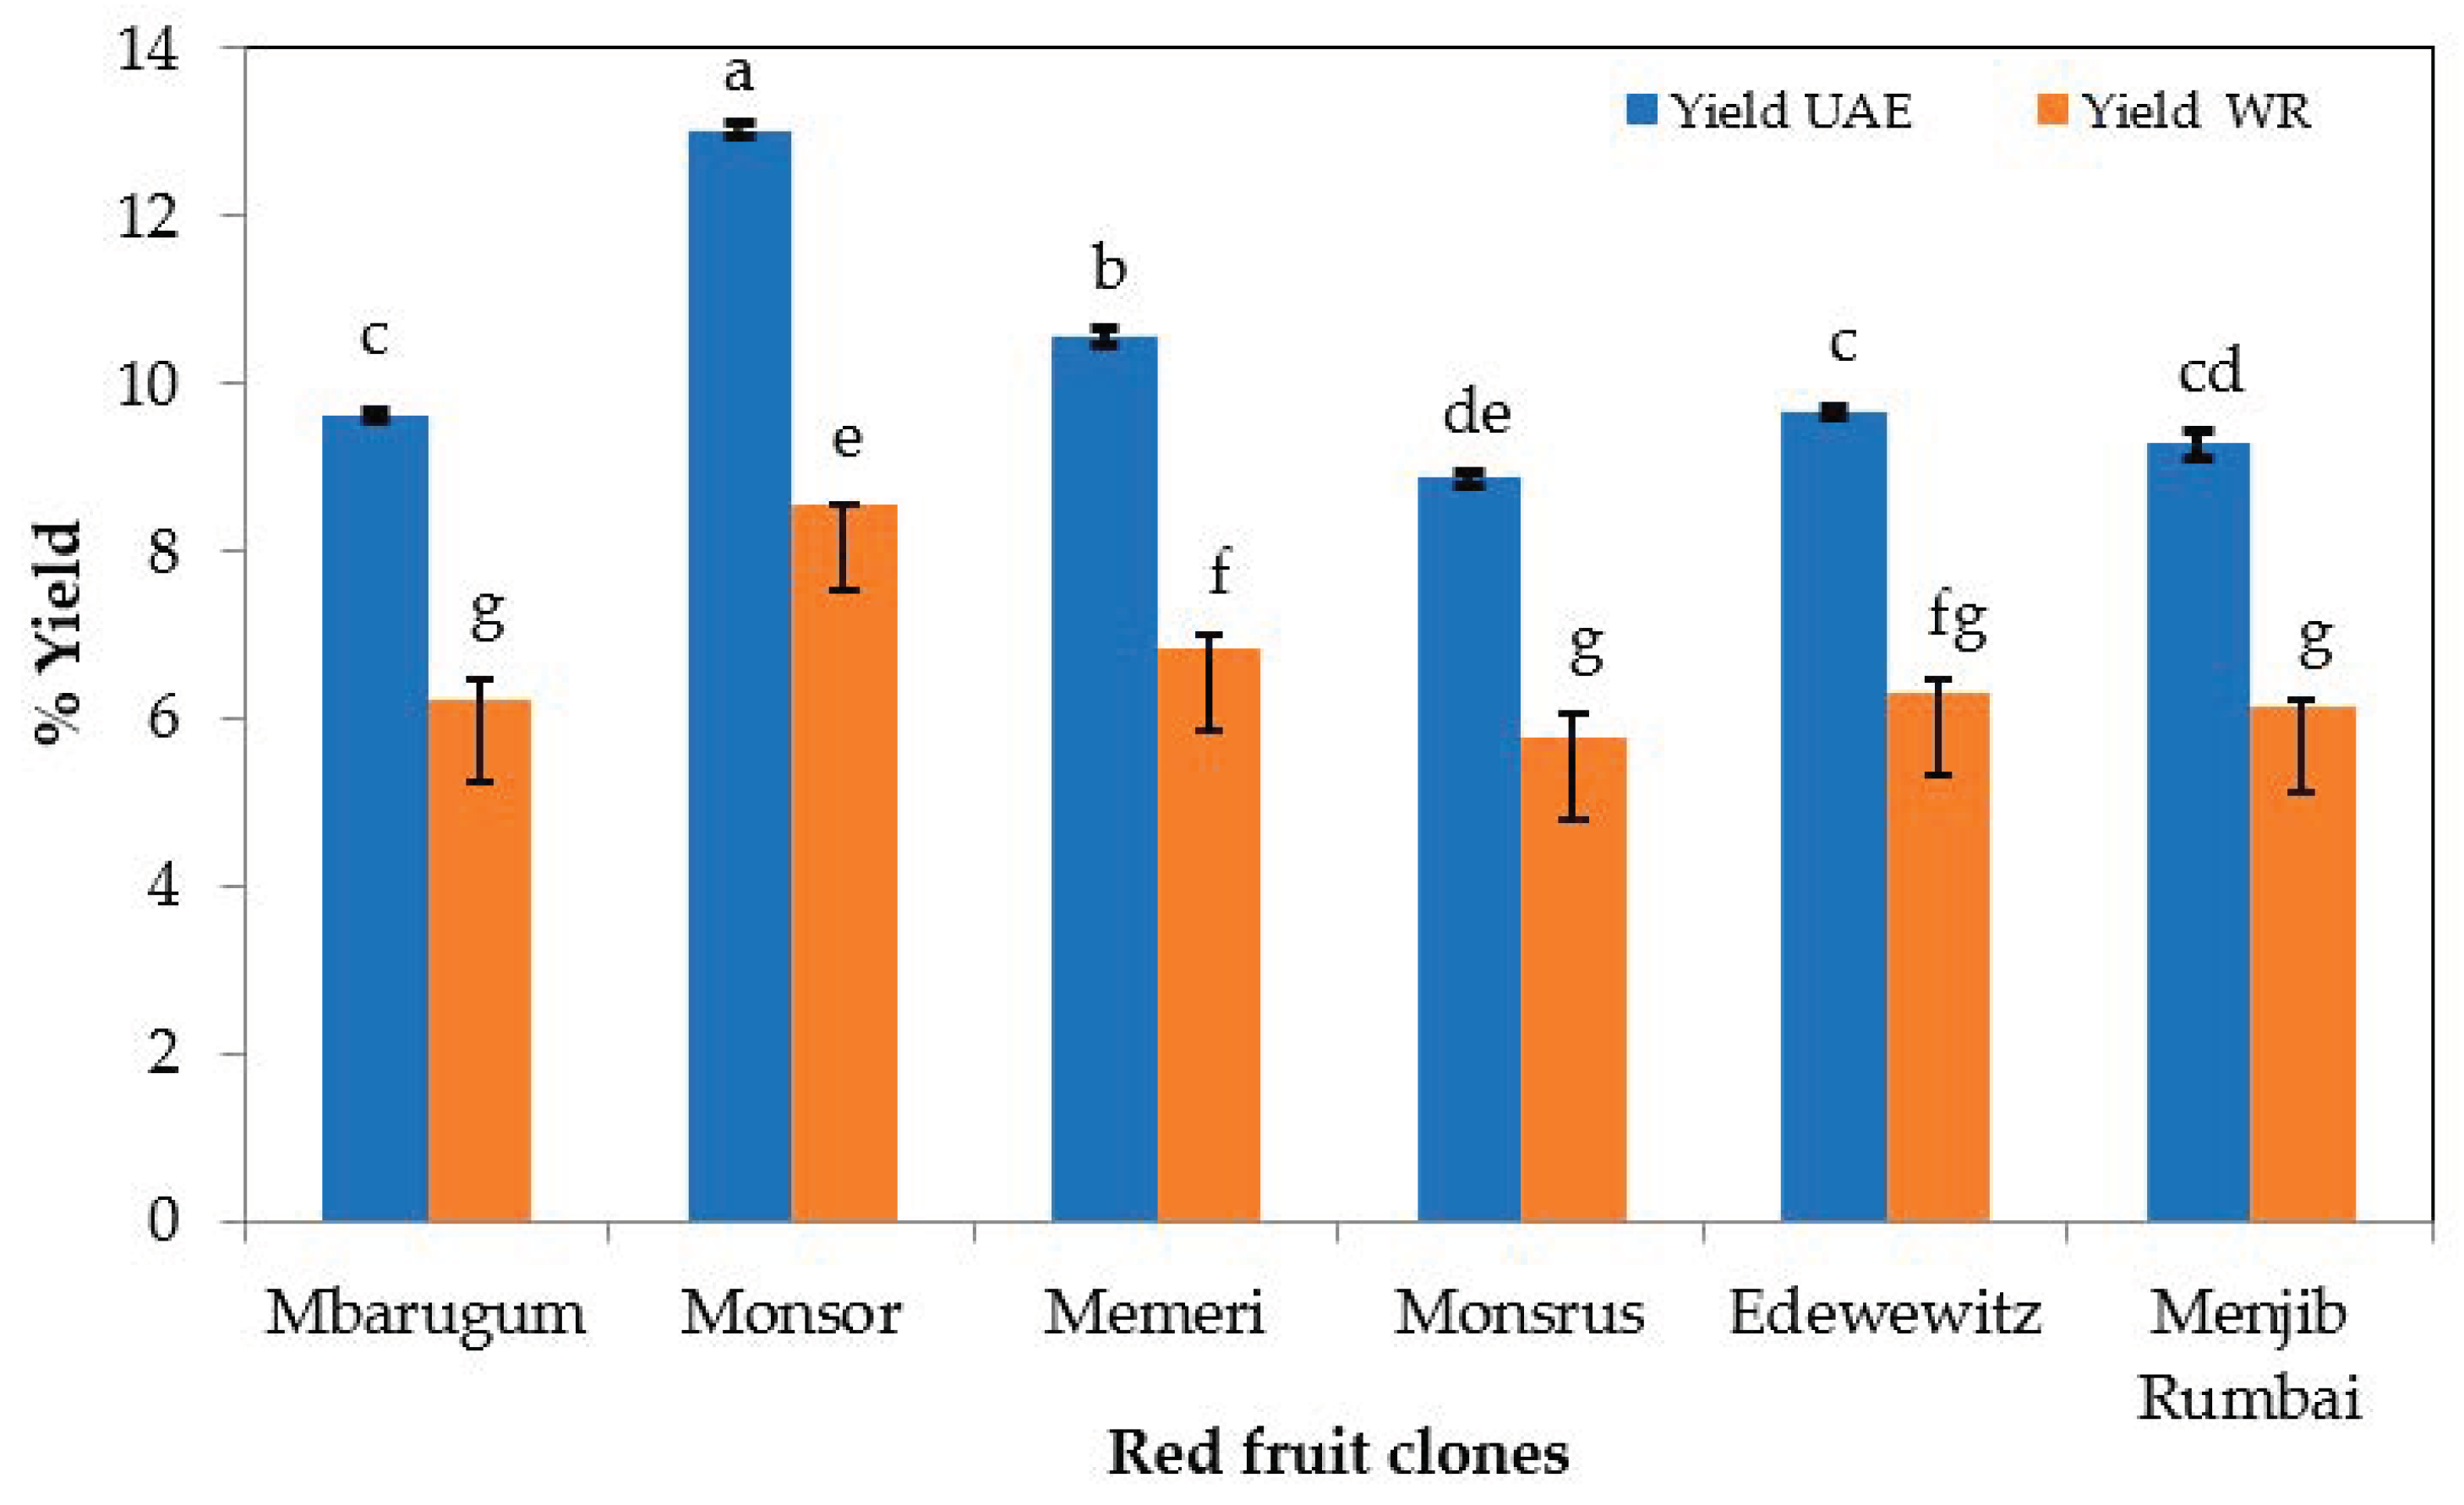
Six clones of a native red fruit in Papua—Mbarugum, Monsor, Monsrus, Edewewits, Memeri, and Menjib Rumbai—were exposed to UAE for oil extraction. The RFO recovery, TPC levels, and antioxidant activities in the oil extracted by the developed and conventional (wet rendering) method were evaluated.

3.6.1. RFO Yield

The RFO yield produced by UAE was higher than those extracted using wet rendering extraction (Figure 5). In contrast with a conventional extraction method, the new UAE method appeared to enhance the RFO recovery by 53.02%. This finding agrees with previous research on the extraction of papaya seed oil, where UAE produced higher oil recovery than Soxhlet extraction [30].
The Monsor clone provided the highest yield (13.03 ± 0.09%) of RFO, followed by Memeri (10.55 ± 0.10%), Edewewits (9.68 ± 0.06%), Mbarugum (9.62 ± 0.06%), Menjib Rumbai (9.28 ± 0.18%), and Monsrus (8.87 ± 0.09%). A similar order was reported by previous research employing wet rendering for 80 min [8] but with lower RFO yield for the Monsor clone (8.70 ± 0.13%), Memeri (6.50 ± 0.18%), Edewewits (6.20 ± 0.80%), Mbarugum (6.20 ± 0.30%), Menjib Rumbai (6.00 ± 0.04%), and Monsrus (5.40 ± 0.70%). This data revised a former report that the physical characteristics of red fruit most likely do not affect the RFO yield. In fact, the drupe of the Mbarugum clone, with a weight of 0.20 g (pulp weight 0.06 g for each drupe), length of 1.47 cm, and width of 0.48 cm could produce a higher yield than the Monsor clone, which had a drupe weight of 0.14 g (pulp 0.05 g for each drupe), length of 1.28 cm, and width of 0.43 cm [8].
The yield of RFO of the Monsor using UAE was 13.03%, which was higher than the yield of RFO of the Monsor obtained by wet rendering (8.70%), mechanical extraction by a hydraulic press (7.30%), and dry rendering (autoclave) combined with mechanical extraction (11.50%) methods [6,8]. UAE required shorter time for extraction than wet rendering (80 min), while UAE operated in a lower temperature (67 °C) than wet rendering (103 °C). Henceforth, RFO produced by UAE could provide better quality than RFO of wet rendering, as it could retain the thermolabile compounds in the oil. Although the oil recovery using the reported Soxhlet extraction (RFO from Monsor 20.85%; Memeri 17.70%, and Edewewits 15.13%) was higher than the UAE, the new extraction method provided a faster extraction time (60 min) than the Soxhlet (15 h) [1].

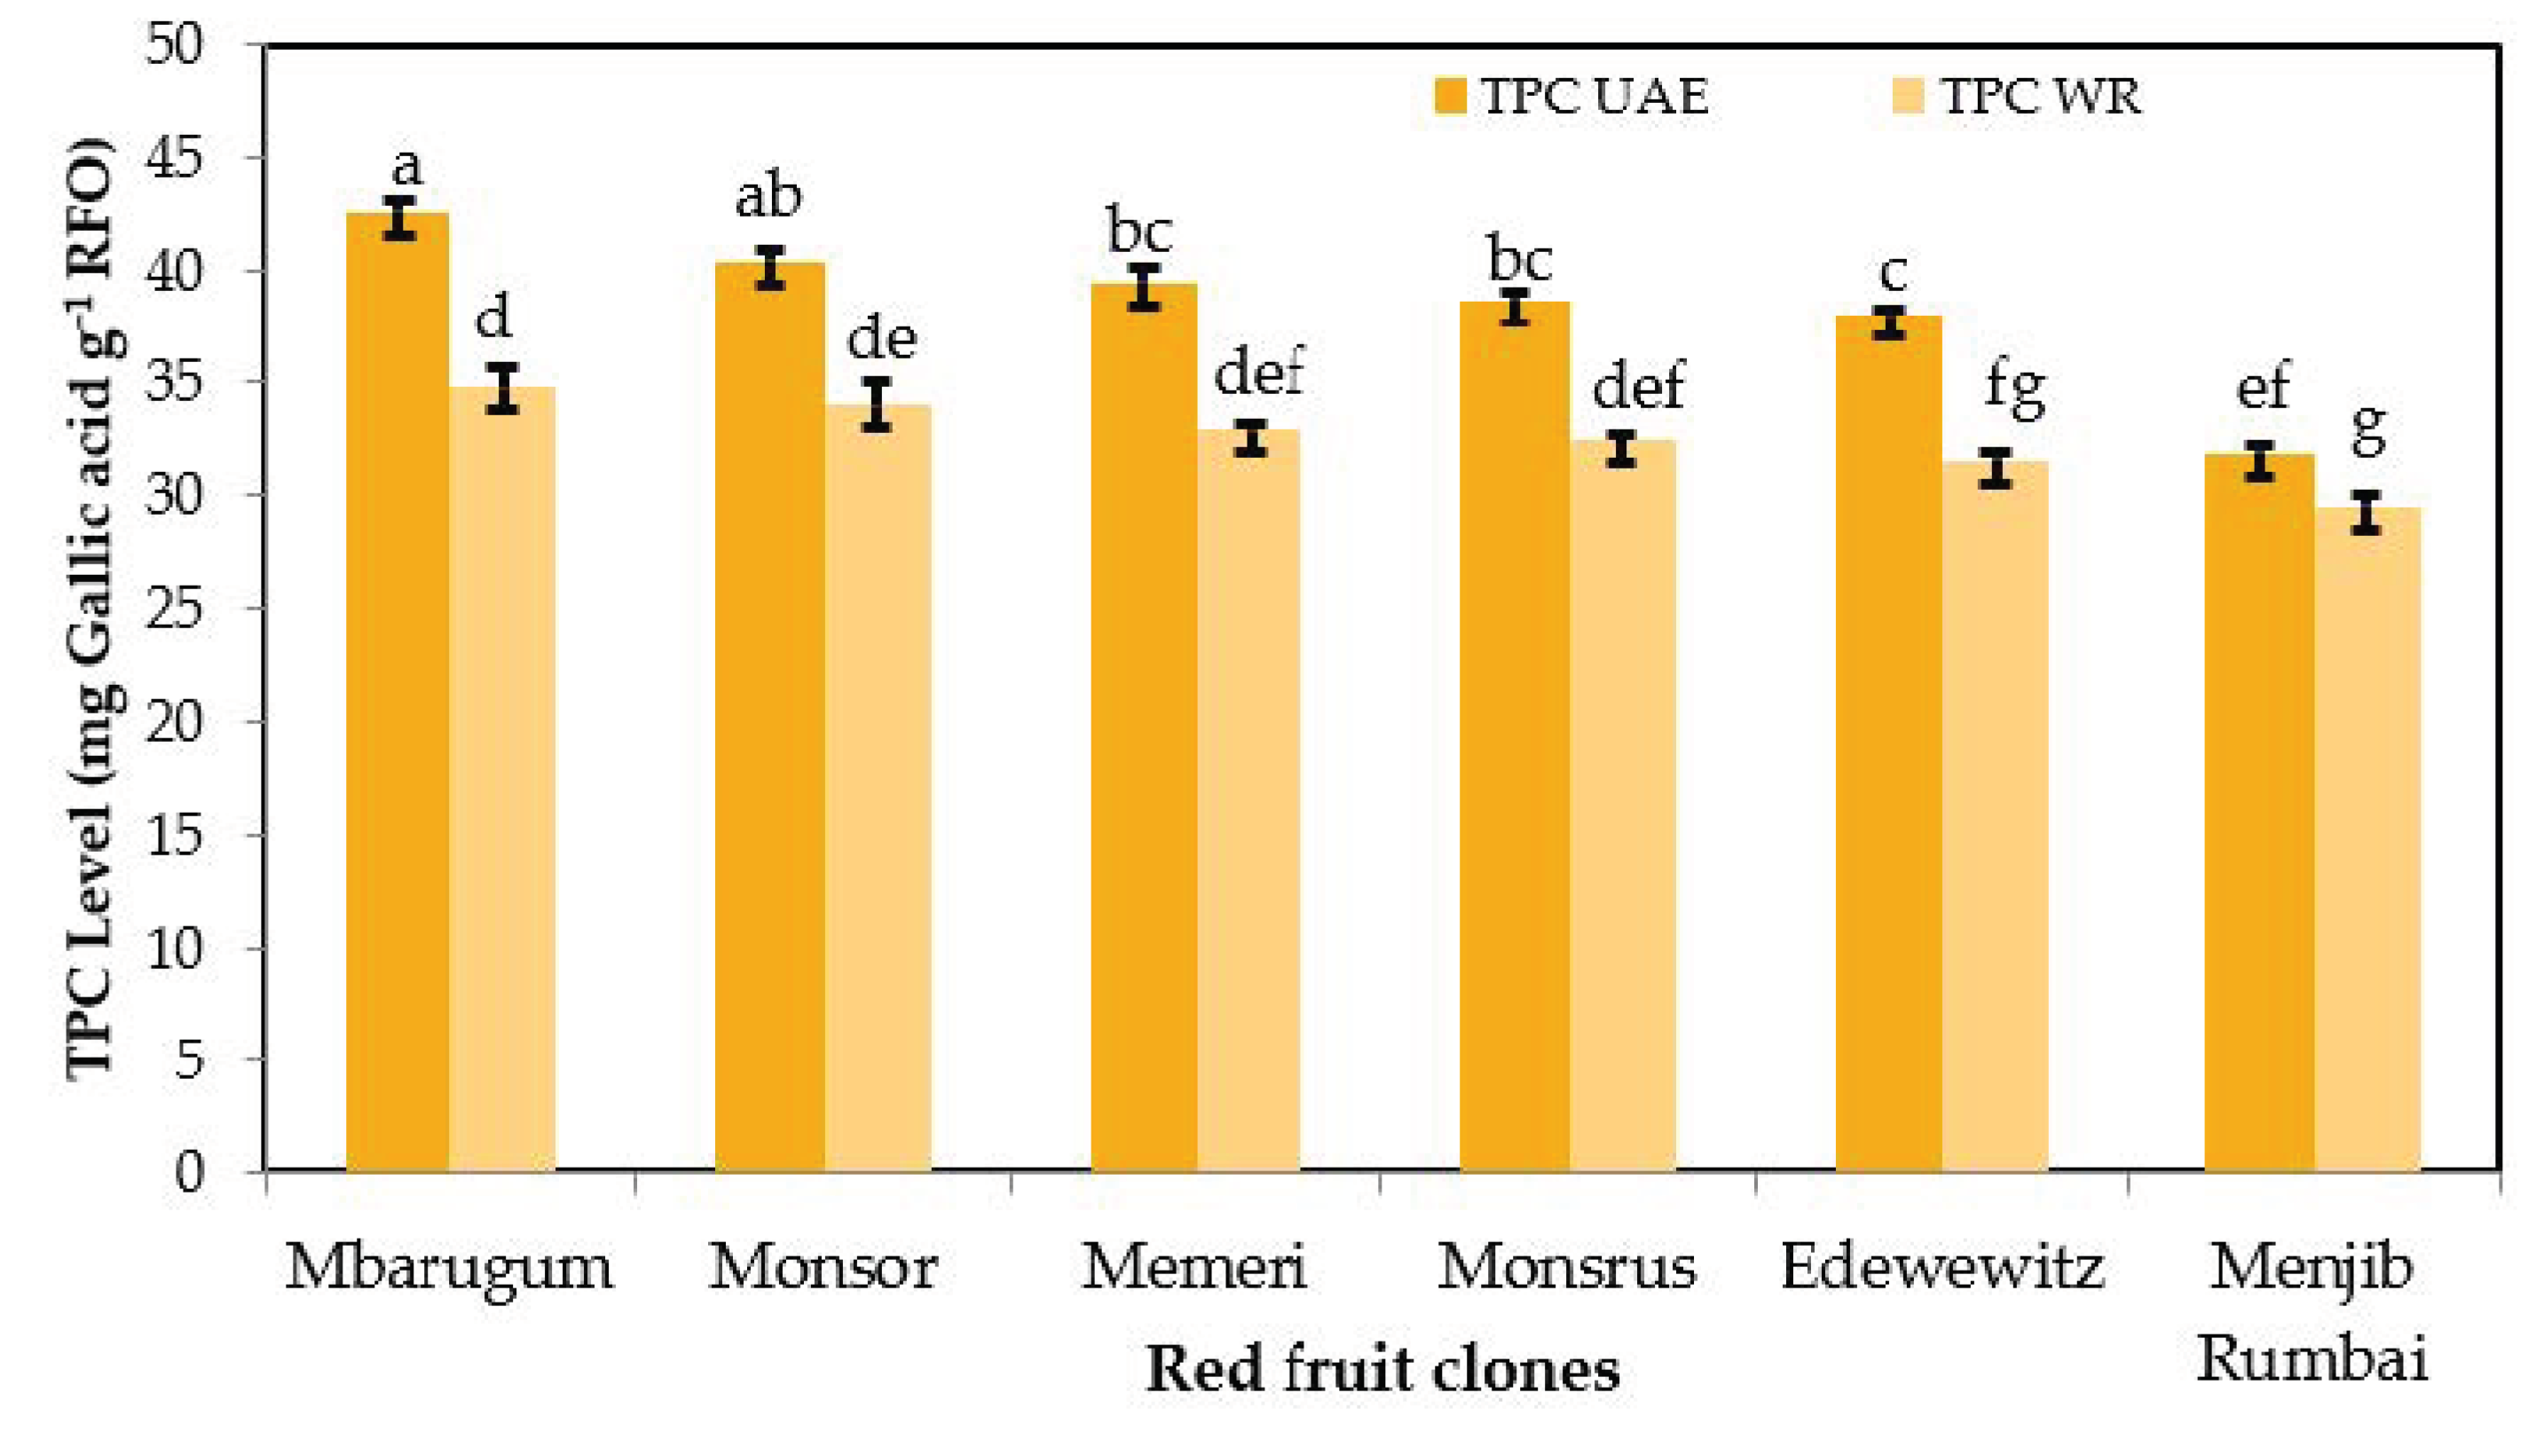
3.6.2. Total Phenolic Compounds

The level of phenolic compounds is one of the essential parameters closely related to the quality and function of food; it contributes to the oil’s flavor and natural antioxidant activity [3,5]. Due to a vast array of polarity, phenolic compounds have different solubility in water, depending on their chemical structure. Fewer polar compounds and high molecular weight phenolic is often insoluble in water but not oil. Additionally, some phenolic compounds are susceptible to high temperatures (>70 °C). Hence, selecting an appropriate extraction method is essential to recover the phenolic compounds [31]. Our research showed that the TPC levels in RFO by UAE were higher than in the wet rendering method (Figure 6). Both utilized water as the solvent to help soften the cell walls of the fruit, facilitating the phenolic compounds leaching out from the matrix. The main difference was the degree of temperature applied during the extraction, where the wet rendering involved boiling the red fruit, while UAE applied moderate temperature over a shorter time. Therefore the phenolic compounds were kept stable during UAE, yielding higher recovery [31,32].
In a previous study, RFO extracted by the Folch method contained TPC 90–742 mg GAE g−1 [3]. Other TPC levels were reported in RFO extracted using methanol (80.27 mg GAE g−1) and chloroform (49.72 mg GAE g−1) from red fruit [5]. The higher levels of TPC in these oil extracts were due to the use of organic solvents instead of water, which facilitated better solubility for phenolic compounds.
The TPC levels in RFO from six red fruit clones produced by UAE and wet rendering followed the same order. RFO from Mbarugum contained the highest TPC level, followed by Monsor, Memeri, Monsrus, Edewewits, and Menjib Rumbai.

3.6.3. Antioxidant Activity of RFO

In this research, the analyses of antioxidant activity was performed using four different assays: DPPH, metal ion-chelating (FIC), reducing power (FRAP), and ABTS. For each method the assays had different analytical purposes. The standard compound as a positive control for the oil-soluble compound was Trolox (derivate of α tocopherol), while ascorbic acid was used for the water-soluble compounds. The antioxidant activity results of RFO produced by UAE and wet rendering are provided in Figure S1.
The principle of the DPPH method is the presence of hydrogen atoms from antioxidant compounds that bind to free electrons in radical compounds, causing a change from free radicals (diphenylpicrylhydrazyl) to non-radical compounds (diphenylpicrylhydrazine). It is characterized by a color change from purple to yellow (free radical compounds are reduced by antioxidants) [33]. With respect to the DPPH test for RFO produced by UAE, the radical scavenging IC50 ranged from 37.69 ± 0.43 mg L−1 (Mbarugum) to 50.23 ± 0.45 mg L−1 (Menjib Rumbai). In contrast, in the RFO produced using wet rendering, Mbarugum had the lowest IC50 values (138.28 ± 5.21 mg L−1), while, Menjib Rumbai had the highest IC50 values (200.91 ± 0.32 mg L−1). Subsequently, IC50 from the ascorbic acid and Trolox standards was 7.78 and 6.32 mg L−1, respectively. Testing antioxidant activity using the DPPH method showed that the six RFO clones, using UAE, had stronger antioxidant activity than when using wet rendering extraction. This result agrees with the previous report that UAE can maintain the antioxidant activity of bioactive components because the extraction process can be carried out at low temperatures and in a short time [15,16,17].
Antioxidant activity based on the DPPH IC50 value of the six clones red fruit oil extracted by UAE was stronger than oregano essential oil (IC50 834.30 mg L−1) and sage essential oil (IC50 907.74 mg L−1) [34]. At the same time, the IC50 was lower than the oil extracted from red fruit using ethyl acetate (10.35 mg L−1) [5].
The FIC method determines antioxidants based on their ability to break down Fe2+-ferrozine complexes [33]. The RFO using UAE had FIC-IC50 ranging from (21.17 ± 0.01 mg L−1) to (35.18 ± 0.20 mg L−1); the IC50 of EDTA standard was 22.78 mg L−1. The results confirmed that the RFO of the six studied clones extracted using UAE provided stronger metal chelating activity than the RFO extracted using wet rendering or using an organic solvent (ethyl acetate) (65.98 mg L−1) [5].
Determination of antioxidant activity using the FRAP method is principally based on the ability to reduce ferri-tripyridyl-triazine (Fe(III)TPTZ) to Ferro-tripyridyl-triazine complexes (Fe(II)TPTZ) [33]. The results of the FRAP method for the RFO six clones at two different extractions ranged from 31–65 mg AAEA g−1 to 17–33 mg AAEA g−1, with ascorbic acid as the reference standard. Testing antioxidant activity using the FRAP method showed that using UAE, the six RFO clones had stronger reducing power than when using wet rendering extraction. The Memeri clone of RFO using UAE had the highest reducing power FRAP (65.74 mg AAEA g−1), which means it had the highest reducing power among the others.
The reducing power of the red fruit oil extracted from the six clones by UAE was higher than the essential oil of Himalayan Asteraceae (1.8 mg AAEA g−1) and Lamiaceae (2.6 mg AAEA g−1) [35], while lower than the oil extracted using ethyl acetate (682.18 mg AAEA g−1) [5].
The antioxidant activity result using the ABTS method with IC50 values for the six RFO clones using UAE and the wet rendering extraction was 93–174 mg L−1 to 198–260 mg L−1, with IC50 values from ascorbic acid and Trolox standards being 20.36 and 23.60 mg L−1, respectively. The principle of testing the antioxidant activity with the ABTS method is to remove the color of the ABTS cation to measure the antioxidant capacity and react directly with the ABTS cation radical. ABTS is a radical with a nitrogen center with a characteristic blue-green color. When reduced by antioxidants, it will turn into a non-radical form, from color to colorless. The ABTS method is susceptible to light; even the formation of ABTS + requires an incubation time of 12–16 h without light [36]. As a result, the RFO of Mbarugum clones using UAE had the lowest IC50 values (93.88 ± 2.48 mg L−1), which means it had the highest antioxidant activity. In addition, the six RFO clones using UAE had stronger antioxidant activity than RFO using wet rendering extraction; thus, RFO using UAE can maintain antioxidant activity compared to RFO using wet rendering extraction.
The ABTS IC50 value of the RFO extracted by UAE was lower than heated mustard oil (49.70 mg L−1), groundnut oil (54.55 mg L−1), and sesame oil (46.39 mg L−1) [21], but higher than the essential oil from A. arborescens L. (269.90 mg L−1) [37].
Furthermore, a loading plot was calculated to evaluate the correlation between analysis TPC and antioxidant activities (Figure S2). The loading plot described how the vectors are pinned from the origin of PC1 = 0 and PC2 = 0. The loading plot was also understood as the weight of each variable to PCs. If two vectors are close, forming a slight angle, the two variables are positively correlated. The IC50 FIC does not contribute significantly toward TPC. The IC50 value of DPPH positively correlated with the IC50 value of ABTS, while it negatively correlated with TPC and the value of reducing power FRAP. The negative correlation between TPC and IC50 (DPPH and ABTS) indicated the positive correlation between phenolic content and antiradical scavenging activities. These findings indicated that phenolic compounds contributed significantly toward all antioxidant activities, except the IC50 value of FIC.
Table S1 compiles the Pearson correlation, as indicated by the coefficient of correlation (r) values among TPC, IC50 DPPH, IC50 FIC, reducing power FRAP, and IC50 ABTS. The higher the r−value, the higher the correlation of variables. Among each variable, the correlation between the reducing power FRAP and TPC exhibited the highest r−value (0.959).
The IC50 DPPH value is related to the level of total phenolic compounds, where the phenolic compound has a close relationship and contribution to antioxidant activity. As reported, the Mbarugum clone, which has the highest TPC of 42.64 mg GAE g−1, has the lowest IC50 value of 37.69 mg L−1. The relationship between IC50 and TPC yielded a coefficient of determination (R2) of 0.6767 (Figure S3), which means that TPC contributes to the IC50 DPPH value. This is supported by a previous study, extracts of red fruit with the highest TPC have the lowest IC50 DPPH value, which means they have strongest antioxidant activity and contribute 0.645 to free DPPH radical scavenging activity [5]. However, this could not be separated from the presence of other bioactive compounds, such as carotenoids and tocopherols, which are also related to the antioxidant activity of RFO. RFO has a high content of total tocopherols, including tocotrienols, α-tocopherols, and γ-tocopherols [3], and high total carotenoids, consisting of α-carotene, β-carotene, α-cryptoxanthin, and β-cryptoxanthin [38,39]. Thus, RFO has high antioxidant activity. However, this research emphasizes the correlation between phenolic compounds with antioxidant activity. Nevertheless, each red fruit clone with the same maturity level had different total phenolic compounds, total tocopherols, and total carotenoids [1,3], to produce RFO with varying quality. This condition affects the antioxidant activity of the different RFO of each clone.
Interestingly, red fruit oil contains high total phenolic compounds, obtained with high antioxidant activity, and there was a correlation with phytomedicinal function [2,40]. Moreover, phenolic compounds could provide oxidative balance in the body by protecting against oxidative stress and being used as anticancer agents [4]. Even antioxidants act by complexing metal ions, scavenging free radicals, and decomposing peroxides [2,41]. Therefore, the method proposed by this research produced red fruit oil using UAE with better oil recovery, levels of total phenolic compounds, and antioxidant activity, thus leading to excellent medicinal qualities. Unfortunately, individual phenolic compounds were not identified in the present study. Future studies should check the structural and other properties of phenolic compounds in red fruit oil.
This study is limited to the effect of extraction variables on the level of phenolic compounds and the antioxidant activities of RFO. Meanwhile, other bioactive compounds (carotenoids, tocopherol, and fatty acid) and the quality parameters of red fruit oil (water content, free fatty acid, iodine value, and peroxide value) [42] should also be considered in future studies.

4. Conclusions

A Box-Behnken design combined with response surface methodology and multiresponse optimization was employed to determine the optimum conditions of red fruit oil extraction using UAE. Three independent variables (temperature, pulse-duty cycle, and sample-to-solvent ratio) significantly influenced the oil recovery, while the level of total phenolic compounds in the extracts was defined by extraction temperature (p < 0.05). These significant factors were then included in the optimization models (R2 > 0.99, lack-of-fit p > 0.05). The combination of the optimum factors of (temperature 67 °C, pulse-duty cycle 0.52 s−1, sample-to-solvent ratio 1:2.5 g mL−1, and extraction time 60 min) led to the RFO of the Monsor clone having the highest yield (13.03%) while the Mbarugum clone had the highest level of total phenolic compounds (42.64 mg GAE g−1) and smallest IC50 DPPH (37.69 mg L−1) and IC50 ABTS (93.88 mg L−1); the Memeri had the smallest IC50 FIC (21.17 mg L−1) and highest reducing power FRAP (65.74 mg AAEA g−1). In addition, the level of TPC had a positive correlation with antioxidant activities. In contrast with a conventional extraction method, UAE appeared to enhance the RFO recovery by 53.02%, resulting in a better level of total phenolic compounds and higher antioxidant activities. Hence, the developed UAE is more favorable for the RFO industry, as the extraction is faster with better yield and quality than the existing method used by local oil producers.
The lab-scale of ultrasound-assisted oil extraction successfully produced phenolic-rich oil with strong antioxidant activity. Further research to apply the new extraction method on an industrial scale is needed to study the natural substances of red fruits.

Supplementary Materials

The following supporting information can be downloaded at: https://www.mdpi.com/article/10.3390/agronomy12020523/s1, Figure S1: Antioxidant activity of red fruit oil from six clones using the optimized condition of ultrasound-assisted extraction (UAE) and wet rendering (WR) method (a) IC50 DPPH; (b) IC50 Metal ion-chelating (FIC); (c) Reducing power (FRAP); and (d) IC50 ABTS assays of six clones red fruit oil. Different letters above the bars indicate a significant difference (p < 0.05), Figure S2: The loading plot of PCA using variables of IC50 values of DPPH, IC50 values of metal ion-chelating (FIC), Reducing power (FRAP) value, IC50 values of ABTS, and Total Phenolic Compounds (TPC), Figure S3: Correlation between total phenolic content (TPC) and IC50 DPPH; Table S1: Pearson correlation among of TPC, IC50 DPPH, IC50 metal ion-chelating (FIC), reducing power (FRAP), and IC50 ABTS.

Author Contributions

Conceptualization, E.P.S. and W.S.; methodology, E.P.S. and W.S.; software, W.S.; validation, W.S. and A.R.; formal analysis, E.P.S.; investigation, E.P.S.; resources, E.P.S.; data curation, E.P.S.; writing—original draft preparation, E.P.S.; writing—review and editing, W.S. and A.R.; visualization, E.P.S.; supervision, W.S. and A.R.; project administration, E.P.S.; funding acquisition, E.P.S. All authors have read and agreed to the published version of the manuscript.

Funding

The research was funded by the National Agency of Drug and Food Control (NADFC) Foundation of The Republic of Indonesia through a NADFC Scholarships 2020/2022.

Institutional Review Board Statement

Not applicable.

Informed Consent Statement

Not applicable.

Data Availability Statement

The data presented in this study is contained within the article.

Acknowledgments

E.P.S. is grateful to the National Agency of Drug and Food Control (NADFC) Foundation of The Republic of Indonesia for a Master’s Studentship through the NADFC Scholarships 2020/2022.

Conflicts of Interest

The authors declare no conflict of interest.

References

  1. Murtiningrum; Sarungallo, Z.L.; Roreng, M.K.; Santoso, B.; Armiati. Chemical properties, carotenoid, tocopherol, and fatty acid composition of three clones of red fruit (Pandanus conoideus Lam.) oil of different ripening stages. Int. Food Res. J. 2019, 26, 649–655. [Google Scholar]
  2. Rohman, A.; Windarsih, A. Characterization, biological activities, and authentication of red fruit (Pandanus conoideus Lam) oil. Food Res. 2017, 2, 134–138. [Google Scholar] [CrossRef]
  3. Sarungallo, Z.L.; Hariyadi, P.; Andarwulan, N.; Purnomo, E.H. Characterization of chemical properties, lipid profile, total phenol, and tocopherol content of oils extracted from nine clones of red fruit (Pandanus conoideus). Kasetsart J.-Nat. Sci. 2015, 49, 237–250. [Google Scholar]
  4. Xia, N.; Schirra, C.; Hasselwander, S.; Förstermann, U.; Li, H. Red fruit (Pandanus conoideus Lam) oil stimulates nitric oxide production and reduces oxidative stress in endothelial cells. J. Funct. Foods 2018, 1, 65–74. [Google Scholar] [CrossRef]
  5. Rohman, A.; Riyanto, S.; Yuniarti, N.; Saputra, W.R.; Utami, R.; Mulatsih, W. Antioxidant activity, total phenolic, and total flavaonoid of extracts and fractions of red fruit (Pandanus conoideus Lam). Int. Food Res. J. 2010, 17, 97–106. [Google Scholar]
  6. Sarungallo, Z.L.; Hariyadi, P.; Andarwulan, A.; Purnomo, E.H. Effect of heat treatment prior to extraction on the yield and quality of red fruit (Pandanus conoideus) oil. Food Res. 2020, 4, 659–665. [Google Scholar] [CrossRef]
  7. Sarungallo, Z.L.; Hariyadi, P.; Andarwulan, N.; Purnomo, E.H. The effect of extraction method on the chemical quality and fatty acid composition of red fruit (Pandanus Conoideus) oil. J. Teknol. Ind. Pertan. 2014, 24, 209–217. [Google Scholar]
  8. Sarungallo, Z.L.; Hariyadi, P.; Andarwulan, N.; Purnomo, E.H. Diversity of physical characteristics of fruit, plant and the yield oil of nine clones of red fruit (Pandanus conoideus). Agrikan J. Agribisnis Perikan. 2019, 12, 70–82. [Google Scholar] [CrossRef] [Green Version]
  9. Mohammadpour, H.; Sadrameli, S.M.; Eslami, F.; Asoodeh, A. Optimization of ultrasound-assisted extraction of Moringa peregrina oil with response surface methodology and comparison with Soxhlet method. Ind. Crops Prod. 2019, 131, 106–116. [Google Scholar] [CrossRef]
  10. Esmaeilzadeh, K.R.; Dehghan, B. Optimization of ultrasound-assisted solvent extraction of hemp (Cannabis sativa L.) seed oil using RSM: Evaluation of oxidative stability and physicochemical properties of oil. Food Sci. Nutr. 2020, 8, 4976–4986. [Google Scholar] [CrossRef]
  11. Zhou, J.; Ma, Y.; Jia, Y.; Pang, M.; Cheng, G.; Cai, S. Phenolic profiles, antioxidant activities, and cytoprotective effects of different phenolic fractions from oil palm (Elaeis guineensis Jacq.) fruits treated by ultra-high pressure. Food Chem. 2019, 288, 68–77. [Google Scholar] [CrossRef]
  12. Stevanato, N.; da Silva, C. Radish seed oil: Ultrasound-assisted extraction using ethanol as solvent and assessment of its potential for ester production. Ind. Crops. Prod. 2019, 132, 283–291. [Google Scholar] [CrossRef]
  13. Aydar, A.Y.; Bagdatlioglu, N.; Köseoglu, O. Effect of ultrasound on olive oil extraction and optimization of ultrasound-assisted extraction of extra virgin olive oil by response surface methodology (RSM). Grasas Aceites 2017, 68, 189–201. [Google Scholar] [CrossRef]
  14. Chen, S.; Zeng, Z.; Hu, N.; Bai, B.; Wang, H.; Suo, Y. Simultaneous optimization of the ultrasound-assisted extraction for phenolic compounds content and antioxidant activity of Lycium ruthenicum Murr. fruit using response surface methodology. Food Chem. 2018, 242, 1–8. [Google Scholar] [CrossRef] [PubMed]
  15. Goula, A.M.; Ververi, M.; Adamopoulou, A.; Kaderides, K. Green ultrasound-assisted extraction of carotenoids from pomegranate wastes using vegetable oils. Ultrason. Sonochem. 2017, 34, 821–830. [Google Scholar] [CrossRef] [PubMed]
  16. Jalili, F.; Jafari, S.M..; Emam-Djomeh, Z.; Malekjani, N.; Farzaneh, V. Optimization of ultrasound-assisted extraction of oil from canola seeds with the use of response surface methodology. Food Anal. Methods 2018, 11, 598–612. [Google Scholar] [CrossRef]
  17. Chemat, F.; Rombaut, N.; Sicaire, A.G.; Meullemiestre, A.; Fabiano-Tixier, A.S.; Abert-Vian, M. Ultrasound assisted extraction of food and natural products. Mechanisms, techniques, combinations, protocols and applications. A review. Ultrason. Sonochem. 2017, 34, 540–560. [Google Scholar] [CrossRef] [PubMed]
  18. Mayara, T.P.; Del Castilo, B.D.; Serrão, P.C.D.; Lobato, R.A.B.; Silva, R.R.; Oliveira, P.F.D. Antioxidant effect of plant extracts of the leaves of Tithonia diversifolia (Hemsl.) A. Gray on the free radical DPPH. J. Chem. Pharm. Res. 2016, 8, 1182–1189. [Google Scholar]
  19. Mentari, F.; Vifta, R. Evaluation of physicochemical properties and antioxidant characteristic of cucumber suri (Cucumis melo L.) seeds ethanolic extract encapsulated in chitosan. JRTI 2019, 13, 125–134. [Google Scholar]
  20. Vijayalakshmi, M.; Ruckmani, K. Ferric reducing antioxidant power assay in plant extract. Bangladesh J. Pharmacol. 2016, 11, 570–572. [Google Scholar] [CrossRef] [Green Version]
  21. Valantina, R.S.; Neelamegam, P. Selective ABTS and DPPH-radical scavenging activity of peroxide from vegetable oils. Int. Food Res. J. 2015, 22, 289–294. [Google Scholar]
  22. Wu, S.Q.; Li, R.; Jiang, Z.T.; Wang, Y.; Tan, J.; Tang, S.H. Evaluation of antioxidant active ingredients of spikenard essential oil by ultra-fast gas chromatography electronic nose and radical scavenging mechanism. Ind. Crops Prod. 2020, 151, 112489–112496. [Google Scholar] [CrossRef]
  23. Sekarsari, S.; Widarta, I.W.R.; Jambe, A.A.G.N.A. The influence of time and temperature with ultrasonic waves on antioxidant activity of extracts guajava leaves (Psidium guajava L.). J. Ilmu dan Teknol. Pangan. 2019, 8, 267–277. [Google Scholar] [CrossRef]
  24. Carrera, C.; Ruiz-Rodríguez, A.; Palma, M.; Barroso, C.G. Ultrasound assisted extraction of phenolic compounds from grapes. Anal. Chim. Acta 2012, 732, 100–104. [Google Scholar] [CrossRef]
  25. Medina-Torres, N.; Ayora-Talavera, T.; Espinosa-Andrews, H.; Sánchez-Contreras, A.; Pacheco, N. Ultrasound assisted extraction for the recovery of phenolic compounds from vegetable sources. Agronomy 2017, 7, 47. [Google Scholar] [CrossRef]
  26. Cárcel, J.A.; García-Pérez, J.V.; Benedito, J.; Mulet, A. Food process innovation through new technologies: Use of ultrasound. J. Food Eng. 2012, 110, 200–207. [Google Scholar] [CrossRef]
  27. Taha, A.; Ahmed, E.; Ismaiel, A.; Ashokkumar, M.; Xu, X.; Pan, S. Ultrasonic emulsification: An overview on the preparation of different emulsifiers-stabilized emulsions. Trends Food Sci. Technol. 2020, 105, 363–377. [Google Scholar] [CrossRef]
  28. Majid, H.; Silva, F.V.M. Optimisation of ultrasound assisted extraction of antiacetylcholinesterase and antioxidant compounds from manuka (Leptospermum scoparium) for use as a phytomedicine against Alzheimer’s disease. N. Z. J. For. Sci. 2020, 50, 1–12. [Google Scholar] [CrossRef]
  29. Nurmiah, S.; Syarief, R.; Sukarno, S.; Peranginangin, R.; Nurmata, B. Application of response surface methodology in the optimization of process conditions of alkali treated cottonii (ATC) processing. J. Pascapanen dan BioTeknol. Kelaut dan Perikan. 2013, 8, 9–22. [Google Scholar] [CrossRef] [Green Version]
  30. Zhang, W.; Pan, Y.G.; Huang, W.; Chen, H.; Yang, H. Optimized ultrasonic-assisted extraction of papaya seed oil from Hainan/Eksotika variety. Food Sci. Nutr. 2019, 7, 2692–2701. [Google Scholar] [CrossRef] [Green Version]
  31. Alara, O.R.; Abdurahman, N.H.; Ukaegbu, C.I. Extraction of phenolic compounds: A review. Curr. Res. Food Sci. 2021, 4, 200–214. [Google Scholar] [CrossRef] [PubMed]
  32. Senrayan, J.; Venkatachalam, S. Ultrasonic acoustic-cavitation as a novel and emerging energy efficient technique for oil extraction from kapok seeds. Innov. Food Sci. Emerg Technol. 2020, 62, 102347. [Google Scholar] [CrossRef]
  33. Sánchez-Vioque, R.; Polissiou, M.; Astraka, K.; de los Mozos-Pascual, M.; Tarantilis, P.; Herraiz-Peñalver, D. Polyphenol composition and antioxidant and metal chelating activities of the solid residues from the essential oil industry. Ind. Crops Prod. 2013, 49, 150–159. [Google Scholar] [CrossRef]
  34. Ghadermazi, R.; Keramat, J.; Goli, S.A.H. Antioxidant activity and physical properties of hydroxypropylmethylcellulose films enriched with essential oils. J. Food Nutr Res. 2016, 55, 22–32. [Google Scholar]
  35. Kumar, V.; Mathela, C.S.; Kumar, M.; Tewari, G. Antioxidant potential of essential oils from some Himalayan Asteraceae and Lamiaceae species. Med. Drug Discov. 2019, 1, 100004–100011. [Google Scholar] [CrossRef]
  36. Ilyasov, I.R.; Beloborodov, V.L.; Selivanova, I.A.; Terekhov, R.P. ABTS/PP Decolorization assay of antioxidant capacity reaction pathways. Int. J. Mol. Sci. 2020, 21, 1131. [Google Scholar] [CrossRef] [Green Version]
  37. Abderrahim, A.; Belhamel, K.; Chalard, P.; Figuérédo, G. Chemotypes and radical scavenging activity of the essential oils from Artemisia arborescens L. growing in three areas of Bejaia (Algeria). J. Food Meas. Charact. 2019, 13, 2491–2499. [Google Scholar] [CrossRef]
  38. Sarungallo, Z.L.; Murtiningrum; Santoso, B.; Roreng, M.K.; Latumahina, R.M.M. Nutrient content of three clones of red fruit (Pandanus conoideus) during the maturity development. Int. Food Res. J. 2016, 23, 1217–1225. [Google Scholar]
  39. Sarungallo, Z.L.; Hariyadi, P.; Andarwulan, N.; Purnomo, E.H.; Wada, M. Analysis of α-cryptoxanthin, β-cryptoxanthin, α-carotene, and β-carotene of Pandanus conoideus oil by High-performance Liquid Chromatography (HPLC). Procedia Food Sci. 2015, 3, 231–243. [Google Scholar] [CrossRef] [Green Version]
  40. Andriani, Y.; Ramli, N.M.; Syamsumir, D.F.; Kassim, M.N.I.; Jaafar, J.; Aziz, N.A.; Marlina, L.; Musa, N.S.; Mohamad, H. Phytochemical analysis, antioxidant, antibacterial and cytotoxicity properties of keys and cores part of Pandanus tectorius fruits. Arab. J. Chem. 2019, 12, 3555–3564. [Google Scholar] [CrossRef] [Green Version]
  41. Mateus, A.; Sanha, F.; Kumar, S.; Sharma, P.K. Phenolic Compounds from Plants—An important class of phytomedicine in wrestle against cancer- A review. Glob. J. Med. Res. 2019, 19, 25–41. [Google Scholar]
  42. Wijaya, H.; Pohan, H.G. Kajian teknis standar minyak buah merah (Pandanus conoideus). In Proceedings of the PPI Standardisasi 2009, Jakarta, Indonesia, 19 November 2009; PPI Standardisasi: Kota Tangerang Selatan, Indonesia, 2009. [Google Scholar]
Figure 1. Red fruit drupe from six red fruit clones: (a) Edewewits clone; (b) Menjib Rumbai clone; (c) Memeri clone; (d) Monsor clone; (e) Monsrus clone; and (f) Mbarugum clone.
Agronomy 12 00523 g001
Figure 2. Pareto chart for the standardized effects of factors in the extraction process: (a) oil yield (%); (b) total phenolic compounds (mg GAE g−1). The vertical line crossing the bars shows that the corresponding factor has a statistically significant 95% confidence level. Indicates a positive effect and indicates a negative effect. A: Temperature; B: Pulse-duty cycle; C: Sample-to-solvent ratio.
Agronomy 12 00523 g002
Figure 3. Response surface graphs regarding desirability response: (a) temperature vs. pulse-duty cycle and (b) temperature vs. sample-to-solvent ratio.
Agronomy 12 00523 g003
Figure 4. The effect of ultrasound-assisted extraction (UAE) time on oil yield and level of total phenolic compounds (TPC). Different letters above (yield) and below (TPC) the tick marks indicate a significant difference (p < 0.05).
Agronomy 12 00523 g004
Figure 5. The oil yield of six red fruit clones using the optimized condition of ultrasound-assisted extraction (UAE) and wet rendering (WR) methods. Different letters within a column indicate a significant difference (p < 0.05).
Agronomy 12 00523 g005
Figure 6. Total phenolic compounds of six clones producing red fruit oil using the optimized condition of ultrasound-assisted extraction (UAE) and wet rendering (WR) methods. Different letters above the bars indicate a significant difference (p < 0.05).
Agronomy 12 00523 g006
Table 1. Range of values of the independent factors.
Factors−10+1Unit
Temperature (A)607590°C
Pulse-duty cycle (B)0.20.50.8s−1
Sample-to-solvent ratio (C)1:31:21:1g mL−1
Table 2. Box-Behnken design for the three independent variables with their observed responses.
DOEUAE Variables *Responses
ABCOil Yield
(%)
Total Phenolic Compounds
(mg GAE g−1)
1+1+104.9928.29
2−1−108.1540.44
30009.5141.02
40009.6740.22
5−1+107.5642.86
60+1−19.0139.23
7+10+15.3028.31
8−10−18.5742.24
91−105.8328.23
10−10+18.1440.80
110009.5440.43
120−1−19.3340.12
130+1+18.6240.88
140−1+18.6740.32
150009.5040.52
16+10−16.3928.79
* Temperature (A), pulse duty-cycle (B), and sample-to-solvent ratio (C).
Table 3. Predicted and actual response values in the optimum extraction conditions.
Temperature (°C)Pulse Duty-Cycle (s−1)Sample-to-Solvent Ratio
(g mL−1)
Oil Yield (%)Total Phenolic Compounds
(mg GAE g−1)
Predicted670.521:2.59.6742.56
Actual670.501:2.59.60 ± 0.0442.63 ± 0.35
RSE (%) 0.740.17
Publisher’s Note: MDPI stays neutral with regard to jurisdictional claims in published maps and institutional affiliations.

