Article

Effects of Soil Moisture Content on Germination and Physiological Characteristics of Rice Seeds with Different Specific Gravity

1
Shanghai Agrobiological Gene Center, No. 2901 Beidi Road, Shanghai 201106, China
2
Institute for Sustainable Horticulture, Kwantlen Polytechnic University, 20901 Langley Bypass, Langley, BC V3A 8G9, Canada
3
College of Plant Science and Technology, Huazhong Agricultural University, No. 1 Shizishan Street, Hongshan District, Wuhan 430070, China
4
College of Agriculture, Yangtze University, No. 266 Jingmi Road, Jingzhou 434025, China
5
Department of Agronomy, Ghazi University, Dera Ghazi Khan 32200, Pakistan
*
Authors to whom correspondence should be addressed.
These authors contributed equally to this work.
Agronomy 2022, 12(2), 500; https://doi.org/10.3390/agronomy12020500
Submission received: 21 December 2021 / Revised: 10 February 2022 / Accepted: 15 February 2022 / Published: 17 February 2022

Abstract

:
Soil relative water content and seed plumpness have been shown to be the key factors affecting seed germination and seedling growth of rice under direct drought cropping. It remains to be determined whether seed germination and seedling growth of water-saving and drought-resistant rice (WDR) and conventional rice with the same proportion of rice seed have the same response to soil moisture changes. The purpose of this study was to investigate the seed germination and physiological characteristics of the rice cultivars Guangliangyou 1813 (GLY-1813,indica hybrid rice) and Hanyou 73 ((HY-73), WDR) with four different specific gravities (T1, T2, T3, and T4; the rice seeds were divided into four specific gravity levels by weight using saline water, the representative specific gravities were <1.0, 1.0–1.1, 1.1–1.2 and >1.2 kg m−3, respectively), at five soil moisture content gradients (soil relative water contents of 10–20%, 20–40%, 40–60%, 60–80%, and 80–100%), under dry direct seeding conditions. The results showed that GLY-1813 had a higher germination potential, germination and seedling emergence rates, greater root dry weight, seedling dry weight, root oxidation activity, and chlorophyll content, and lower malondialdehyde (MDA) content when the soil relative water content was 20–40% or 40–60%. Cultivar HY-73 had the highest germination rate and seedling physiological activity at 20–40% relative water content; its growth vigor was better than that of GLY-1813 at the same soil moisture level. In conclusion, the soil relative water content for seed germination of HY-73 was 20–40%, which was less than that of GLY-1813. When soil relative water content was sufficient for seed germination and growth, the higher the plumpness of the rice seed, the easier it was to resist the negative effects of an adverse growth environment.

1. Introduction

Rice is an important food crop world-wide and requires a large volume of water for its cultivation. According to statistics, irrigated rice field accounts for 75% of the world’s total rice cropping area, and the irrigation water used for rice accounts for about 70–80% of total agricultural water consumption in China [1].
Yield loss due to drought and water shortage occurs every year. When rice is subjected to drought, plant cell elongation and the rate of nutrient absorption slow down, stomata close, and physiological activity, storage capacity, and productivity decrease, thus affecting grain yield and the quality of rice [2]. In recent years, with global climate and environmental changes, the shortage of supply and the demand for agricultural water resources in China have become increasingly serious [3]. Spring drought has undoubtedly made rice sowing and transplantation more challenging, which requires an alternative seeding technology [4]. Dry direct seeding technology of rice refers to sowing non-germinated rice seeds in a shallow soil layer of 1–2 cm in a field after the stubble of summer harvest crops has been removed. After sowing, the field is irrigated and the extra water drained after the seeds have absorbed a sufficient amount of water for germination and rooting.
Seedlings are irrigated at the second leaf stage in the field to promote tillering. This is a new method for rice production which saves labor and reduces costs [5,6]. Dry direct seeding technology usually includes dry sowing, dry strip sowing, and dry hole sowing, which have the advantages of water conservation, drought resistance, high mechanical efficiency, and improved labor productivity [7,8]. When rice production is threatened, dry direct seeding becomes an effective method for addressing seedling emergence in water-deficient areas; it saves on labor force requirements and reduces cost year on year [9].
Under dry direct seeding, irregular germination of seeds can cause problems, such as seed germination failure and uneven seedling emergence [10], thus affecting plant population, and reducing yield [11,12]. Seed germination is affected by both internal and external conditions [13]. When the calcium or lignin content of the seed coat is too high, it is difficult for the embryo to absorb water, which affects germination [14]. Abiotic stressors, such as salt, drought, hypoxia, and low temperature also inhibit germination [15,16]. Seed germination is extremely sensitive to drought stress, and sufficient water is necessary for seeds to break dormancy and develop from heterotrophic immature embryos to autotrophic seedlings [17]. Germination indexes, rate, seedling vigor, and seedling biomass vary under different water treatments [18]. When PEG-6000 osmotic solution is used to simulate drought stress, seed germination is strongly inhibited, and germination rate is lower at higher osmotic concentrations [19]. Flood stress forces plants into a low oxygen environment, which inhibits plant aerobic respiration, endogenous hormone synthesis, signal transduction, and normal energy metabolism, all of which restrict plant growth and development [20].
Currently, water priming, hormone priming, salt priming, nutrition priming, and other methods are often used to promote seed germination, but few studies have examined the germination of dry seeds under different soil moisture content conditions [21]. The objective of this study was to examine the effects of soil moisture content on the germination and physiological characteristics of rice seeds with different specific gravity under dry direct seeding conditions. The germination conditions and physiological characteristics were compared between a water-saving and drought resistant rice cultivar and a conventional rice cultivar sown under dry direct seeding conditions to determine the suitable soil water threshold.

2. Materials and Methods

2.1. Plant Materials and Growth Conditions

Two rice cultivars, the indica hybrid Guangliangyou 1813 (GLY-1813) and the water-saving and drought-resistant cultivar Hanyou 73 (HY-73), were used in this study. Seeds were sown in pots filled with 3.5 kg of soil. Five levels of soil moisture regime reirrigation to achieve different soil relative water contents of 10–20%, 20–40%, 40–60%, 60–80% and 80–100% of water holding capacity, respectively, were used in this study to determine the effects of soil moisture content. The experiment was carried out in an incubator (GLD-450E-4, 30/25 °C day/night temperature, 12 h photoperiod) in September 2020, at the Zhuanghang Experimental Station, Shanghai Academy of Agricultural Sciences, Shanghai, China (30°88′89″ N, 121°38′51″ E), and repeated once in November 2020.
Before the start of the experiment, five soil samples were taken randomly to measure their water content. Soil samples were placed in an aluminum box and dried in an oven at 125 °C to a constant weight. Soil water content was calculated using the formula below:
Soil   water   content   ( % ) = weight   of   moist   soil     weight   of   dried   soil weight   of   dried   soil × 100
Another five soil samples were taken to calculate the water holding capacity of the soil. The soil samples were soaked in water for one day until saturation and weighed. After that, the soil was dried in an oven at 125 °C to a constant weight. The soil water holding capacity and relative soil water content were calculated:
Soil   water   holding   capacity   ( % ) = weight   of   water   in   saturated   soil weight   of   dried   soil × 100 Relative   soil   water   content   ( % ) = soil   moisture   content soil   water   holding   capacity × 100
The experiment was carried out in pots (50 cm long, 40 cm wide, and 30 cm high). Each pot was filled with 3.5 kg of soil containing 16.6 g kg−1 of organic matter, 30.2 mg kg−1 of nitrogen, 36.5 mg kg−1 of phosphorus, and 95.6 mg kg−1 of potassium. The water content, soil water holding capacity, and relative water content of the tested soil were 7.2%, 75%, and 9.6%, respectively, before the start of the soil moisture treatment. The amount of water required to achieve each of the five soil moisture contents was 0.24–0.49 kg, 0.49–0.97 kg, 0.97–1.46 kg, 1.46–1.95 kg, and 1.95–2.44 kg, respectively.
Each pot was weighed at 3 pm every day to check if irrigation was needed and to calculate the amount of water required. The pots were watered manually to the highest relative water content of the corresponding treatments if the soil relative water content was close to the minimum value within its designated water content treatment range. During the period of this experiment, pots from different treatments were watered at the same time.
Each rice variety was divided into four specific gravity levels: T1, T2, T3 and T4 (Table 1). The specific gravity method using saline water was employed to sort the seeds as follows: Briefly, industrial salt and water were mixed into a salt solution (2 L) with specific gravities of 1.0, 1.1, and 1.2 (kg m−3). Five hundred grams of seeds of each variety were placed into clean water and each salt solution with specific gravity and agitated for 1 min. The floating rice seeds were picked up and graded as T1, T2, T3 and T4, respectively, and were then quickly washed with clean water and dried at 35 °C in an oven (Table 1).
Fifty seeds from each of the four specific gravities of each rice variety were randomly sown 0.5 cm deep in the same pot, totaling 400 seeds in a pot. The spacing between seeds in the same specific gravity was 1 cm, the spacing between different gradients was 2 cm. Each pot was assigned randomly to one of the five water content treatments; there were three replicates for each water content treatment. In total, there were 15 pots. Diseases, insects, and weeds were controlled during the experiment.

2.2. Measurements

2.2.1. Germination Indexes

The germination indexes were calculated following the conventional germination rate test method [22] and the methods commonly adopted by local farmers. Seed germination was observed and recorded from the second day after sowing. The germination indexes were calculated using the formulae listed below:
Germination   potential   ( % ) = number   of   rice   seeds   germinated   within   3   d total   number   of   seeds   tested   ( 50   grains ) × 100
Germination   rate   ( % ) = number   of   rice   seeds   germinated   within   7   d total   number   of   seeds   tested   ( 50   grains ) × 100
Seedling   rate   ( % ) = number   of   rice   seedlings   within   15   d total   number   of   seeds   tested   ( 50   grains ) × 100
Germination   index   =   number   of   seeds   germinated   in   day   t   ( 1 7   days ) the   number   of   germination   days   ( 1 7   days )
Vigor   index   = Germination   index × dry   weight   of   seedlings   in   mg   ( 7   days )

2.2.2. Morphological Indexes and Root Oxidation Activity

Five representative seedlings with consistent growth were collected from each treatment at 15 days after sowing (DAS) and rinsed carefully with running water. Shoot height, root length, and root numbers were recorded. After measuring the shoot and root lengths, they were separated, and dried at 75 °C to obtain dry weights. The ratio of root dry weight to shoot dry weight was calculated as root-shoot ratio.
Fifteen days after sowing, five seedlings from each treatment were collected and rinsed carefully with running water. Shoot height, root length, and root numbers were recorded. After measuring the length of shoots and roots with a ruler, they were separated and dried at 75 °C to obtain dry weights. The root oxidation activity (μg α-NA g−1 DW h−1) was determined by measuring the oxidation of alpha-naphthylamine (α-NA) following the method of Ramasamy et al. [23]. The wavelength absorption at 510 nm was measured using a spectrophotometer (UV2100, Unico, Side Instruments, Shanghai, China).

2.2.3. Chlorophyll Content

The chlorophyll content was determined following the method of Zou [24]. Fresh leaves (0.1 g, without midrib) were cut into pieces, ground thoroughly under dark or low light conditions in a phosphoric acid buffer (2 mL; pH = 7), and then extracted with 80% acetone until the leaf tissue turned white. The extraction solution (200 µL) was placed in a microquartz colorimetric dish/96-well plate and absorption at 663 nm and 645 nm was recorded.

2.2.4. Seed α-Amylase Activity and Seedling Soluble Total Sugar Content

At 15 days after sowing, the germinated seeds from each treatment (five seeds) were cleaned and ground in water with a mortar and pestle. The homogenate was kept at 25 °C for 15–20 min, agitated every 3 min and then centrifuged at 3000 rpm for 10 min. The supernatant was transferred to a volumetric flask and diluted with water to a final volume of 100 mL.
The reaction was initiated by adding 0.1 mL of appropriately diluted supernatant to a preheated mixture containing 1 mL of 1% (w/v) soluble starch and 0.9 mL of sodium citrate buffer (50 mM, pH 5.0). The solution was then incubated at 100 °C in a boiling water bath for 10 min. The reaction was terminated by adding 3 mL of 3, 5-dinitrosalicylic acid solution. The resulting mixture was boiled for 7 min, and then immersed in ice water. Finally, the mixture was diluted with 10 mL of deionized water and the absorbance at 540 nm was measured with a spectrophotometer (UV2100, Unico, Side Instruments, Shanghai, China). Seed α-amylase activity was calculated using the formula of Choi et al. [25].
At 15 days after sowing, rice seedlings were harvested, cleaned, and placed in an oven at 110 °C for 15 min using an air blast and kept overnight at 70 °C. Ground leaf powders (50 mg) were extracted with 4 mL of 80% alcohol in a 10 mL graduated centrifuge tube in a water bath at 80 °C for 40 min. The extracts were centrifuged, and the supernatant was collected, and the soluble total sugar content of seedlings was determined according to the method described by Chen et al. [26].

2.2.5. Content of Malondialdehyde (MDA) and Proline (PRO)

At 15 days after sowing, leaf samples (1 g) were ground to a homogenate in 10 mL 10% trichloroacetic acid with a small amount of quartz sand added. After centrifuging at 4000× g for 10 min at 4 °C, an aliquot of 3 mL of supernatant was mixed with 3 mL of 0.6% thiobiological acid in a tube with a lid, which was placed in a boiling water bath (HH-8, Lichen Technology, Shenzhen, China) for 15 min. After cooling down, the absorbance at 532 nm and 600 nm was measured using a spectrophotometer. The malondialdehyde content was calculated using the method described by Ramasamy et al. [23].
Fresh leaf samples (1 g) were extracted with 80% ethanol. Glacial acetic acid (2 mL) and 25 mg mL−1 ninhydrin reagent (2 mL) were added to the extraction solution, which was then heated in a water bath at 100 °C for 15 min. After cooling down, the absorbance at 520 nm was measured using a spectrophotometer (UV2100, Unico, Side Instruments, Shanghai, China). The proline content per milliliter of the tested sample solution was determined using a standard curve [27].

2.2.6. Activity of Peroxidase (POD) and Superoxide Dismutase (SOD)

At 15 days after sowing, 0.3 g of fresh leaf sample was ground in phosphate-buffered saline (PBS, pH 7.8). The homogenate was centrifuged at 10,500 g for 20 min at 4 °C and the supernatant was mixed with 14.5 mmol L−1 of methionine and 60 μmol L−1 of riboflavin solution. The mixture was lit for 20 min in a 4000 LX illumination incubator. After that, the absorbance at 560 nm was measured using a spectrophotometer (UV2100, Nico Company, Shanghai, China). The activity of superoxide dismutase (SOD) was determined following the method of Yang et al. [28].
At 15 days after sowing, 0.2 g of fresh leaf was ground in liquid nitrogen and extracted with 3 mL of phosphate-buffered saline (PBS, pH 7.8) in an ice bath. The extracts were centrifuged at 8000× g at 4 °C for 10 min. After that, 1.95 mL of 0.3% H2O2, 0.95 mL of 0.2% guaiacol, 1 mL of phosphate-buffered saline (PBS, pH 7.0), and 0.1 mL of supernatant were added to initiate the reaction. The absorbance at 470 nm was recorded, and peroxidase (POD) enzyme activity was calculated according to Scebba et al. [29].

2.3. Statistical Analysis

SPSS.22 was used for statistical analyses. Three-way analyses of variance (ANOVA) were carried out to determine the effects and interactions between cultivars, water content treatment, and seed specific gravity. SigmaPlot 10.0 software was used for plotting. Data from the two experiments were pooled because similar trends were shown in the two experiments (LSD = 0.05).

3. Results

There were significant differences in the measured indexes between soil moisture treatments employed in this study (Table 2). Effects of soil moisture treatments were observed for root dry weight, seedling dry weight, proline (PRO) content, malondialdehyde (MDA) content, α-amylase activity, chlorophyll a, and chlorophyll content. The effects of soil moisture treatment on SOD and POD activity were similar.

3.1. Seed Weight and Grain Shape of Rice with Different Specific Gravities

For the two rice cultivars, the higher the specific gravity was, the higher the grain weight was (Table 3). There was no significant difference in grain weight between T3 and T4, but they were significantly higher than T1 and T2 for both the two cultivars. There were no significant differences in grain length and width among different specific gravities within the same rice variety. Under the same seed specific gravity, there was no significant difference in grain weight and grain width between the two rice cultivars. The grain length of HY-73 was significantly greater than that of GLY-1813.

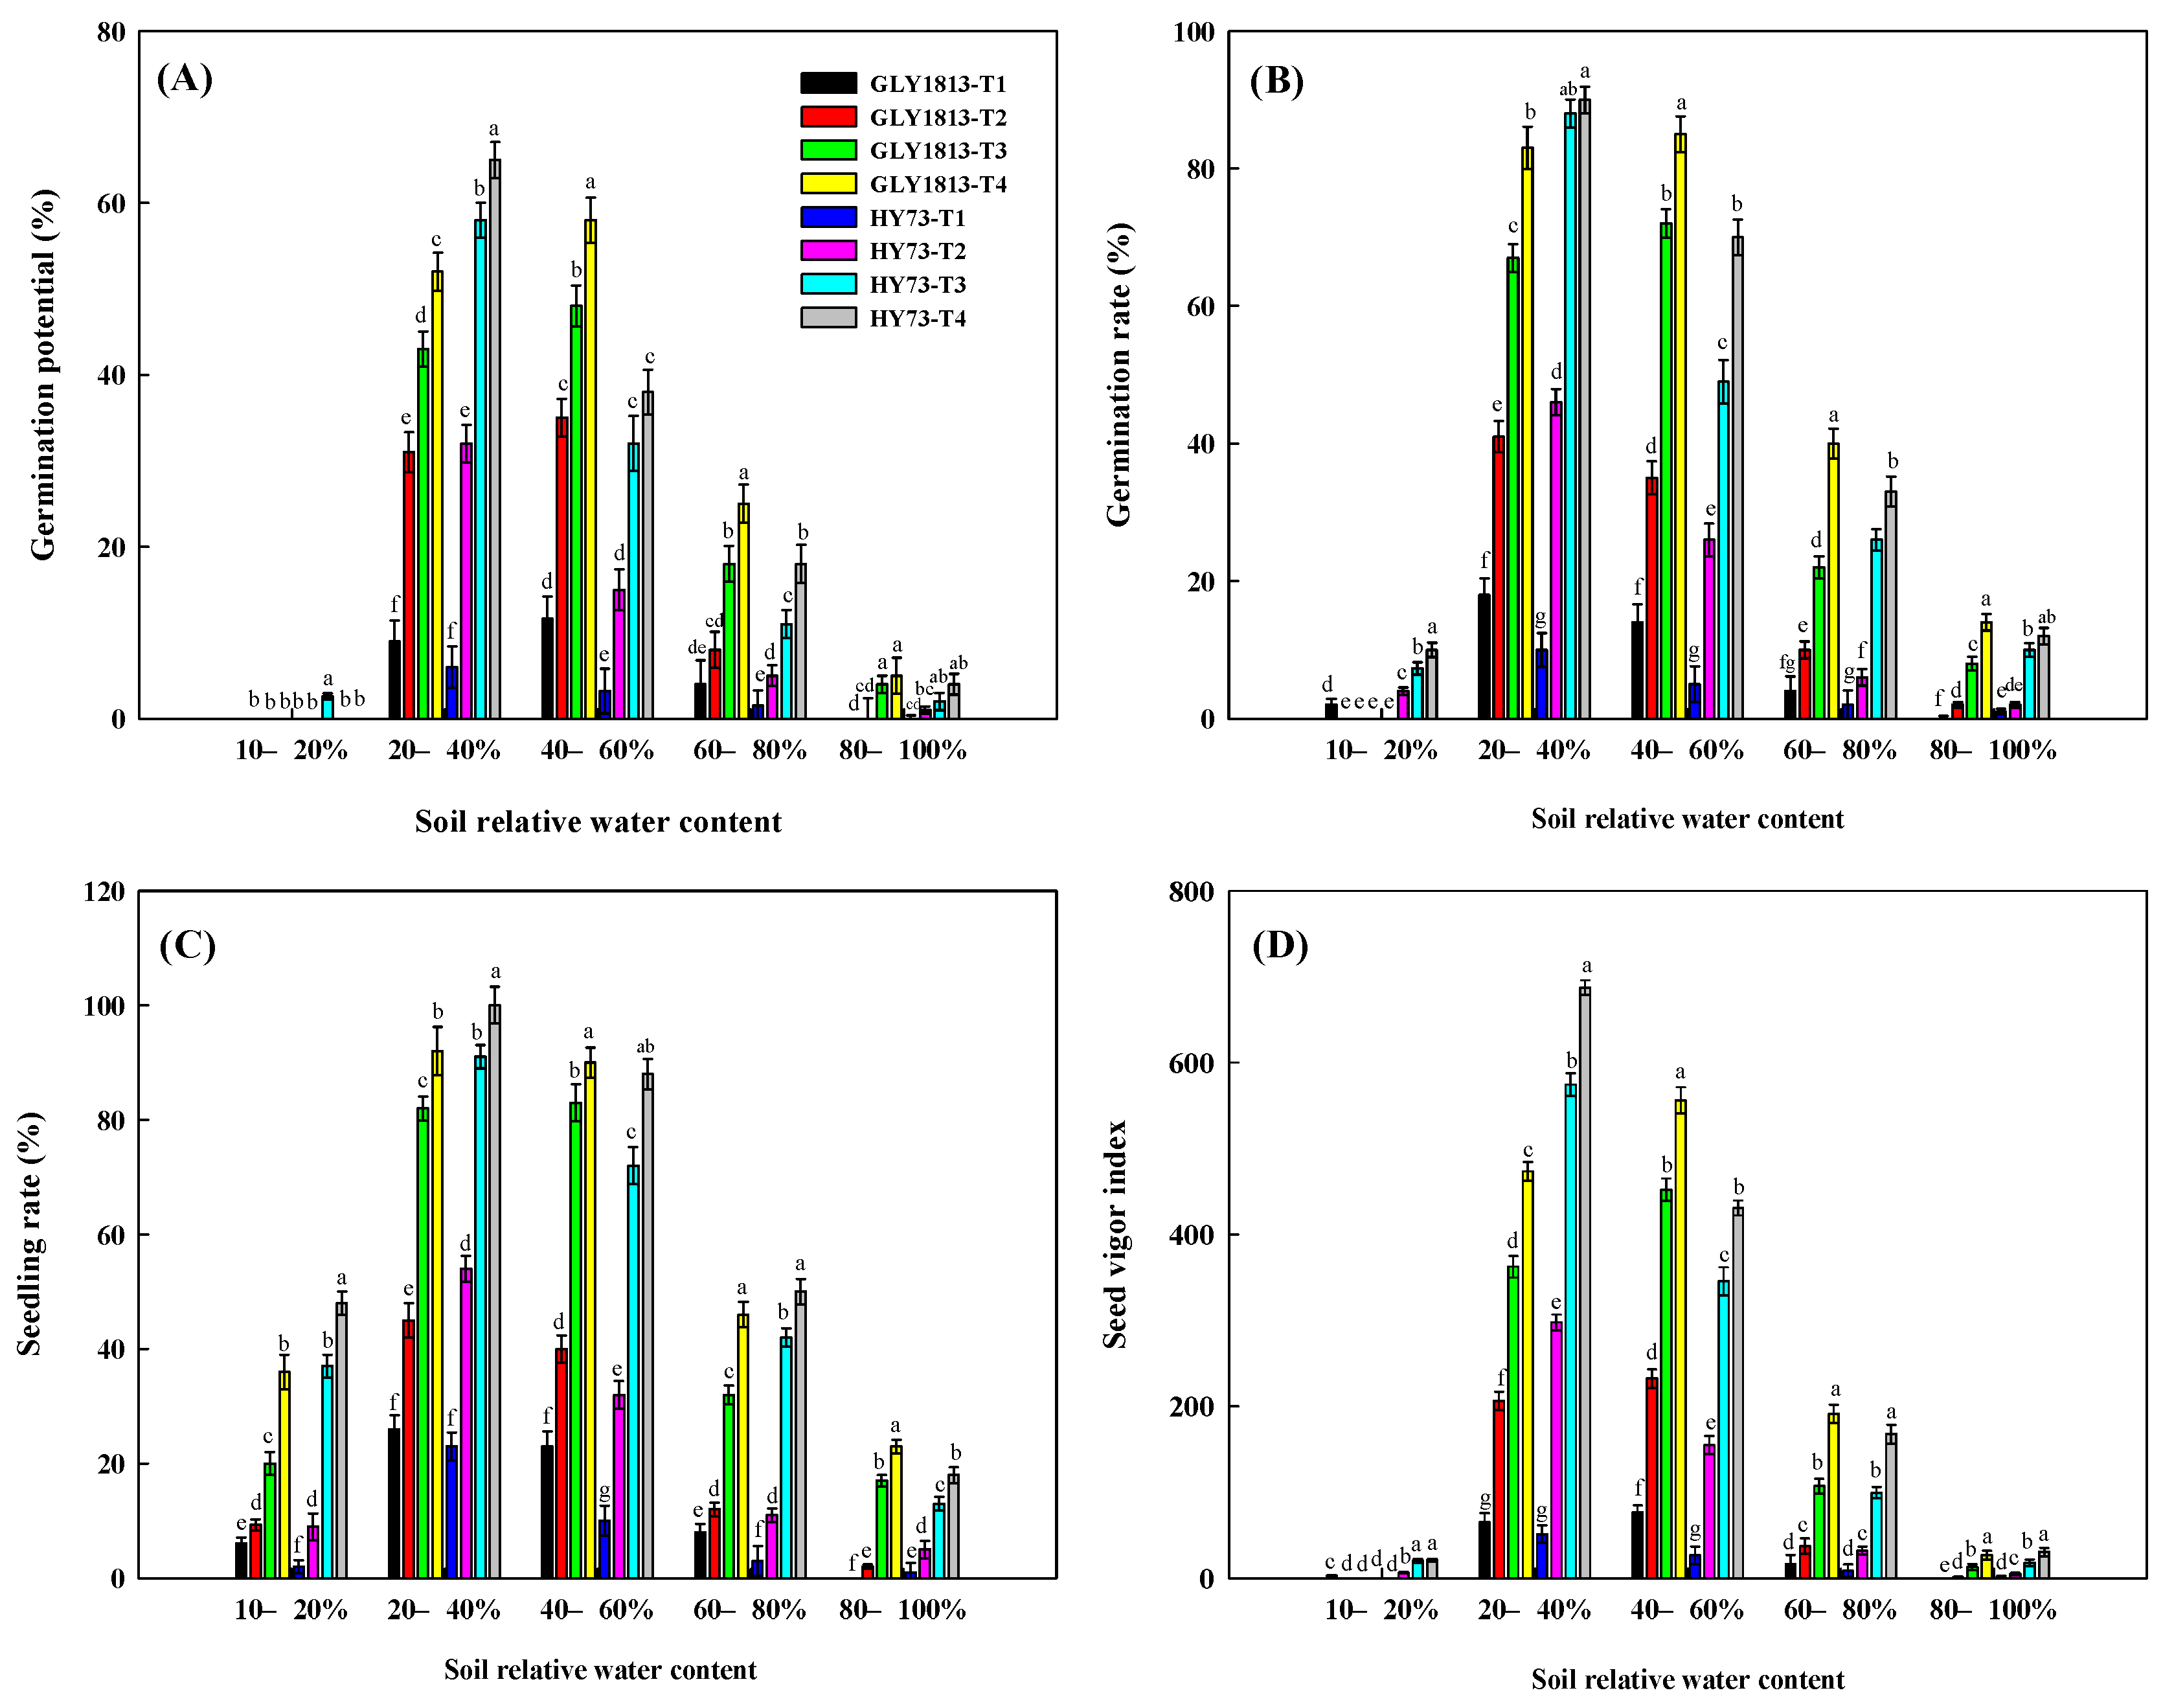
3.2. Germination Potential, Germination Rate, and Seedling Rate

The results showed that when the soil relative water content was at 20–40% and 40–60% of water holding capacity, the germination potential, germination rate, and seedling rate of GLY-1813 were higher than those under other water treatments (Figure 1A–C). The germination potential, germination rate, and seedling rate of HY-73 were the greatest when the soil moisture content was 20–40%; they then gradually decreased with increasing soil moisture. The germination potential, germination rate, and seedling rate of seeds with different specific gravity were as follows: T4 > T3 > T2 > T1 in both the two cultivars. The optimum soil moisture content for seed germination was 40–60% for GLY-1813 and 20–40% for HY-73.

3.3. Rice Seed Vigor Index

The rice seed vigor index of GLY-1813 was the highest when the soil relative water content was at 40–60%; the seed vigor index of HY-73 was the highest at the soil moisture content of 20–40% (Figure 1D). Under the same water treatment, there was a significant difference between specific gravity conditions; the seed vigor index increased with specific gravity. When soil relative water content was less than 40%, the seed vigor of HY-73 was greater than that of GLY-1813. However, the seed vigor of GLY-1813 was greater than that of HY-73 when the soil relative water content was greater than 40%.

3.4. Morphological Index (Root Number, Root Length, and Shoot Length)

The number and length of roots of the variety GLY-1813 were the greatest when the soil relative water content was at 40–60% (Table 4). For HY-73, the number and length of roots were the greatest when the soil relative water content was at 20–40%.
Under the same soil moisture condition, root number, root length, and shoot length increased with the seed specific gravity in both the two cultivars. When the soil relative water content was at 20–40%, the root number, root length, and shoot length of HY-73 were higher than that of GLY-1813.

3.5. Shoot Dry Weight, Root Dry Weight, and Root-Shoot Ratio

Soil moisture stress had significant effects on the root and shoot dry weights and the root-shoot ratio in both cultivars. The root and shoot dry weights of rice cultivar HY-73 were generally higher than that of GLY-1813 (Figure 2A,B). Root dry weights of both cultivars were the lowest when soil relative water content was more than 80%. The shoot dry weight of the two cultivars was lower when the soil was too dry (soil relative water content at 10–20%), or too wet (soil relative water content at 80–100%) (Figure 2B). When the soil relative water content was 20–40%, shoot dry weight was higher in HY-73 compared to GLY-1813 with similar specific gravity (Figure 2B). The root-shoot ratio was the largest at the soil relative water content of 10–20% for both the two cultivars (Figure 2C).

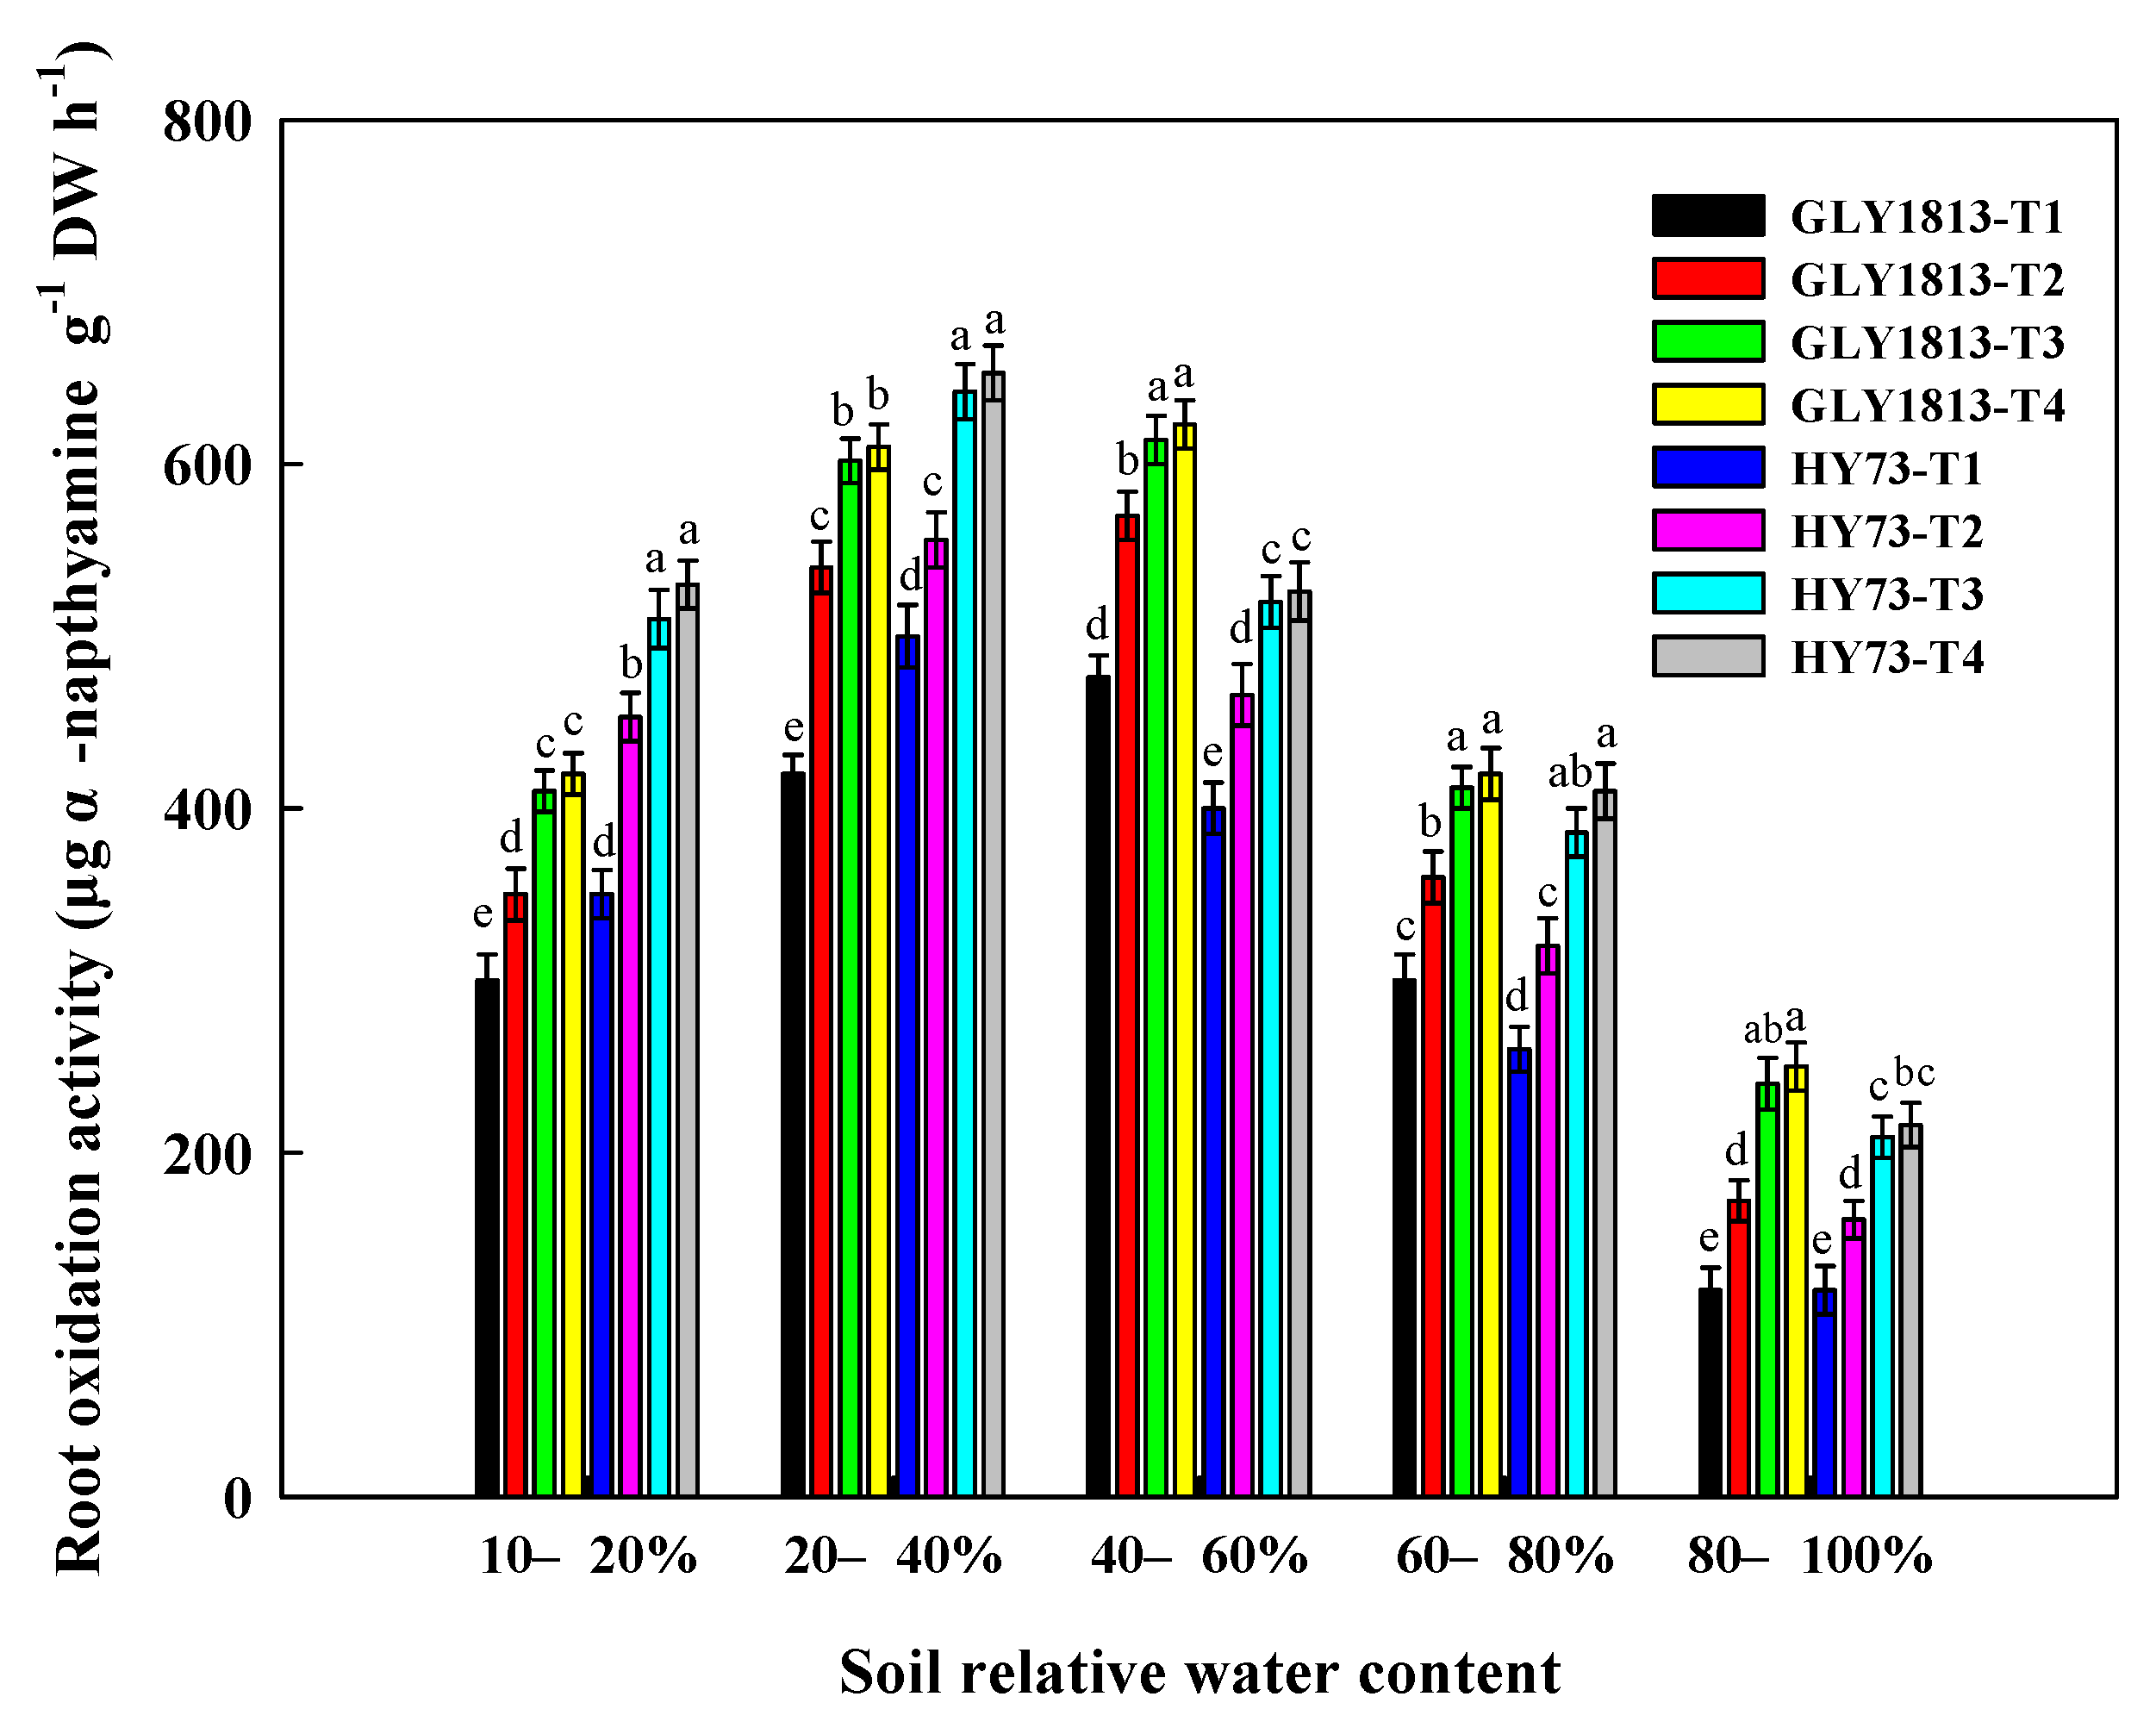
3.6. Root Oxidation Activity

The root oxidation activity was the highest at a soil water content of 40–60% for GLY-1813 and at 20–40% for HY-73 (Figure 3). The root oxidation activity increased with seed specific gravity; the root oxidation activities of T3 and T4 were significantly greater than that of T1 and T2. The root oxidation activity of HY-73 was greater than that of GLY-1813 when grown at soil water content of 10–40%.

3.7. Chlorophyll Content

The content of chlorophyll a in GLY-1813 was the highest when grown at a soil water content of 40–60% (Figure 4A,B). When the soil relative water content was between 20–40%, the contents of chlorophyll a and chlorophyll b in HY-73 were greater than that in GLY-1813. Under the same soil water conditions, the higher the seed specific gravity, the greater was the chlorophyll content in the seedling leaves. While the contents of chlorophyll a and chlorophyll b were greater in HY-73 than in GLY-1813 when the soil relative water content was less than 40%, they were lower in HY-73 compared to GLY-1813 when the soil relative water content was higher than 40% (Figure 4A,B).

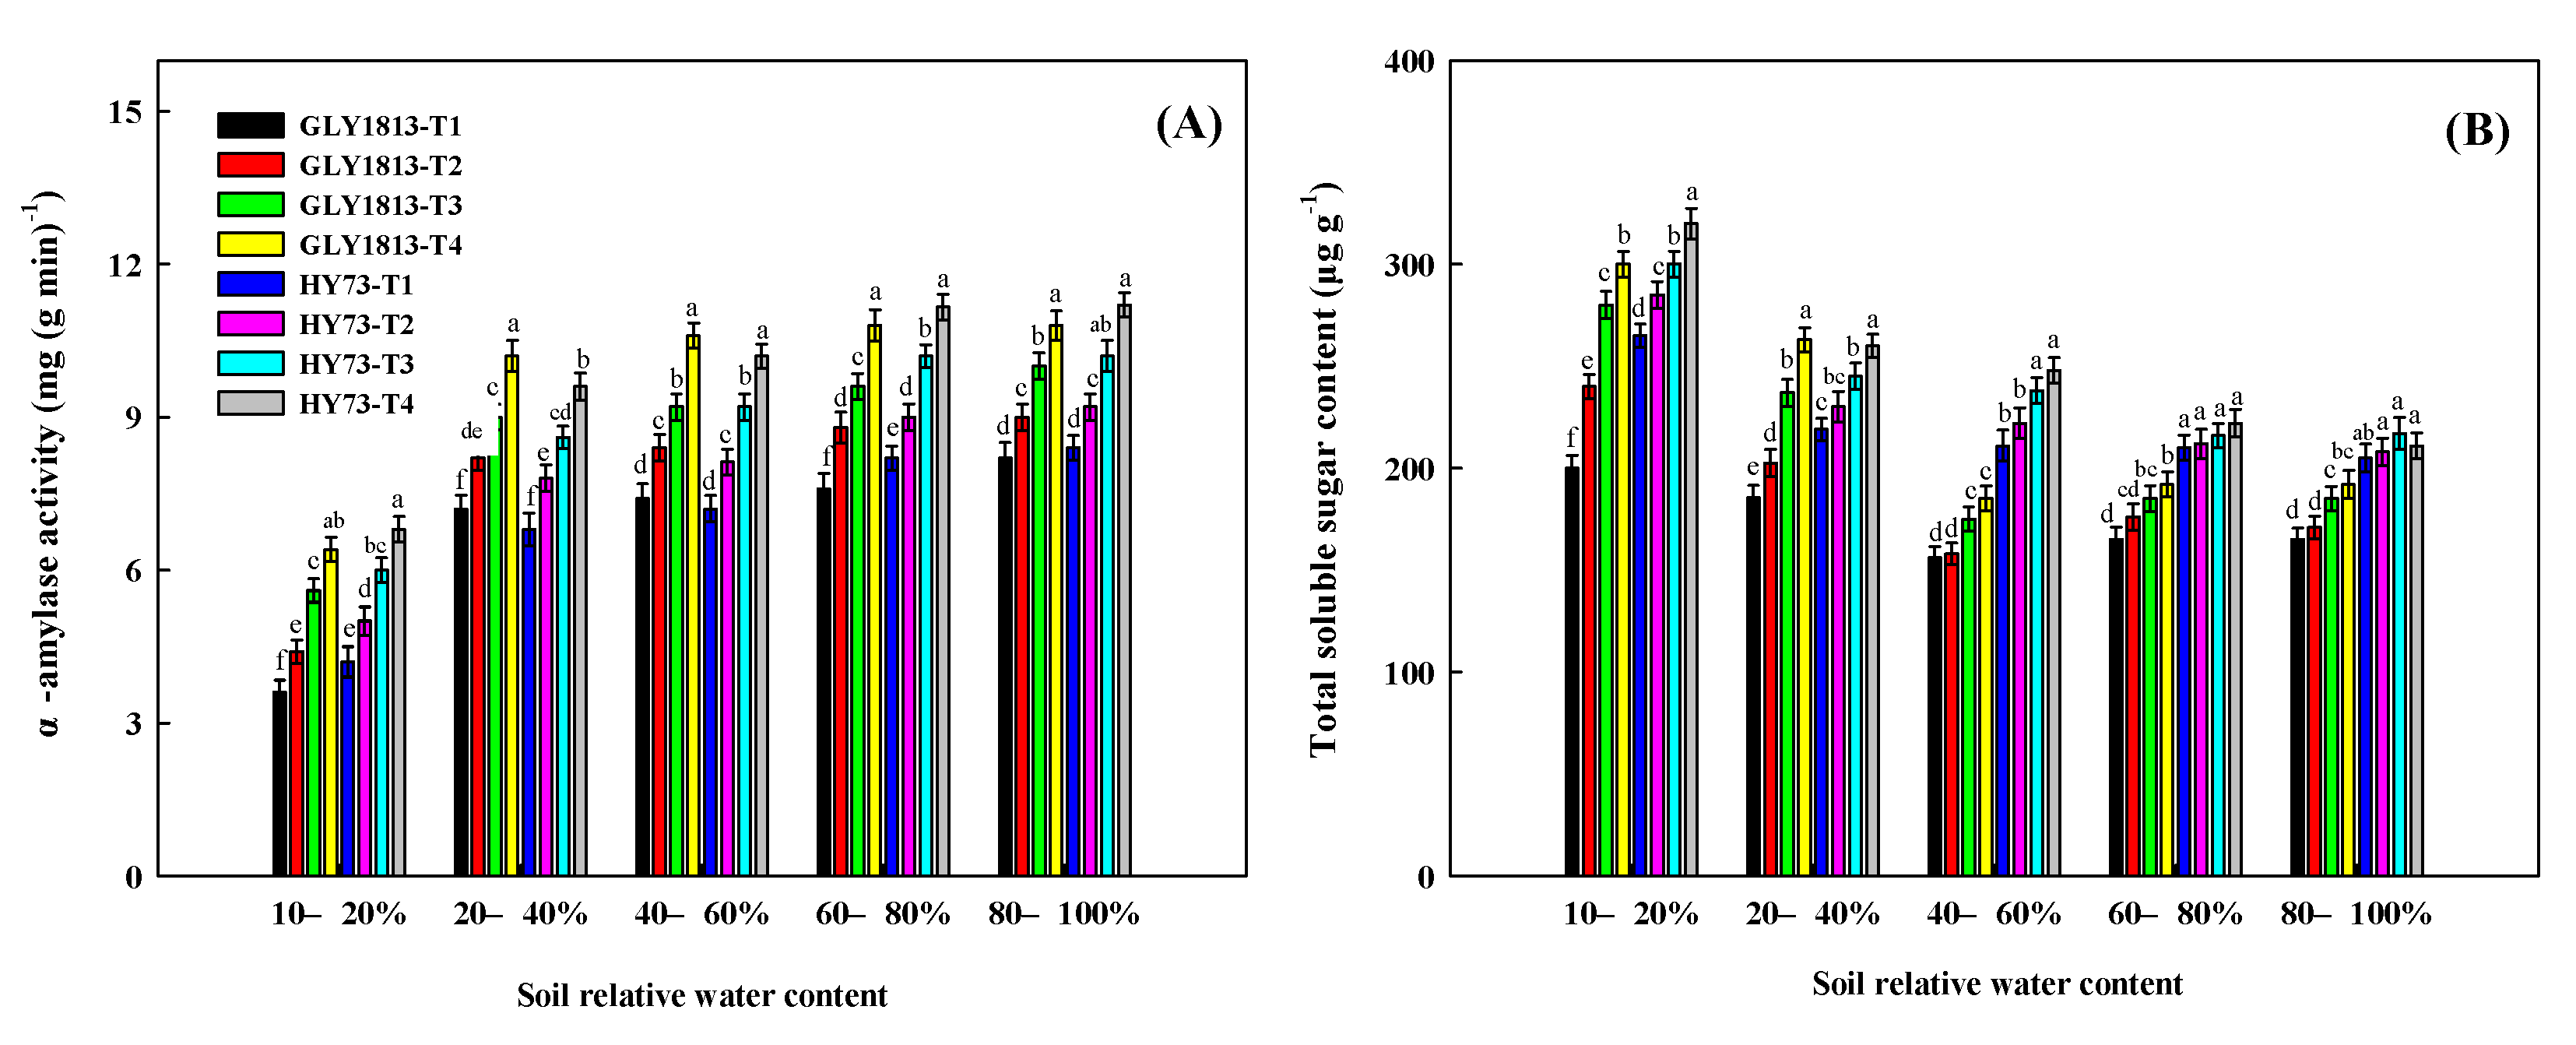
3.8. α-Amylase Activity and Total Soluble Sugar Content

For both of the two varieties, the α-amylase activity was the lowest when the soil relative water content was at 10–20% (Figure 5A). It levelled off when the soil relative water content was higher than 20%. Under the same soil water conditions, the α-amylase activity increased significantly with increase in seed weight. There was no significant difference in α-amylase activity between the two varieties.
The total soluble sugar content of the two varieties was higher when the soil relative water content was at 10–20%, compared to other water content treatments (Figure 6B). The total soluble sugar content increased significantly with increase in seed specific gravity for both the two varieties. With increase in soil relative water content, the soluble sugar content of the two varieties decreased gradually. The total soluble sugar content of HY-73 was significantly higher than that of GLY-1813 when soil relative water content was greater than 40% (Figure 5B).

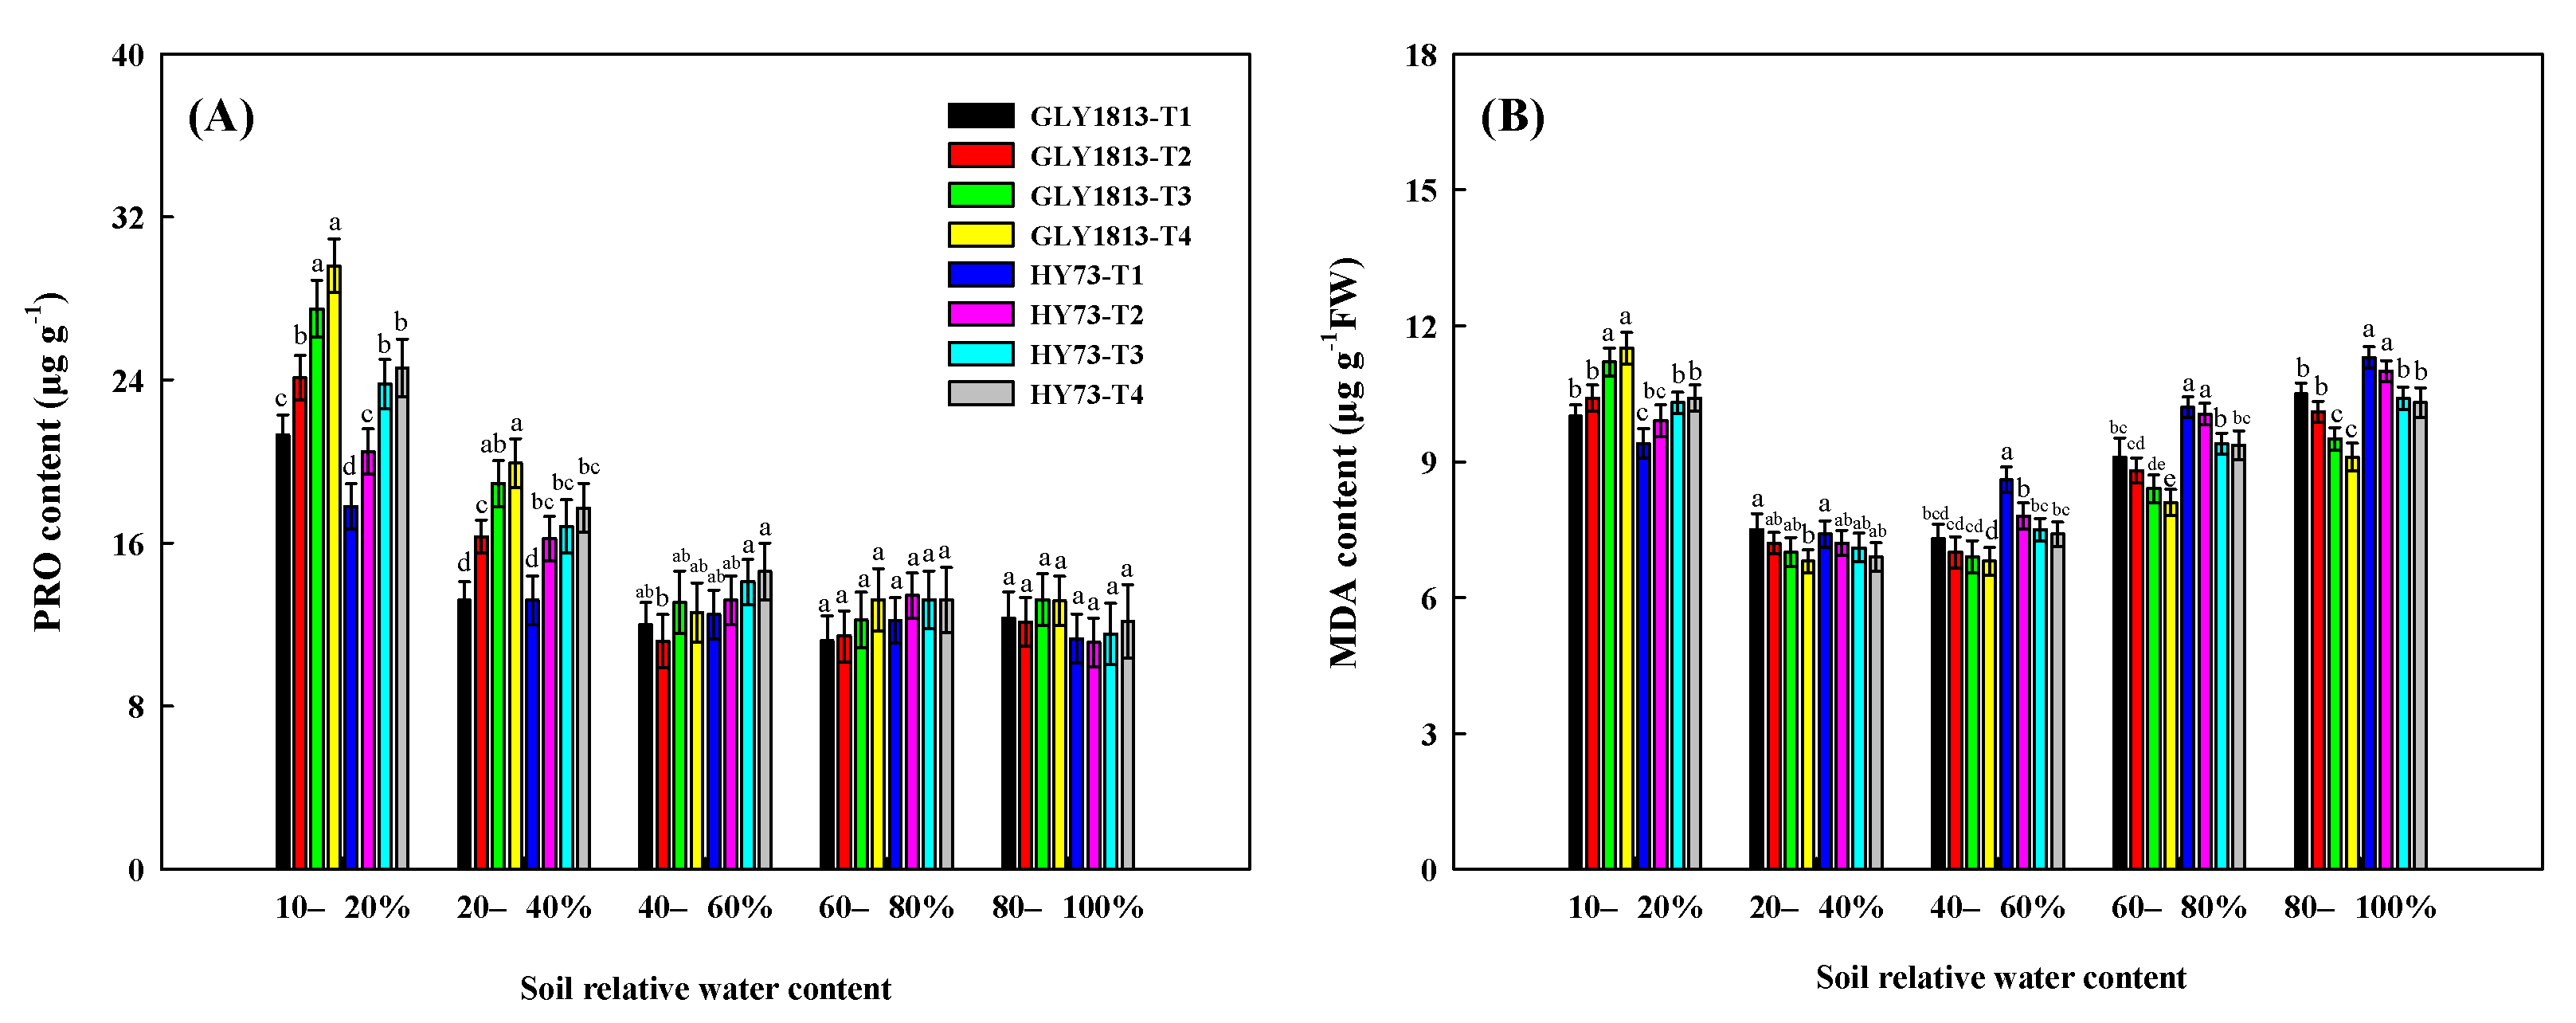
3.9. Proline and MDA Content

The proline content of seedlings of the two varieties was the highest at a soil relative water content of 10–20% (Figure 6A). There were significant differences in the proline content within each variety for different specific gravities when grown at the soil water content between 10 and 40%; proline content increased significantly with increase in seed specific gravity for each cultivar. There was no significant difference in proline content between the two cultivars or among different specific gravity levels when the soil relative water content was greater than 40%.
For both the two varieties, the MDA content was lower when the soil relative water content was between 20–60% (Figure 6B). The MDA content in both the two cultivars decreased significantly with increase in seed specific gravity when the soil relative water content was greater than 20%. The MDA content of HY-73 was significantly higher than that of GLY-1813 with the same specific gravity when the soil relative water content was greater than 40%.

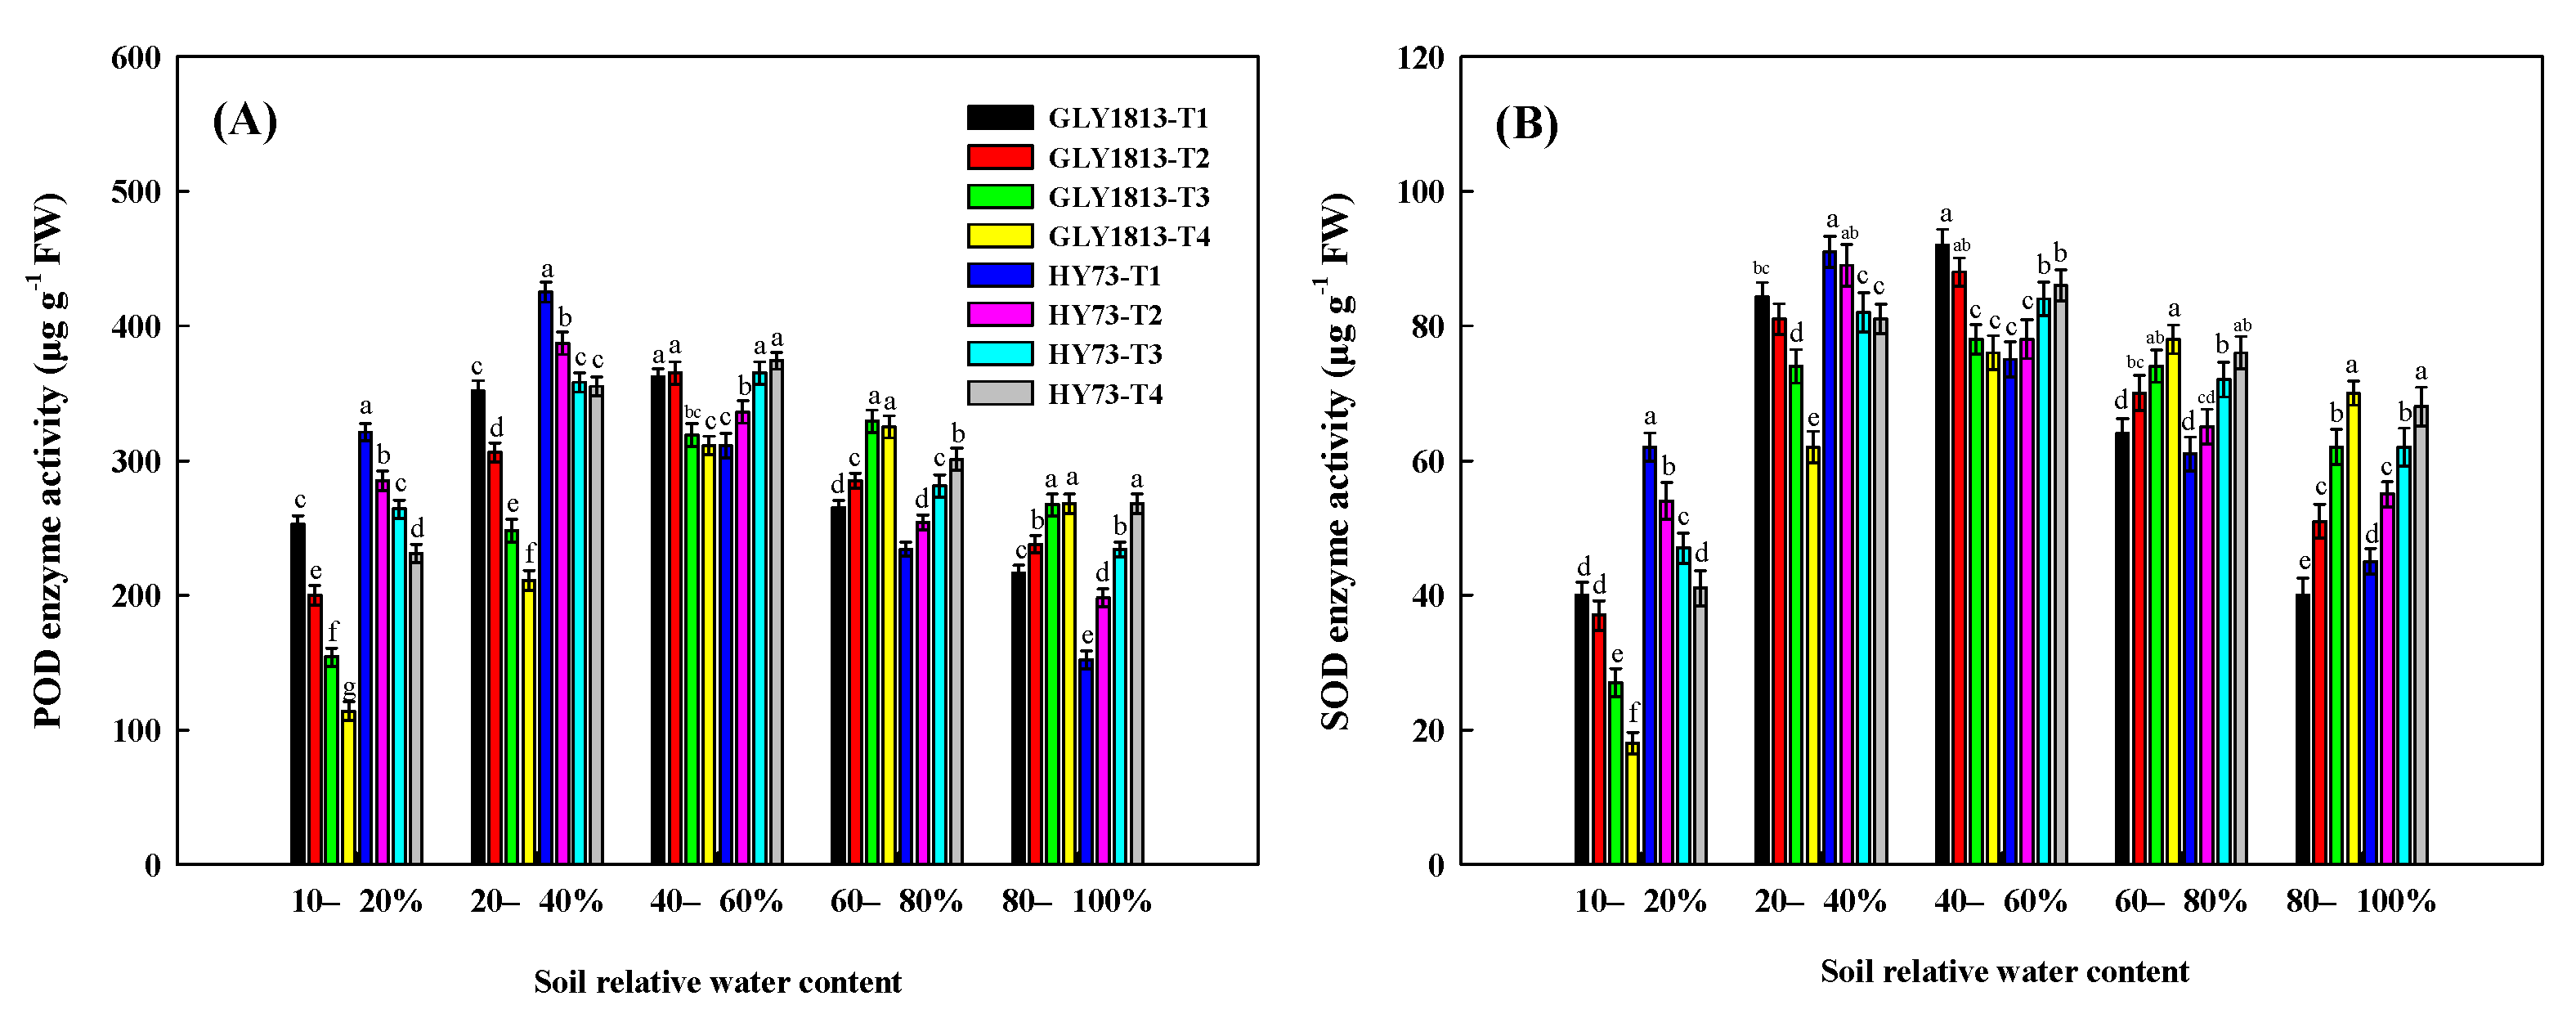
3.10. POD and SOD Enzyme Activities

The POD and SOD enzyme activities were the highest at the soil relative water contents of 40–60% and 20–40% for GLY-1813 and HY-73, respectively (Figure 7A,B). While the activities of POD and SOD decreased with increase in the specific gravity when the soil relative water content was at 10–40%, they increased with increase in the seed specific gravities when the soil relative water content was greater than 60% for both GLY-1813 and HY-73. The POD and SOD activities of HY-73 were significantly higher than those of GLY-1813 at the same specific gravity at the soil relative water content of 10–40%.

4. Discussion

4.1. The Effect of Soil Relative Water Content on the Germination of Rice Seeds

With global climate change, dry direct seeding of rice has become more and more important due to its capacity to enhance water conservation, drought resistance, labor saving, and cost reduction [30]. The direct seeding of rice has become a widely adopted method of water-conserving cultivation in China. Under direct dry sowing conditions, drought resistant rice cultivars germinate very well, which is crucial to achieve a high yield. The water-saving and drought-resistant rice (WDR) cultivars developed recently by the Shanghai Agricultural Biological Genetics Center have shown outstanding performance in large-scale rice production systems. Compared with conventional rice cultivars, WDR cultivars have a stronger germination ability and higher yield under dry direct seeding conditions [31]. Soil moisture is an important factor affecting the germination of rice seeds, and different rice cultivars and seeds with different specific gravity have different requirements for soil moisture [32].
This study showed that the traditional cultivar GLY-1813 had high germination and seedling dry weight when the soil relative water content was 40–60%; the WDR HY-73 cultivar had a high germination rate when the relative soil water content was 20–40% (Figure 1). The germination rate of T2, T3, and T4 of HY-73 was better than that of GLY-1813 when grown under the same soil moisture conditions, which indicated that HY-73 was more suitable for dry direct seeding. The plumper the seed, the more nutrients are contained in the grain [33]. It was observed in this study that the higher the specific gravity was, the greater were the thousand-grain weight, germination potential, germination rate, and seedling rate. This could be because rice seeds with a higher specific gravity contain more nutrients which can promote germination [34].

4.2. The Influence of Soil Relative Water Content on the Growth and Development of Rice Shoots

Rice dry matter accumulation is in the storage form of sugar or starch, and this is the basis of yield [35]. Our results showed that the root and seedling dry weight of the two varieties were higher when the soil relative moisture content was 20–40% and 40–60%. Under the same soil moisture conditions, the root dry weight, seedling dry weight, root length, and seedling height of HY-73 were higher than those of GLY-1813; the magnitude of differences increased with drought severity. These results indicated that compared with GLY-1813, HY-73 was a better fit for dry cultivation. Under the same soil moisture conditions, root number, root length, shoot length, and biomass increased with increase in seed specific gravity, which indicated that heavier seeds have greater growth potential. These findings are consistent with the study of Tang et al. [36], who showed that rice seedlings with lower specific gravity had fewer tillers and seedling growth. The root-shoot ratio, the ratio of root dry weight to shoot dry weight, reflects the carbon allocation between underground and aboveground tissues [37]. In the present study, the root-shoot ratio of the two varieties was the greatest when the soil relative water content was in the lowest range (10–20%); it was the least in the highest water content range (80–100%). The effect of specific gravity also decreased with increase in the soil relative water content (Figure 2), indicating that the allocation of carbon had reached a state of equilibrium once the minimal soil moisture content required for seedling growth was met.

4.3. The Effects of Soil Relative Water Content on Physiological Characteristics

The seed vigor index, root oxidation activity, POD and SOD enzyme activities, and chlorophyll a and b content of the two cultivars were higher when the soil relative water content was at 20–40% and 40–60%, compared to other water regimes (Figure 7). POD and SOD can eliminate the active oxygen produced within organisms under stress conditions, and their activity reflects changes in the metabolism of plants [38]. The present study showed that the activities of POD and SOD of rice seeds with low specific gravity were higher in GLY-1813 when the soil relative water content was between 10–60% (Figure 7). These results indicate that seedlings developed from seeds with lower specific gravity have higher metabolism. Similarly, in HY-73, when the soil relative water content was between 10–40%, seedlings developed from seeds with a lower specific gravity showed stronger metabolic activity.
MDA content is an indicator of peroxidation in plant cell membranes which is positively related to damage to cell membranes [39]. Our results showed that the MDA content was the lowest when the soil relative water content was at 20–40% and 40–60% for GLY-1813 and HY-73, respectively (Figure 6B). These results suggest that the optimum soil moisture content range is 40–60% for GLY-1813, and 20–40% for HY-73. Chlorophyll can absorb, transform, and transfer light energy [40]. Previous studies have shown that the stability of the thylakoid membranes, the absorption of light energy, as well as the photosynthetic rate of rice, decreased when plants were subjected to saline-alkali osmotic stress [31]. The present study showed that the contents of chlorophyll a and chlorophyll b were higher when the relative water content of soil was between 20–60% for both the two cultivars; higher or lower soil water content was not conducive to the accumulation of chlorophyll (Figure 4). Proline and soluble sugar accumulation is a mechanism of plants by which they respond and adapt to abiotic stressors, such as drought, salinity, etc. [41,42]. The content of proline and soluble sugar in seedlings was greatest when the relative soil moisture content was at 10–20%, compared to other water regimes (Figure 6A). These findings suggest that when the soil water content was below 20%, both GLY-1813 and HY-73 were exposed to drought stress. α-amylase, also known as ‘dextrinase’, transforms carbohydrates in the endosperm into sugars during germination and transports them to the embryonic tissues [43], which impacts various indexes in rice [44]. α-amylase activity was the lowest for both GLY-1813 and HY-73 when the plants were under drought stress (soil water content at 10–20%) (Figure 5A). Interestingly, α-amylase activity increased with seed specific gravity in both GLY-1813 and HY-73. These results suggest that rice seeds with a greater specific gravity are better able to break starch into sugars and enable growing seedlings to adjust osmotically to drought stress under dry direct seeding conditions.

5. Conclusions

Soil relative water content significantly affected the seed germination and seedling growth of the two rice cultivars; the optimum soil water content range for seed germination and seedling growth was 40–60% and 20–40% for GLY-1813 and HY-73, respectively. Overall, HY-73 performed better compared to GLY-1813, which indicated that HY-73 had better drought resistance and more prominent germination characteristics. Seeds with greater specific gravity showed higher α-amylase activity, germination potential, germination rate, root dry weight, seedling dry weight, root oxidation activity, chlorophyll content, and soluble sugar content across the soil water content levels.

Author Contributions

Conceptualization, D.H. and J.B.; methodology, K.Z.; formal analysis, D.H.; investigation, D.L. and J.T.; resources, X.Y. and L.L.; data curation, D.H. and Y.W.; writing—original draft preparation, D.H.; writing-review and editing, L.M. and M.I.A.R.; visualization, D.H. and J.B.; supervision, Q.B. and G.L.; project administration, J.B.; funding acquisition, X.Y. and L.L. All authors have read and agreed to the published version of the manuscript.

Funding

This research was funded by the Technology System of Rice Industry in Shanghai: Grant NO. 2021(03); Excellent team of Shanghai Academy of Agricultural Sciences: Grant NO. 2022(001).

Data Availability Statement

The data presented in this study are available on request from the first author and co-first author.

Acknowledgments

The authors would like to thank the Rice Physiology Research Group, College of Agriculture, Yangzhou University for their experimental support.

Conflicts of Interest

The authors declare no conflict of interest.

References

  1. Wang, Z.; Zhang, W.; Beebout, S.S.; Zhang, H.; Liu, L.; Yang, J.; Zhang, J. Grain yield, water and nitrogen use efficiencies of rice as influenced by irrigation regimes and their interaction with nitrogen rates. Field Crops Res. 2016, 193, 54–69. [Google Scholar] [CrossRef]
  2. Farooq, M.; Siddique, K.H.; Rehman, H.; Aziz, T.; Lee, D.-J.; Wahid, A. Rice direct seeding: Experiences, challenges and opportunities. Soil Tillage Res. 2011, 111, 87–98. [Google Scholar] [CrossRef]
  3. Mcdonald, A.; Riha, S.; Duxbury, J.; Steenhuis, T.; Lauren, J. Water balance and rice growth responses to direct seeding, deep tillage, and landscape placement: Findings from a valley terrace in Nepal. Field Crops Res. 2006, 95, 367–382. [Google Scholar] [CrossRef]
  4. Kumar, V.; Ladha, J.K.; Direct Seeding of Rice. Recent Developments and Future Research Needs. Adv. Agron. 2011, 111, 297–413. [Google Scholar]
  5. Ohno, H.; Banayo, N.P.; Bueno, C.; Kashiwagi, J.-I.; Nakashima, T.; Iwama, K.; Corales, A.M.; Garcia, R.; Kato, Y. On-farm assessment of a new early-maturing drought-tolerant rice cultivar for dry direct seeding in rainfed lowlands. Field Crops Res. 2018, 219, 222–228. [Google Scholar] [CrossRef]
  6. Sen, S.; Kaur, R.; Das, T.; Raj, R.; Shivay, Y. Impacts of herbicides on weeds, water productivity, and nutrient-use efficiency in dry direct-seeded rice. Paddy Water Environ. 2021, 19, 227–238. [Google Scholar] [CrossRef]
  7. Wang, D.Y.; Ye, C.; Xu, C.; Wang, Z.; Chen, S.; Chu, G.; Zhang, X. Soil nitrogen distribution and plant nitrogen utilization in direct-seeded rice in response to deep placement of basal fertilizer-nitrogen. Rice Sci. 2019, 26, 404–415. [Google Scholar]
  8. Virk, A.L.; Farooq, M.S.; Ahmad, A.; Khaliq, T.; Rehmani, M.I.A.; Haider, F.U.; Ejaz, I. Effect of seedling age on growth and yield of fine rice cultivars under alternate wetting and drying system. J. Plant Nutr. 2021, 44, 1–15. [Google Scholar] [CrossRef]
  9. Zhang, H. Study on the Yield Formation of Dry Direct-seeding Rice and Techniques of its High Yield Cultivation. J. Yangzhou Univ. (Agric. Life Ences Ed.) 1988, 9, 21–26. [Google Scholar] [CrossRef]
  10. Fukai, S. Rice cultivar requirements for direct seeding in rainfed lowlands. In Direct Seeding: Research Strategies and Opportunities; International Rice Research Institute: Los Baños, Philippines, 2002; pp. 257–270. [Google Scholar]
  11. Gill, G.; Humphreys, E.; Kukal, S.; Walia, U. Effect of water management on dry seeded and puddled transplanted rice. Part 1: Crop performance. Field Crops Res. 2011, 120, 112–122. [Google Scholar] [CrossRef]
  12. Du, X.-B.; Chen, C.; Luo, L.-J.; Xia, L.-P.; Kang, L.; Chen, Y.-H.; Yu, X.-Q. Long-term no-tillage direct seeding mode for water-saving and drought-resistance rice production in rice-rapeseed rotation System. Rice Sci. 2014, 21, 210–216. [Google Scholar] [CrossRef]
  13. Xu, X.; Fang, J.; Wang, W.; Guo, J.; Chen, P.; Cheng, J.; Shen, Z. Expression of a bacterial α-amylase gene in transgenic rice seeds. Transgenic Res. 2008, 17, 645–650. [Google Scholar] [CrossRef] [PubMed]
  14. Zhang, Z.; Wu, J.; Xi, Y.; Zhang, L.; Gao, Q.; Wang-Pruski, G. Effects of autotoxicity on seed germination, gas exchange attributes and chlorophyll. fluorescence in melon seedlings. J. Plant Growth Regul. 2021, 1–11. [Google Scholar] [CrossRef]
  15. Bita, C.; Gerats, T. Plant tolerance to high temperature in a changing environment: Scientific fundamentals and production of heat stress-tolerant crops. Front. Plant Sci. 2013, 4, 273. [Google Scholar] [CrossRef] [Green Version]
  16. Golldack, D.; Li, C.; Mohan, H.; Probst, N. Tolerance to drought and salt stress in plants: Unraveling the signaling networks. Front. Plant Sci. 2014, 5, 151. [Google Scholar] [CrossRef] [PubMed] [Green Version]
  17. Khaneh, Z. Germination, seed reserve utilization and seedling growth rate of five crop species as affected by salinity and drought stress. Life Sci. J. 2012, 1, 9. [Google Scholar]
  18. Sun, Y.Y.; Sun, Y.J.; Wang, M.T.; Li, X.Y.; Guo, X.; Hu, R.; Ma, J. Effects of seed priming on germination and seedling growth under water stress in rice. Acta Agron. Sin. 2010, 36, 1931–1940. [Google Scholar] [CrossRef]
  19. Yu, X.; Xu, Z.; Zhang, S.; Lv, S.; Fu, Y.; Hong, S.; Yin, M. Effect of PEG-6000 simulation drought stress on physiological characteristics of Guangfeng medicinal yam plantlets. J. Chin. Med. Mater. 2016, 39, 11–15. [Google Scholar]
  20. Herrera, A. Responses to flooding of plant water relations and leaf gas exchange in tropical tolerant trees of a black-water wetland. Front. Plant Sci. 2013, 4, 106. [Google Scholar] [CrossRef] [Green Version]
  21. He, D.; Yang, P. Proteomics of rice seed germination. Front. Plant Sci. 2013, 4, 246. [Google Scholar] [CrossRef] [Green Version]
  22. Jun-Yu, H.E.; Ren, Y.F.; Zhu, C. Effects of cadmium stress on seed germination, seedling growth and seed amylase activities in rice (Oryza sativa). Rice Sci. 2008, 15, 319–325. [Google Scholar]
  23. Ramasamy, S.; Ten Berge, H.F.M.; Purushothaman, S. Yield formation in rice in response to drainage and nitrogen application. Field Crops Res. 1997, 51, 65–82. [Google Scholar] [CrossRef]
  24. Zou, Q. Experimental Manual on Plant Physiology; Chinese Agriculture Press: Beijing, China, 2020; pp. 127–130. [Google Scholar]
  25. Choi, Y.H.; Kobayashi, M.; Sakurai, A. Endogenous gibberellin A1 level and α-amylase activity in germinating rice seeds. J. Plant Growth Regul. 1996, 15, 147–151. [Google Scholar] [CrossRef]
  26. Chen, X.Y.; Ling, M.S.; Gao, Z.H. Effect of water stress on soluble sugars and free proline content in leaves of rice. J. Henan Agric. Sci. 2006, 12, 26–30. [Google Scholar]
  27. Zhi, M.; Li, X. Improvement on the method for measuring proline content. Plant Physiol. J. 2005, 3, 355–357. [Google Scholar]
  28. Yang, X.; Gan, L.; Ruan, H.; Du, X.; Li, K.; Chen, F. Influence of nitrogen on the activities of POD and SOD in rice seedlings and the incidence of rice blast disease. J. Fujian Agric. For. Univ. 2011, 40, 8–12. [Google Scholar]
  29. Scebba, F.; Sebastiani, L.; Vitagliano, C. Activities of antioxidant enzymes during senescence of Prunus armeniaca leaves. Biol. Plant. 2001, 44, 41–46. [Google Scholar] [CrossRef]
  30. Pathak, H.; Sankhyan, S.; Dubey, D.S.; Bhatia, A.; Jain, N. Dry direct-seeding of rice for mitigating greenhouse gas emission: Field experimentation and simulation. Paddy Water Environ. 2013, 11, 593–601. [Google Scholar] [CrossRef]
  31. Xu, Y.; Ge, J.; Tian, S.; Li, S.; Nguy-Robertson, A.L.; Zhan, M. Effects of water-saving irrigation practices and drought resistant rice variety on greenhouse gas emissions from a no-till paddy in the central lowlands of china. Sci. Total Environ. 2015, 505, 1043–1052. [Google Scholar] [CrossRef]
  32. Bui, E.N. Soil salinity: A neglected factor in plant ecology and biogeography. J. Arid. Environ. 2013, 9214–9225. [Google Scholar] [CrossRef]
  33. Mahakham, W.; Sarmah, A.K.; Maensiri, S.; Theerakulpisut, P. Nanopriming technology for enhancing germination and starch metabolism of aged rice seeds using phytosynthesized silver nanoparticles. Sci. Rep. 2017, 7, 8263. [Google Scholar] [CrossRef] [PubMed]
  34. Danjo, T.; Inosaka, M. On the tissues of scutellum concerning with absorption of nutrients of endosperm in rice and oat seeds. Jpn. J. Crop Sci. 2008, 29, 100–102. [Google Scholar] [CrossRef]
  35. Puteh, A.B.; Mondal, M.; Ismail, M.; Latif, M.A. Grain sterility in relation to dry mass production and distribution in rice (Oryza sativa L.). BioMed Res. Int. 2014, 2014, 302179. [Google Scholar] [CrossRef] [PubMed] [Green Version]
  36. Tang, L.; Zhu, Y.; Hannaway, D.; Meng, Y.; Liu, L.; Chen, L.; Cao, W. RiceGrow: A rice growth and productivity model. J. Life Sci. 2009, 57, 83–92. [Google Scholar] [CrossRef] [Green Version]
  37. Ma, S.C.; Li, F.M.; Xu, B.C.; Huang, Z. Effect of lowering the root/shoot ratio by pruning roots on water use efficiency and grain yield of winter wheat. Field Crops Res. 2010, 115, 158–164. [Google Scholar] [CrossRef]
  38. Shah, K.; Nahakpam, S. Heat exposure alters the expression of SOD, POD, APX and CAT isozymes and mitigates low cadmium toxicity in seedlings of sensitive and tolerant rice cultivars. Plant Physiol. Biochem. 2012, 57, 106–113. [Google Scholar] [CrossRef]
  39. Hu, J.P.; Zhao, X.P.; Ma, X.Z.; Wang, Y.; Zheng, L.J. Effects of cigarette smoke on aerobic capacity and serum MDA content and SOD activity of animal. Int. J. Clin. Exp. Med. 2014, 7, 4461. [Google Scholar]
  40. Wang, J.; Lu, W.; Tong, Y.; Yang, Q. Leaf morphology, photosynthetic performance, chlorophyll fluorescence, stomatal development of lettuce (Lactuca sativa L.) exposed to different ratios of red light to blue light. Front. Plant Sci. 2016, 7, 250. [Google Scholar] [CrossRef] [Green Version]
  41. Hayashi, Y.; Aratake, S.; Itoh, T. Dry and wet prolines for asymmetric organic solvent-free aldehyde–aldehyde and aldehyde–ketone aldol reactions. ChemInform 2007, 9, 957–959. [Google Scholar]
  42. Xu, Z.; Jiang, Y.; Zhou, G. Response and adaptation of photosynthesis, respiration, and antioxidant systems to elevated CO2 with environmental stress in plants. Front. Plant Sci. 2015, 6, 701. [Google Scholar] [CrossRef] [Green Version]
  43. Magneschi, L.; Perata, P. Rice germination and seedling growth in the absence of oxygen. Ann. Bot. 2009, 103, 181–196. [Google Scholar] [CrossRef] [PubMed] [Green Version]
  44. Nakata, M.; Fukamatsu, Y.; Miyashita, T.; Hakata, M.; Kimura, R.; Nakata, Y.; Kuroda, M.; Yamaguchi, T.; Yamakawa, H. High temperature-induced expression of rice α-amylases in developing endosperm produces chalky grains. Front. Plant Sci. 2017, 8, 2089. [Google Scholar] [CrossRef] [PubMed] [Green Version]
Figure 1. Effects of soil relative water content on germination potential (A), germination rate (B), seedling formation rate (C) and seedling vigor index (D) of two rice cultivars (GLY-1813 and HY-73) with different specific gravities. T1, T2, T3 and T4 represent the four seed specific gravities for each of the two test cultivars, <1.0, 1.0–1.1, 1.1–1.2, and >1.2 (kg m−3), respectively. 10–20%, 20–40%, 40–60%, 60–80% and 80–100% are the five soil relative water contents. Data from the two experiments were pooled. Vertical bars represent ± standard error of the mean. Different letters above the bars indicate significant differences at alpha = 0.05. There were six replicates.
Agronomy 12 00500 g001
Figure 2. Effects of soil relative water content on root dry weight (A), shoot dry weight (B) and root shoot ratio (C) of two rice cultivars with different specific gravities. T1, T2, T3 and T4 represent the four seed specific gravities for each of the two test cultivars, <1.0, 1.0–1.1, 1.1–1.2, and >1.2 (kg m−3), respectively. 10–20%, 20–40%, 40–60%, 60–80% and 80–100% are the five soil relative water contents. Data from the two experiments were pooled. Vertical bars represent ± standard error of the mean. Different letters above the bars indicate significant differences at alpha = 0.05. There were six replicates.
Agronomy 12 00500 g002
Figure 3. Effects of soil relative water content on root oxidation activity of the two rice cultivars with different specific gravities. T1, T2, T3 and T4 represent the four seed specific gravities for each of the two test cultivars, <1.0, 1.0–1.1, 1.1–1.2, and >1.2 (kg m−3), respectively. 10–20%, 20–40%, 40–60%, 60–80% and 80–100% are the five soil relative water contents. Data from the two experiments were pooled. Vertical bars represent ± standard error of the mean. Different letters above the bars indicate significant differences at alpha = 0.05. There were six replicates.
Agronomy 12 00500 g003
Figure 4. Effects of soil relative water content on chlorophyll A (A) and chlorophyll B (B) contents of the two rice cultivars with different specific gravities. T1, T2, T3 and T4 represent the four seed specific gravities for each of the two test cultivars, <1.0, 1.0–1.1, 1.1–1.2, and >1.2 (kg m−3), respectively. 10–20%, 20–40%, 40–60%, 60–80% and 80–100% are the five soil relative water contents. Data from the two experiments were pooled. Vertical bars represent ± standard error of the mean. Different letters above the bars indicate significant differences at α = 0.05. There were six replicates.
Agronomy 12 00500 g004
Figure 5. Effects of soil relative water content on α-amylase activity (A) and total soluble sugar content (B) of two rice cultivars with different specific gravities. T1, T2, T3 and T4 represent the four seed specific gravities for each of the two test cultivars, <1.0, 1.0–1.1, 1.1–1.2, and >1.2 (kg m−3), respectively. 10–20%, 20–40%, 40–60%, 60–80% and 80–100% are the five soil relative water contents. Data from the two experiments were pooled. Vertical bars represent ± standard error of the mean. Different letters above the bars indicate significant differences at α = 0.05. There were six replicates.
Agronomy 12 00500 g005
Figure 6. Effects of soil relative water content on the contents of PRO (A) and MDA (B) of two rice cultivars with different specific gravities. T1, T2, T3 and T4 represent the four seed specific gravities for each of the two test cultivars, <1.0, 1.0–1.1, 1.1–1.2, and >1.2 (kg m−3), respectively. 10–20%, 20–40%, 40–60%, 60–80% and 80–100% are the five soil relative water contents. Data from the two experiments were pooled. Vertical bars represent ± standard error of the mean. Different letters above the bars indicate significant differences at alpha = 0.05. There were six replicates.
Agronomy 12 00500 g006
Figure 7. Effects of soil relative water content on POD (A) and SOD (B) activities of two rice seedlings with different specific gravity. T1, T2, T3 and T4 represent the four seed specific gravities for each of the two test cultivars, <1.0, 1.0–1.1, 1.1–1.2, and >1.2 (kg m−3), respectively. 10–20%, 20–40%, 40–60%, 60–80% and 80–100% are the five soil relative water contents. Data from the two experiments were pooled. Vertical bars represent ± standard error of the mean. Different letters above the bars indicate significant differences at alpha = 0.05. There were six replicates.
Agronomy 12 00500 g007
Table 1. Classification standard of two cultivars of rice.
Seed LabelSalt Water Proportion (kg m−3)Seed Specific Gravity (kg m−3)Screening Criteria
T11<1Float in clear water
T21.11–1.09Sinks in clear water and rise in salt water with a specific gravity of 1.1
T31.21.1–1.19Sinks in salt water with a specific gravity of 1.1 and floats in salt water with a specific gravity of 1.2
T4-->1.2Sinks in brine with a specific gravity of 1.2
Table 2. F-values from three-way ANOVA for germination potential (GP), germination rate (GR), seedling rate (SR), vigor index (VI), root shoot ratio (RSR), root oxidation activity (ROA), pod enzyme activity (POD), and total soluble sugar content (TSC) among cultivar, water moisture treatment, and seed specific gravity.
Source of VariationdfGPGRSRVIRSRROAPODTSC
Cultivar (C)128.5 **NSNS192.4 **6.9 *NS10.2 **31.2 **
Treatment (T)4413.1 **353.2 **236.8 **71744.1 **137.3 **109.69 **31.9 **21.5 **
Specific Gravity (S)3189.3 **235.7 **285.2 **39686.8 **5.4 **25.61 **NS7.7 **
C × T418.3 **10.2 **4.4 **4383.7 **NS6.1 **12.4 **NS
C × S3NSNSNS288.2 **NSNSNSNS
T × S1237.3 **33.1 **13.0 **8300.1 **4.9 **NS4.6 **NS
C × T × S122.3 *2.0 *NS535.0 **NSNSNSNS
NS: not significant at alpha = 0.05; *: significant at alpha = 0.05; **: significant at alpha = 0.01. There were six replicates.
Table 3. The differences in the thousand-grain weight and grain size between different specific gravities of the two rice varieties.
CultivarSeed Specific
Gravity
Grain
Weight
Grain LengthGrain Width
(kg m−3)(mg)(mm)(mm)
GLY-1813T122.19 ± 0.39 c8.21 ± 0.21 b2.31 ± 0.31 a
T224.37 ± 0.38 b8.72 ± 0.63 b2.31 ± 0.33 a
T326.44 ± 0.29 a8.80 ± 0.75 b2.32 ± 0.42 a
T427.15 ± 0.31 a8.85 ± 0.59 b2.32 ± 0.29 a
HY-73T122.21 ± 0.21 c9.21 ± 0.85 a2.46 ± 0.21 a
T225.25 ± 0.16 b9.23 ± 0.71 a2.46 ± 0.16 a
T327.20 ± 0.12 a9.36 ± 0.98 a2.50 ± 0.13 a
T428.15 ± 0.28 a9.35 ± 0.76 a2.49 ± 0.15 a
Note: T1, T2, T3 and T4 represent the four seed specific gravity levels of the two test cultivars, <1.0, 1.0–1.1, 1.1–1.2 and >1.2 (kg m−3), respectively. Data were pooled from the two experiments. Values with different letters are statistically different at alpha = 0.05 (n = 6). There were six replicates.
Table 4. Effects of soil relative water content on seedling root number, root length and shoot length of two rice varieties with different specific gravities.
Soil Relative Water ContentCultivarSeed
Specific Gravity
Root Number Root Length (cm)Shoot Length
(cm)
10–20%GLY-1813T13.6 ± 0.21 a4.0 ± 0.21 b1.7 ± 0.25 d
T23.6 ± 0.19 a4.1 ± 0.17 b4.0 ± 0.32 c
T34.0 ± 0.22 a5.5 ± 0.19 a5.8 ± 0.35 b
T44.0 ± 0.23 a5.5 ± 0.18 a7.8 ± 0.52 a
HY-73T13.6 ± 0.27 a4.0 ± 0.29 b2.6 ± 0.28 c
T23.8 ± 0.26 a4.5 ± 0.33 b3.5 ± 0.25 b
T34.0 ± 0.33 a6.2 ± 0.31 a4.0 ± 0.27 b
T44.0 ± 0.32 a6.5 ± 0.34 a8.0 ± 0.23 a
20–40%GLY-1813T15.2 ± 0.19 c4.5 ± 0.26 c15.2 ± 0.39 d
T25.4 ± 0.16 c9.2 ± 0.45 b20.0 ± 0.51 c
T36.1 ± 0.23 c10.0 ± 0.47 b22.0 ± 0.43 c
T47.3 ± 0.22 b15.0 ± 0.35 a28.0 ± 0.45 a
HY-73T16.2 ± 0.32 c13.1 ± 0.42 b23.6 ± 0.33 c
T26.9 ± 0.33 b13.3 ± 0.44 b25.0 ± 0.28 b
T38.3 ± 0.42 a14.1 ± 0.43 a26.5 ± 0.32 b
T48.5 ± 0.46 a15.3 ± 0.51 a28.0 ± 0.33 a
40–60%GLY-1813T16.4 ± 0.25 c11.6 ± 0.28 c12.8 ± 0.46 c
T27.3 ± 0.24 b13.0 ± 0.32 b22.0 ± 0.56 b
T38.4 ± 0.22 a13.2 ± 0.34 b24.0 ± 0.65 b
T48.6 ± 0.21 a16.0 ± 0.48 a30.0 ± 0.74 a
HY-73T15.4 ± 0.31 c5.5 ± 0.36 c18.8 ± 0.53 d
T26.5 ± 0.33 b11.0 ± 0.49 b27.0 ± 0.44 c
T37.2 ± 0.35 a12.0 ± 0.53 b28.0 ± 0.35 b
T47.4 ± 0.34 a16.0 ± 0.45 a30.0 ± 0.34 a
60–80%GLY-1813T15.1 ± 0.23 c9.8 ± 0.32 b10.0 ± 0.42 c
T26.2 ± 0.24 b11.0 ± 0.44 b11.0 ± 0.38 c
T36.4 ± 0.22 b10.3 ± 0.46 b24.0 ± 0.58 b
T46.3 ± 0.25 b15.0 ± 0.45 a25.0 ± 0.56 b
HY-73T15.4 ± 0.36 c5.1 ± 0.42 d9.9 ± 0.36 c
T26.9 ± 0.32 a7.9 ± 0.45 c12.5 ± 0.43 c
T37.2 ± 0.36 a7.6 ± 0.49 c26.4 ± 0.49 b
T47.3 ± 0.33 a10.5 ± 0.45 b30.0 ± 0.45 a
80–100%GLY-1813T14.8 ± 0.18 b4.1 ± 0.32 c4.0 ± 0.32 d
T26.4 ± 0.19 a4.2 ± 0.36 c6.5 ± 0.45 c
T36.5 ± 0.22 a5.0 ± 0.41 b6.5 ± 0.43 c
T46.6 ± 0.21 a7.0 ± 0.55 b13.0 ± 0.56 b
HY-73T14.6 ± 0.29 b3.2 ± 0.23 c3.8 ± 0.53 d
T25.4 ± 0.33 b3.5 ± 0.19 c6.8 ± 0.47 c
T36.8 ± 0.38 a6.5 ± 0.32 b6.9 ± 0.49 c
T46.8 ± 0.36 a10.1 ± 0.33 a19.0 ± 0.64 a
Note: T1, T2, T3 and T4 represent the four seed specific gravity levels of the two test cultivars, the representative specific gravity is <1.0, 1.0–1.1, 1.1–1.2 and >1.2 (kg m−3), respectively. 10–20%, 20–40%, 40–60%, 60–80% and 80–100% represent the soil relative water content of the five gradients, respectively. Data are averages observed for the two replicate studies because they showed the same tendencies; values with different letters show that the indicators of the same variety and different specific gravity of rice were significantly different at alpha = 0.05 (n = 6).
Publisher’s Note: MDPI stays neutral with regard to jurisdictional claims in published maps and institutional affiliations.

