Article

Assessment of Soil Redistribution Following Land Rehabilitation with an Apple Orchard in Hilly Regions of Central Iran

by
Shamsollah Ayoubi
1,
Ameneh Mohammadi
1,
Mohammad Reza Abdi
2,
Farideh Abbaszadeh Afshar
3,
Lin Wang
4,5,* and
Mojtaba Zeraatpisheh
4,5,*
1
Department of Soil Science, College of Agriculture, Isfahan University of Technology, Isfahan 84156-83111, Iran
2
Department of Physics, Faculty of Science, University of Isfahan, Isfahan 81747-73441, Iran
3
Department of Soil Science, College of Agriculture, University of Jiroft, Jiroft 78671-61167, Iran
4
College of Geography and Environmental Science, Henan University, Kaifeng 475004, China
5
Henan Key Laboratory of Earth System Observation and Modeling, Henan University, Kaifeng 475004, China
*
Authors to whom correspondence should be addressed.
Agronomy 2022, 12(2), 451; https://doi.org/10.3390/agronomy12020451
Submission received: 30 December 2021 / Revised: 31 January 2022 / Accepted: 8 February 2022 / Published: 11 February 2022
(This article belongs to the Special Issue Land Management Impacts on Soil Properties and Soil Erosion Processes)

Abstract

:
This study was executed to explore soil redistribution and soil quality changes induced by land degradation and then rehabilitation by orchard plantation in different slope positions in a semi-arid region in central Iran. A total of 72 surface soil samples (0–30 cm) were collected from three land uses (natural rangelands, dryland farming, and apple orchards) in four slope positions (shoulder, backslope, footslope, and toeslope). The soil physicochemical properties and magnetic parameters were measured, and soil redistribution was determined in the selected soil samples using the 137Cs technique. The results showed that rangeland degradation and, subsequently, rainfed cultivation, led to a significant decline in the soil quality indicators, such as soil organic matter (SOM), total nitrogen (TN), available potassium (Kava), and available phosphorous (Pava), thus incurring further soil loss, as determined by the 137Cs technique. Conversely, the conversion and rehabilitation of drylands to apple orchards cultivated on the contour terraces improved soil quality significantly and decreased soil loss (p < 0.05) and soil quality grade (p < 0.01). Additionally, the findings indicated that slope positions relative to land use change had a reasonable impact on the variability of soil properties and soil loss and deposition. The results of 137Cs analysis showed that the drylands had the highest soil loss (185.3 t ha−1 yr−1) and maximum sedimentation (182. 5 t ha−1 yr−1) in the shoulder and footslope positions, respectively. The random forest model applied between 137Cs inventory and soil properties indicated that calcium carbonate equivalent (CCE), TN, Pava, Kava, and bulk density (ρb) could explain 75% of the total variability in 137Cs inventory with high R2 (0.94) and low RMSE (111.29). Magnetic measurements have shown great potential as a cost-effective and fast method for assessing soil redistribution in hilly regions, as confirmed by the findings of the 137Cs analysis, which agreed well with the magnetic susceptibility at low frequency (χlf). Overall, the results confirmed that restoring abandoned dryland by orchard cultivation may improve soil quality and diminish soil loss in the semi-arid region of Iran. However, further research is required to assess other aspects of the ecosystem affected by this restoration.

Graphical Abstract

1. Introduction

Population expansion and increasing demand for land resources have placed significant pressure on ecosystems, such as natural rangelands, due to overgrazing in pursuit of more fresh meals. As a consequence, inappropriate cultivation practices such as plowing along the slope gradient accelerate soil erosion, increase flood risk, and cause natural capital losses [1]. Rangeland degradation significantly reduces soil quality and incurs further soil loss. Several studies confirmed that overgrazing reduces soil quality indicators, including soil organic matter [2,3,4], soil nutrients [3,5], soil porosity [6], soil infiltration [6], and biomass production [5]. However, it increases bulk density [2,5], runoff, and soil loss [7,8].
Soil erosion is a natural incident that affects all landforms, especially undulating landscapes and hilly regions [9,10], which could impose enormous pressures on natural and agricultural ecosystems [11]. Slope steepness has a vital role in the degree of degradation or restoration of soil properties following rangeland degradation and soil erosion [2]. The hillslope positions have contributed significantly to the soil detachment variability at the landscape scale [12]. Therefore, knowledge about soil redistribution in the landscape is crucial for landowners and decision makers to choose the most proper management practices [13].
Numerous approaches have been developed to evaluate the quantity of soil loss or deposition at the landscape scale. The most important approaches for estimating soil loss/deposition are classified into various categories: direct measures, physical-based models, empirical models, conceptual models/hybrid models [14,15,16], and isotopic radionuclide models [17,18,19]. Isotopic techniques based on the use of fallout radionuclides such as Caesium-137 (137Cs) have already been used successfully to estimate soil loss and deposition, especially over a mid-term period [18,20,21,22]. Zapata [23] and Lacoste et al. [24] showed that the 137Cs can be a helpful approach to use tracing soil redistribution and erosion in different regions. Moreover, the 137Cs inventory demonstrated a high correlation with soil properties and field measurement [12,24]. However, since the radionuclide method is costly and labor-consuming, new methods, such as magnetic susceptibility, have attracted the attention of researchers [9,25,26].
In recent decades, a significant portion of natural rangelands in central Iran, including the southern Isfahan province, has suffered from overgrazing and undergone dryland farming [2,27]. Changes of natural rangeland to dryland farming have led to several threats, such as severe soil erosion, calamitous floods accompanied by destructive consequences, and a decrease in the region’s biodiversity. In some degraded areas and drylands, rehabilitation by apple orchards is being applied as an alternative land use. Some investigations have been conducted to determine the effects of rehabilitation of degraded lands on improving the ecosystem quality [28,29,30,31]. For instance, studying the rehabilitation of the degraded pasture in Minas Gerais, Brazil, by a secondary forest, Schiavon Lopes et al. [6] showed that the afforestation of the degraded land led to higher soil–water infiltration, larger macroporosity, and greater carbon storage compared to the pasture areas. To assess the impacts of land use conversion on soil quality indicators, soil quality indices (SQIs) are a widely used and simple method of quantifying soil quality [32,33,34]. The SQI assessment may help increase our knowledge of soil ecosystems and enable more effective management.
So far, few investigations have been conducted on the effects of the rehabilitation by orchards in arid and semi-arid regions. Knowledge about the effects of the land use change, especially orchard cultivation, on soil quality and soil redistribution in steep slopes is required for more efficient land use management. Therefore, the major objectives of this study were to (i) explore the effects of the land use change and the orchard cultivation on some soil quality parameters and magnetic properties in different slope positions, (ii) evaluate soil redistribution following the land use change using the 137Cs technique, and (iii) examine relationships between soil quality properties and quantity of soil redistribution and erosion measured by 137Cs in the semi-arid region in the south of Isfahan province, central Iran.

2. Materials and Methods

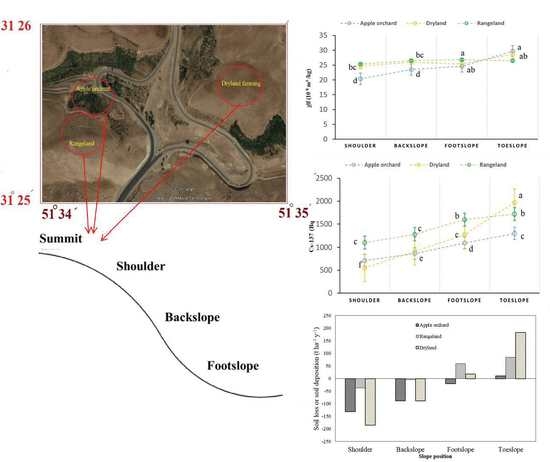
2.1. Description of the Study Area

The study area is located in central Iran in the southern part of Isfahan province, between 31°25′ and 31°26′ N latitudes, and between 51°34′ and 51°35′ E longitudes (Figure 1). The average elevation of the studied site is 2400 m a.s.l. The mean annual precipitation and the mean annual temperature are 400 mm and 15.6 °C, respectively. The soil moisture and temperature regimes of the study area are Xeric and Mesic, respectively. Moreover, soils are classified as Typic Calcixerepts and Typic Xerorthents, according to Soil Survey Staff [35]. The studied hills have similar parent materials, including dissected, quaternary alluvial deposits for three land uses (i.e., natural rangeland, dryland farming, and apple orchards). Specifically, the major geological formation units in the study area consist of limestone, dolomite, marl, conglomerate, and silt- and sand- stone (Figure 1c).
In the study area, the erosive evidence, including rill, sheet erosions, and the appearance of lime spots (carbonate calcium parent materials) in some places on the surface has been observed. As the study areas are a local site and cannot be illustrated by satellite images with high resolutions (for example, Landsat imagery 30 m × 30 m), there is no historical satellite imagery in the region. Thus, based on the personal correspondence with local residents and farmers, the rangelands were converted to dryland farming 50 years ago, and the apple orchard cultivation has reclaimed the abandoned drylands (or low-income drylands) in the last 20 years. Native vegetation in the rangelands predominantly comprises Astragalus verus, Bromus tomentellus, Elymus gentry, Cousinia cylindracea, and Daphne mucronata. Dryland farming is predominantly undertaken for barley and wheat production. Apple orchards (Malus pumila) are grown on the contour terraces (Banquet) upon application of traditional manure and administration of cultivation practices.

2.2. Soil Sampling

At three hillslopes corresponding to three land uses, four slope positions, namely shoulder, backslope, footslope, and toeslope, were identified (Figure 1c). The selected hillslopes were located at the southern aspect (see Figure 1), with similar slope gradients around 15–20%. Six soil samples were randomly collected from each slope position at a 0–30 cm depth. In order to demonstrate the soil sample distribution on the map, a three-dimensional representation of the sampling method is shown in Figure 2 as a typical three-dimensional pattern. In total, 24 soil samples were collected from each land use. Thus, a total of 72 soil samples were sampled across the studied hillslopes. For the evaluation of soil loss/deposition using 137Cs, a reference site was selected on flat slopes near the sites where the undisturbed rangelands were located, and the soil samples were collected from the depth intervals of 0–5, 5–10, 10–15, 15–20, 20–25, and 25–30 cm in the 20 m × 20 m area. All soil samples were air-dried, passed through a 2 mm sieve, and prepared for laboratory analyses.

2.3. Laboratory Analyses

Particle size distribution, soil bulk density (ρb), soil organic matter (SOM) content, and calcium carbonate equivalent (CCE) were determined by the Bouyoucos hydrometer method [36], the core method, the Walkley and Black method [37], and Bernard’s calcimetric method [38], respectively. Electrical conductivity (EC) and pH were measured in the soil/water extract ratio of 1:2.5. Total nitrogen (TN) was measured by the Kjeldahl method [39]. Available phosphorus (Pava) and available potassium (Kava) were measured by the methods proposed by Carter and Gregorich [40]. For magnetic measurements, after crushing, the Bartington MS2 dual-frequency sensor was used to measure soil magnetic susceptibility (χ) at low (0.47 kHz; χlf) and high frequencies (4.7 kHz, χhf) in all samples using approximately 20 g of soil held in a clear plastic vial (2.3 cm in diameter) [41]. The dependent frequency (χfd) was calculated using the following equation:
χ fd = χ lf χ hf   χ lf × 100
The 137Cs inventory was measured in the samples after preparation. Accordingly, 500 g of the dried and sieved soils were placed in the Marinelli beakers and sealed for 137Cs analyses. Gamma spectroscopy with a high-resolution germanium detector was used to measure the 137Cs activity (Bq kg−1) from the net area of a full-energy peak at 662 keV (ISO, 11929-1, 2000) in the Department of Physics, Isfahan University of Iran, during 2018–2019. The quality of the measurements was monitored using a reference material, no: IAEA-375, from the International Atomic Energy Agency (IAEA). The count time was nearly 150 min, and the counting error was preserved at the level of 10% and 95% confidence. The 137Cs activities (Bq kg−1) were turned to the area activities (Bq m−2).

2.4. Soil Redistribution Assessment

Soil redistribution rate (t ha−1 yr−1) was assessed by the 137Cs inventory at any location and compared with the reference site using the simplified mass balance model (SMBM) [42]. According to the SMBM, Equation (2) could be used for the eroded locations:
Y = 10 ρ b × d / P ( 1 X 100 ) 1 t 1963
X = 137 Cs reference   site 137 Cs given   point 137 Cs reference   site × 100
where Y = mean annual soil loss (t ha−1 yr−1), ρb = bulk density (kg m−3), d = depth of plow or cultivation layer (m), X = percent of loss or excess of 137Cs inventory, and P = correction factor for particle size distribution.
The rate of soil deposition at the depositional sites ( R ), where the 137Cs inventory is higher than the reference site, was calculated by the following equation:
R = A e x t 1963 t C d t e λ t t d t = A t A r e f 1963 t C d t e λ t t d t
where A e x t is the extra 137Cs inventory in the sampling over the reference inventory in the year t (defined as the inventory determined to be lower than the local reference inventory based on Bq m−2), Cd(t) is the 137Cs concentration of the deposited sediment in the year t based on Bq kg−1, and λ is the constant of 137Cs decay (yr−1).

2.5. Soil Quality Index (SQI) Assessment

In this study, several soil properties (i.e., EC, pH, CCE, SOM, TN, Pava, Kava, and ρb) were considered as indicators of SQI assessment. The selected soil properties define soil health, productivity, fertility, soil degradation, and soil and water interaction.
The linear scoring method was used to transform soil properties into a dimensionless score (between 0.1 and 1) using the following functions: ‘more is better’ for soil properties including SOM, TN, Pava, Kava; ‘less is better’ for CCE, ρb, and optimal range for pH and EC [33,34] (Table S1). The optimal values 0.2–2 dS m−1 and 7 were used for EC and pH, respectively [32].
The Nemoro SQI (SQIn) equation [30,31] is defined as the following equation:
SQI n = P ave 2 + P min 2 2 × n 1 n
where Pave, Pmin, and n are the average value, the minimum value for the scores attained for each sampling point, and the number of indicators, respectively. The SQI was divided into five categories, namely, very high (I), high (II), moderate (III), low (IV), and very low (V).

2.6. Statistical Analysis and Modeling

Descriptive statistics, including minimum, maximum, standard deviation, coefficient of variation (CV), and skewness, were determined by SPSS v. 19.0 (SPSS Inc. Chicago, IL, USA). The correlations between the studied variables were also computed using SPSS 19.0 [43]. A linear and non-linear relationship between 137Cs and magnetic susceptibility (χlf) was constructed to understand better the relationship between χlf and the rate of soil loss/deposition. Additionally, a random forest model was used to predict the 137Cs inventory as the dependent variable, with magnetic susceptibility and soil physicochemical properties as independent variables. Two user-defined parameters in the random forest model, namely, the number of trees in the forest (ntree) and the number of environmental covariates in each random subset (mtry), were optimized based on the out-of-bag error [44]. The importance of the independent variables in the random forest was calculated based on the variable importance [45]. The 137Cs inventory modeling performance was evaluated using ten-fold cross-validation with ten repetitions by the coefficient of determination (R2), mean absolute error (MAE), and the root mean square error (RMSE). The random forest model was conducted in the R3.3.1 program using the ‘caret’ package [46].
A random block design was applied for the statistical analysis, and the data were examined using analysis of variance (ANOVA). The mean comparison was performed using the LSD method at the probability level of p < 0.05. All graphs were plotted in the Excel program (v. 2013).

3. Results and Discussion

3.1. Descriptive Statistics

The results of the descriptive analysis for the studied properties, including soil physicochemical properties, magnetic susceptibility, and 137Cs inventory, are presented in Table 1. According to the results of the Kolmogorov–Smirnoff test, all studied variables were normally distributed in three land uses (Table 1). The skewness values presented in Table 1 also confirmed the normal distribution of the variables (varied from −1.11 to +1.10). The coefficient of variation (CV) was used as the criterion to define the variability in the studied soil parameters in each land use. The results showed that, among the soil variables, TN values showed the highest CV values of 39.67, 64.10, and 38.14% for the rangelands, drylands, and apple orchards, respectively.
In contrast, studying the hillslopes rehabilitated by olive and Cupressus trees in northern Iran, Ayoubi et al. [47] reported the highest CV for the particle size distribution. The high variability of TN was mainly attributed to the high solubility of this element that leads to high variability along the landscape [48]. The higher CV in the degraded land (abandoned drylands) confirmed the high rate of soil disturbance, whereas the minimum CVs were found in the natural rangelands. After rehabilitation of the drylands by the apple orchards, a decline was observed in the CV values in all studied variables (Table 1). Other scholars reported similar results, indicating a decrease in the CV values after rehabilitation or reforestation [18,22]. Moreover, studying rehabilitation of the mine soils by Wang et al. [29] showed that the bulk density, field capacity, and soil disintegration rate had the lowest CV values in the rehabilitated plots.
Conversely, the lowest CV values were obtained for the pH values, i.e., 0.81, 0.67, and 1.16% for the rangelands, dryland farming, and apple orchards, respectively, because of the soil pH in the studies area, predominantly controlled by calcium carbonates, and due to the fact that all samples had sufficient carbonates, as a mediator variable (Table 1). The results were in accordance with the findings of Paz Gonzalez et al. [49] and Lopez-Granados [50]. According to the classification of variability proposed by Wilding [51], most variables showed moderate variability, changing from 15 to 35%, and only TN showed high variability in CV, i.e., over 35%. The results were in line with the findings of other scholars who reported moderate variability in the soil properties in the west of Iran [52].

3.2. Variability of Soil Physicochemical Properties

Topography has been identified as one of the most important factors that control soil evolution, vegetation, and crop production in arid and semi-arid regions [10,45,48,53,54,55,56,57]. The interaction effect of land use and topography, which was ignored in several studies, is a crucial factor that should be considered in the interpretation of data. The variability of some soil properties at a depth of 0–30 cm in various land uses at four slope positions in the study area is shown in Figure 3. The mean comparison following ANOVA results indicated significant differences among the selected land uses in different slope positions in terms of soil chemical properties (Figure 3a–f).
The mean comparison of CCE showed that the highest CCE was observed in the steeper positions, including shoulder and backslope, where there was a high potential for soil loss (Figure 3a). The soil erosion may expose calcium carbonate-rich lower horizons to the topsoil. The parent material in the studied hillslopes, namely limestone, was enriched by carbonates. Therefore, the enriched layer by calcium carbonates would emerge in shoulder and backslope positions by losing surface layers. The previous studies on the hillslopes confirmed this finding [48,58]. Land use also had a significant influence on the CCE variability in all slope positions. Changing the land use from natural rangelands to dryland farming and then abandoning them intensified soil loss in the steep slopes and increased CCE in the drylands compared to the natural rangelands.
Similarly, Karchengani et al. [58] and Khormali et al. [48] reported higher CCE content after deforestation and clear-cutting of forests in Lordegan district, west of Iran, and northern Iran, respectively. The highest value of CCE content was observed in the apple orchards. Although lower CCE was expected in the orchards due to lower soil erosion, higher CCE in this land use might be attributed to deep tillage for tree cultivation (Figure 3a).
Figure 3b shows the variability of soil phosphorus (Pava) in surface soils in three land uses and four slope positions. The highest Pava values were observed in the apple orchards, which may be attributed to reducing soil loss and more fertilization by farmers. Moreover, the highest content was observed in the toeslope position, which was presumably ascribed to the transformation of phosphorus accompanied by the fine particles transported from higher to lower positions by runoff. The lowest phosphorous in the drylands confirmed the process of soil erosion and the depletion of the soil surface from the soil nutrients. Similar results were obtained for values of Kava (Figure 3c) and TN (Figure 3d). Several studies confirmed that the reclamation of bare lands significantly affected the status of soil nutrients [31,59], which could be related to various factors, such as the rate of fertilization, the kinds of applied fertilizers, the modes of plant configuration, the tillage practices, and the kind of land use after reclamation in particular [31,60,61]. Additionally, the reclamation age is another important factor regulating soil nutrients [31]. In our study area, the reclamation by the orchards in contour terraces (Banquet), accompanied by relatively high fertilization employed by NPK fertilizers, made a significant contribution to the total amounts of nitrogen, phosphorous, and potassium (Figure 3).
The variability in SOM contents for the various land uses in four different slope positions is given in Figure 3e. The mean values for SOM among the land uses were 1.83, 1.55, and 1.55% for the apple orchards, rangelands, and dryland farming, respectively (Table 1, Figure 3). Both pasture degradation and conversion to dryland farming [62] decreased SOM contents (Figure 3). Following the change in the land use from the rangelands to the cultivated lands, the SOM values decreased to 20.4, 3.02, 3.05, and 2.01% in the shoulder, backslope, footslope, and toeslope positions, respectively (Figure 3). Ayoubi et al. [2], Li et al. [63], and Mohammed et al. [64] reported a decrease in the SOM values following grassland conversion to cultivated lands in the rangelands of western Iran and the pastures of Mongolia, respectively. Several studies indicated that cultivation can significantly reduce the SOC pools by breaking large aggregates into smaller aggregates and exposing SOM to oxidation processes and microbial decomposition [34,65,66,67,68].
The restoration of drylands by orchards increased SOM, particularly in the shoulder, backslope, and footslope positions (Figure 3e). The orchards’ rehabilitation of degraded soils increased SOM values even higher than those of initial rangelands, which may be due to the slow decomposition rate of orchard wood litters than grasslands and the nearby farmers’ manure application (Figure 3e). Several scholars reported an increase in the SOM pools after recovering the degraded lands because of the decomposition of plants (especially perennials), animal bodies, and microorganisms [28,31]. Following the trend in SOM variability from shoulder to toeslope positions, the SOM values were the lowest and the highest in the shoulder and toeslope positions, respectively, in all land uses. Several investigations on the variability of SOM values in different slope positions indicated that the highest SOM values in the lower slope positions were due to soil redistribution and massive transportation of materials along the hillslopes [48,58].
The variations of bulk density (ρb) along the slope position in three land uses are given in Figure 3f. As Figure 3f shows, the land use conversion significantly influenced the bulk density. The highest ρb was observed in the drylands cultivated with the soils having a high rate of plowing and lower SOM values, which was consistent with the findings of other studies [65,69].
The comparison of the means and SQI assessment in different land uses and slope positions are shown in Table 2 and Table 3, respectively. The results indicate that the mean values of SQIs among different land uses and slope positions showed significant differences (p < 0.01) (Table 2). Among different land uses, we found the highest and lowest SQIs in the apple orchard and dryland farming land uses, respectively (Table 2), which can directly be due to the higher values of SOM, Pava, and TN (Figure 3). Apple orchard land use showed a high soil quality grade, whereas dryland farming and rangeland land uses had a moderate soil quality grade (Table 2 and Table 3). Numerous research has shown that land use modification significantly affects soil qualities [2,27,33,34,48,67]. Moreover, the highest SQIs were found in the toeslope positions among different land uses (Table 2). In the rehabilitation of the degraded soils with apple orchards in footslope and toeslope positions, the SQIs showed a very high soil quality grade, mainly due to receiving the soil depositions with a high amount of SOM, Pava, Kava, and TN as positive soil indicators and less of the negative soil indicator (CCE) in the SQI assessment (Table 2 and Figure 3).

3.3. Variability in Magnetic Susceptibility

Figure 4a indicates the changes in magnetic susceptibility among the land uses in different slope positions. The lowest magnetic susceptibility was observed in the shoulder position in apple orchards, whereas the highest was found on the toeslope in apple orchards and dryland farming (Figure 4a). Several mechanisms have been suggested for enhancing the magnetic susceptibility of surface soils. The major sources include soil pedogenesis [70], inherited from the parent material [2], industrial and urbanization activities [71], and biogeochemical processes induced by petroleum hydrocarbon pollution [72,73]. As this study was carried out far away from pollution sources and all parent materials were limestones with low magnetic susceptibility, any increase in χlf was related to the pedogenic processes [74]. Furthermore, the high positive significant relationship between χfd and χlf (r = 0.70, p < 0.01; Figure 4b) confirmed that the magnetic susceptibility was increased by the pedogenic processes, including an increase in the super-paramagnetic particles and neoformation minerals (e.g., illite and chlorite clay minerals and goethite) [75]. Followed by the pedogenic formation of ferrimagnetic minerals, their distribution along the landscape was highly dependent on soil redistribution and mechanical processes. The higher χlf in the lower position was related to soil deposition, and the lower χlf in the upper position was related to soil loss (Figure 4a). During soil erosion processes, the fine materials associated with magnetic minerals were transferred from upper positions (i.e., shoulder) to lower positions (i.e., toeslope) [25,58,76]. Lower magnetic susceptibility in the shoulder position of the apple orchards compared to drylands was unusual (Figure 4a), despite having lower soil loss in the apple orchards. It seems that lower magnetic susceptibility in the apple orchards in the shoulder position may be related to higher CCE as a diamagnetic mineral reducing magnetic susceptibility due to less soil erosion (Figure 3a and Figure 4a) [77].

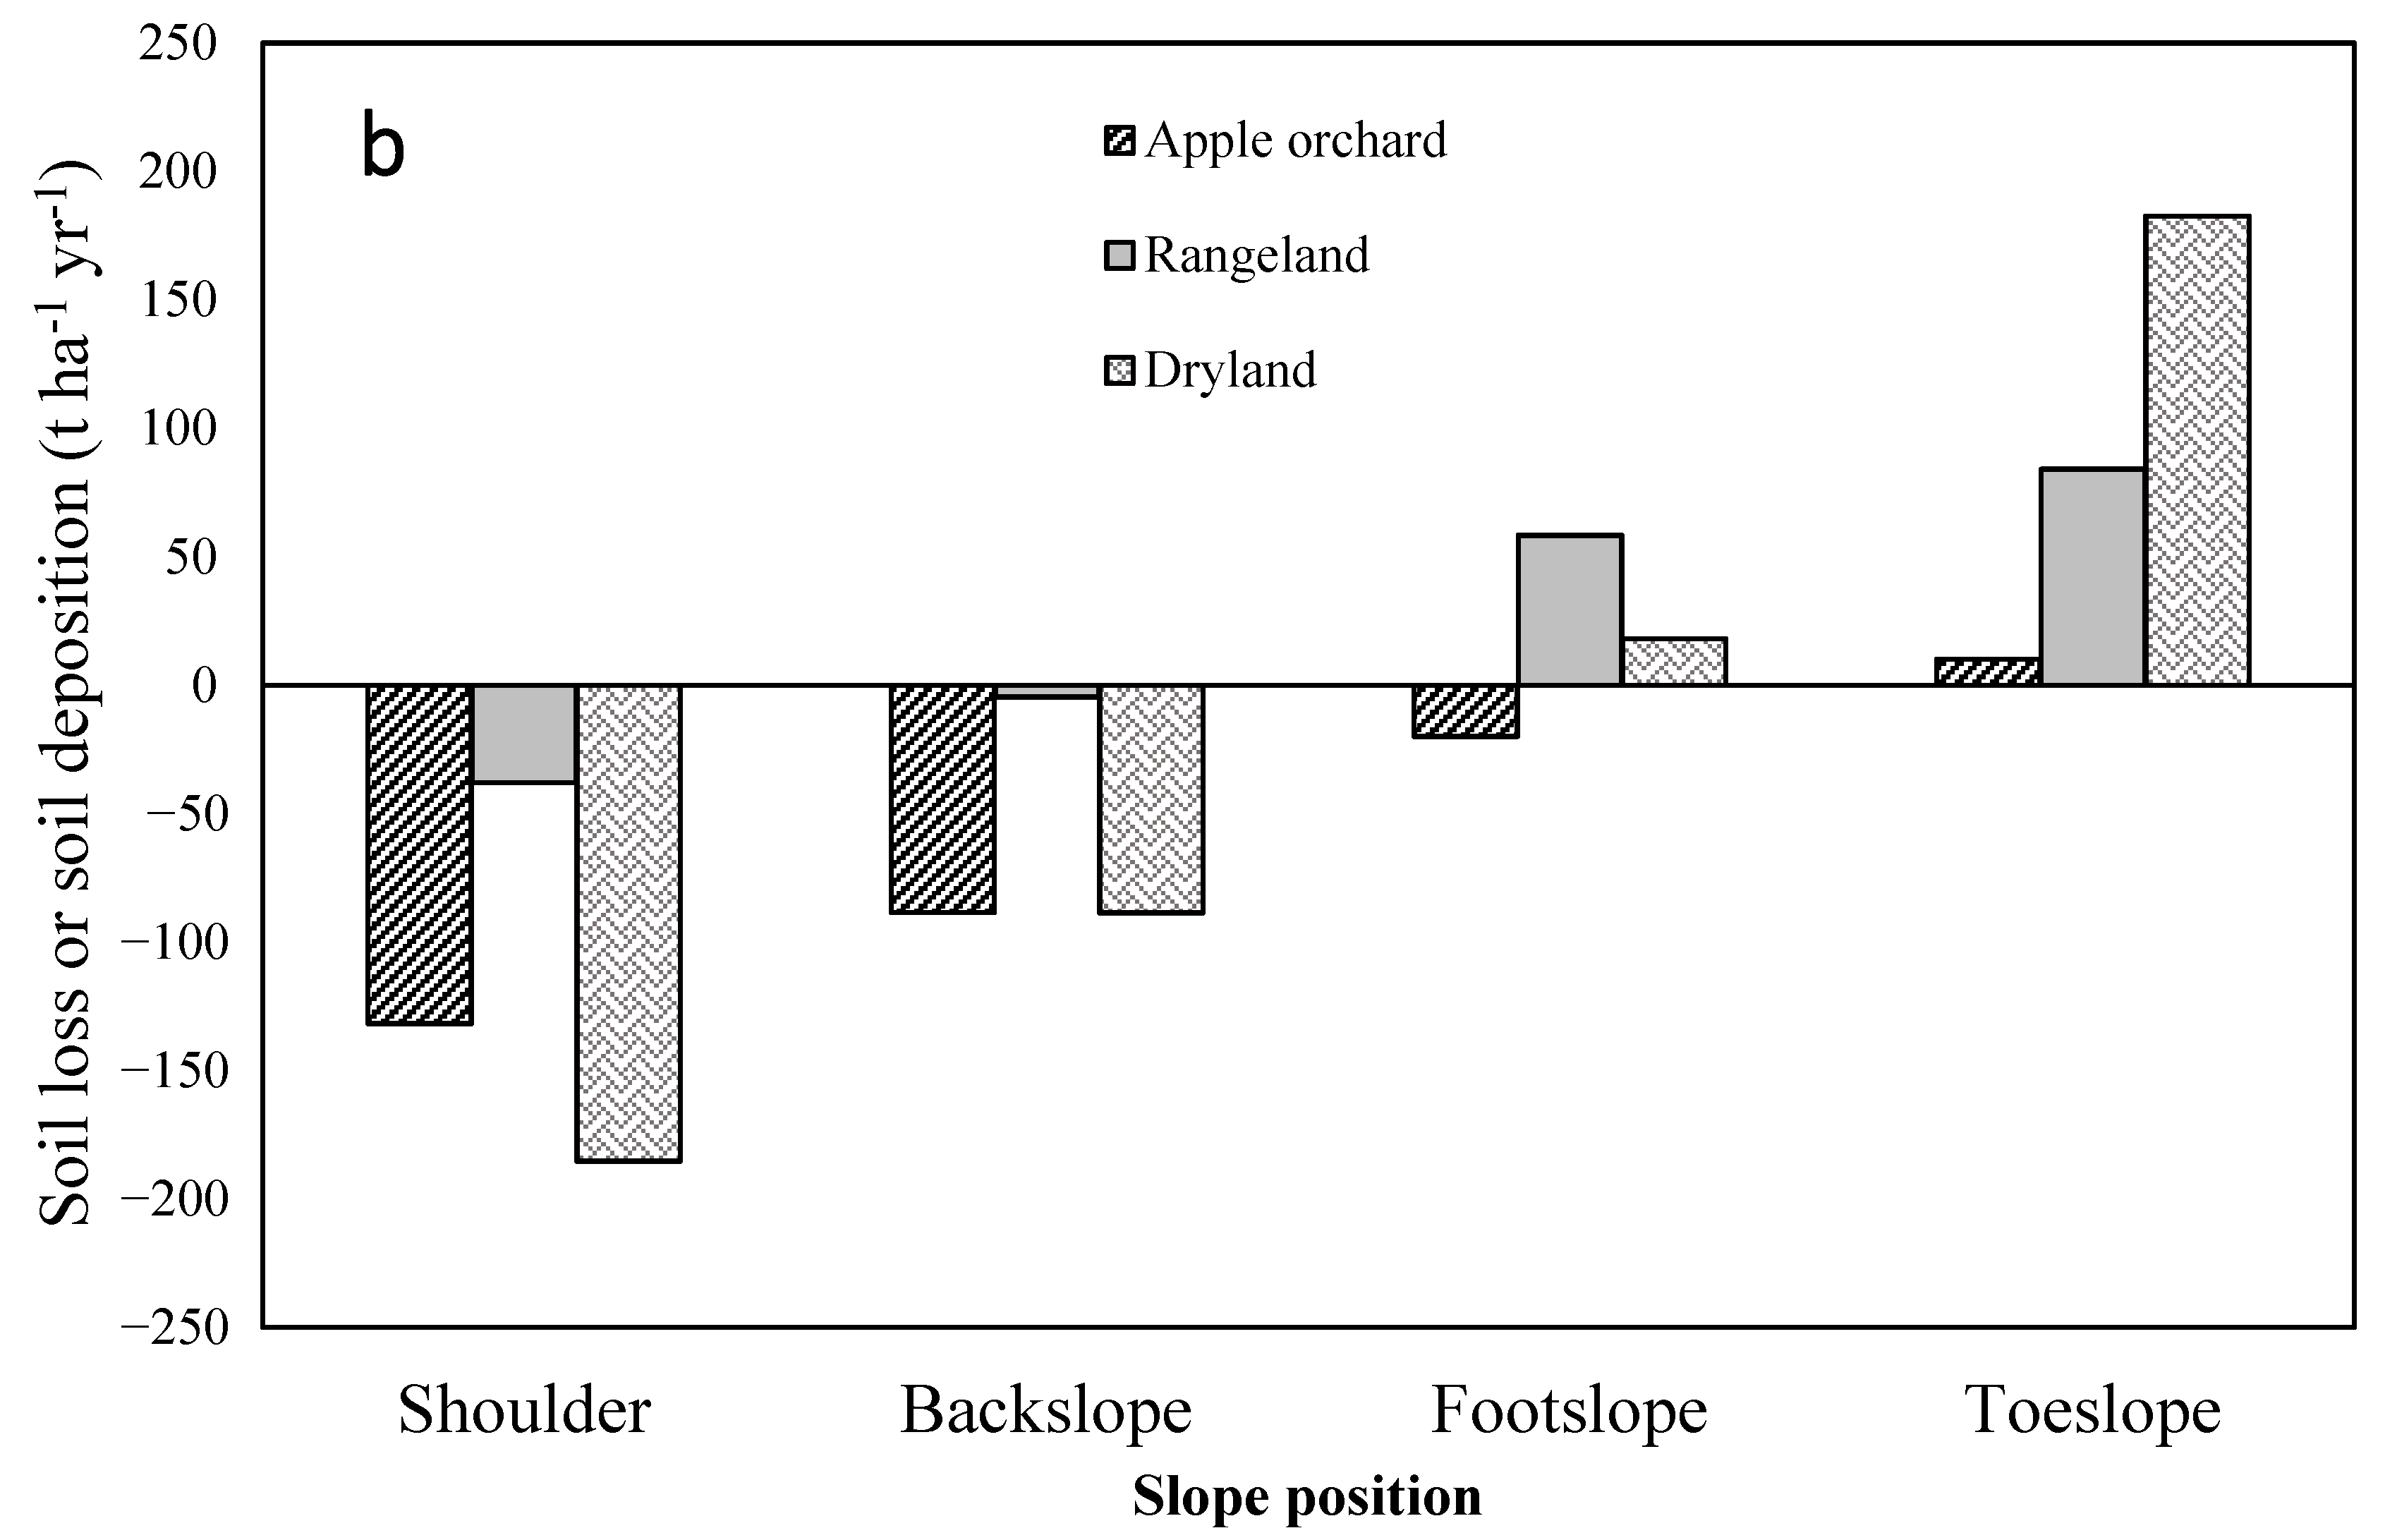
3.4. Soil Loss and Deposition Rates

The 137CS technique was used to assess soil loss and soil deposition (soil redistribution) in this study. The content of 137Cs significantly differed among the land uses in four slope positions (Figure 5). The figure shows that the lowest and highest values for 137Cs were observed in dryland farming land use’s shoulder and toeslope positions (Figure 5a). The inventory of 137Cs in the reference site, near the selected sites, was 2552 Bq m−2. In western Iran, in the landscapes with comparable elevation, climate, and latitude, Afshar et al. [20] and Ayoubi et al. [47] reported 137Cs equal to 2107 and 2130 Bq m−2 for the reference sites. By applying 137Cs in the reference site and the 137Cs loss in each location, soil loss/deposition was calculated using Equations (2) and (4). The soil loss/deposition results for three land uses in different slope positions are given in Figure 5b. The net soil loss occurred in the following order in the shoulder position: dryland > apple orchard > rangeland. The highest soil loss (185.3 t ha−1 yr−1) in the shoulder position of dryland indicated the effects of tillage by the local farmers, especially in the direction of the slope gradient. Similarly, Rahimi et al. [21] demonstrated soil loss of 110 t ha−1 yr−1 in the shoulder position after pasture degradation and intensive cultivation in the Fereydunshahr district in western Iran. Applying the simplified mass balance model (SMBM), Theocharopoulos et al. [78] reported the highest value for soil loss of 168.19 t ha−1 yr−1 in the steep slope of the cultivated area in central Greece.
Rangelands showed the lowest soil loss on steep slopes (shoulder and backslope positions) (Figure 5b). In the rangelands, perennial vegetation significantly contributed to lowering runoff and soil loss. In the Fereydunshahr district, west of Iran, Rahimi et al. [21] reported lower soil loss in the rangelands (varying from 3.94 to 90.1 t ha−1 yr−1) compared to the cultivated regions (ranging from 86.41 to 159.3 t ha−1 yr−1) in the shoulder position. In the lower positions (foot and toeslope positions) of the three land uses, soil deposition occurred except in the footslope position of the apple orchards, which may be attributed to the relatively high slope gradient compared to the other two land uses. The highest deposition (182.52 t ha−1 yr−1) was observed in the dryland land use in the toeslope position, showing the translocation of the materials from the upper position to this position (Figure 5b). In line with the findings of other studies [19,79,80,81], the higher deposition rate in the toeslope position of the cultivated soils is because of the transportation of the soil particles from the shoulder and upper positions.

3.5. Correlation Analysis and Modeling

The results of the correlation analysis among the studied variables, as the indicators of soil redistribution along the hillslopes, are presented in Table 4. According to the results, 137Cs was significantly correlated with SOM (0.87, p < 0.01), Kava (0.85, p < 0.01), TN (0.95, p < 0.05), Pava (0.89, p < 0.01), ρb (0.99, p < 0.05), χlf (0.47, p < 0.01), and χhf (0.52, p < 0.05) (Table 4).
The variability in the soil nutrients (Kava, Pava, and TN) was highly related to SOM, as shown in Table 4. The high and positive correlations found between SOM and these nutrients confirmed their connection. In the shoulder position with a high rate of soil erosion and lower 137Cs (Figure 5), SOM was associated with nutrients detached and transported to the lower position (Figure 3e). Studying the forest soils in Germany, Fujiyoshi and Sawamura [82] reported a significant relationship between potassium and 137Cs inventory (r = 0.90). The positive and significant relationship observed between 137Cs and ρb confirmed that intensive cultivation practices were followed in the lower position, leading to the accumulation of more materials and 137Cs. Moreover, 137Cs inventory showed a negative correlation with CCE, indicating that a lower inventory of 137Cs was excited in the steep slopes with the high content of CCE (Table 4). Overall, significant relationships between 137Cs inventory and soil properties confirmed that erosional and hydrological processes can regulate soil variability in the hilly regions of the study area [18]. These findings were consistent with the results of Karchegnai et al. [18,21,47,80,83].
Relatively high and positive correlations were obtained between magnetic measures (χlf) and 137Cs inventories in three land uses (Table 4). Magnetic susceptibility was previously utilized as a soil redistribution tracer [47]. Ferrimagnetic minerals, such as maghemite and magnetite, are associated with fine materials (i.e., clay particles); they have translocated from upper slopes to lower slopes through soil redistribution, leading to an increase in soil magnetic susceptibility in lower positions [9,21,76,84]. The non-linear relationship between 137Cs and χlf was studied to understand better the relationship between χlf and the rate of soil loss/deposition. The results of this analysis for three land uses are shown in Figure 6. As can be seen, non-linear correlations between 137Cs and magnetic susceptibility were significantly higher than linear correlations. Similarly, in the Fereydunshahr district, Rahimi et al. [21] showed that non-linear relationships could explain 74% and 76% of the variability in 137Cs in the pasture and cultivated soils, respectively. In Chelgerd district, Charmahal and Bakhtiari province, west of Iran, Ayoubi et al. [47] found R2 = 0.45 for the non-linear relationships between 137Cs and magnetic susceptibility.
The 137Cs inventory content was predicted using the random forest and soil properties to explore the contribution of the studied soil properties to explaining the variability in 137Cs in the study area. The validation criteria and variable importance for predicting 137Cs inventory by random forest model are shown in Table 5 and Figure 7, respectively. The best prediction accuracy (RMSE = 111.29 and R2 = 0.46) for predicting 137Cs inventory was achieved for the number of environmental covariates in each random subset (mtry = 13) and the number of trees in the forest (ntree = 500) (Table 5). Previous studies confirmed that the random forest model is a robust machine learning approach for predicting soil properties [45,85,86,87]. The variable importance analysis showed that soil properties, including CCE, TN, available phosphorous (Pava), available potassium (Kava), and ρb, were the most important variables in random forest prediction, which, in total, can explain 75% of the variability in 137Cs in the study area (Figure 7). Thus, this result confirmed the effects of erosional processes on the soil properties along the hillslopes. In the Chelgerd district of Iran, Ayoubi et al. [47] showed that soil properties such as Kava and χlf were identified as the most important variables, explaining 61% of the variability in 137Cs inventory.

4. Conclusions

This study investigated the effects of land use changes (especially rehabilitation with an apple orchard) and slope positions on the variability of soil physicochemical and magnetic properties, and soil redistribution using the 137Cs technique in three land uses. The main conclusions are:
  • Two factors, namely rangeland degradation and land conversion to dryland farming, have significantly changed the soil physicochemical properties in various slope positions during the past 50 years. CCE increased in the eroded positions (shoulder and backslope), whereas SOM, TN, Kava, and Pava decreased in these positions, especially in dryland farming, because of soil loss. The rehabilitation of the degraded soils with apple orchards significantly improved soil quality indicators.
  • The restoration of drylands by orchards improved SQIs in different slope positions. The apple orchards increased SQI values in footslope (0.499, very high) and toeslope (0.498, very high) positions compared to drylands (0.369, moderate for footslope; 0.432, high for toeslope).
  • Magnetic susceptibility is significantly reduced in dryland farming compared to rangeland due to soil erosion and deposition along the landscape. In the upper position, lower values for χlf were observed, whereas the highest χlf were found in the lower position due to the movement of magnetic particles associated with fine particles.
  • Applying SMBM on the 137Cs inventory indicated the highest soil loss observed in the dryland and orchard cultivation regions. Thus, it can be concluded that land rehabilitation significantly decreased the soil loss rate in the recent two decades. In the steep slopes (i.e., shoulder and backslope) and the lower positions (i.e., footslope and toeslope) of three land uses, net soil loss and net deposition occurred, respectively.
  • The correlation analysis showed that 137Cs well correlated with some soil properties known to be soil quality indicators (i.e., TN, Kava, Pava, SOM, bulk density, and CCE). The good agreement between 137Cs inventory and χlf confirmed the high potential of magnetic susceptibility, as an indicator, for evaluating soil redistribution along the hillslope. Additionally, the random forest models revealed that CCE, TN, Kava, Pava, and ρb were the most important variables, explaining 75% of the variability of 137Cs inventory in the study area.

Supplementary Materials

The following supporting information can be downloaded at: https://www.mdpi.com/article/10.3390/agronomy12020451/s1, Table S1: Standard scoring functions and indicators parameters in the study area (SSF Equations were adopted from Zeraatpisheh et al. [34]).

Author Contributions

Conceptualization, S.A., A.M. and M.Z.; methodology, S.A., A.M. and M.Z.; software, S.A., A.M. and M.Z.; validation, S.A., A.M. and M.Z.; formal analysis, S.A., A.M. and M.Z.; investigation, S.A., and A.M.; resources, S.A., A.M. and M.R.A.; data curation, S.A., A.M. and M.R.A.; writing—original draft preparation, S.A., A.M., F.A.A. and M.Z.; writing—review and editing, S.A., A.M., F.A.A., L.W. and M.Z.; visualization S.A. and M.Z.; supervision, S.A.; project administration, S.A.; funding acquisition, S.A. All authors have read and agreed to the published version of the manuscript.

Funding

This research was financially supported by Isfahan University of Technology.

Data Availability Statement

Not applicable.

Acknowledgments

The authors thank the Isfahan University of Technology for providing the experimental facilities. Mojtaba Zeraatpisheh’s postdoctoral program at Henan University, China, has been supported by the National Key Research and Development Program of China, grant numbers 2017YFA0604302 and 2018YFA0606500.

Conflicts of Interest

The authors declare no conflict of interest.

References

  1. Rodrigo Comino, J.; Iserloh, T.; Morvan, X.; Malam Issa, O.; Naisse, C.; Keesstra, S.D.; Cerdà, A.; Prosdocimi, M.; Arnáez, J.; Lasanta, T.; et al. Soil erosion processes in European vineyards: A qualitative comparison of rainfall simulation measurements in Germany, Spain and France. Hydrology 2016, 3, 6. [Google Scholar] [CrossRef] [Green Version]
  2. Ayoubi, S.; Emami, N.; Ghaffari, N.; Honarjoo, N.; Sahrawat, K.L. Pasture degradation effects on soil quality indicators at different hillslope positions in a semiarid region of western Iran. Environ. Earth Sci. 2014, 71, 375–381. [Google Scholar] [CrossRef] [Green Version]
  3. Kooch, Y.; Moghimian, N.; Wirth, S.; Noghre, N. Effects of grazing management on leaf litter decomposition and soil microbial activities in northern Iranian rangeland. Geoderma 2020, 361, 114100. [Google Scholar] [CrossRef]
  4. Zeraatpisheh, M.; Bottega, E.L.; Bakhshandeh, E.; Owliaie, H.R.; Taghizadeh-Mehrjardi, R.; Kerry, R.; Scholten, T.; Xu, M. Spatial variability of soil quality within management zones: Homogeneity and purity of delineated zones. Catena 2022, 209, 105835. [Google Scholar] [CrossRef]
  5. Müller, M.M.; Guimaraes, M.F.; Desjardins, T.; Mitja, D. The relationship between pasture degradation and soil properties in the Brazilian Amazon: A case study. Agric. Ecosyst. Environ. 2004, 103, 279–288. [Google Scholar] [CrossRef]
  6. Lopes, V.S.; Cardoso, I.M.; Fernandes, O.R.; Rocha, G.C.; Simas, F.N.B.; de Melo Moura, W.; Santana, F.C.; Veloso, G.V.; da Luz, J.M.R. The establishment of a secondary forest in a degraded pasture to improve hydraulic properties of the soil. Soil Tillage Res. 2020, 198, 104538. [Google Scholar] [CrossRef]
  7. Vaezi, A.R.; Zarrinabadi, E.; Auerswald, K. Interaction of land use, slope gradient and rain sequence on runoff and soil loss from weakly aggregated semi-arid soils. Soil Tillage Res. 2017, 172, 22–31. [Google Scholar] [CrossRef]
  8. Hosseinalizadeh, M.; Alinejad, M.; Behbahani, A.M.; Khormali, F.; Kariminejad, N.; Pourghasemi, H.R. A review on the gully erosion and land degradation in Iran. In Gully Erosion Studies from India and Surrounding Regions; Springer: Cham, Switzerland, 2020; pp. 393–403. [Google Scholar]
  9. Bouhlassa, S.; Bouhsane, N. Assessment of areal water and tillage erosion using magnetic susceptibility: The approach and its application in Moroccan watershed. Environ. Sci. Pollut. Res. 2019, 26, 25452–25466. [Google Scholar] [CrossRef]
  10. Mohammed, S.; Abdo, H.G.; Szabo, S.; Pham, Q.B.; Holb, I.J.; Linh, N.T.T.; Anh, D.T.; Alsafadi, K.; Mokhtar, A.; Kbibo, I.; et al. Estimating human impacts on soil erosion considering different hillslope inclinations and land uses in the coastal region of Syria. Water 2020, 12, 2786. [Google Scholar] [CrossRef]
  11. Mohammed, S.; Alsafadi, K.; Talukdar, S.; Kiwan, S.; Hennawi, S.; Alshihabi, O.; Sharaf, M.; Harsanyie, E. Estimation of soil erosion risk in southern part of Syria by using RUSLE integrating geo informatics approach. Remote Sens. Appl. Soc. Environ. 2020, 20, 100375. [Google Scholar] [CrossRef]
  12. Cerdà, A.; Rodrigo-Comino, J. Is the hillslope position relevant for runoff and soil loss activation under high rainfall conditions in vineyards? Ecohydrol. Hydrobiol. 2020, 20, 59–72. [Google Scholar] [CrossRef]
  13. Liu, H.; Zhang, T.; Liu, B.; Liu, G.; Wilson, G. Effects of gully erosion and gully filling on soil depth and crop production in the black soil region, northeast China. Environ. Earth Sci. 2013, 68, 1723–1732. [Google Scholar] [CrossRef]
  14. Renard, K.G.; Foster, G.; Yoder, D.; McCool, D. RUSLE revisited: Status, questions, answers, and the future. J. Soil Water Conserv. 1994, 49, 213–220. [Google Scholar]
  15. Taghizadeh-Mehrjardi, R.; Bawa, A.; Kumar, S.; Zeraatpisheh, M.; Amirian-Chakan, A.; Akbarzadeh, A. Soil erosion spatial prediction using digital soil mapping and RUSLE methods for Big Sioux River watershed. Soil Syst. 2019, 3, 43. [Google Scholar] [CrossRef] [Green Version]
  16. Safwan, M.; Alaa, K.; Omran, A.; Quoc, B.P.; Nguyen, T.T.L.; Van, N.T.; Duong, T.A.; Endre, H. Predicting soil erosion hazard in Lattakia Governorate (W Syria). Int. J. Sediment Res. 2021, 36, 207–220. [Google Scholar] [CrossRef]
  17. Quijano, L.; Gaspar, L.; Navas, A. Spatial patterns of SOC, SON, 137Cs and soil properties as affected by redistribution processes in a Mediterranean cultivated field (Central Ebro Basin). Soil Tillage Res. 2016, 155, 318–328. [Google Scholar] [CrossRef] [Green Version]
  18. La Manna, L.; Gaspar, L.; Tarabini, M.; Quijano, L.; Navas, A. 137Cs inventories along a climatic gradient in volcanic soils of Patagonia: Potential use for assessing medium term erosion processes. Catena 2019, 181, 104089. [Google Scholar] [CrossRef]
  19. Junge, B.; Mabit, L.; Dercon, G.; Walling, D.E.; Abaidoo, R.; Chikoye, D.; Stahr, K. First use of the 137 Cs technique in Nigeria for estimating medium-term soil redistribution rates on cultivated farmland. Soil Tillage Res. 2010, 110, 211–220. [Google Scholar] [CrossRef]
  20. Afshar, F.A.; Ayoubi, S.; Jalalian, A. Soil redistribution rate and its relationship with soil organic carbon and total nitrogen using 137Cs technique in a cultivated complex hillslope in western Iran. J. Environ. Radioact. 2010, 101, 606–614. [Google Scholar] [CrossRef]
  21. Rahimi, M.R.; Ayoubi, S.; Abdi, M.R. Magnetic susceptibility and Cs-137 inventory variability as influenced by land use change and slope positions in a hilly, semiarid region of west-central Iran. J. Appl. Geophys. 2013, 89, 68–75. [Google Scholar] [CrossRef]
  22. Ayoubi, S.; Sadeghi, N.; Afshar, F.A.; Abdi, M.R.; Zeraatpisheh, M.; Rodrigo-Comino, J. Impacts of oak deforestation and rainfed cultivation on soil redistribution processes across hillslopes using 137 Cs techniques. For. Ecosyst. 2021, 8, 32. [Google Scholar] [CrossRef]
  23. Zapata, F. Field Application of the Cs-137 Technique in Soil Erosion and Sedimentation. Special Issue. Soil Tillage Res. 2003, 69, 153. [Google Scholar] [CrossRef]
  24. Lacoste, M.; Michot, D.; Viaud, V.; Evrard, O.; Walter, C. Combining 137Cs measurements and a spatially distributed erosion model to assess soil redistribution in a hedgerow landscape in northwestern France (1960–2010). Catena 2014, 119, 78–89. [Google Scholar] [CrossRef]
  25. Sadiki, A.; Faleh, A.; Navas, A.; Bouhlassa, S. Using magnetic susceptibility to assess soil degradation in the Eastern Rif, Morocco. Earth Surf. Processes Landf. 2009, 34, 2057–2069. [Google Scholar] [CrossRef] [Green Version]
  26. Menshov, O.; Kruglov, O.; Vyzhva, S.; Nazarok, P.; Pereira, P.; Pastushenko, T. Magnetic methods in tracing soil erosion, Kharkov Region, Ukraine. Studia Geophys. Geod. 2018, 62, 681–696. [Google Scholar] [CrossRef]
  27. Nael, M.; Khademi, H.; Hajabbasi, M. Response of soil quality indicators and their spatial variability to land degradation in central Iran. Appl. Soil Ecol. 2004, 27, 221–232. [Google Scholar] [CrossRef]
  28. Józefowska, A.; Pietrzykowski, M.; Woś, B.; Cajthaml, T.; Frouz, J. The effects of tree species and substrate on carbon sequestration and chemical and biological properties in reforested post-mining soils. Geoderma 2017, 292, 9–16. [Google Scholar] [CrossRef]
  29. Wang, J.; Yang, R.; Feng, Y. Spatial variability of reconstructed soil properties and the optimization of sampling number for reclaimed land monitoring in an opencast coal mine. Arab. J. Geosci. 2017, 10, 46. [Google Scholar] [CrossRef]
  30. Wang, J.; Hu, X.; Shi, T.; He, L.; Hu, W.; Wu, G. Assessing toxic metal chromium in the soil in coal mining areas via proximal sensing: Prerequisites for land rehabilitation and sustainable development. Geoderma 2022, 405, 115399. [Google Scholar] [CrossRef]
  31. Guan, Y.; Zhou, W.; Bai, Z.; Cao, Y.; Huang, Y.; Huang, H. Soil nutrient variations among different land use types after reclamation in the Pingshuo opencast coal mine on the Loess Plateau, China. Catena 2020, 188, 104427. [Google Scholar] [CrossRef]
  32. Andrews, S.; Flora, C.; Mitchell, J.; Karlen, D. Growers’ perceptions and acceptance of soil quality indices. Geoderma 2003, 114, 187–213. [Google Scholar] [CrossRef]
  33. Nabiollahi, K.; Golmohamadi, F.; Taghizadeh-Mehrjardi, R.; Kerry, R.; Davari, M. Assessing the effects of slope gradient and land use change on soil quality degradation through digital mapping of soil quality indices and soil loss rate. Geoderma 2018, 318, 16–28. [Google Scholar] [CrossRef]
  34. Zeraatpisheh, M.; Bakhshandeh, E.; Hosseini, M.; Alavi, S.M. Assessing the effects of deforestation and intensive agriculture on the soil quality through digital soil mapping. Geoderma 2020, 363, 114139. [Google Scholar] [CrossRef]
  35. Soil Survey Staff. Keys to Soil Taxonomy, 12th ed.; USDA—Natural Resources Conservation Service: Washington, DC, USA, 2014. [Google Scholar]
  36. Gee, G.; Bauder, J. Particle size analysis by hydrometer: A simplified method for routine textural analysis and a sensitivity test of measurement parameters. Soil Sci. Soc. Am. J. 1979, 43, 1004–1007. [Google Scholar] [CrossRef]
  37. Walkley, A.; Black, I.A. An examination of digestion method for determining soil organic matter and a proposed modification of the chromic acid titration. Soil Sci. 1934, 37, 29–38. [Google Scholar] [CrossRef]
  38. Richard, H.L.; Suarez, D.L. Carbonates and gypsum. In Methods of Soil Analysis, Part 3. Chemical Methods; Spark, D.L., Page, A.L., Helmke, P.A., Loeppert, R.H., Soltanpour, P.N., Tabatabai, M.A., Johnston, C.T., Sumner, M.E., Eds.; ASA/SSSA: Madison, WI, USA, 1996; pp. 437–474. [Google Scholar]
  39. Yeomans, J.C.; Bremner, J.M. Carbon and nitrogen analysis of soils by automated combustion techniques. Commun. Soil Sci. Plant Anal. 1991, 22, 843–850. [Google Scholar] [CrossRef]
  40. Carter, M.R.; Gregorich, E.G. Soil Sampling and Methods of Analysis; CRC Press: Boca Raton, FL, USA, 2007. [Google Scholar]
  41. Dearing, J.A.; Dann, R.; Hay, K.; Lees, J.; Loveland, P.; Maher, B.A.; O’grady, K. Frequency-dependent susceptibility measurements of environmental materials. Geophys. J. Int. 1996, 124, 228–240. [Google Scholar] [CrossRef] [Green Version]
  42. Walling, D.; He, Q.; Appleby, P. Conversion models for use in soil-erosion, soil-redistribution and sedimentation investigations. In Handbook for the Assessment of Soil Erosion and Sedimentation Using Environmental Radionuclides; Springer: Dordrecht, The Netherlands, 2002; pp. 111–164. [Google Scholar]
  43. Swan ARH, S.M. Introduction to Geological Data Analysis, Blackwell Science; University of Portsmouth: Oxford, UK, 1995. [Google Scholar]
  44. Peters, J.; De Baets, B.; Verhoest, N.E.; Samson, R.; Degroeve, S.; De Becker, P.; Huybrechts, W. Random forests as a tool for ecohydrological distribution modelling. Ecol. Model. 2007, 207, 304–318. [Google Scholar] [CrossRef]
  45. Zeraatpisheh, M.; Ayoubi, S.; Jafari, A.; Tajik, S.; Finke, P. Digital mapping of soil properties using multiple machine learning in a semi-arid region, central Iran. Geoderma 2019, 338, 445–452. [Google Scholar] [CrossRef]
  46. Team, R.C. R: A Language and Environment for Statistical Computing; R Foundation for Statistical Computing: Vienna, Austria, 2013. [Google Scholar]
  47. Ayoubi, S.; Ahmadi, M.; Abdi, M.R.; Afshar, F.A. Relationships of 137Cs inventory with magnetic measures of calcareous soils of hilly region in Iran. J. Environ. Radioact. 2012, 112, 45–51. [Google Scholar] [CrossRef]
  48. Khormali, F.; Ajami, M.; Ayoubi, S.; Srinivasarao, C.; Wani, S. Role of deforestation and hillslope position on soil quality attributes of loess-derived soils in Golestan province, Iran. Agric. Ecosyst. Environ. 2009, 134, 178–189. [Google Scholar] [CrossRef]
  49. Paz-Gonzalez, A.; Vieira, S.; Castro, M.T.T. The effect of cultivation on the spatial variability of selected properties of an umbric horizon. Geoderma 2000, 97, 273–292. [Google Scholar] [CrossRef]
  50. López-Granados, F.; Jurado-Expósito, M.; Atenciano, S.; García-Ferrer, A.; de la Orden, M.S.; García-Torres, L. Spatial variability of agricultural soil parameters in southern Spain. Plant Soil 2002, 246, 97–105. [Google Scholar] [CrossRef]
  51. Wilding, L. Spatial variability: Its documentation, accomodation and implication to soil surveys. In Proceedings of the Soil Spatial Variability, Las Vegas, NV, USA, 30 November–1 December 1984; pp. 166–194. [Google Scholar]
  52. Zolfaghari, Z.; Ayoubi, S.; Mosaddeghi, M.R. Spatial variability of some soil shrinkage indices in hilly calcareous region of western Iran. Soil Tillage Res. 2015, 150, 180–191. [Google Scholar] [CrossRef]
  53. Seibert, J.; Stendahl, J.; Sørensen, R. Topographical influences on soil properties in boreal forests. Geoderma 2007, 141, 139–148. [Google Scholar] [CrossRef]
  54. Solon, J.; Degórski, M.; Roo-Zielińska, E. Vegetation response to a topographical-soil gradient. Catena 2007, 71, 309–320. [Google Scholar] [CrossRef]
  55. Norouzi, M.; Ayoubi, S.; Jalalian, A.; Khademi, H.; Dehghani, A. Predicting rainfed wheat quality and quantity by artificial neural network using terrain and soil characteristics. Acta Agric. Scand. Sect. B Soil Plant Sci. 2010, 60, 341–352. [Google Scholar] [CrossRef]
  56. Rodrigo-Comino, J.; Keshavarzi, A.; Zeraatpisheh, M.; Gyasi-Agyei, Y.; Cerdà, A. Determining the best ISUM (Improved stock unearthing Method) sampling point number to model long-term soil transport and micro-topographical changes in vineyards. Comput. Electron. Agric. 2019, 159, 147–156. [Google Scholar] [CrossRef]
  57. Burst, M.; Chauchard, S.; Dambrine, E.; Dupouey, J.-L.; Amiaud, B. Distribution of soil properties along forest-grassland interfaces: Influence of permanent environmental factors or land-use after-effects? Agric. Ecosyst. Environ. 2020, 289, 106739. [Google Scholar] [CrossRef]
  58. Karchegani, P.M.; Ayoubi, S.; Mosaddeghi, M.R.; Honarjoo, N. Soil organic carbon pools in particle-size fractions as affected by slope gradient and land use change in hilly regions, western Iran. J. Mt. Sci. 2012, 9, 87–95. [Google Scholar] [CrossRef]
  59. Pedrol, N.; Souza-Alonso, P.; Puig, C.G.; González, L.; Covelo, E.F.; Asensio, V.; Forján, R.; Andrade, L. Improving soil fertility to support grass–legume revegetation on lignite mine spoils. Commun. Soil Sci. Plant Anal. 2014, 45, 1565–1582. [Google Scholar] [CrossRef]
  60. Shrestha, R.K.; Lal, R. Carbon and nitrogen pools in reclaimed land under forest and pasture ecosystems in Ohio, USA. Geoderma 2010, 157, 196–205. [Google Scholar] [CrossRef]
  61. Zhou, W.; Yang, K.; Bai, Z.; Cheng, H.; Liu, F. The development of topsoil properties under different reclaimed land uses in the Pingshuo opencast coalmine of Loess Plateau of China. Ecol. Eng. 2017, 100, 237–245. [Google Scholar] [CrossRef]
  62. Yuan, Y.; Zhao, Z.; Niu, S.; Li, X.; Wang, Y.; Bai, Z. Reclamation promotes the succession of the soil and vegetation in opencast coal mine: A case study from Robinia pseudoacacia reclaimed forests, Pingshuo mine, China. Catena 2018, 165, 72–79. [Google Scholar] [CrossRef]
  63. Li, B.; Tang, H.; Wu, L.; Li, Q.; Zhou, C. Relationships between the soil organic carbon density of surface soils and the influencing factors in differing land uses in Inner Mongolia. Environ. Earth Sci. 2012, 65, 195–202. [Google Scholar] [CrossRef]
  64. Mohammed, S.; Hassan, E.; Abdo, H.G.; Szabo, S.; Mokhtar, A.; Alsafadi, K.; Al-Khouri, I.; Rodrigo-Comino, J. Impacts of rainstorms on soil erosion and organic matter for different cover crop systems in the western coast agricultural region of Syria. Soil Use Manag. 2021, 37, 196–213. [Google Scholar] [CrossRef]
  65. Kizilkaya, R.; Dengiz, O. Variation of land use and land cover effects on some soil physico-chemical characteristics and soil enzyme activity. Zemdirb.-Agric. 2010, 97, 15–24. [Google Scholar]
  66. Shahriari, A.; Khormali, F.; Kehl, M.; Ayoubi, S.; Welp, G. Effect of a long-term cultivation and crop rotations on organic carbon in loess derived soils of Golestan Province, Northern Iran. Int. J. Plant Prod. 2011, 5, 147–151. [Google Scholar]
  67. Bakhshandeh, E.; Hossieni, M.; Zeraatpisheh, M.; Francaviglia, R. Land use change effects on soil quality and biological fertility: A case study in northern Iran. Eur. J. Soil Biol. 2019, 95, 103119. [Google Scholar] [CrossRef]
  68. Zeraatpisheh, M.; Ayoubi, S.; Mirbagheri, Z.; Mosaddeghi, M.R.; Xu, M. Spatial prediction of soil aggregate stability and soil organic carbon in aggregate fractions using machine learning algorithms and environmental variables. Geoderma Reg. 2021, 27, e00440. [Google Scholar] [CrossRef]
  69. Gol, C.; Dengiz, O. Effect of modifying land cover and long-term agricultural practices on the soil characteristics in native forest-land. J. Environ. Biol. 2008, 29, 667–682. [Google Scholar]
  70. Karimi, A.; Haghnia, G.H.; Ayoubi, S.; Safari, T. Impacts of geology and land use on magnetic susceptibility and selected heavy metals in surface soils of Mashhad plain, northeastern Iran. J. Appl. Geophys. 2017, 138, 127–134. [Google Scholar] [CrossRef]
  71. Ng, S.L.; Chan, L.S.; Lam, K.C.; Chan, W.K. Heavy metal contents and magnetic properties of playground dust in Hong Kong. Environ. Monit. Assess. 2003, 89, 221–232. [Google Scholar] [CrossRef] [PubMed]
  72. Rijal, M.L.; Porsch, K.; Appel, E.; Kappler, A. Magnetic signature of hydrocarbon-contaminated soils and sediments at the former oil field Hänigsen, Germany. Studia Geophys. Geod. 2012, 56, 889–908. [Google Scholar] [CrossRef]
  73. Ayoubi, S.; Samadi, M.J.; Khademi, H.; Shirvani, M.; Gyasi-Agyei, Y. Using magnetic susceptibility for predicting hydrocarbon pollution levels in a petroleum refinery compound in Isfahan Province, Iran. J. Appl. Geophys. 2020, 172, 103906. [Google Scholar] [CrossRef]
  74. Ayoubi, S.; Abazari, P.; Zeraatpisheh, M. Soil great groups discrimination using magnetic susceptibility technique in a semi-arid region, central Iran. Arab. J. Geosci. 2018, 11, 616. [Google Scholar] [CrossRef]
  75. Hu, X.-F.; Su, Y.; Ye, R.; Li, X.-Q.; Zhang, G.-L. Magnetic properties of the urban soils in Shanghai and their environmental implications. Catena 2007, 70, 428–436. [Google Scholar] [CrossRef]
  76. Royall, D. Use of mineral magnetic measurements to investigate soil erosion and sediment delivery in a small agricultural catchment in limestone terrain. Catena 2001, 46, 15–34. [Google Scholar] [CrossRef]
  77. MULLINS, C.E. Magnetic susceptibility of the soil and its significance in soil science—A review. J. Soil Sci. 1977, 28, 223–246. [Google Scholar] [CrossRef]
  78. Theocharopoulos, S.; Florou, H.; Walling, D.; Kalantzakos, H.; Christou, M.; Tountas, P.; Nikolaou, T. Soil erosion and deposition rates in a cultivated catchment area in central Greece, estimated using the 137Cs technique. Soil Tillage Res. 2003, 69, 153–162. [Google Scholar] [CrossRef]
  79. Sac, M.; Uğur, A.; Yener, G.; Özden, B. Estimates of soil erosion using cesium-137 tracer models. Environ. Monit. Assess. 2008, 136, 461–467. [Google Scholar] [CrossRef] [PubMed]
  80. Karchegani, P.M.; Ayoubi, S.; Lu, S.G.; Honarju, N. Use of magnetic measures to assess soil redistribution following deforestation in hilly region. J. Appl. Geophys. 2011, 75, 227–236. [Google Scholar] [CrossRef]
  81. Khormali, F.; Ajami, M. Pedogenetic investigation of soil degradation on a deforested loess hillslope of Golestan Province, Northern Iran. Geoderma 2011, 167, 274–283. [Google Scholar] [CrossRef]
  82. Fujiyoshi, R.; Sawamura, S. Mesoscale variability of vertical profiles of environmental radionuclides (40K, 226Ra, 210Pb and 137Cs) in temperate forest soils in Germany. Sci. Total Environ. 2004, 320, 177–188. [Google Scholar] [CrossRef]
  83. Gaspar, L.; Quijano, L.; Lizaga, I.; Navas, A. Effects of land use on soil organic and inorganic C and N at 137Cs traced erosional and depositional sites in mountain agroecosystems. Catena 2019, 181, 104058. [Google Scholar] [CrossRef]
  84. Liu, L.; Zhang, K.; Zhang, Z.; Qiu, Q. Identifying soil redistribution patterns by magnetic susceptibility on the black soil farmland in Northeast China. Catena 2015, 129, 103–111. [Google Scholar] [CrossRef]
  85. Taghizadeh-Mehrjardi, R.; Nabiollahi, K.; Kerry, R. Digital mapping of soil organic carbon at multiple depths using different data mining techniques in Baneh region, Iran. Geoderma 2016, 266, 98–110. [Google Scholar] [CrossRef]
  86. Zeraatpisheh, M.; Jafari, A.; Bodaghabadi, M.B.; Ayoubi, S.; Taghizadeh-Mehrjardi, R.; Toomanian, N.; Kerry, R.; Xu, M. Conventional and digital soil mapping in Iran: Past, present, and future. Catena 2020, 188, 104424. [Google Scholar] [CrossRef]
  87. Mohammed, S.; Al-Ebraheem, A.; Holb, I.J.; Alsafadi, K.; Dikkeh, M.; Pham, Q.B.; Linh, N.T.T.; Szabo, S. Soil management effects on soil water erosion and runoff in central Syria—A comparative evaluation of general linear model and random forest regression. Water 2020, 12, 2529. [Google Scholar] [CrossRef]
Figure 1. Location of the study area. (a) Isfahan province among all the provinces in Iran, (b) location of the study area in the Semirom district, (c) geology map and the geological formations in the region, and (d) location of three land uses in the study area.
Agronomy 12 00451 g001
Figure 2. Three-dimensional pattern of sampling scheme in the study area in different hillslope positions.
Agronomy 12 00451 g002
Figure 3. Variability of some soil properties at a 0–30 cm depth in various land uses at four slope positions in the study area: (a) CCE (calcium carbonate equivalent), TN: total nitrogen; (b) Pava (available phosphorus); (c) Kava (available phosphorus), (d) TN (total nitrogen); (e) SOM (soil organic matter); (f) ρb (bulk density). Means (n = 24) with the same letter are significantly different using the least significant difference (LSD) test at p < 0.01.
Agronomy 12 00451 g003
Figure 4. Variability in magnetic susceptibility (χlf) at three land uses in four slope positions (a,b) the relationship between χlf and χfd for all studied soil samples. Means with the same letter are significantly different using the least significant difference (LSD) test at p < 0.01.
Agronomy 12 00451 g004
Figure 5. Variability in magnetic susceptibility (χlf) at three land uses in four slope positions, means with the same letter are significantly different using the least significant difference (LSD) test at p < 0.01 (a,b) the relationship between χlf and χfd for all studied soil samples.
Agronomy 12 00451 g005aAgronomy 12 00451 g005b
Figure 6. Non-linear relationships between χlf and 137Cs inventory in three land uses: (a) apple orchard; (b) dryland; (c) rangeland.
Agronomy 12 00451 g006
Figure 7. The variable importance analysis of soil properties in the prediction of 137Cs inventory for the random forest model. CCE: calcium carbonate equivalent; TN: total nitrogen; Pava: available phosphorous; Kava: available potassium; ρb: bulk density; EC: electrical conductivity; SOM: soil organic matter; χlf: magnetic susceptibility at low frequency; χhf: magnetic susceptibility at high frequency.
Agronomy 12 00451 g007
Table 1. Descriptive statistics of studied variables in three selected land uses.
Variable (Unit)Rangeland (n = 24)Dryland Farming (n = 24)Apple orchard (n = 24)
MinMaxMeanCV (%)SkewMinMaxMeanCV (%)SkewMinMaxMeanCV (%)SkewKS
Radionuclide property137CS(Bqm−2)102617821411.5019.76−0.065092099.601166.8026.610.51619.501417.501000.824.610.120.14
Soil chemical propertiesPava (mg kg−1)30.6148.9135.8217.541.1019.1842.6732.1628.19−0.1545.2783.2465.4318.100.020.12
Kava (mg kg−1)294.66667.59445.6526.720.35240.60532.06362.1826.970.53294.66548.29407.2521.070.300.10
EC (dS m−1)1.091.401.275.97−0.561.021.501.1913.260.630.981.331.1510.340.260.19
pH (−log[H+])7.607.807.700.810.137.607.747.640.670.717.507.717.601.160.010.20
CCE (%)17.5035.5027.9920.13−0.511840.5030.8824.40−0.4323.504535.3921.45−0.400.22
SOM (%)1.092.351.55240.791.032.181.5521.430.441.472.291.8312.220.350.19
TN (%)0.090.300.2039.670.020.050.300.1664.100.370.120.400.2838.14−0.100.21
Soil physical propertiesρb (g cm−3)1.041.801.4516.98−0.191.201.881.6014.39−0.491.161.891.5016.180.050.17
Sand (%)20.3037.2032.1413.61−1.1119.2237.9026.4621.970.5118.5436.8828.8317.180.420.10
Clay (%)42.2566.6553.2013.990.6040.3858.0446.659.200.5738.4659.5046.7210.350.930.11
Silt (%)10.6627.1817.4526.300.819.1438.4826.8928.73−0.4913.2033.9424.4521.440.00410.10
Magnetic propertiesχlf (10−8 m3 kg−1)20.030.024.6814.150.2224.029.026.756.06−0.3422.029.5026.696.62−0.620.14
χhf (10−8 m3 kg−1)19.029.023.6314.490.2023.028.025.636.39−0.1720.028.025.337.05−0.790.12
137Cs: Caesium inventory; Pava: available phosphorous; Kava: available potassium; EC: Electrical conductivity; CCE: Calcium carbonate equivalent; TN: Total nitrogen; ρb: bulk density; χlf: magnetic susceptibility at low frequency; χhf: magnetic susceptibility at high frequency; Skew: Skewness. KS: Kolmogorov–Smirnoff criteria.
Table 2. Comparison of the mean values of soil quality indices in different land uses and slope positions.
Land UseRangeland (n = 24)Dryland Farming (n = 24)Apple Orchard (n = 24)Pr > F
SQIn0.372 b0.336 b0.429 a0.0002 *
ShoulderbackslopefootslopetoeslopeShoulderbackslopefootslopetoeslopeShoulderbackslopefootslopetoeslope
0.306 c0.326 c0.399 b0.458 a0.267 c0.276 c0.369 b0.432 a0.345 b0.372 b0.499 a0.498 a0.0001 *
* Significant at the 0.01. Means (n = 24) with the same letter are significantly different using the least significant difference (LSD) test at p < 0.01. SQIn: Nemoro soil quality index.
Table 3. Soil quality grade classification for indices and indicator methods.
IndexIndicator MethodSSFSoil Quality Grades
I (Very High)II (High)III (Moderate)IV (Low)V (Very Low)
SQInTDSLinear>0.4590.400–0.4590.341–0.4000.281–0.341<0.281
SQIn: Nemoro soil quality index, SSF: standard scoring functions.
Table 4. Correlation coefficients among the soil properties in the studied sites at different land uses.
Variable137CSSOMKavaCCETNρbPavaχlf
Apple orchard (n = 24)
137CS1
SOM0.87 **1
Kava0.85 **0.66 **1
CCE−0.95 **−0.87 **−0.74 **1
TN0.95 **0.77 **−0.83 **−0.87 **1
ρb0.99 **0.86 **0.91 **−0.93 **0.95 **1
Pava0.89 **0.84 **0.84 **−0.94 **0.94 **0.98 **1*
χlf0.42 **0.260.84 **−0.41 *0.53 **0.47 **0.55 **1
Dryland farming (n = 24)
137CS1
SOM0.83 **1
Kava0.96 **0.89 **1
CCE−0.98 **−0.85 **−0.97 **1
TN0.91 **0.79 **0.93 **−0.93 **1
ρb0.90 **0.64 **0.83 **−0.90 **0.83 **1
Pava0.93 **0.71 **0.90 **−0.94 **0.93 **0.97 **1
χlf0.47 *0.390.44 *−0.45 *0.27−0.43 *0.331
Rangeland (n = 24)
137CS1
SOM0.80 **1
Kava0.94 **0.90 **1
CCE−0.84 **−0.87 **−0.92 **1
TN0.96 **0.82 **0.96 **−0.85 **1
ρb0.99 **0.78 **0.93 **−0.83 **0.96 **1
Pava0.82 **0.84 **0.88 **−0.92 **0.84 **0.81 **1
χlf0.42 *0.30.340.370.350.380.44 *1
*, **, Significant at 95 and 99% probability level. 137Cs: Caesium inventory; SOM: Soil organic matter; Kava: available potassium; Pava: available phosphorous; CCE: calcium carbonate equivalent; TN: total nitrogen; ρb: bulk density; χlf: magnetic susceptibility at low frequency; χhf: magnetic susceptibility at high frequency.
Table 5. Random forest model results between 137CS inventory as the dependent variable and soil properties as independent variables in the study area.
VariablemtryntreeRMSE ± SDR2 ± SDMAE ± SD
137CS inventory13500111.29 ± 26.850.94 ± 0.0489.58 ± 23.75
mtry: number of variables in each random subset; ntree: number of trees in the forest; RMSE: root mean square error; R2: coefficient of determination; MAE: mean absolute error.
Publisher’s Note: MDPI stays neutral with regard to jurisdictional claims in published maps and institutional affiliations.

