Article

Preference of Pollinators over Various Forage Mixtures and Microelement Treatments

1
Department of Animal Nutrition and Forage Production, Faculty of AgriSciencis, Mendel University in Brno, Zemedelska 1, 613 00 Brno, Czech Republic
2
Department of Zoology, Fisheries, Hydrobiology and Apiculture, Mendel University in Brno, Zemedelska 1, 613 00 Brno, Czech Republic
3
Department of Environmental and Chemical Engineering, University of Pardubice, Studentská 573, 532 10 Pardubice, Czech Republic
4
Department of Crop Science, Breeding and Plant Medicine, Faculty of AgriSciences, Mendel University in Brno, Zemedelska 1, 613 00 Brno, Czech Republic
5
Faculty of Agriculture, University of South Bohemia in Ceske Budejovice, Studentska 1668, 370 05 Ceske Budejovice, Czech Republic
*
Author to whom correspondence should be addressed.
Agronomy 2022, 12(2), 370; https://doi.org/10.3390/agronomy12020370
Submission received: 24 December 2021 / Revised: 27 January 2022 / Accepted: 29 January 2022 / Published: 1 February 2022

Abstract

:
Low plant species richness and abundance, as well as contamination, can lead to a lack of nutrients in the diets of pollinators. This can cause increased oxidative stress, low resistance to disease and reduced detoxification ability. We proposed three forage mixtures with different botanical compositions, all of which should provide continuous forage for a wide range of pollinators. The monitored mixtures were treated by foliar application with selenium and zinc. Both elements should increase the quality of pollen and nectar. The effect of meadow mixtures and microelements on pollinator abundance, richness, and preference was evaluated using data obtained via the line transect method. Furthermore, the amount of selenium and zinc in the flowers was determined. It was found that the microelement treatment did not have any effect on the abundance and richness of the main pollinator taxa, which were affected only by a botanical composition of meadow mixtures. However, a preference for zinc-treated forage was observed in Apis mellifera, and a preference for selenium-treated forage was observed in Bombus spp. These two eusocial taxa appear to respond to an increased amount of microelements in the treated meadow mixtures. On the contrary, Lepidoptera was tied to untreated forage, where they were probably pushed by social bee species due to the competition.

1. Introduction

The plant–pollinator relationship is important for maintaining biodiversity on Earth [1]. The majority of flowering crops are pollinated by animals [2], and without good pollination these plants suffer from low seed production [3]. Therefore, pollinators are largely involved in maintaining high plant diversity [4] as well as in optimizing crop yields [5]. However, increasing agricultural intensification with the growth of the human population results in drastic changes to the landscape. This leads to a decline in the diversity and availability of pollinators’ food resources [6,7]. This decrease in the diversity and abundance of entomophilic flowering plants causes reduced diversity and availability of macro- and microelements in pollinator nutrition [8], to which insect pollinators are very sensitive [9,10]. In addition, shortage of food resources in the landscape causes competition among pollinators [11]. Another phenomenon which affects pollinators is the application of pesticides [12]. As a result of these problems, nutritional stress and malnutrition negatively affect pollinator populations [13,14]. Inadequate nutrition may cause increased vulnerability to diseases [15,16], greater susceptibility to pesticides [17], and in the end decrease the diversity and abundance of pollinators [18,19].
Perennial forage is an important source of food for many pollinator taxa [20,21] due to the higher number of flowering plant species and the continuity of flowering over time [22]. In addition, growing perennial forage is often considered environmentally friendly [23]. Perennial forage enriches the soil with organic matter, and vegetation cover protects the soil surface from water and wind erosion throughout the year [24]. However, perennial forage is often stressed due to biotic and abiotic stressors and consequently can be attacked by various pathogens [25,26], contributing to increased toxin synthesis. This reduces the fitness of plants and can negatively affect the creation and function of plant generative organs as well as reducing the production and quality of pollen and nectar [27,28].
Increasing the supply selenium (Se) [29] and zinc (Zn) [30] to plants can be a preventive measure against these negative effects. These elements support the activity of the antioxidant chain of plants [26], which reduces physiological stress and improves the development and functioning of generative organs and the subsequent enrichment of nectar with selenium [31,32]. These microelements promote nectar production and make plants more attractive to pollinators [33,34]. By applying these elements, it is possible to increase plant viability, delay senescence [35], and contribute to plant resistance to drought and other stressors [25].
Zinc deficiency causes stunting and delayed flowering [30]. Foliar application of zinc demonstrably increases the resistance of plants to dryness and at the same time increases the Zn content in the plant. Zinc acts as an enzyme activator in plants and is part of the superoxide dismutase (SOD) system [25]. Zn can thus increase the viability of plant species and promote their better use in the cultural landscape as a support for pollinators [36].
In addition, by increasing the selenium content plants can be protected from attack by important pathogens [29]. Selenium increases the ability of plants to withstand environmental stress such as wetting and salinization of the soil, drought, and low temperatures. Foliar application may even increase the acceptability of other nutrients by plants [37].
However, the effect of selenium and zinc nutrition has not yet been studied in most plant species, let alone whole communities. Exceptions include some agricultural crops such as maize (Zea mays) and wheat (Triticum aestivum) [38,39]; however, they have only minimal benefits for pollinators. Of the crops important for pollinators, the effect of selenium has been tested on buckwheat (Fagopyrum esculentum), although only the effect on yield was described [40].
In addition to plants, selenium and zinc are essential for animals [41], which assumes a positive response for pollinators due to the improved qualitative and quantitative parameters of pollinators’ food resources due to increased zinc and selenium content in plants. In honey bees (Apis mellifera), an increase in antioxidant activity and an increase in the viability of both adults and larvae was observed during Zinc supplementation [42]. In an organism, selenium has catalytic, structural, and regulatory functions. It starts the action of many hormones, vitamins, and enzymes, thus ensuring the implementation of many biochemical and physiological reactions in the body, and helps to maintain the normal function of biological systems [43]. Thus, increasing the nutrition value in the diet may be a key factor in improving pollinators’ viability and detoxification ability [44].

2. Materials and Methods

2.1. Locations

The experiment was carried out in the spring and summer of 2021 at two different localities (Figure 1). Troubsko locality (southern Moravia, Czech Republic) is represented by a dry and warm habitat. The area is characterized by its flat surface, with an average altitude of 285 m, average precipitation of 506.5 mm, and average yearly temperature over 9.5 °C. Vatín locality (western Moravia, Czech Republic) is represented by humid and cold conditions. The area is characterized by its hilly surface, with an average altitude of 560 m, average precipitation of 617 mm, and average yearly temperature over 6.9 °C (Table 1).

2.2. Meadow Mixtures

A total of three meadow mixtures were designed with respect to the composition of different plant families. Meadow mixtures a was characterized by a broad spectrum of plant blossom families, with a high ratio of Fabaceae and an absence of Poaceae. Meadow mixture b was characterized by a mixture of two-thirds Poaceae combined with one-third blossom plant species. In meadow mixture c, the plant family Poaceae was predominant. The complete compositions are given in Table 2. All of the sowing material was acquired from Agrostis (Czech Republic).

2.3. Design of Experiment

Testing plots of 1.25 × 8 m were created and used for the following treatments:
(a)
Control (without application of Zn and Se);
(b)
Foliar application of Se: 20 g Se ha−1 (in 250 L water ha−1) (form Na2SeO3) [38];
(c)
Foliar application of Zn: 200 g Zn ha−1 (in 250 L water ha−1) (form ZnSO4×7H2O) [45];
(d)
Foliar application of Se and Zn: 20 g Se ha−1 (form Na2SeO3) + 200 g Zn ha−1 (all in 250 l water ha−1) (form ZnSO4×7H2O).
Each of the two sites at the experimental field was divided into three plots represented by meadow mixtures, then each plot was split into twelve split-plots represented by microelement treatments; in addition, each split-plot was sampled repeatedly throughout the year. Each variety (meadow mixture) and each treatment (foliar application) consisted of three repetitions (n = 3). The foliar application of zinc and selenium was carried out using a garden sprayer (AkkuStar, Technische produkte Ges. M.B.H.) at the beginning of plant flowering, i.e., 2 May 2021 at the experimental locality in Troubsko and 9 May 2021 at the experimental locality in Vatín. Every plot was monitored once per week in three repetitions, from the beginning of flowering until mowing (13.07. in Troubsko and 7 July 2021 in Vatín). Species foraging on a plot mixture were identified by line transect. Pollinators’ visits to the blossoms of the observed plot were assessed visually in three transects throughout each plot, and the attendance of pollinators was recorded. Each observation was carried out in sunny weather.
Visits by pollinators were observed for a total of 10 min each by slowly walking around flowering plots at 10:00, 12:00, 14:00, and 16:00 h for each locality. The recorded pollinators were divided into five taxonomic groups: A. mellifera, Bombus spp., solitary bees, Lepidoptera, and Diptera. Only the presence/absence and quantity of individual taxonomic groups were recorded. Based on the insect observations, taxon richness and abundance were calculated for each replication. A replication was represented by samples collected on a particular date, from a single site in a plot with a particular combination of treatment and meadow mixture.

2.4. Determination of Zn and Se Content in Flowers

Determination of Zn and Se in plant tissues was carried out using inductively coupled plasma optical emission spectrometry (ICP OES) and inductively coupled plasma mass spectrometry (ICP MS) after microwave decomposition of samples.
The samples were decomposed prior to the analysis using a Speedwave® Xpert microwave oven (Berghof, Germany, maximal applied power 2000 W) with a multi-tube system. The plant tissue (two replicates, about 150 mg) was inserted into digestion tubes and treated with 2 mL of sub-boilingly distilled (Berghof, Eningen, Germany) nitric acid (per analysis, Lachner, Neratovice, the Czech Republic) under the following conditions: 10 min at 170 °C, 30% of maximal power; 10 min at 200 °C, 30% of power; 30 min at 30 °C, 0% of power. The mineralised samples were filled up to the final volume of 10 mL with deionised water (conductivity 0.055 μS cm−1, Evoqua Water Technologies, Günzburg Günzburg, Germany).
The analysis of Zn was carried out using an ICP OES INTEGRA 6000 (GBC, Braeside, Australia). The analytical line used was 213.856 nm. The operation conditions of the ICP OES analysis were as follows: sample flow rate 1.5 mL min−1; plasma power 1000 W; plasma, auxiliary and nebulizer gas flow rates 10, 0.4, and 0.52 L/min−1, respectively; photomultiplier voltage 600 V for Ni, Co, and Cr and 350 V for Ca and Mg; view height 6.5 mm; three replicated readings on-peak 1 s; fixed point background correction.
The analysis of Se was carried out using an ICP MS Agilent 7900 (Agilent, Santa Clara, United States) at plasma power 1550 W, sampling depth 10 mm, plasma gas flow 15 L min−1, auxiliary gas flow 0.9 L min−1, nebuliser gas flow 1.05 L min−1, nebulizer pump 0.1 rps, and spray chamber temperature2 °C in three replicates with a total acquisition time of 11 s. The isotope 78Se in high energy helium mode (He flow 10 L min−1) was used.
The external calibration standards (10−5−1−0.5−0.1 mg L−1 of Zn and 10−5−1−0.5−0.1−0.05−0.01 µg L−1 of Se) were prepared using commercial standard solutions of Zn and Se, all containing 1 g L−1 (SCP, Clark Graham Baie D’Urfé, Canada); the limits of detection were 1 μg L−1 for Zn and 0.006 µg L−1 of Se. A certified reference material (twigs and leaves GBW 07602 from the China National Analysis Center for Iron and Steel, Beijing, China) was used to validate the method and as a quality control.

2.5. Statistical Analysis

To analyse the relationship between observed taxon richness and the variety of meadow mixtures or application of microelements, we used a generalized linear mixed-effect model with poisson error distribution. Based on the split-plot arrangement of experimental fields, a mixed model was designed as a nested random intercept model. Meadow mixtures, application of microelements and their interaction were used as fixed effect variables in the model, and the other factors were used as nested random effect variables (meadows within sampling dates and within localities represented by the experimental fields). Finally, the marginal effect of each explanatory variable in the model was tested by Chi-square test in the analysis of deviance. In addition, significance testing between each variety of meadow mixture was analysed by Tukey HSD post hoc multiple comparisons testing. Data were analysed in R statistical software (4.0.1., R Core Team: Auckland, New Zealand).
Changes in species composition with different microelement treatments and meadow mixtures were analysed using ordination techniques. The data used for evaluation were species composition at sampling plot, which was repeatedly recorded, and the settings of ordination analysis were different depending on whether we tested a whole-plot factor (meadow mixtures) or a split-plot factor (microelement treatments). The abundances of each species were centred and transformed by a decimal logarithm. The significance of the whole-plot predictor was tested with a Monte Carlo permutation test with 2000 permutations. To visualize changes in species composition among meadows, we used partial redundancy analysis (pRDA) with the treatment and locality as covariables. We performed unrestricted permutations of species composition across whole-plots (i.e., meadow mixtures) where the records from the same plot were kept together. The dependent permutations preserved the order of the repeated measurements in time within each whole-plot. To visualize changes in species composition among microelement treatments, we used partial redundancy analysis (pRDA) with the meadow mixtures and locality as covariables. We performed restricted permutations of species composition across split-plots (i.e., microelement treatments) within each whole-plot, then permuted them using cyclic shifts to maintained the time autocorrelation of individual records. All ordination analyses were conducted by the statistical software CANOCO, v. 5 (Microcomputer Power, Ithaca, NY, USA) [46].
The amount of Se and Zn in flowers was analyzed using Statistica 12 (TIBCO Software, Inc., Palo Alto, CA, USA, 2021). The effect of treatments on the amount of applied microelements was tested by analysis of variance (ANOVA), followed by post hoc analysis using Tukey’s test. Statistical significance was tested at a significance level of p = 0.05.

3. Results

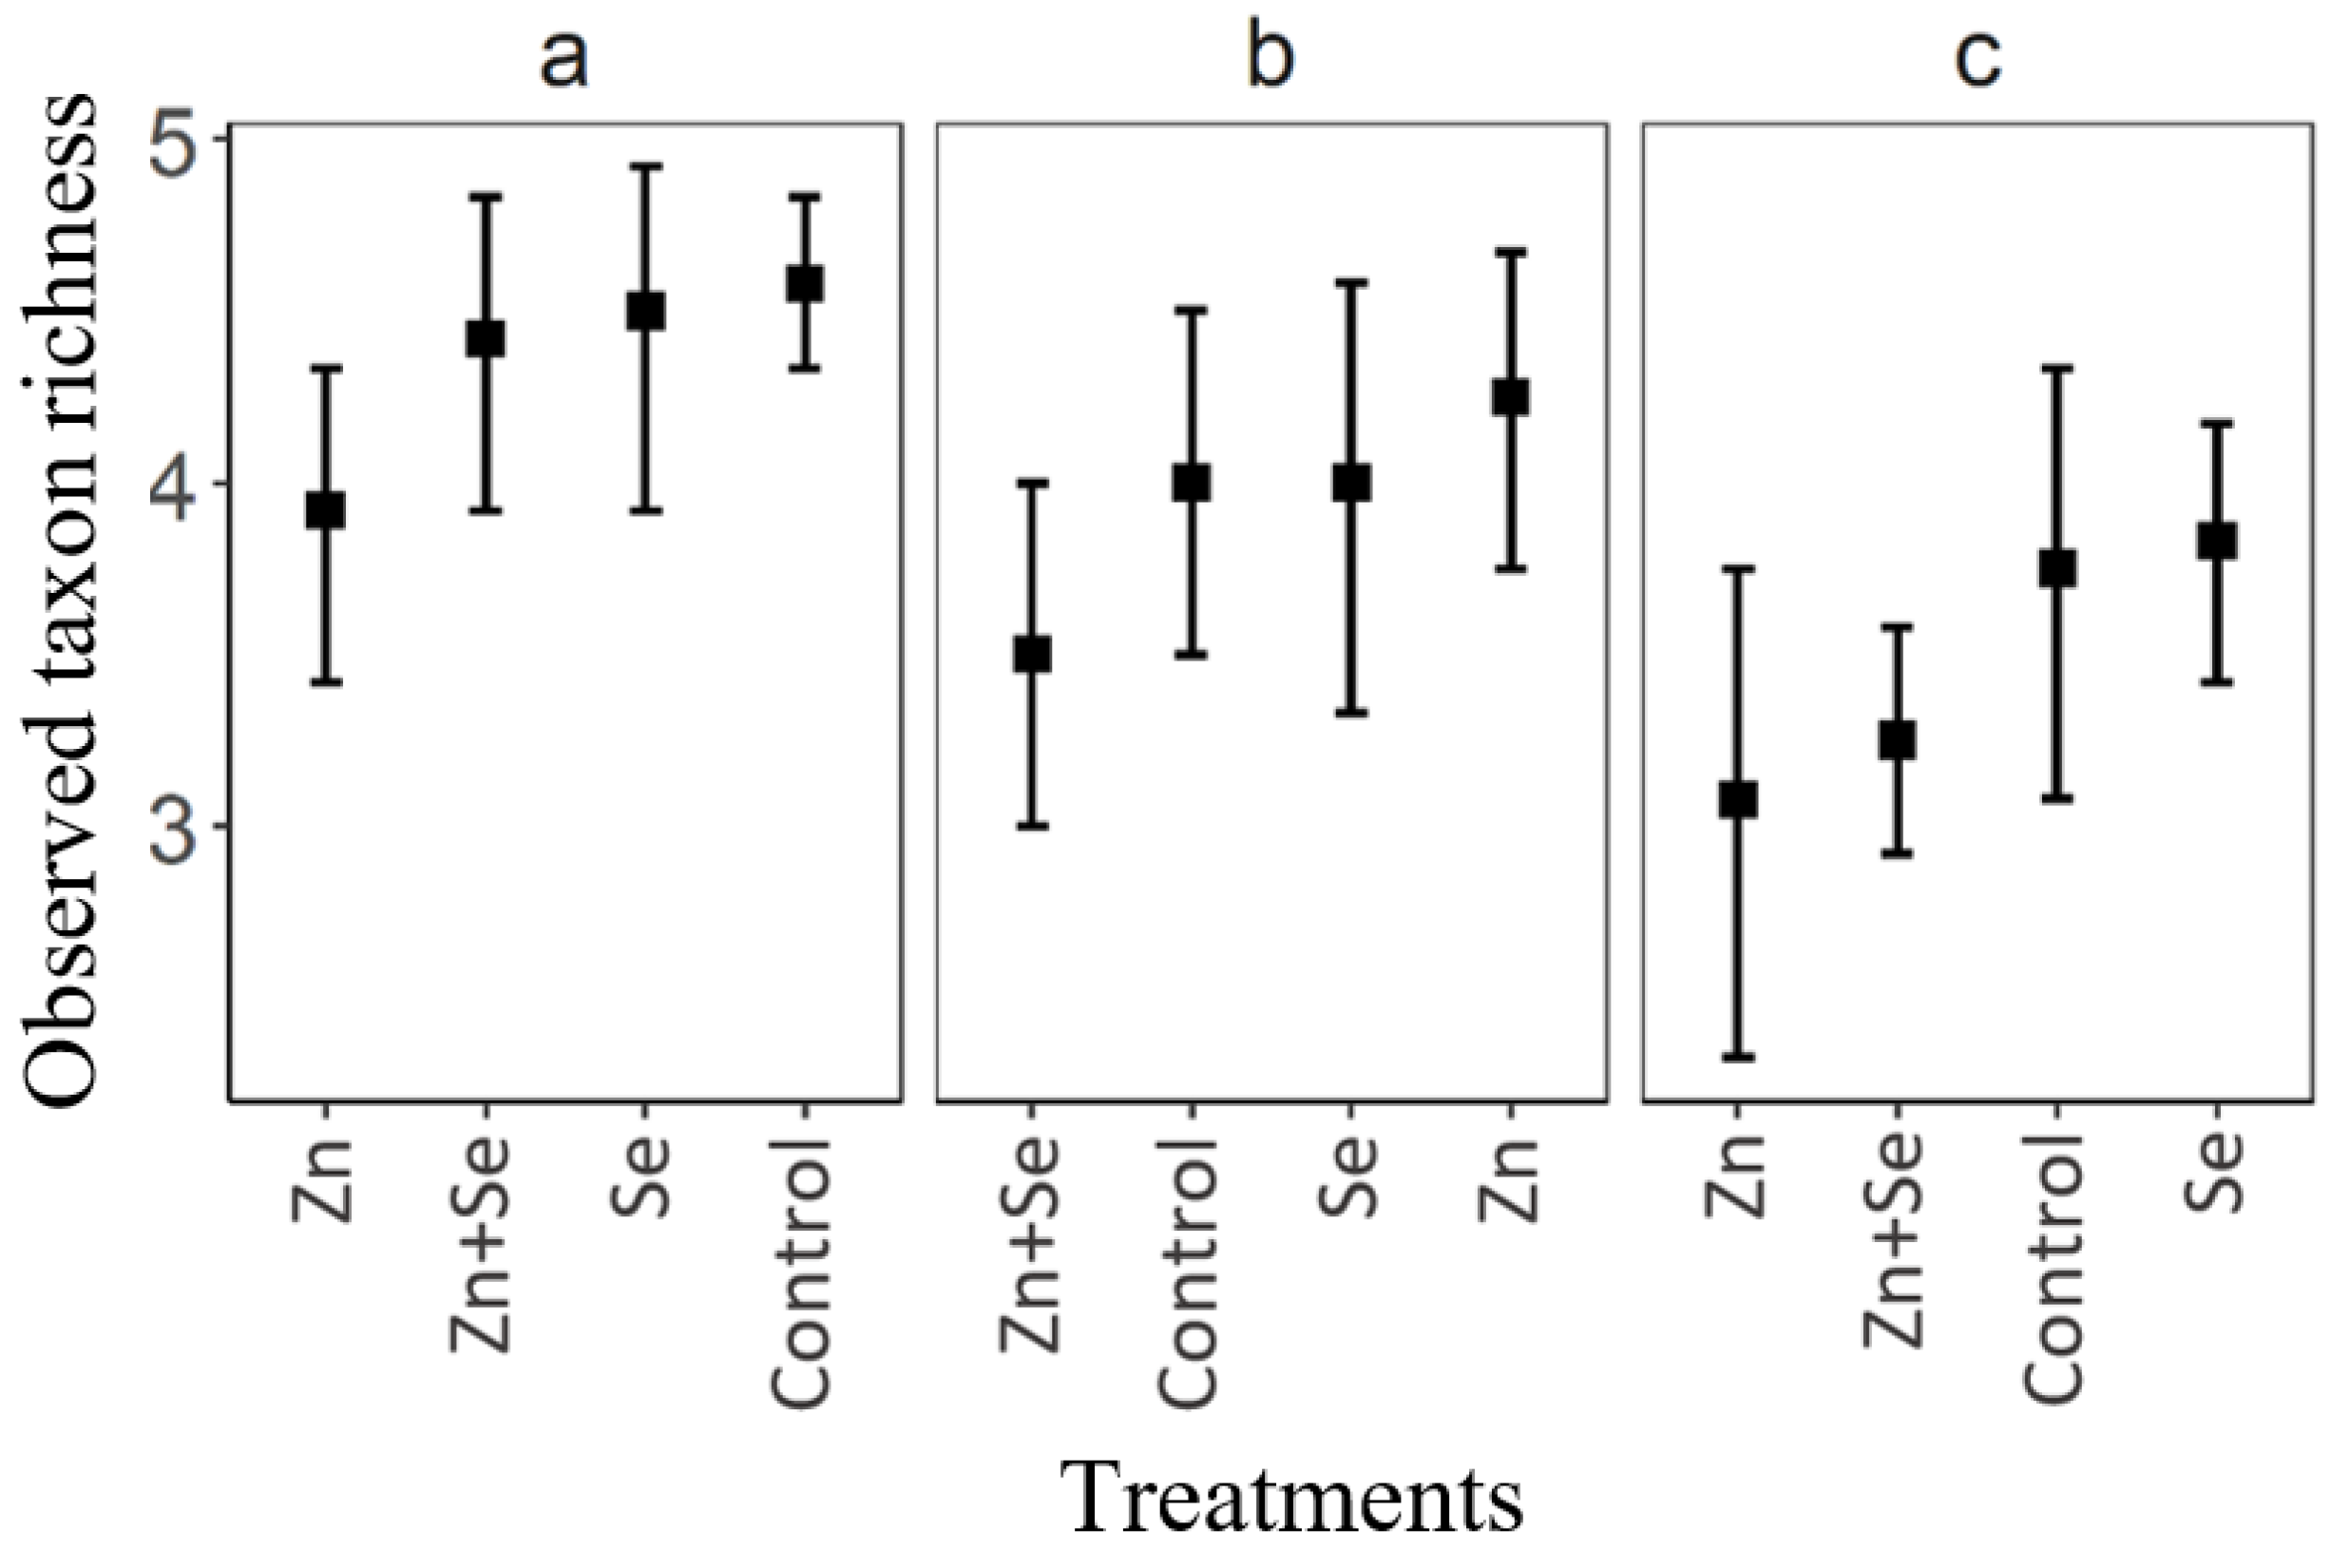
Differences in the species richness of pollinators depending on foliar microelement treatment and meadow mixture are showed in Figure 2. The differences were only highly significant between meadow mixtures (Table 3). Differences in pollinator abundance depending on treatment were not significant, nor was interaction between treatment and meadow (Table 3).
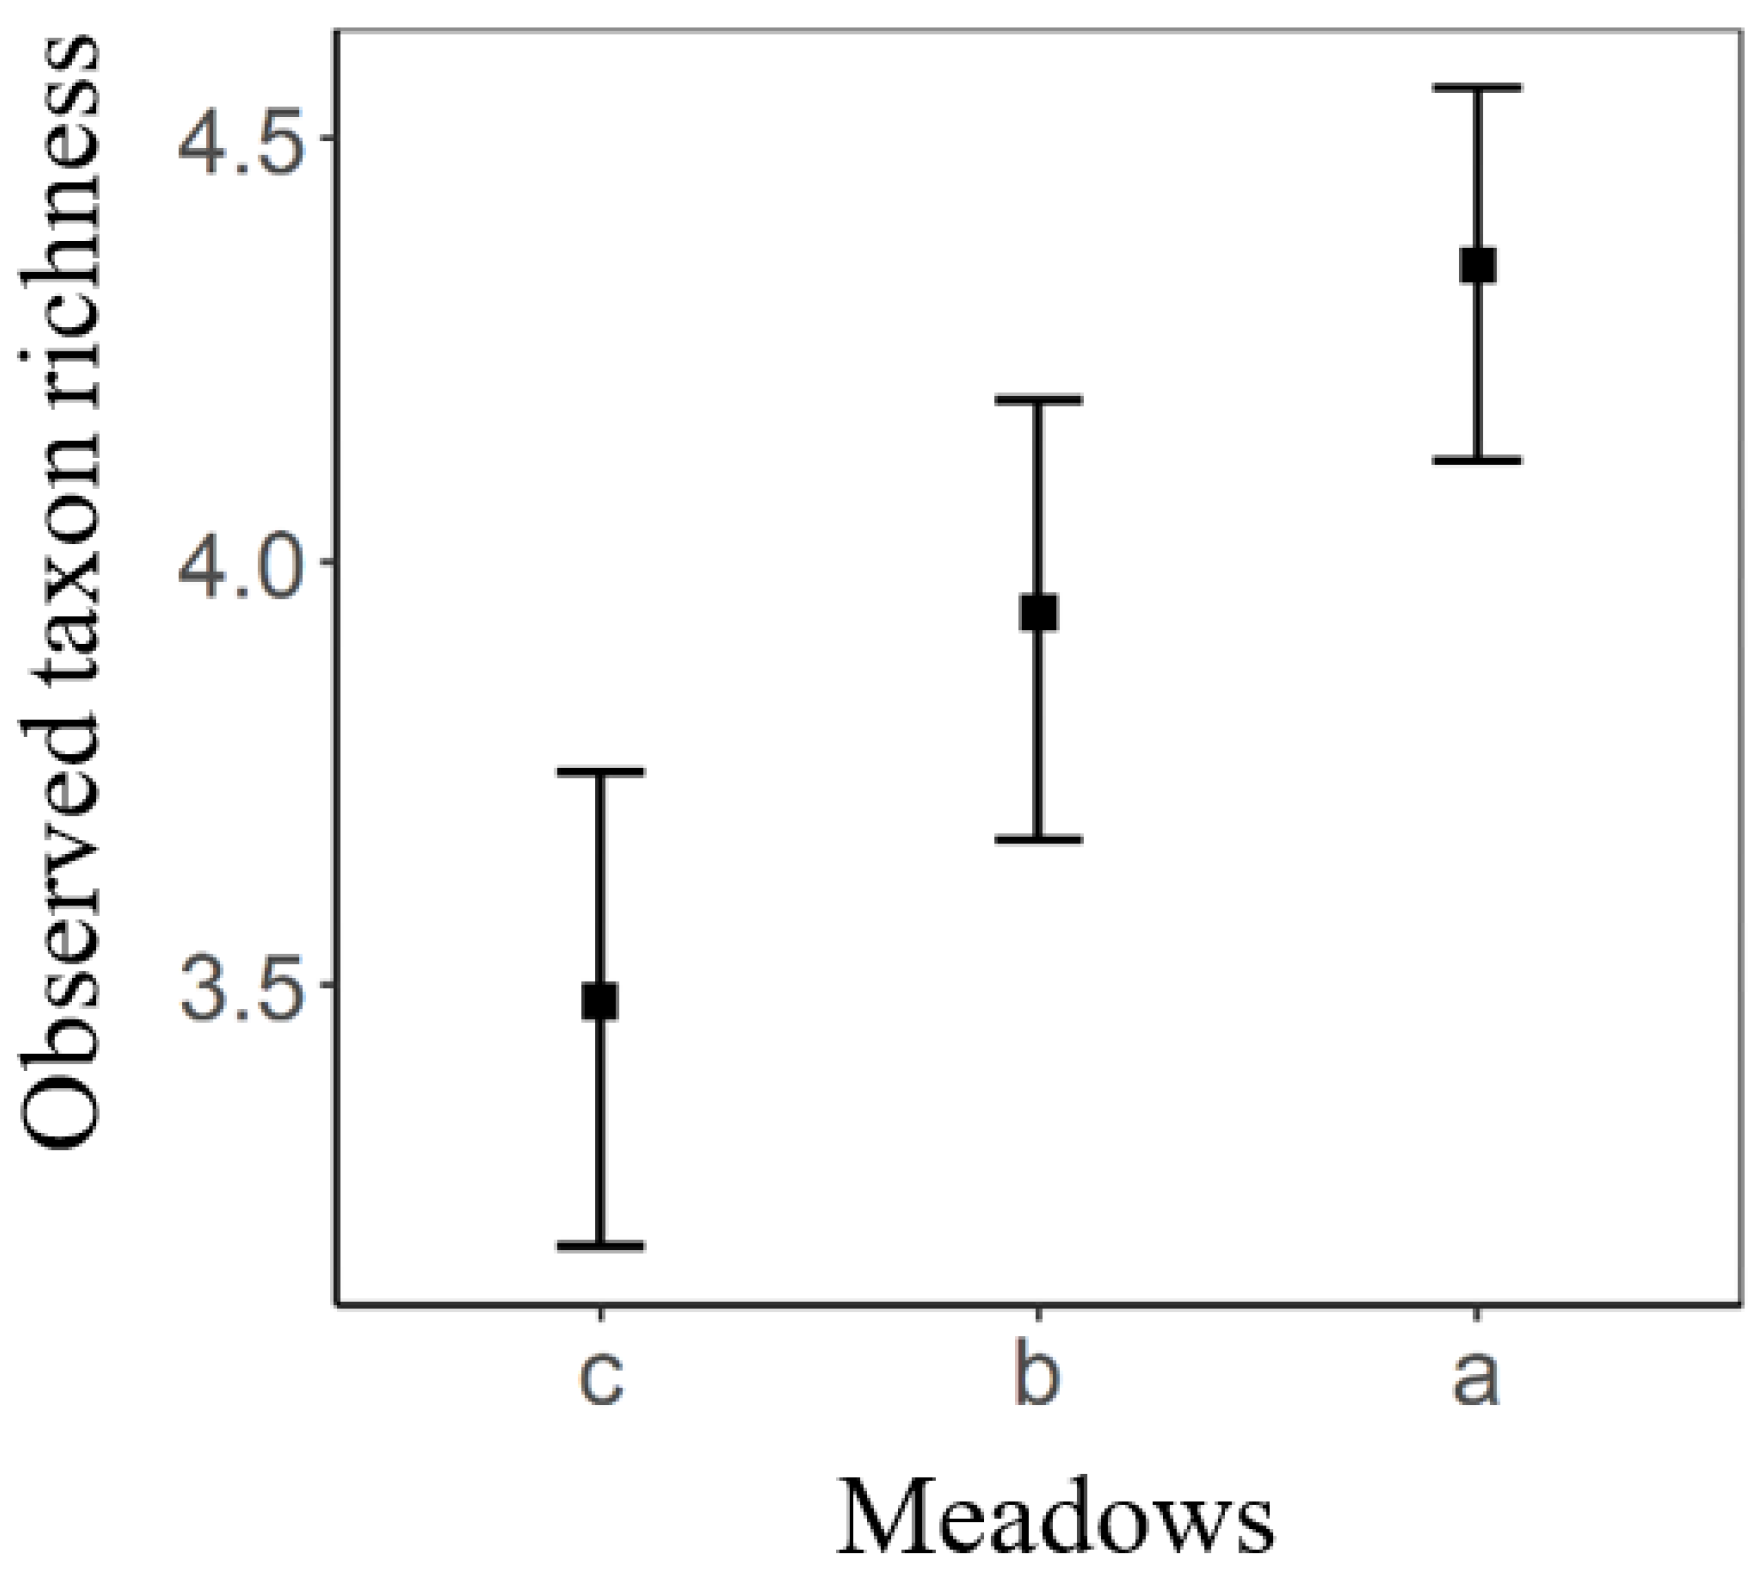
Taxon richness varied considerably between all tested meadow mixtures. The highest taxon richness was observed with meadow mixture a (Figure 3). On the other hand, the lowest richness was observed with meadow mixture c (Table 4). Meadow mixture b had a significantly lower richness than mixture a, and a higher richness than mixture c (Table 4).
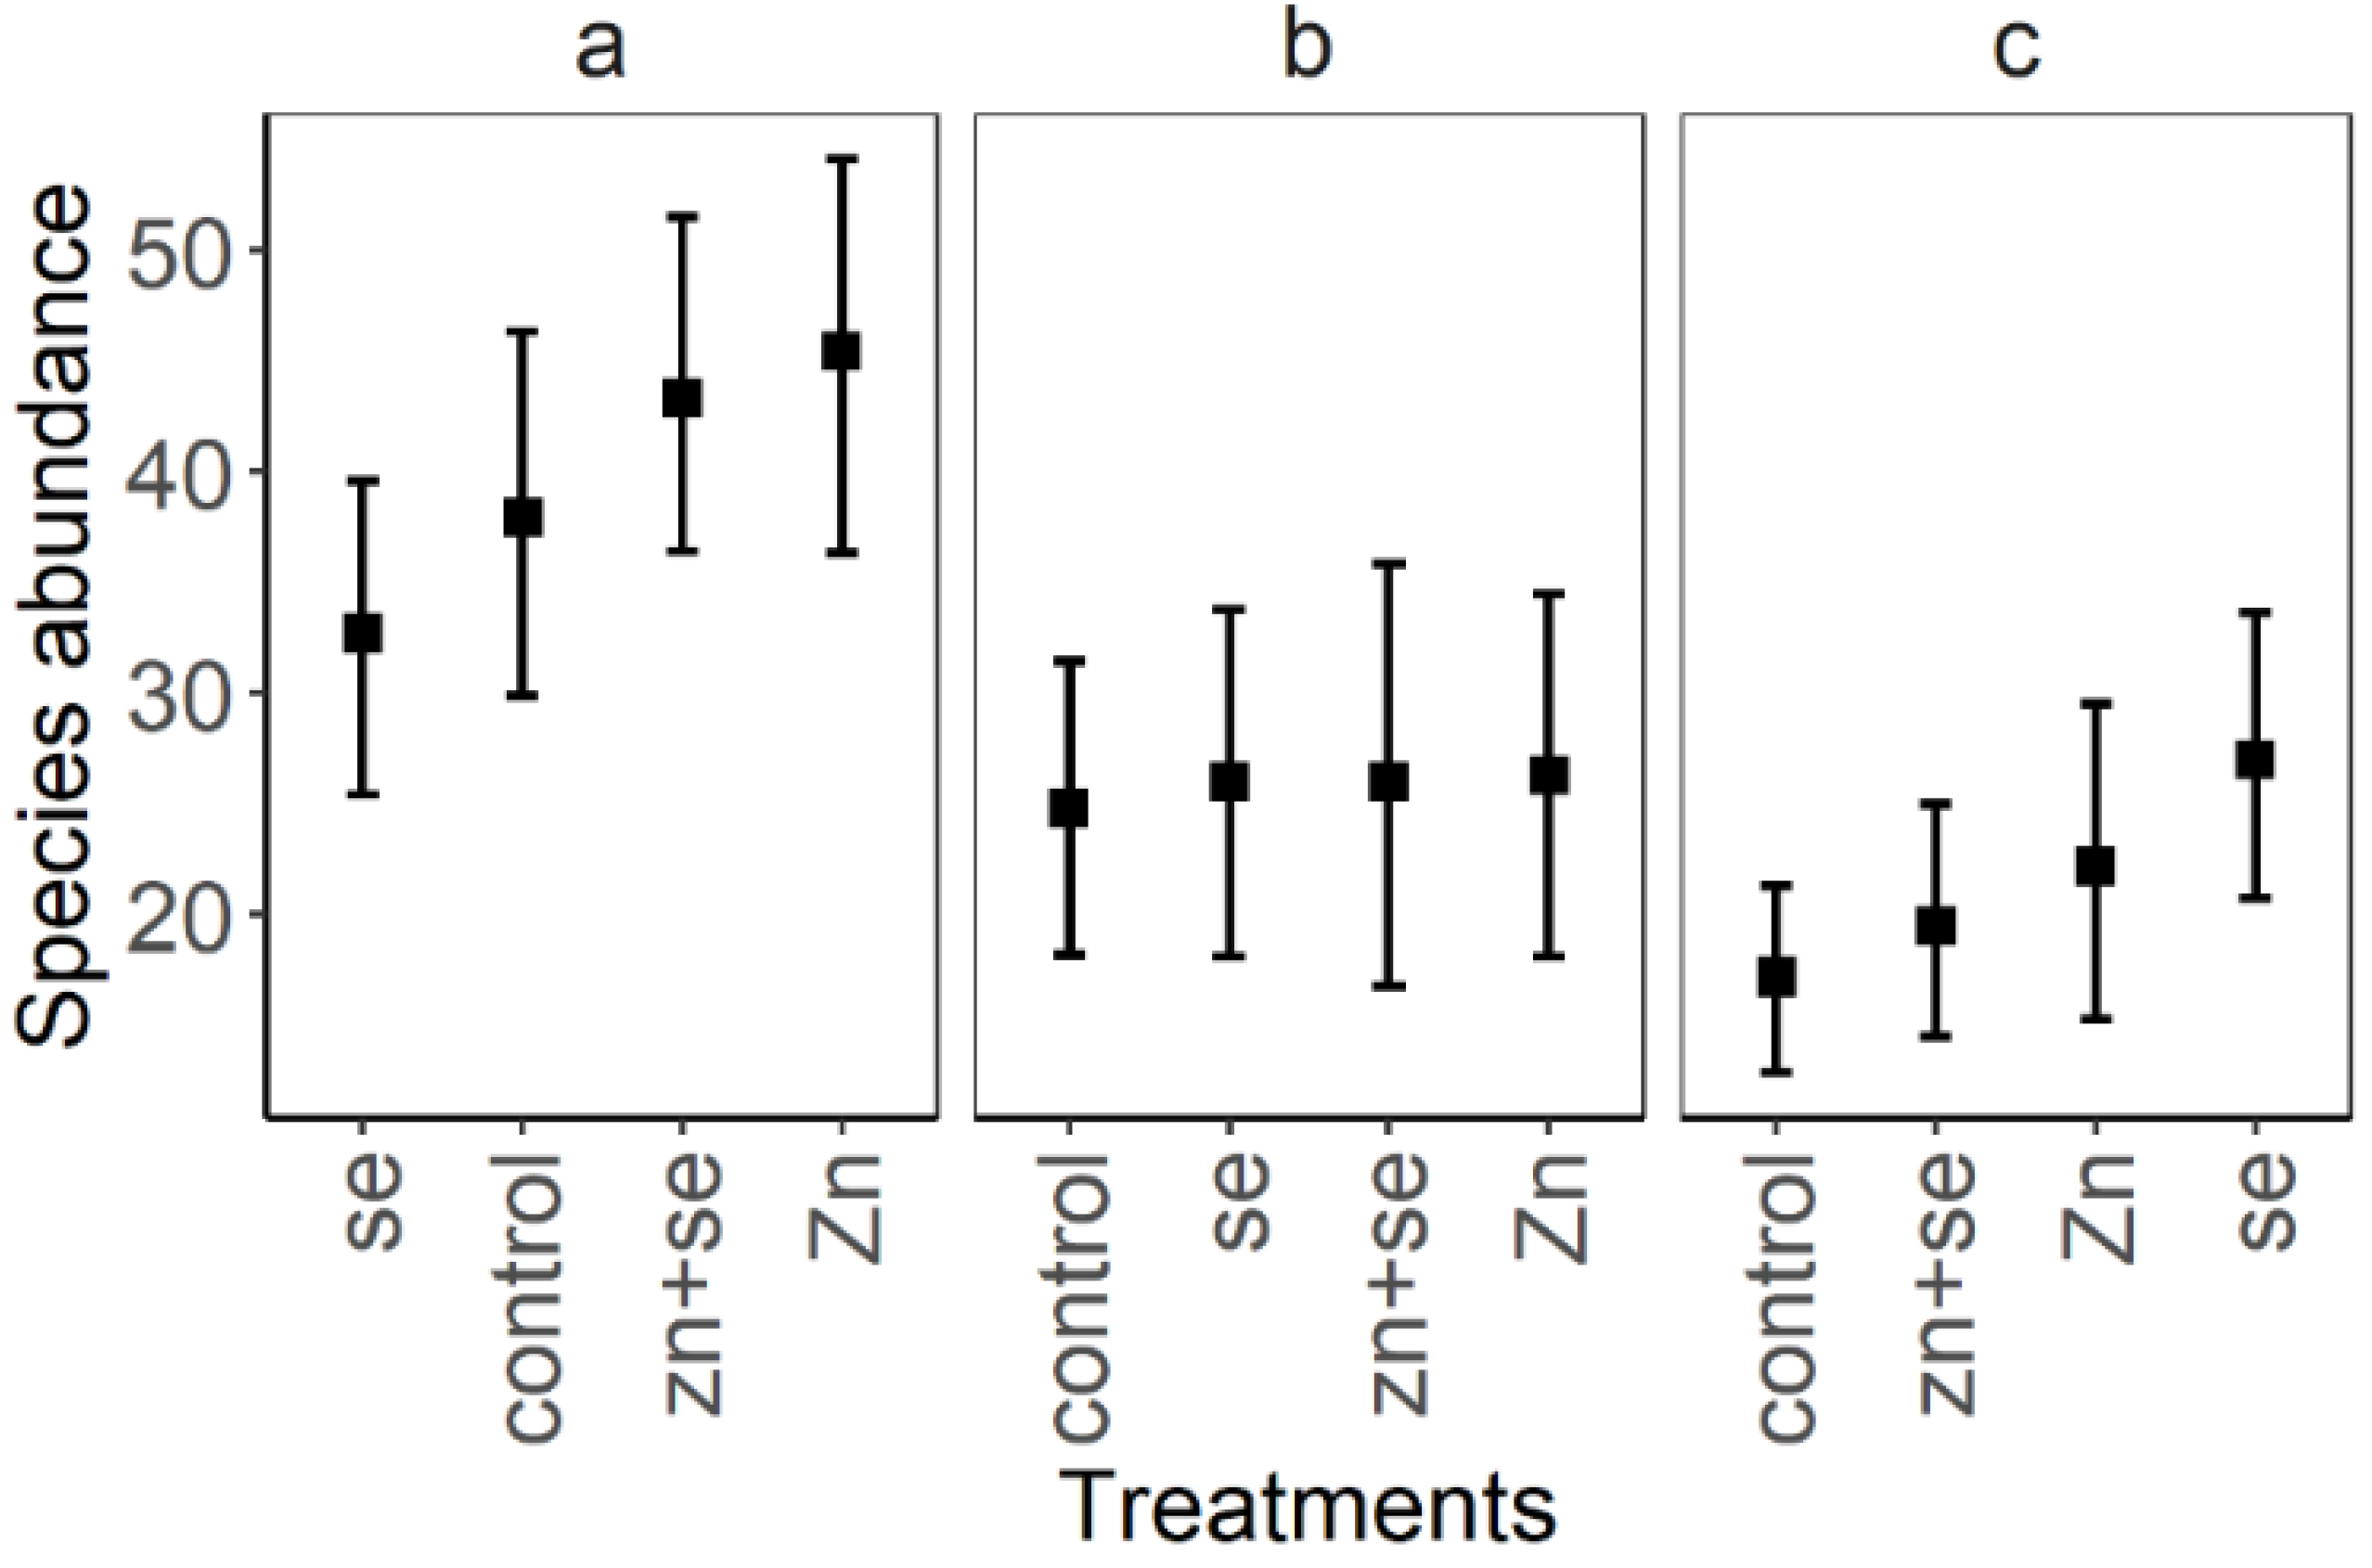
Differences in abundance depending on foliar microelement treatment and meadow mixture are showed in Figure 4. The differences were only highly significant between the meadow mixtures (Table 5). Differences in pollinator abundance depending on the treatment were not significant, nor was interaction between treatment and meadow (Table 5).
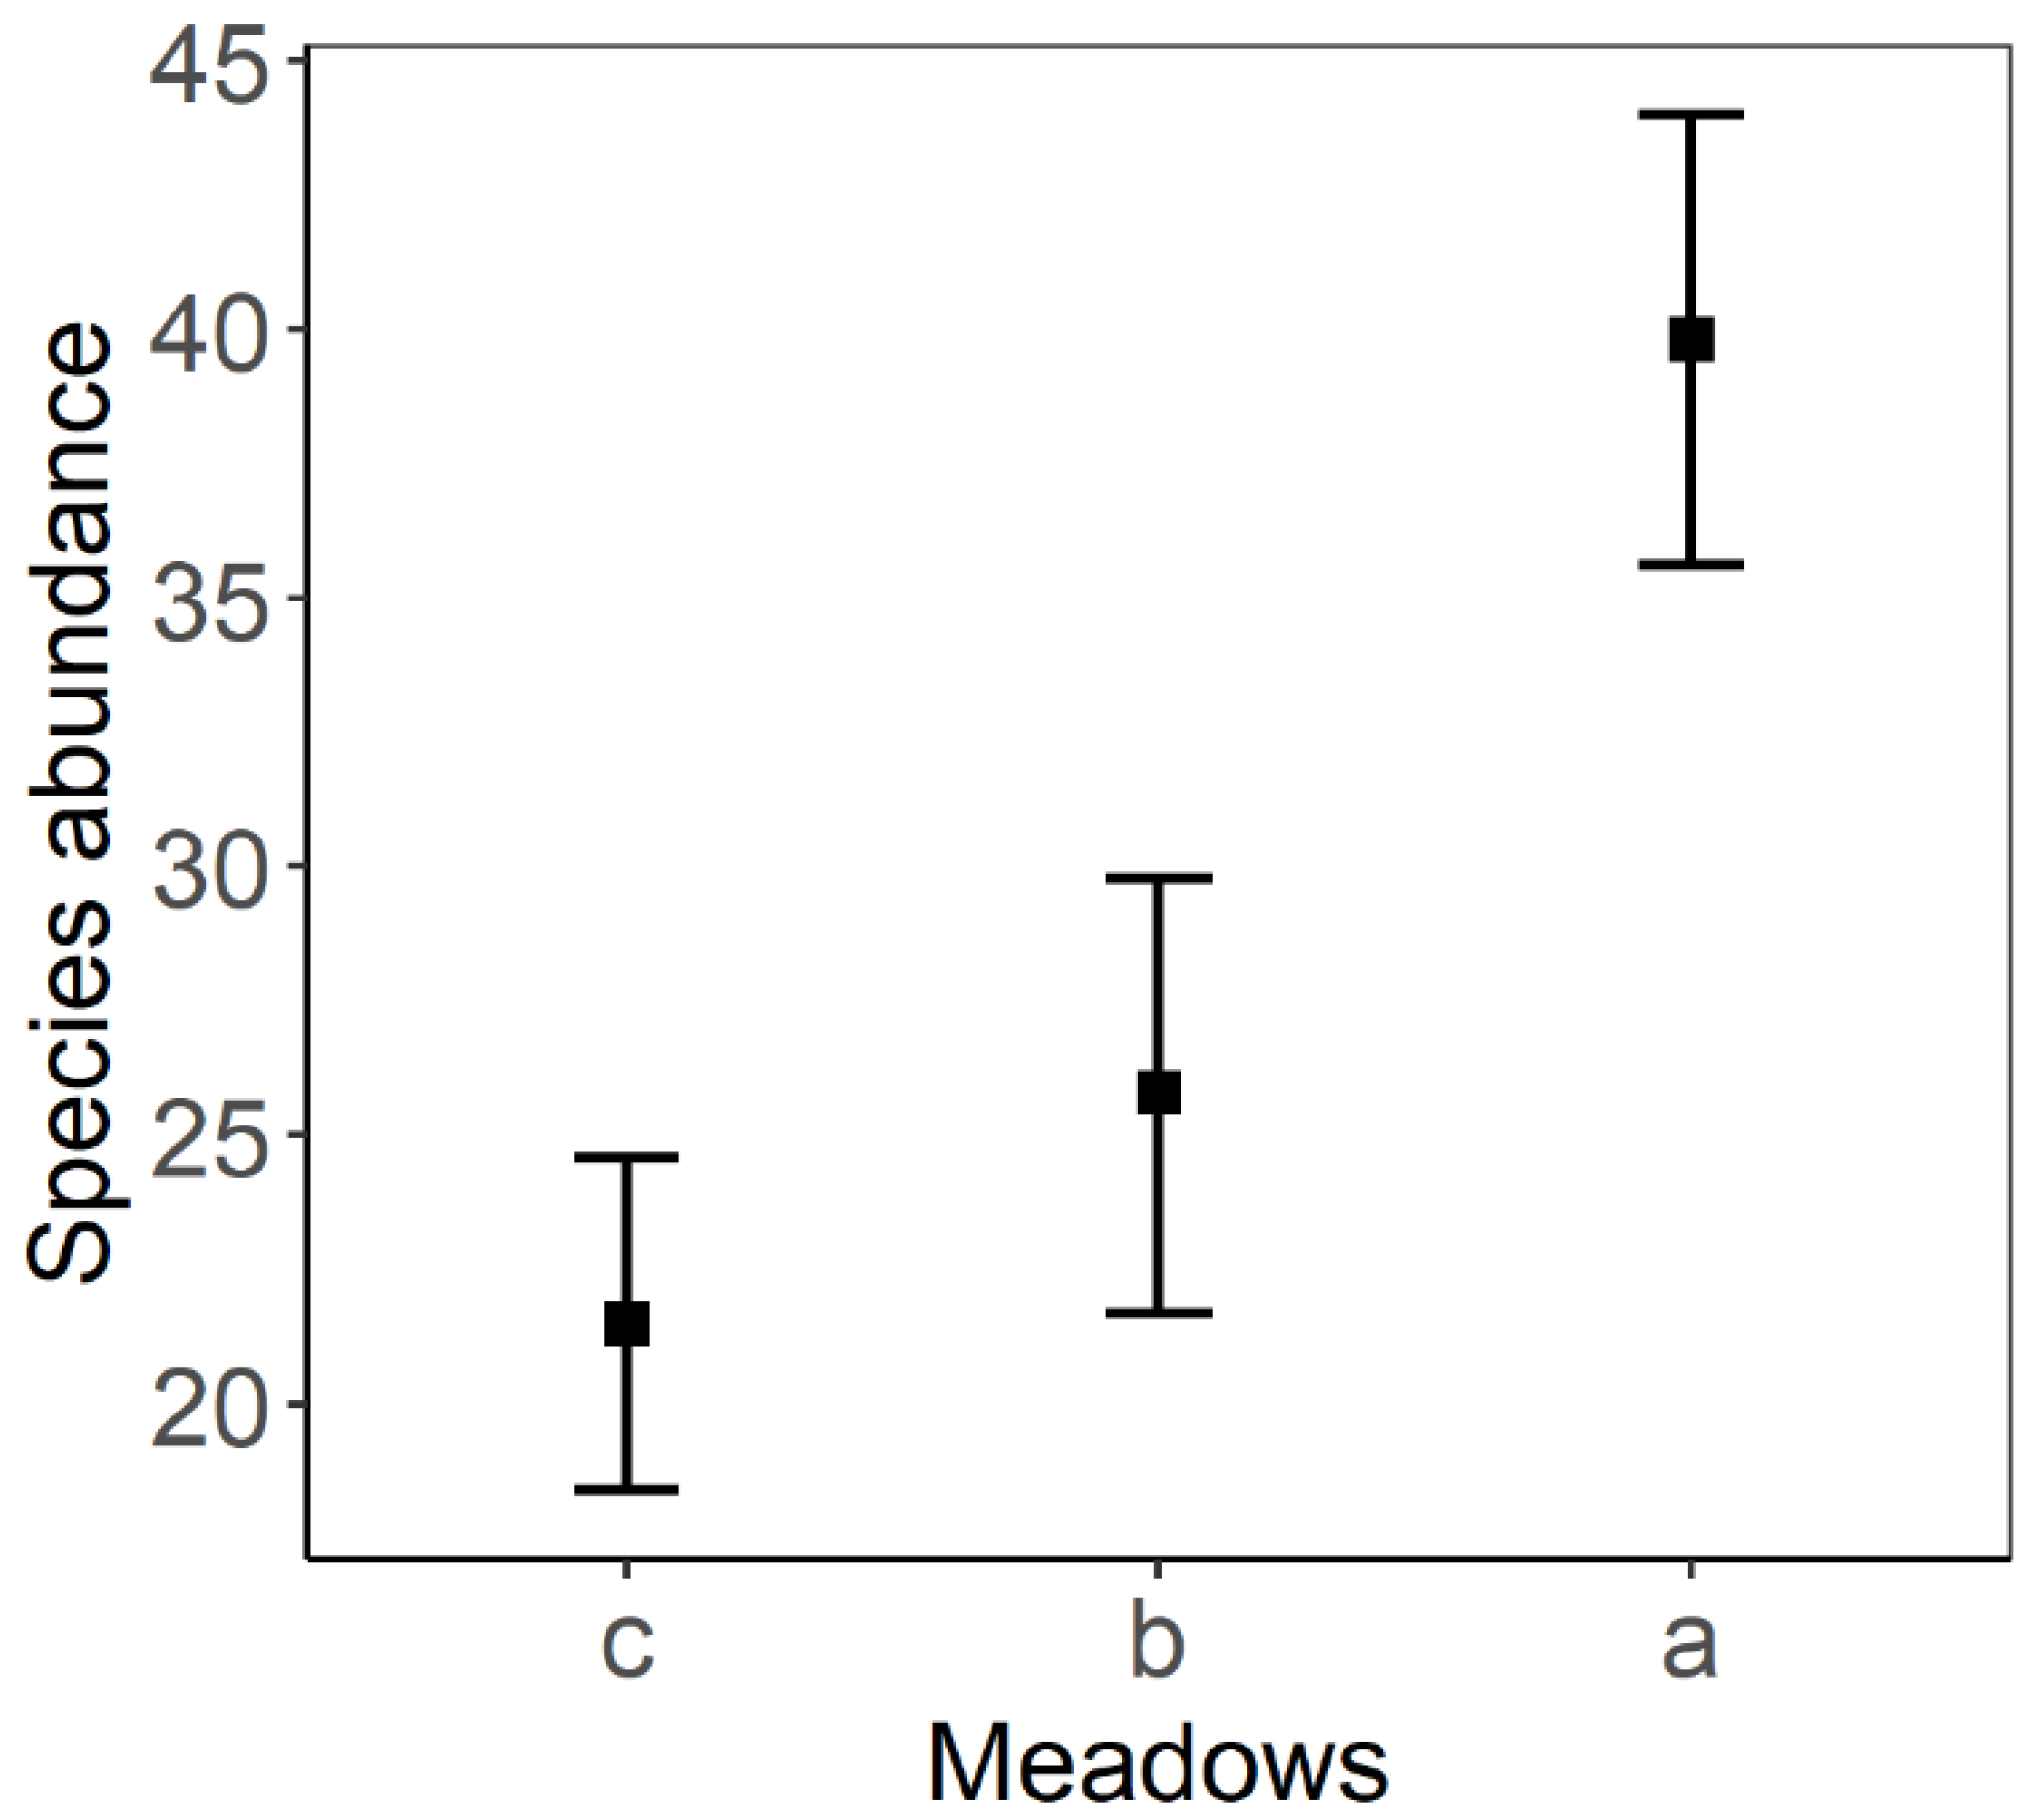
Pollinator abundance varied considerably between meadow mixture a and the other mixtures (b, c) (Figure 5, Table 6). The highest abundance of pollinators was observed with meadow mixture a (Figure 5). The differences in pollinator abundance between meadow mixtures b and c were not statistically significant (Table 6).
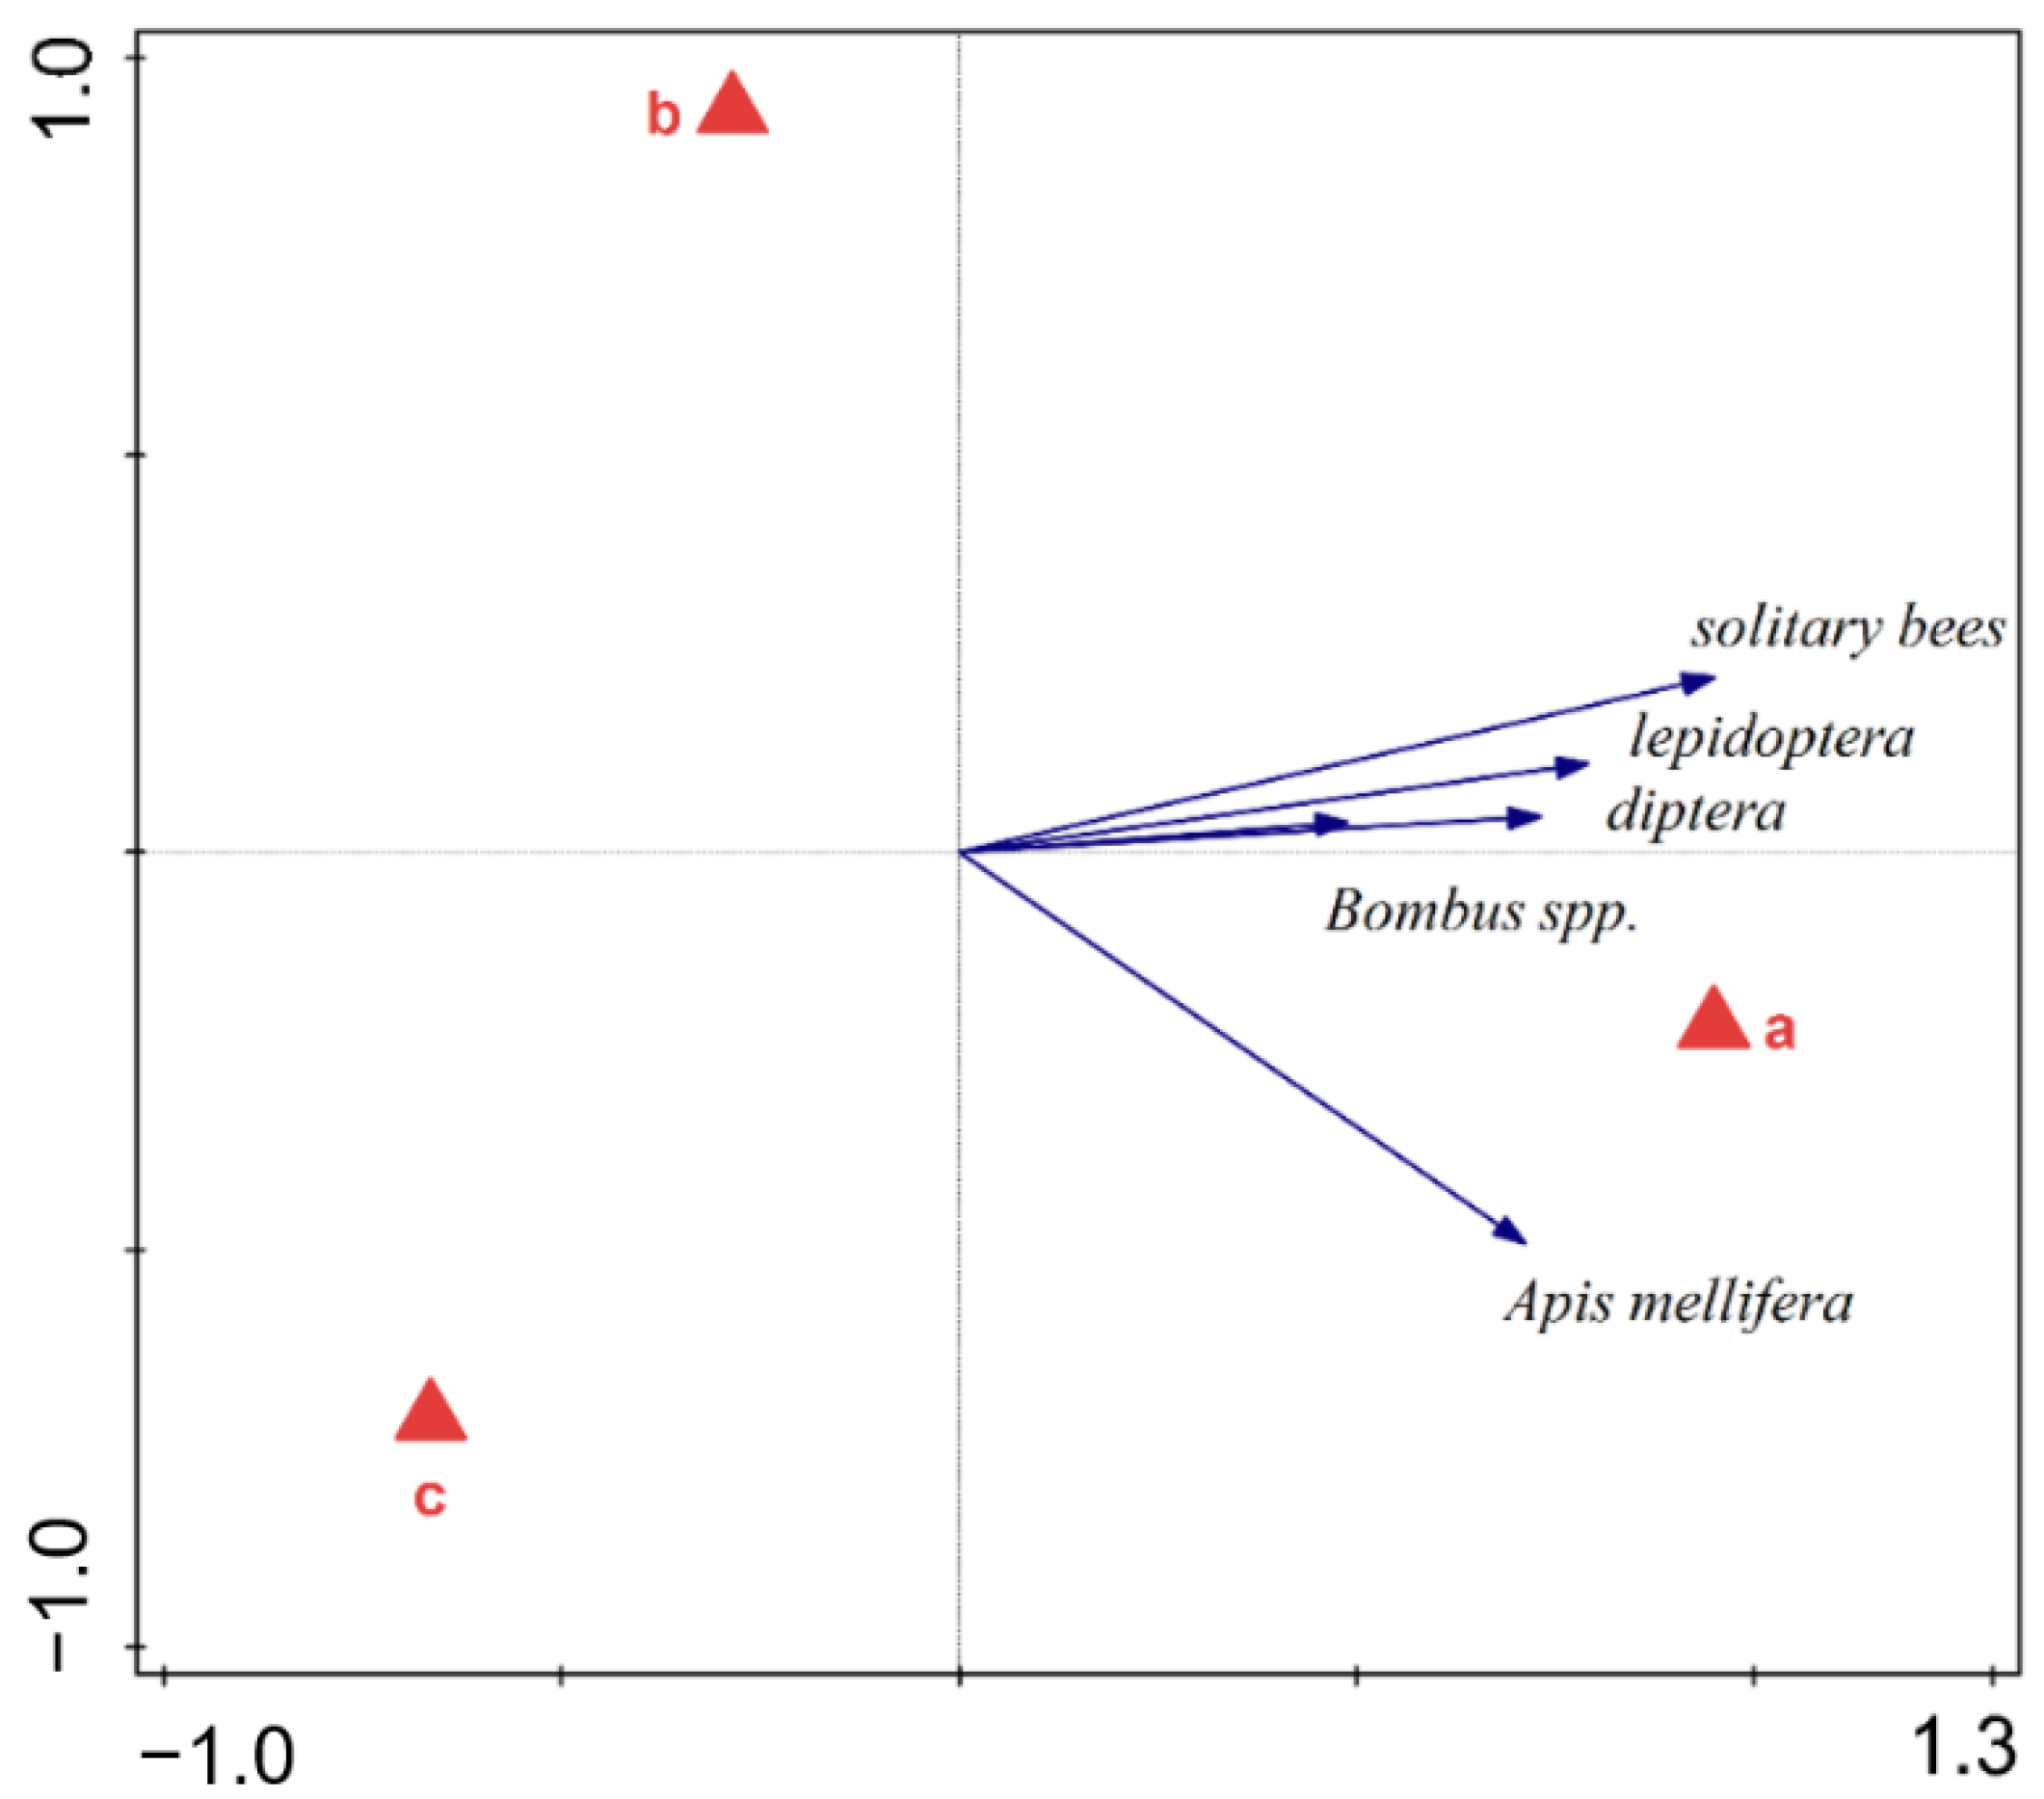
Based on the pRDA analysis, all observed pollinator taxa were positively associated with meadow mixture a (Figure 6) (test on first axis: p < 0.01; test on all axes: 
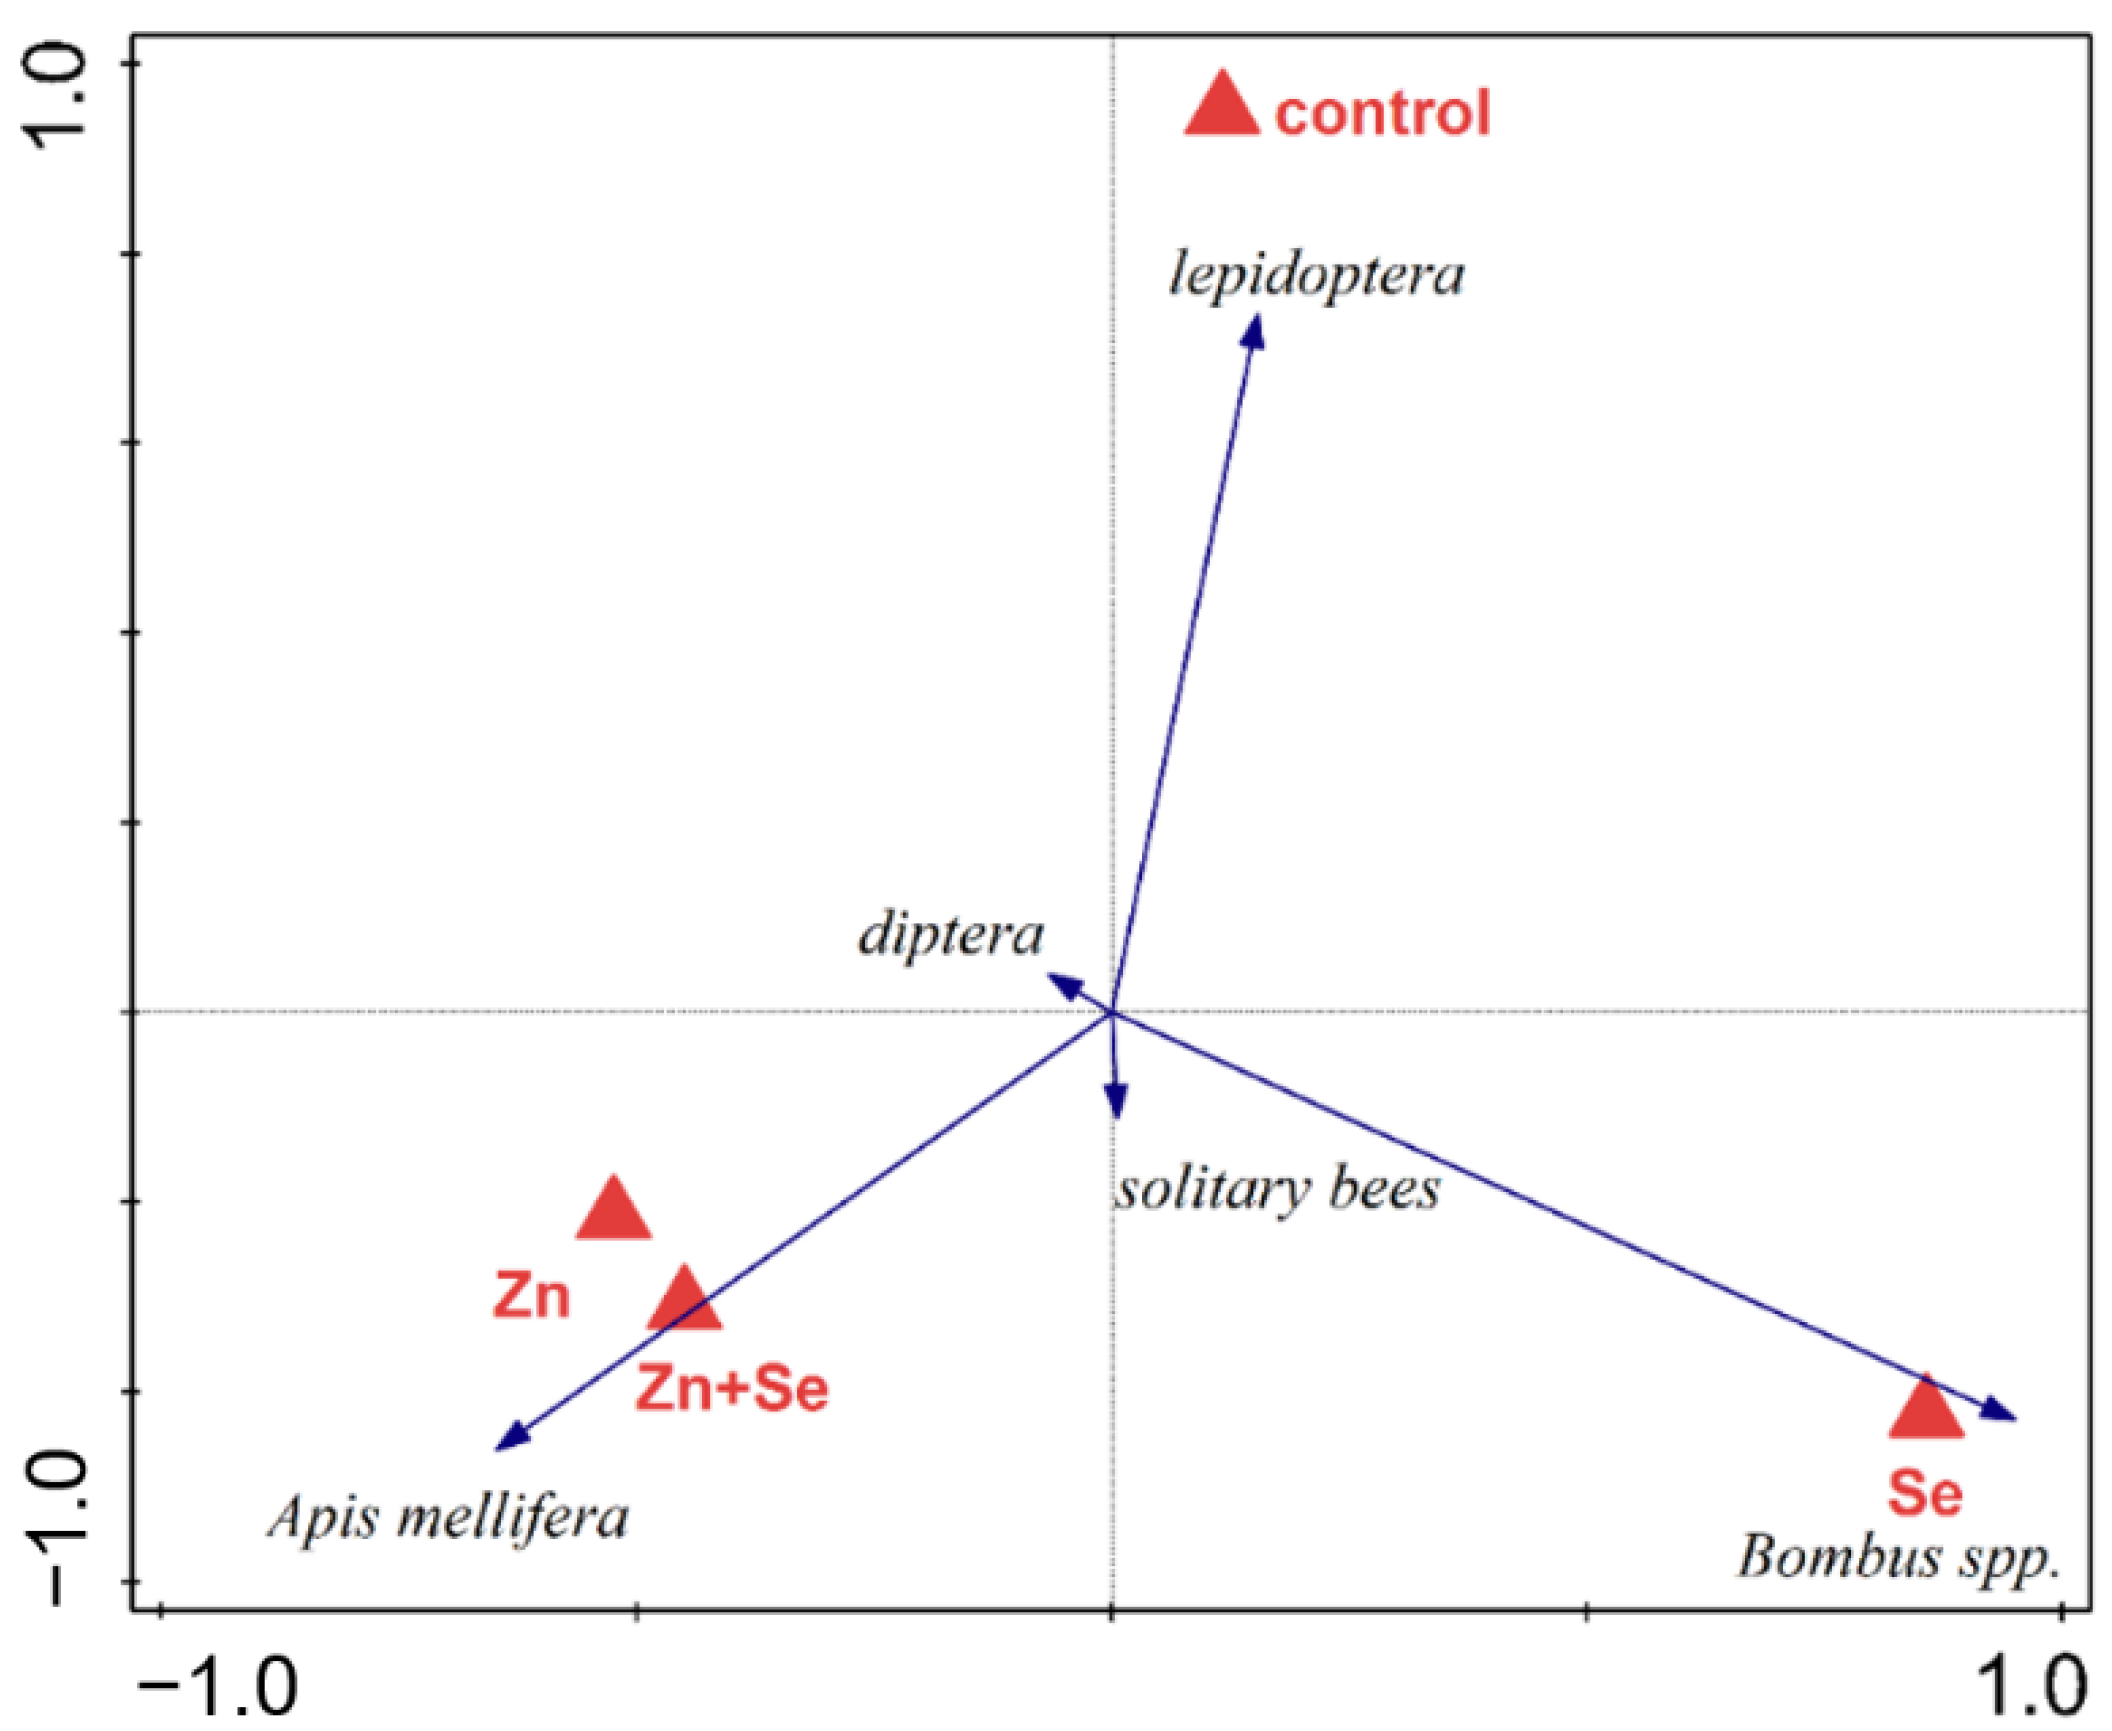
p < 0.01). Nevertheless, in the cases of microelement treatment, Bombus spp. showed an affinity for the forage treated with selenium. On the other hand, A. mellifera was tied to forage treated with zinc, while lepidoptera was tied to forage without microelement treatment. Diptera and solitary bees showed no affiliation to any treatment (Figure 7).
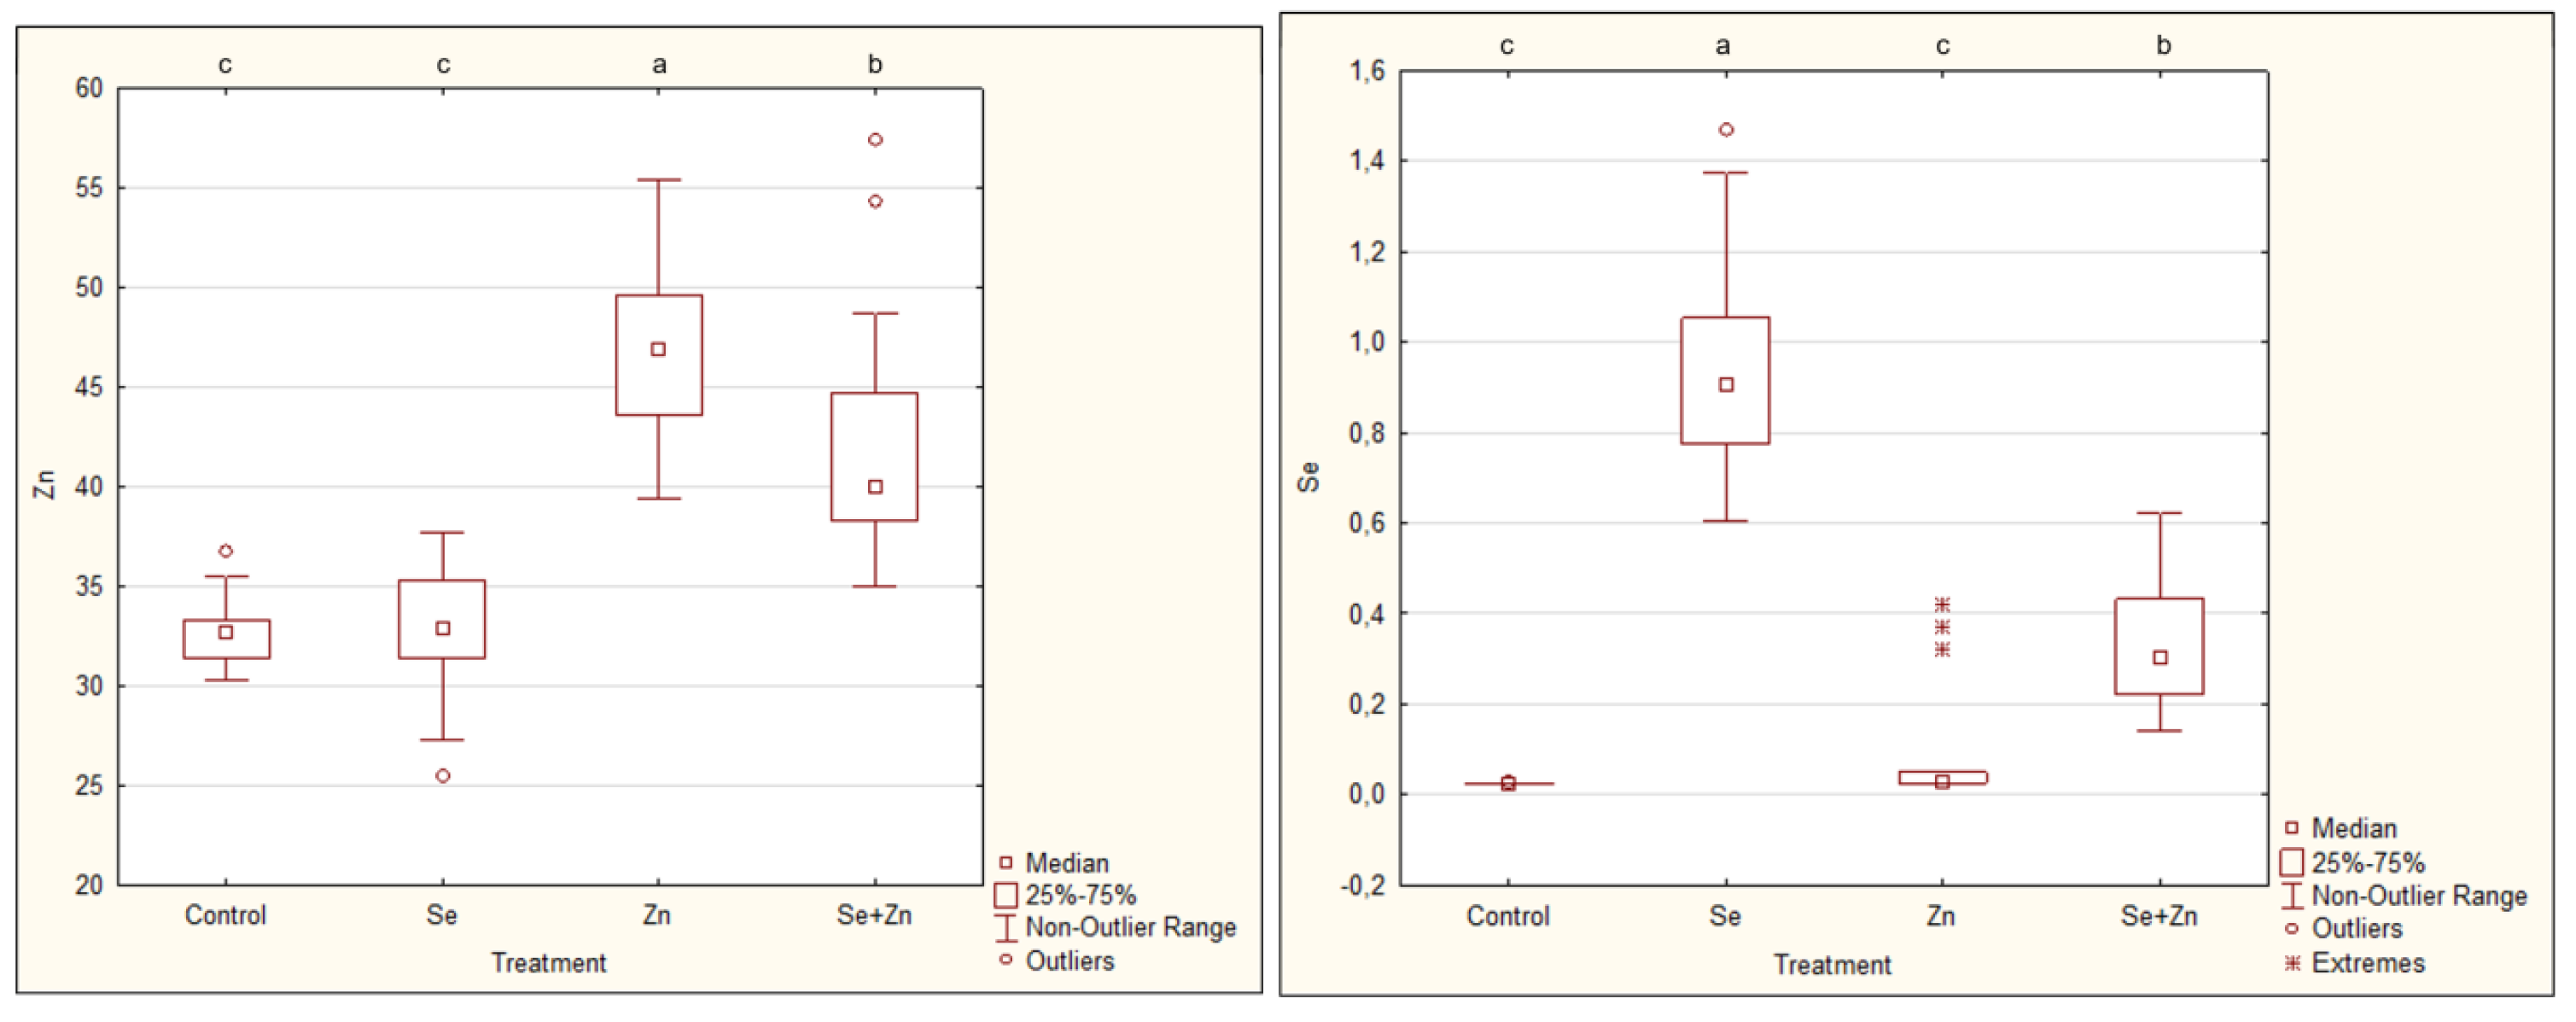
In the case of Se, the lowest amount was observed in the control and the Zn treatment, without significant differences. A significantly higher amount was detected with Se + Zn treatment, and the highest values were observed with Se treatment (Figure 8). In the case of Zinc, the lowest amount was observed in the control and the Se treatment, without significant differences. A significantly higher amount was detected with Se + Zn treatment, and the highest values were observed with Zn treatment (Figure 8).

4. Discussion

Although Gardener and Gillman [30] concluded that increased nutrient levels in the environment may affect nectar composition, and thus pollinator activity, the differences in observed taxon pollinator richness (Figure 2) and abundance (Figure 4) between treatments (i.e., microelement applications) were not statistically significant. The same conclusion was reached by Viik et al. [47], who stated that the application of microelements proved to be ineffective in terms of increasing the abundance of pollinators. This is probably due to the fact that most pollinator species do not respond to low doses of applied microelements. This ability is thought of in more evolutionarily advanced species such as eusocial species, which include the honey bee and certain eusocial bumblebee species (Bombus spp.) [48].
When comparing the meadow mixtures (Figure 3 and Figure 5), high differences in the results are seen. Mixture a was visited by pollinators most frequently, as it contained the most flowering plants (40% Fabaceae and 60% other blossom plants). These plants produce more nectar and nutritionally valuable pollen compared to Poaceae [49]. Conversely, the lowest pollinator richness and abundance was observed with mixture c, which contained the highest proportion of Poaceae and represented the least suitable feeding conditions.
However, when comparing the preference of individual taxa to the treatments, it was shown that some taxa are associated with different treatments, while others are not. Decisionmaking in the search for and collection of food becomes more complex in the case of highly social species, for which inclusive fitness and group benefits are important aspects [50,51]. Eusocial insects with a division of labor which includes a non-reproducing caste of workers, such as ants and honey bees, are an extreme case where foragers are often highly specialized for foraging purposes [52]. A preference for the treated meadow mixtures was observed only in A. mellifera and bumblebees.
Zinc is a very important element for bees, contributing to increased antioxidant activity and viability of adult bees and bee broods [42]. It has been shown to play a role in heavy metal detoxification and to positively affect dopamine secretion [53]. On the contrary, A. melliffera did not fly on flowering mixtures supplemented only with selenium. This may be related to the higher acute toxicity of selenium to A. mellifera and especially to the bee brood when compared to bumblebees [54]. Bumblebees, in turn, preferred meadow mixtures enriched with selenium and did not react positively to zinc (Figure 7). This phenomenon can be supported by the fact that bumblebees and A. mellifera share the same or similar food sources, which can lead to competitive behavior between them [55]. In the case of high A. mellifera density at a locality, bumblebees are outcompeted by A. mellifera for other food sources [56].
In this study, supplementation of flowering mixtures with selenium at a very low concentration (depending on soil conditions in the Czech Republic) was chosen, which should not have had any acute effect on bees [38]. However, more frequent visits to selenium-enriched plants can lead to the accumulation of selenium in honey [57] and pollen [58,59], and potentially to a negative effect on the bee brood. This trend is known in some areas, such as the western United States, where there is significant selenium contamination of soils [60]. This problem is often solved by bioremediation using plants that accumulate selenium [61]. However, selenium accumulates in pollen and nectar at high concentrations and can cause negative effects on honey bees [58,59,62]. From this point of view, it is very important to base the application of selenium on the current state of selenium and other microelements in local soils.
Foragers among A. mellifera bees generally prefer food sources with higher amounts of or concentrations of sucrose. According to Varjú and Núñez [63], sucrose levels play a major role in A. mellifera flower preference. Moreover, a preference for a less concentrated sugar solution was observed in bumblebees, suggesting a higher collection rate or water requirement [48]. It is important to keep in mind that the observed preferences of individuals or taxa may not actually reflect their needs, and may instead reflect on the characteristics that different individuals of different taxa have; this is primarily related to size or threshold sensitivity to nutrient stimuli [48]. In addition, forager response may vary in eusocial species depending on the stage of colony development, especially when colonies are preparing to reproduce or are nearing the end of the season [64,65].
The last of the monitored taxa that showed a certain preference within the treatments was Lepidoptera, which visited the most untreated meadow mixtures. We explain their connection to untreated meadow mixtures by reference to competitive pressure caused by the high density of social pollinators on the treated meadow mixtures. High abundance of social bee species can have a negative effect on foraging behavior, reproduction, and even whole populations of sensitive pollinator taxa [55,66,67]. The continuously high density and activity of social pollinators thus leads to competition with other species, and non-social species may gradually be displaced [68,69]. Davis et al. [70] further states that honey bees and butterflies react very differently to microbiotope components within fragmented ecosystems, and underlines the importance of differentiating honey bee and butterfly protection strategies.
The amount of Se and Zn in flowers was significantly increased by foliar application, consistent with [71]. Microelements applied on leaves are absorbed more quickly by the plant than soil-applied micronutrients, and reach other plant organs, even those that have not yet been formed at the time of application such as fruits [72]. Interestingly, a lower level of both microelements was detected in the meadow mixtures treated with both microelements together than when they were applied separately (Figure 8). However, the lower level of Se in the meadow mixtures treated with both Se and Zn could be the reason for the higher preference for these mixtures by honey bees and, conversely, the lower preference of Bombus spp. (Figure 7).
In the Czech Republic, soils with low levels of selenium and zinc predominate [72,73]. The low content of microelements in soils causes insufficient nutrient transport along the soil–plant–animal chain [74]. Therefore, increasing the amount of these elements in the diet of pollinators can improve the fitness of both pollinators and plants. The challenge for further studies remains whether bees and bumblebees respond primarily to direct microelement increase and are thus able to detect it, or to other stimuli caused by plant responses to microelement application, such as changes in the amount or composition of nectar.

5. Conclusions

The richness and abundance of the main pollinator taxa were not significantly affected by the foliar application of microelements. However, they were affected by the botanical composition of forage in individual meadow mixtures.
The amount of selenium and zinc in the flowers was significantly increased due to the application of microelements, to which eusocial species of pollinators responded. While bumblebees preferred forage with selenium treatment, A. mellifera preferred those with zinc treatment. On the other hand, diptera and solitary bees were not affected by microelement treatment. Lepidoptera showed a preference for untreated forage, probably due to strong competition conditions around the treated plots.

Author Contributions

Conceptualization, M.H., O.P. and P.M.; Data curation, J.Š., A.K. and P.M.; Formal analysis, K.S. and I.K.; Investigation, M.H., A.K. and K.S.; Methodology, M.H. and I.K.; Supervision, J.Š. and O.P.; Writing—original draft, M.H. and P.M. All authors have read and agreed to the published version of the manuscript.

Funding

This research was funded by the Technology Agency of the Czech Republic, grant number TJ04000048: “Foliar nutrition of forage plants with selenium and zinc and its impact on their qualitative and quantitative characteristics and the environment of the organisms occurring within these ecosystems”.

Institutional Review Board Statement

Not applicable.

Informed Consent Statement

Not applicable.

Data Availability Statement

The study did not report any data.

Conflicts of Interest

The authors declare no conflict of interest.

References

  1. Ollerton, J. Pollinator Diversity: Distribution, Ecological Function, and Conservation. Annu. Rev. Ecol. Evol. Syst. 2017, 48, 353–376. [Google Scholar] [CrossRef] [Green Version]
  2. Ollerton, J.; Winfree, R.; Tarrant, S. How Many Flowering Plants Are Pollinated by Animals? Oikos 2011, 120, 321–326. [Google Scholar] [CrossRef]
  3. Rodger, J.G.; Bennett, J.M.; Razanajatovo, M.; Knight, T.M.; van Kleunen, M.; Ashman, T.-L.; Steets, J.A.; Hui, C.; Arceo-Gómez, G.; Burd, M. Widespread Vulnerability of Flowering Plant Seed Production to Pollinator Declines. Sci. Adv. 2021, 7, eabd3524. [Google Scholar] [CrossRef] [PubMed]
  4. Wei, N.; Kaczorowski, R.L.; Arceo-Gómez, G.; O’Neill, E.M.; Hayes, R.A.; Ashman, T.-L. Pollinators Contribute to the Maintenance of Flowering Plant Diversity. Nature 2021, 597, 688–692. [Google Scholar] [CrossRef] [PubMed]
  5. Vladek, A.; Hybl, M.; Pridal, A. Pollination and Pollinators of Haskap (Lonicera Caerulea). Proceedings of International PhD Students Conference MendelNet, New York, NY, USA, 28 January 2018; pp. 211–216. [Google Scholar]
  6. Dmitruk, M.; Wrzesień, M.; Strzałkowska-Abramek, M.; Denisow, B. Pollen Food Resources to Help Pollinators. A Study of Five Ranunculaceae Species in Urban Forest. Urban For. Urban Green. 2021, 60, 127051. [Google Scholar] [CrossRef]
  7. Woodard, S.H.; Jha, S. Wild Bee Nutritional Ecology: Predicting Pollinator Population Dynamics, Movement, and Services from Floral Resources. Curr. Opin. Insect Sci. 2017, 21, 83–90. [Google Scholar] [CrossRef]
  8. Di Pasquale, G.; Salignon, M.; Le Conte, Y.; Belzunces, L.P.; Decourtye, A.; Kretzschmar, A.; Suchail, S.; Brunet, J.-L.; Alaux, C. Influence of Pollen Nutrition on Honey Bee Health: Do Pollen Quality and Diversity Matter? PLoS ONE 2013, 8, e72016. [Google Scholar] [CrossRef] [Green Version]
  9. Biesmeijer, J.C.; Roberts, S.P.; Reemer, M.; Ohlemüller, R.; Edwards, M.; Peeters, T.; Schaffers, A.P.; Potts, S.G.; Kleukers, R.; Thomas, C.D. Parallel Declines in Pollinators and Insect-Pollinated Plants in Britain and the Netherlands. Science 2006, 313, 351–354. [Google Scholar] [CrossRef]
  10. Winfree, R.; Bartomeus, I.; Cariveau, D.P. Native Pollinators in Anthropogenic Habitats. Annu. Rev. Ecol. Evol. Syst. 2011, 42, 1–22. [Google Scholar] [CrossRef] [Green Version]
  11. Bennett, J.M.; Steets, J.A.; Burns, J.H.; Burkle, L.A.; Vamosi, J.C.; Wolowski, M.; Arceo-Gómez, G.; Burd, M.; Durka, W.; Ellis, A.G. Land Use and Pollinator Dependency Drives Global Patterns of Pollen Limitation in the Anthropocene. Nat. Commun. 2020, 11, 1–6. [Google Scholar] [CrossRef] [PubMed]
  12. Potts, S.G.; Biesmeijer, J.C.; Kremen, C.; Neumann, P.; Schweiger, O.; Kunin, W.E. Global Pollinator Declines: Trends, Impacts and Drivers. Trends Ecol. Evol. 2010, 25, 345–353. [Google Scholar] [CrossRef] [PubMed]
  13. Burkle, L.A.; Marlin, J.C.; Knight, T.M. Plant-Pollinator Interactions over 120 Years: Loss of Species, Co-Occurrence, and Function. Science 2013, 339, 1611–1615. [Google Scholar] [CrossRef] [PubMed] [Green Version]
  14. Naug, D. Nutritional Stress Due to Habitat Loss May Explain Recent Honeybee Colony Collapses. Biol. Conserv. 2009, 142, 2369–2372. [Google Scholar] [CrossRef]
  15. Alaux, C.; Ducloz, F.; Crauser, D.; Le Conte, Y. Diet Effects on Honeybee Immunocompetence. Biol. Lett. 2010, 6, 562–565. [Google Scholar] [CrossRef] [Green Version]
  16. Mráz, P.; Hýbl, M.; Kopecký, M.; Bohatá, A.; Hoštičková, I.; Šipoš, J.; Vočadlová, K.; Čurn, V. Screening of Honey Bee Pathogens in the Czech Republic and Their Prevalence in Various Habitats. Insects 2021, 12, 1051. [Google Scholar] [CrossRef]
  17. Wahl, O.; Ulm, K. Influence of Pollen Feeding and Physiological Condition on Pesticide Sensitivity of the Honey Bee Apis Mellifera Carnica. Oecologia 1983, 59, 106–128. [Google Scholar] [CrossRef]
  18. Roulston, T.H.; Goodell, K. The Role of Resources and Risks in Regulating Wild Bee Populations. Annu. Rev. Entomol. 2011, 56, 293–312. [Google Scholar] [CrossRef] [Green Version]
  19. Keller, I.; Fluri, P.; Imdorf, A. Pollen Nutrition and Colony Development in Honey Bees: Part 1. Bee World 2005, 86, 3–10. [Google Scholar] [CrossRef]
  20. Carvell, C.; Westrich, P.; Meek, W.R.; Pywell, R.F.; Nowakowski, M. Assessing the Value of Annual and Perennial Forage Mixtures for Bumblebees by Direct Observation and Pollen Analysis. Apidologie 2006, 37, 326–340. [Google Scholar] [CrossRef] [Green Version]
  21. Ziaja, M.; Denisow, B.; Wrzesień, M.; Wójcik, T. Availability of Food Resources for Pollinators in Three Types of Lowland Meadows. J. Apic. Res. 2018, 57, 467–478. [Google Scholar] [CrossRef]
  22. Bhandari, K.B.; West, C.; Longing, S.; Brown, C.; Green, P.; Barkowsky, E. Pollinator Abundance in Semiarid Pastures as Affected by Forage Species. Crop Sci. 2018, 58, 2665–2671. [Google Scholar] [CrossRef] [Green Version]
  23. Boehmel, C.; Lewandowski, I.; Claupein, W. Comparing Annual and Perennial Energy Cropping Systems with Different Management Intensities. Agric. Syst. 2008, 96, 224–236. [Google Scholar] [CrossRef]
  24. Dumbrovský, M.; Sobotková, V.; Šarapatka, B.; Chlubna, L.; Váchalová, R. Cost-Effectiveness Evaluation of Model Design Variants of Broad-Base Terrace in Soil Erosion Control. Ecol. Eng. 2014, 68, 260–269. [Google Scholar] [CrossRef]
  25. Arora, A.; Sairam, R.; Srivastava, G. Oxidative Stress and Antioxidative System in Plants. Curr. Sci. 2002, 1227–1238. [Google Scholar]
  26. Choi, H.W.; Hwang, B.K. The Pepper Extracellular Peroxidase CaPO2 Is Required for Salt, Drought and Oxidative Stress Tolerance as Well as Resistance to Fungal Pathogens. Planta 2012, 235, 1369–1382. [Google Scholar] [CrossRef]
  27. Petanidou, T.; Goethals, V.; Smets, E. The Effect of Nutrient and Water Availability on Nectar Secretion and Nectary Structure of the Dominant Labiatae Species of Phrygana. Syst. Geogr. Plants 1999, 233–244. [Google Scholar] [CrossRef]
  28. Quesada, M.; Bollman, K.; Stephenson, A.G. Leaf Damage Decreases Pollen Production and Hinders Pollen Performance in Cucurbita Texana. Ecology 1995, 76, 437–443. [Google Scholar] [CrossRef]
  29. Hanson, B.; Garifullina, G.F.; Lindblom, S.D.; Wangeline, A.; Ackley, A.; Kramer, K.; Norton, A.P.; Lawrence, C.B.; Pilon-Smits, E.A. Selenium Accumulation Protects Brassica Juncea from Invertebrate Herbivory and Fungal Infection. New Phytol. 2003, 159, 461–469. [Google Scholar] [CrossRef] [Green Version]
  30. Broadley, M.R.; White, P.J.; Hammond, J.P.; Zelko, I.; Lux, A. Zinc in Plants. New Phytol. 2007, 173, 677–702. [Google Scholar] [CrossRef]
  31. Gardener, M.C.; Gillman, M.P. The Effects of Soil Fertilizer on Amino Acids in the Floral Nectar of Corncockle, Agrostemma Githago (Caryophyllaceae). Oikos 2001, 92, 101–106. [Google Scholar] [CrossRef] [Green Version]
  32. Jansen, M.A. 10 Ultraviolet-B Radiation: Stressor and Regulatory Signal. In Plant Stress Physiology, 2nd ed.; CAB International: Oxfordshire, UK, 2017; p. 253. [Google Scholar]
  33. Fazekas, C.; Péntek, A.; Vojnich, V.J. effect of foliar fertilizers applications on the nectar production of sunflower (Heliathus Annuus L.) and on the foraging behaviour of honeybees (Apis Mellifera L.). Ann. Fac. Eng. Hunedoara 2019, 17, 153–160. [Google Scholar]
  34. Sawidis, T.; Papadopoulou, A.; Voulgaropoulou, M. Effect of Zinc on Nectar Secretion of Hibiscus Rosa-Sinensis L. Protoplasma 2014, 251, 575–589. [Google Scholar] [CrossRef]
  35. Woo, H.R.; Kim, J.H.; Nam, H.G.; Lim, P.O. The Delayed Leaf Senescence Mutants of Arabidopsis, Ore1, Ore3, and Ore9 Are Tolerant to Oxidative Stress. Plant Cell Physiol. 2004, 45, 923–932. [Google Scholar] [CrossRef] [PubMed]
  36. Karim, M.R.; Zhang, Y.; Zhao, R.; Chen, X.; Zhang, F.; Zou, C. Alleviation of Drought Stress in Winter Wheat by Late Foliar Application of Zinc, Boron, and Manganese. J. Plant Nutr. Soil Sci. 2012, 175, 142–151. [Google Scholar] [CrossRef]
  37. da Silva Folli-Pereira, M.; Ramos, A.C.; Canton, G.C.; da Conceição, J.M.; de Souza, S.B.; Cogo, A.J.D.; Figueira, F.F.; Eutrópio, F.J.; Rasool, N. Foliar Application of Trace Elements in Alleviating Drought Stress. Water Stress Crop Plants A Sustain. Approach 2016, 2, 669–681. [Google Scholar]
  38. Ducsay, L.; Ložek, O.; Marček, M.; Varényiová, M.; Hozlár, P.; Lošák, T. Possibility of Selenium Biofortification of Winter Wheat Grain. Plant Soil Environ. 2016, 62, 379–383. [Google Scholar] [CrossRef] [Green Version]
  39. Chilimba, A.D.; Young, S.D.; Black, C.R.; Meacham, M.C.; Lammel, J.; Broadley, M.R. Agronomic Biofortification of Maize with Selenium (Se) in Malawi. Field Crops Res. 2012, 125, 118–128. [Google Scholar] [CrossRef]
  40. Jiang, Y.; Zeng, Z.; Bu, Y.; Ren, C.; Li, J.; Han, J.; Tao, C.; Zhang, K.; Wang, X.; Lu, G. Effects of Selenium Fertilizer on Grain Yield, Se Uptake and Distribution in Common Buckwheat (Fagopyrum Esculentum Moench). Plant Soil Environ. 2015, 61, 371–377. [Google Scholar] [CrossRef] [Green Version]
  41. Cartes, P.; Gianfreda, L.; Mora, M. Uptake of Selenium and Its Antioxidant Activity in Ryegrass When Applied as Selenate and Selenite Forms. Plant Soil 2005, 276, 359–367. [Google Scholar] [CrossRef] [Green Version]
  42. Zhang, G.; Zhang, W.; Cui, X.; Xu, B. Zinc Nutrition Increases the Antioxidant Defenses of Honey Bees. Entomol. Exp. Et Appl. 2015, 156, 201–210. [Google Scholar] [CrossRef]
  43. Sobolev, O.; Gutyj, B.; Petryshak, R.; Pivtorak, J.; Kovalskyi, Y.; Naumyuk, A.; Petryshak, O.; Semchuk, I.; Mateusz, V.; Shcherbatyy, A. Biological Role of Selenium in the Organism of Animals and Humans. Ukr. J. Ecol. 2018, 8, 654–665. [Google Scholar] [CrossRef]
  44. Hýbl, M.; Mráz, P.; Šipoš, J.; Hoštičková, I.; Bohatá, A.; Čurn, V.; Kopec, T. Polyphenols as Food Supplement Improved Food Consumption and Longevity of Honey Bees (Apis Mellifera) Intoxicated by Pesticide Thiacloprid. Insects 2021, 12, 572. [Google Scholar] [CrossRef]
  45. Wang, S.; Tian, X.; Liu, Q. The Effectiveness of Foliar Applications of Zinc and Biostimulants to Increase Zinc Concentration and Bioavailability of Wheat Grain. Agronomy 2020, 10, 178. [Google Scholar] [CrossRef] [Green Version]
  46. ter Braak, C.J.; Smilauer, P. Canoco Reference Manual and User’s Guide: Software for Ordination, Version 5.0; Microcomputer Power: Ithaca, NY, USA, 2012.
  47. Viik, E.; Maend, M.; Karise, R.; Laeaeniste, P.; Williams, I.H.; Luik, A. The Impact of Foliar Fertilization on the Number of Bees (Apoidea) on Spring Oilseed Rape. Zemdirbyste 2012, 99, 41–46. [Google Scholar]
  48. Hendriksma, H.P.; Toth, A.L.; Shafir, S. Individual and Colony Level Foraging Decisions of Bumble Bees and Honey Bees in Relation to Balancing of Nutrient Needs. Front. Ecol. Evol. 2019, 7, 177. [Google Scholar] [CrossRef] [Green Version]
  49. Mader, E.; Spivak, M.; Evans, E. Managing Alternative Pollinators; NRAES: Ithaca, NY, USA, 2010. [Google Scholar]
  50. Galef Jr, B.G.; Giraldeau, L.-A. Social Influences on Foraging in Vertebrates: Causal Mechanisms and Adaptive Functions. Anim. Behav. 2001, 61, 3–15. [Google Scholar] [CrossRef]
  51. Kay, A. Applying Optimal Foraging Theory to Assess Nutrient Availability Ratios for Ants. Ecology 2002, 83, 1935–1944. [Google Scholar] [CrossRef]
  52. Wilson, E.O. The Insect Societies; Harvard University Press: Cambridge, MA, USA, 1971. [Google Scholar]
  53. Nisbet, C.; Guler, A.; Ormancı, N.; Cenesiz, S. Preventive Action of Zinc against Heavy Metals Toxicity in Honeybee. Afr. J. Biochem. Res. 2018, 12, 1–6. [Google Scholar]
  54. Hladun, K.R.; Kaftanoglu, O.; Parker, D.R.; Tran, K.D.; Trumble, J.T. Effects of Selenium on Development, Survival, and Accumulation in the Honeybee (Apis Mellifera L.). Environ. Toxicol. Chem. 2013, 32, 2584–2592. [Google Scholar] [CrossRef] [PubMed]
  55. Goulson, D.; Sparrow, K.R. Evidence for Competition between Honeybees and Bumblebees; Effects on Bumblebee Worker Size. J. Insect Conserv. 2009, 13, 177–181. [Google Scholar] [CrossRef] [Green Version]
  56. Walther-Hellwig, K.; Fokul, G.; Frankl, R.; Büchler, R.; Ekschmitt, K.; Wolters, V. Increased Density of Honeybee Colonies Affects Foraging Bumblebees. Apidologie 2006, 37, 517–532. [Google Scholar] [CrossRef] [Green Version]
  57. Tuzen, M.; Silici, S.; Mendil, D.; Soylak, M. Trace Element Levels in Honeys from Different Regions of Turkey. Food Chem. 2007, 103, 325–330. [Google Scholar] [CrossRef]
  58. Hladun, K.R.; Parker, D.R.; Tran, K.D.; Trumble, J.T. Effects of Selenium Accumulation on Phytotoxicity, Herbivory, and Pollination Ecology in Radish (Raphanus Sativus L.). Environ. Pollut. 2013, 172, 70–75. [Google Scholar] [CrossRef]
  59. Hladun, K.R.; Parker, D.R.; Trumble, J.T. Selenium Accumulation in the Floral Tissues of Two Brassicaceae Species and Its Impact on Floral Traits and Plant Performance. Environ. Exp. Bot. 2011, 74, 90–97. [Google Scholar] [CrossRef]
  60. Wu, L. Review of 15 Years of Research on Ecotoxicology and Remediation of Land Contaminated by Agricultural Drainage Sediment Rich in Selenium. Ecotoxicol. Environ. Saf. 2004, 57, 257–269. [Google Scholar] [CrossRef]
  61. Vickerman, D.B.; Trumble, J.T.; George, G.N.; Pickering, I.J.; Nichol, H. Selenium Biotransformations in an Insect Ecosystem: Effects of Insects on Phytoremediation. Environ. Sci. Technol. 2004, 38, 3581–3586. [Google Scholar] [CrossRef]
  62. Quinn, C.F.; Prins, C.N.; Freeman, J.L.; Gross, A.M.; Hantzis, L.J.; Reynolds, R.J.; in Yang, S.; Covey, P.A.; Bañuelos, G.S.; Pickering, I.J. Selenium Accumulation in Flowers and Its Effects on Pollination. New Phytol. 2011, 192, 727–737. [Google Scholar] [CrossRef]
  63. Varjú, D.; Núñez, J. What Do Foraging Honeybees Optimize? J. Comp. Physiol. A 1991, 169, 729–736. [Google Scholar] [CrossRef]
  64. Pankiw, T.; Page Jr, R. The Effect of Genotype, Age, Sex, and Caste on Response Thresholds to Sucrose and Foraging Behavior of Honey Bees (Apis Mellifera L.). J. Comp. Physiol. A 1999, 185, 207–213. [Google Scholar] [CrossRef] [PubMed]
  65. Johnson, B.R. Division of Labor in Honeybees: Form, Function, and Proximate Mechanisms. Behav. Ecol. Sociobiol. 2010, 64, 305–316. [Google Scholar] [CrossRef] [PubMed] [Green Version]
  66. Kato, M.; Shibata, A.; Yasui, T.; Nagamasu, H. Impact of Introduced Honeybees, Apis Mellifera, upon Native Bee Communities in the Bonin (Ogasawara) Islands. Popul. Ecol. 1999, 41, 217–228. [Google Scholar] [CrossRef]
  67. Sugden, E.A.; Thorp, R.W.; Buchmann, S.L. Honey Bee-Native Bee Competition: Focal Point for Environmental Change and Apicultural Response in Australia. Bee World 1996, 77, 26–44. [Google Scholar] [CrossRef]
  68. Thomson, D.M.; Page, M.L. The Importance of Competition between Insect Pollinators in the Anthropocene. Curr. Opin. Insect Sci. 2020, 38, 55–62. [Google Scholar] [CrossRef] [PubMed]
  69. Goras, G.; Tananaki, C.; Dimou, M.; Tscheulin, T.; Petanidou, T.; Thrasyvoulou, A. Impact of Honeybee (Apis Mellifera L.) Density on Wild Bee Foraging Behaviour. J. Apic. Sci. 2016, 60, 49. [Google Scholar] [CrossRef] [Green Version]
  70. Davis, J.D.; Hendrix, S.D.; Debinski, D.M.; Hemsley, C.J. Butterfly, Bee and Forb Community Composition and Cross-Taxon Incongruence in Tallgrass Prairie Fragments. J. Insect Conserv. 2008, 12, 69–79. [Google Scholar] [CrossRef]
  71. Fernández, V.; Brown, P.H. From Plant Surface to Plant Metabolism: The Uncertain Fate of Foliar-Applied Nutrients. Front. Plant Sci. 2013, 4, 289. [Google Scholar] [CrossRef] [Green Version]
  72. Kurešová, G.; Menšík, L.; Haberle, J.; Svoboda, P.; Raimanova, I. Influence of Foliar Micronutrients Fertilization on Nutritional Status of Apple Trees. Plant Soil Environ. 2019, 65, 320–327. [Google Scholar] [CrossRef] [Green Version]
  73. Zbíral, J. Determination of Plant-Available Micronutrients by the Mehlich 3 Soil Extractant–a Proposal of Critical Values. Plant Soil Environ. 2016, 62, 527–531. [Google Scholar] [CrossRef] [Green Version]
  74. Száková, J.; Tremlová, J.; Pegová, K.; Najmanová, J.; Tlustoš, P. Soil-to-Plant Transfer of Native Selenium for Wild Vegetation Cover at Selected Locations of the Czech Republic. Environ. Monit. Assess. 2015, 187, 1–9. [Google Scholar] [CrossRef] [PubMed]
Figure 1. Geographical location of the investigated localities displayed on the map of the Czech Republic (1:2,000,000).
Agronomy 12 00370 g001
Figure 2. Differences in observed taxon richness according to the type of meadow mixture and treatment. Error bars represent 95% confidence intervals. The letters (ac) represent the type of forage mixture.
Agronomy 12 00370 g002
Figure 3. Differences in observed taxon richness according to the type of meadow mixture. Error bars represent 95% confidence intervals. The letters (a, b, c) represent the type of forage mixture.
Agronomy 12 00370 g003
Figure 4. Differences in observed taxon abundance according to the type of meadow mixture and treatment. Error bars represent 95% confidence intervals. The letters (ac) represent the type of forage mixture.
Agronomy 12 00370 g004
Figure 5. Differences in observed taxon abundance according to the type of meadow mixture. Error bars represent 95% confidence interval. The letters (a–c) represent the type of forage mixture.
Agronomy 12 00370 g005
Figure 6. Partial redundancy analysis biplot with the microelement treatments and locality as covariables, showing differences within pollinator taxa according to meadow mixture.
Agronomy 12 00370 g006
Figure 7. Partial redundancy analysis biplot with the meadow mixtures and locality as covariables, showing differences within pollinator taxa according to forage treatment.
Agronomy 12 00370 g007
Figure 8. Differences in the detected amount of zinc (right) and selenium (left) in flowers, depending on treatment. Error bars represent 95% confidence intervals.
Agronomy 12 00370 g008
Table 1. Soil and weather conditions of the localities.
LocalityType of SoilLongterm Average2021
Soil Type (WRB)Soil Texture Class (WRB)Temparature (°C)Precipitation (mm)Temparature (°C)Precipitation (mm)
Vatíncambisolssundy loam6.9617.57.2658.7
Troubskochernozemsclay loam9.5506.59.4565.3
Table 2. The composition of the meadow mixtures varieties.
PlantsLatin NameComposition (%)
Mixture aMixture bMixture c
Blossom herbsCarum carvi1.700.600.20
Centaurea jacea1.700.600.20
Fagopyrum esculentum17.105.702.00
Knautia arvensis4.301.400.50
Leucanthemum vulgare8.602.801.00
Phacelia tanacefolia17.105.702.00
Salvia pratensis6.002.000.70
Sanguisorba minor2.600.900.30
Silene vulgaris0.900.300.10
Total60.0020.007.00
FabaceaeAnthyllis vulneraria5.301.300.40
Lotus corniculatus26.706.702.00
Onobrychis viciifolia6.701.700.50
Trifolium pratense1.300.300.10
Total40.0010.003.00
PoaceaeAgrostis capillaris 2.303.00
Anthoxanthum odoratum 3.104.00
Arrhenatherum elatius 2.303.00
Bromus erectus 7.8010.00
Cynosorus cristatus 6.208.00
Festuca pratensis 6.208.00
Festuca rubra rubra 11.7015.00
Festuca rubra trichophylla 5.407.00
Festuca rubra commutata 3.905.00
Festuca trachyphylla 7.8010.00
Lolium perenne 1.602.00
Phleum pratense 1.602.00
Poa pratensís 7.8010.00
Trisetum flavescens 2.303.00
Total 70.0090.00
Table 3. Results of the analysis of variance with Kenward–Roger approximations of the degrees of freedom of the generalized linear mixed-effect model, with poisson error distribution testing of the relationships between observed taxon richness, explanatory variables (i.e., meadow mixtures and treatment of microelements), and their interaction.
Sum SqMean SqNumDFDenDFF-Valuep-Value
Meadows85.38642.6932811.6730.004
Treatment18.6716.224331.7020.337
Meadows:Treatment32.0615.344681.4610.302
Table 4. Results of Tukey’s HSD post hoc test of the generalized linear mixed-effect model, with poisson error distribution with correction for multiple comparison testing of differences in taxon richness among different varieties of meadow mixture.
ContrastsEstimateSEDf.T.Ratiop-Value
a–b1.070.4031262.6540.024
a–c2.150.4031265.343<0.001
b–c1.080.4031262.6890.022
Table 5. Results of the analysis of variance with Kenward–Roger approximations of the degrees of freedom of the generalized linear mixed-effect model, with poisson error distribution testing of the relationship between abundance, explanatory variables (i.e., meadow mixtures and treatment of microelements), and their interaction.
Sum SqMean SqNumDFDenDFF-Valuep-Value
Meadows133.925 66.962 2820.661<0.001
Treatment4.518 1.506 331.7010.727
Meadows:Treatment19.674 3.279 681.4610.479
Table 6. Results of Tukey’s HSD post hoc testing of the generalized linear mixed-effect model, with poisson error distribution with correction for multiple comparisons testing of the differences in abundance among different varieties of meadow mixture.
ContrastsEstimateSEDf.T.Ratiop-Value
a–b2.8080.4051266.938 <0.001
a–c3.6750.4051269.079 <0.001
b–c0.8670.4051262.141 0.086
Publisher’s Note: MDPI stays neutral with regard to jurisdictional claims in published maps and institutional affiliations.

