Article

Relationships between Soil Electrical Conductivity and Sentinel-2-Derived NDVI with pH and Content of Selected Nutrients

1
Agrotechnology, Jagiellonów 4, 73-150 Łobez, Poland
2
Department of Biometry, Institute of Agriculture, Warsaw University of Life Sciences, Nowoursynowska 159, 02-776 Warsaw, Poland
*
Author to whom correspondence should be addressed.
Agronomy 2022, 12(2), 354; https://doi.org/10.3390/agronomy12020354
Submission received: 27 December 2021 / Revised: 20 January 2022 / Accepted: 27 January 2022 / Published: 31 January 2022
(This article belongs to the Special Issue Remote Sensing in Agriculture)

Abstract

:
Site-specific crop management demands maps which present the content of the main macronutrients. Such maps are prepared based on optimized soil sampling within management zones, which should be quite homogenous according to nutrient content, especially the content of potassium and phosphorus. Delineation of management zones is very often conducted using soil apparent electrical conductivity (EC) or other variables related to soil condition, including satellite-derived vegetation indices. In this study conducted in North-Western Poland, relationships between soil electrical conductivity and the satellite-derived normalized difference vegetation index (NDVI) of various crops (wheat, barley, and rapeseed) with soil pH and content of P, K, and Mg were evaluated. Strong relationships were observed between NDVI of cereals with potassium content in soil. Correlation coefficients for wheat ranged from 0.37 to 0.60 for average potassium content for three years and from 0.05 to 0.63 for barley. Stronger relationships were observed for the years 2018 and 2019 when NDVI was based on Sentinel-2 data, while weaker for year 2017 when Landsat 8 NDVI was used. Relationships between EC and macronutrients content were similar to those observed with NDVI. Satellite-derived NDVI of cereals can be used as a variable for the delineation of within-field management zones. The same relationships were much weaker and not consistent for winter rapeseed.

1. Introduction

Evaluation of available nutrients content such as potassium, magnesium, and phosphorus as well soil pH is very important in crop production because it allows for the optimization of soil fertilization and liming. Soil sampling and chemical analysis demand expenses which are higher if such soil sampling is conducted frequently and at high spatial density. Accurate evaluation of soil physico-chemical properties is very important in site-specific crop management, where variable-rate fertilization is applied. Delineation of management zones allows obtaining more accurate soil maps because soil properties within such zones are more homogenous. One composite soil sample represents each management zone. Areas of such management zones should be homogenous according to the most important agronomical soil properties such as soil texture, content of soil organic carbon, pH, and content of the most important nutrients such as potassium, phosphorus, and magnesium. Delineation of management zones can be based on proximal sensing (e.g., evaluation of electrical conductivity—EC) or remote-sensing data (e.g., satellite-derived spectral indices). One of the most common spectral indices used for delineation of management zones is NDVI (Normalized Difference Vegetation Index) from satellite sensors of high or medium spatial resolutions such as, e.g., Sentinel-2 [1,2], Landsat 8 [3,4], or PlanetScope [5]. The main reason why NDVI is used for such a purpose is its strong positive relationship with grain yield, which was observed in many studies at different spatial scale on various crops including cereals, including wheat and barley [6,7,8,9,10], and rapeseed [10,11,12]. Usually, NDVI is more strongly correlated with yield in later growth stages, i.e., near to harvest, however some studies proved strong relationships in early crop stages which are observed in winter crops such as winter cereals [7,8]. In early crop stages, it is usually not a good indicator of yield potential. NDVI is not only correlated with grain yield, but also with soil properties, which are important in crop management, such as soil texture and content of nutrients [13,14,15,16]. Because of that, NDVI is not only an index which is related to current crop status, but it is a more complex measure of soil agronomical conditions. Another variable which is commonly used for the delineation of management zones is apparent electrical conductivity (EC) using the proximal sensing method [17,18,19,20,21,22,23]. Electrical conductivity is strongly correlated with soil moisture, which in turn is related to soil texture. Higher EC usually means higher content of clay and lower content of sand, which was proved in various studies [24,25,26]. The strength of the relationships between EC and soil fractions ranges from weak to very strong (coefficient of determination near 1). EC depends on soil moisture and soil temperature, and because of that it is variable in time. However, the relative differences for various areas within the field are quite stable in subsequent measurements for the same field. More comprehensive approaches used for the delineation of management zones use a set of variables which characterize both yield potential and soil agronomical properties, e.g., various satellite spectral indices (besides those of NDVI, e.g., RVI, SAVI, MSAVI, GEMI, IPVI) and electrical conductivity of soil [27,28,29,30]. The delineation of management zones is especially important in optimized stratified soil sampling and later in variable-rate fertilization [31,32,33,34]. Proper delineation of management zones allows obtaining more accurate soil maps which can be used for recommendation of fertilizer doses and the application of variable-rate fertilization.
The aim of this study was the evaluation of the relationship between soil electrical conductivity and satellite-derived NDVI with soil pH and content of P, K, and Mg at management zones level to evaluate the usefulness of NDVI and EC for the delineation of within-field management zones.

2. Materials and Methods
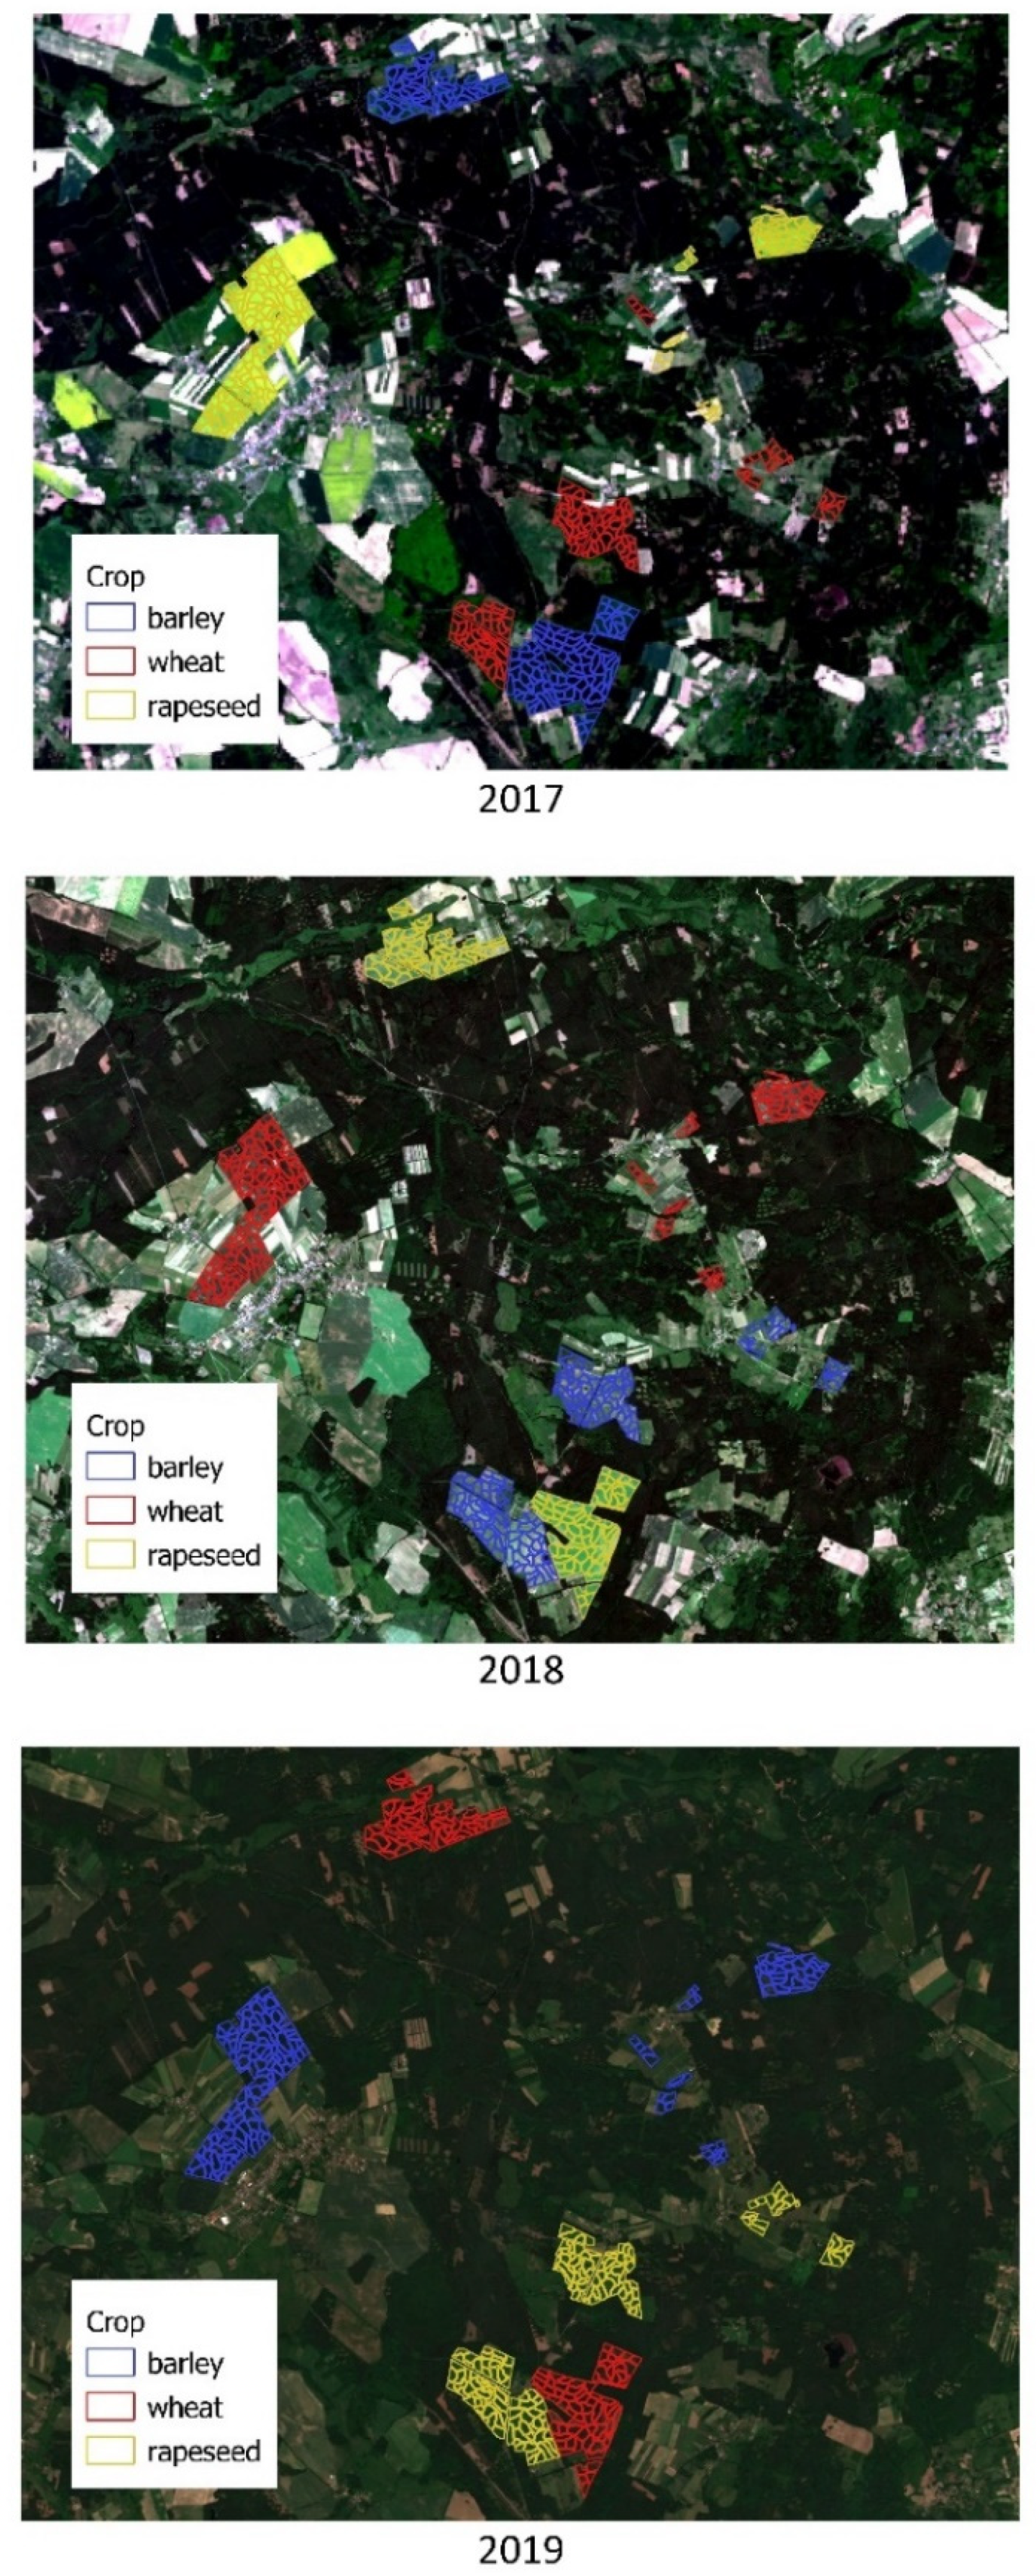
2.1. Area of Study

The study was conducted in a farm located in north-western Poland (53°56′ N 16°17′ E) in the years 2017–2019 comprising an area of about 871 ha (hectares), wherein 438 management zones were delineated (Figure 1). Area of individual management zones was about 2 ha and varied from 0.59 ha to 4.10 ha. The main criterion for the selection of the management zones was uniformity of soil within zones according to chemical and physical soil properties. The delineation of the zones was based on visual assessment of the EC maps of the fields. Areas of individual zones were similar to those which are used commonly in agronomical practice.
Prevailing soil classes according to the WRB classification in the studied fields were Luvisols and Cambisols [35,36]. The soil was characterized by a high content of sand (above 60%) and low content of clay.

2.2. Measurements of Soil Properties

EC scanning (soil scanning) has been surveyed in the summer of 2015 to allow the division into zones before soil sampling in subsequent years, following crop harvest, in the fields included in this study in conditions with relatively low soil moisture to better evaluate the differences between various soil textures and the relative relationships between EC and physico-chemical soil properties [37]. Fields were cultivated with disc harrow, and soil humidity was moderate. Geonics EM-38 (MK-1, first generation) was used in the vertical (ECL) mode, providing up to about 1 m soil penetration which was presented in mS/m (millisiemens per metre). Because the most important effect on the EC results has topsoil, the result of the measurement is mainly connected with the physico-chemical properties of the arable layer of soil [38]. The unit was calibrated before each new field according to the manufacturer’s procedures (Q and P zeroing). The scanner was installed on dielectric (polyethylene) sledge pulled by a pick-up truck in 15–20 m passages and with the speed of 15–20 km/h. EC values were recorded with 1 Hz frequency with geographical coordinates based on a DGPS receiver in a field computer with FarmWorks Mobile software.
After collecting data (ESRI SHP shapefile format), errors caused by abnormal measurements (values below zero) were filtered and cleaned in GIS software (FarmWorks Office) [39]. Proofed points were interpolated using the inverse distance weighting (IDW) method using squared-weighted interpolation where the power value was equal to 2 to create contour maps. Management zones were manually delineated based on EC values to obtain similar EC values within each zone.
One composite soil sample (consisting of 10–12 cores/subsamples) was collected from every management zone from a depth of 5–25 cm by automatic soil sampler Wintex 1000 [40] to provide the necessary quality of probes. Standard, “Z” shape of transects (zig-zag survey lines) was applied. Navigation inside zones was provided by a PC Tablet with a GPS receiver and FarmWorks Mobile software.
Sampling was repeated every season from 2017 to 2019 after the crop harvest, according to the time of harvesting particular crops, starting from the middle of July (winter barley), end of July (winter oil rapeseed), and beginning of August (winter wheat).
Four-hundred thirty-eight samples (each sample consisted of soil mixed from 10–12 cores) were tested for P2O5, K2O, Mg (available forms), and soil pH. Chemical analysis was performed according to standard procedures, i.e., pH was measured using the potentiometric method in potassium chloride solution (KCl) [41], available phosphorus and potassium were measured using the Egner-Riehm method [42], and the content was presented in mg of P2O5 and K2O per 100 g of soil. Content of available magnesium was measured using Schachtschabel methodology [43] and presented in mg Mg per 100 g of soil.

2.3. Crop Management

In the studied farmm three crops were planted, i.e., winter wheat, winter barley, and winter rapeseed. Figure 2 presents the fields with these crops in years 2017–2019. Fertilization applied was adjusted to nutrient requirements assuming expected grain yields of winter wheat and winter barley of 8 tons per hectare (t/ha) and 4.5 t/ha of winter rapeseed. Doses of phosphorus, potassium, and magnesium mineral fertilizers are presented in Table 1. For fields where pH was low and liming was required, calcium minerals containing about 34% of calcium carbonate (CaCO3) were applied at the rate of 1–1.5 t/ha.

2.4. Satellite Data

Mean values of normalized difference vegetation index (NDVI) were calculated using data acquired by Landsat 8 (for year 2017) and Sentinel-2 (for years 2018 and 2019) satellites for areas of management zones using zonal statistics in QGIS software. For the analyses, satellite imagery (C2 Level 2 product for Landsat-8 and Level-2A product for Sentinel-2) from the following dates: 19 May 2017, 3 June 2018, and 5 June 2019 was used. Such dates were selected because all three crops (winter wheat, winter barley, and winter rapeseed) were, in the region of study, during intensive growth stages (winter cereals are after anthesis or during milk maturity while winter rapeseed is in the end of flowering or during the pod-filling stage). NDVI was calculated based on red (central wavelength 655 nm for Landsat 8 and 665 nm for Sentinel-2) and near-infrared (central wavelength 865 nm for Landsat 8 and 833 nm for Sentinel-2) bands with spatial resolution 30 m for Landsat 8 and 10 m for Sentinel-2 [44]. Pixels located at the borders of the management zones were excluded from the analyses. Because NDVI for various crops cannot be compared, for the analyses for all crops together, the standardized value of NDVI was used. Standardization was performed for each crop separately, i.e., from each value mean NDVI for each crop was subtracted and then divided by the standard deviation.

2.5. Statistical Analysis

Descriptive statistics such as means, standard deviations (SD), and coefficients of variations (CV) were calculated for the variables in the study. Relationships between pairs of variables were calculated using Pearson’s correlation coefficients and for selected pairs of variables linear regression was applied. Statistical analyses were preformed using Statistica 13.3 program [45]. Significance level for all the analyses was set at 0.05 probability level.

3. Results

3.1. Characteristics of Chemical Soil Properties

Soil reaction as well content of available forms of phosphorus, potassium, and magnesium in most of the studied area was favorable for crops because the content of available nutrients (P, K, and Mg) in the soil was sufficient for most of the area (Table 2). In most of the studied fields, soil reaction was optimal or near to optimal for crops, i.e., soil reaction was from moderately acidic to neutral. Such a soil reaction was characterized by 91.6% of all management zones included in the study. For only six management zones (1.4%), a strong acidic soil reaction was observed and for 31 management zones (7.1%), the soil reaction was slightly alkaline. Content of phosphorus was, for almost the entire studied area, from medium to very high according to the recommendations for Poland [46]. Only 19 management zones (4.3%) were characterized by low phosphorus content in soil. Potassium content was from medium to very high for 90% of the management zones and only for 10% (44 of 438) was low and very low. In the case of magnesium, only 15 (3.4%) management zones showed low content and for the rest of the area the content of magnesium was from medium to very high according to the recommendations for Poland [47].
The studied fields were characterized by a near-to-optimal value of pH (means about 6.2–6.4) and relatively low variability of pH (CV about 8%) (Table 3). Mean content of available phosphorus (in mg P2O5 per 100 g of soil) for all three years of the study (2017–2019) was equal to 17.2 mg, which means a high content according to the recommendations for agricultural crops [46,47]. Mean content of available potassium (in mg K2O per 100 g of soil) was equal to 18.14 mg, which means medium content according to the recommendations for agricultural crops. In the case of magnesium, average content was equal to 10.45 mg/100 g of soil, which means very high content for agricultural crops. Variability of the content of P, K, and Mg was similar and much higher in comparison with the variability of pH. Coefficients of variations ranged from 25.3% to 28.5% for these three nutrients (P, K, and Mg).

3.2. Relationship between pH and Nutrients

Relationships between pH and each nutrient in subsequent years were positive and strong (Table 4), which means that these soil-chemical properties were quite stable during the period of the study.
Significant relationships were observed between all of the pairs of chemical soil properties. pH of soil was correlated positively with content of phosphorus and negatively correlated with content of potassium and magnesium. Moreover, content of phosphorus was negatively correlated with content of potassium and magnesium. Potassium and magnesium were positively correlated. The relationships were similar for each year separately as well for average values for all years (2017–2019).

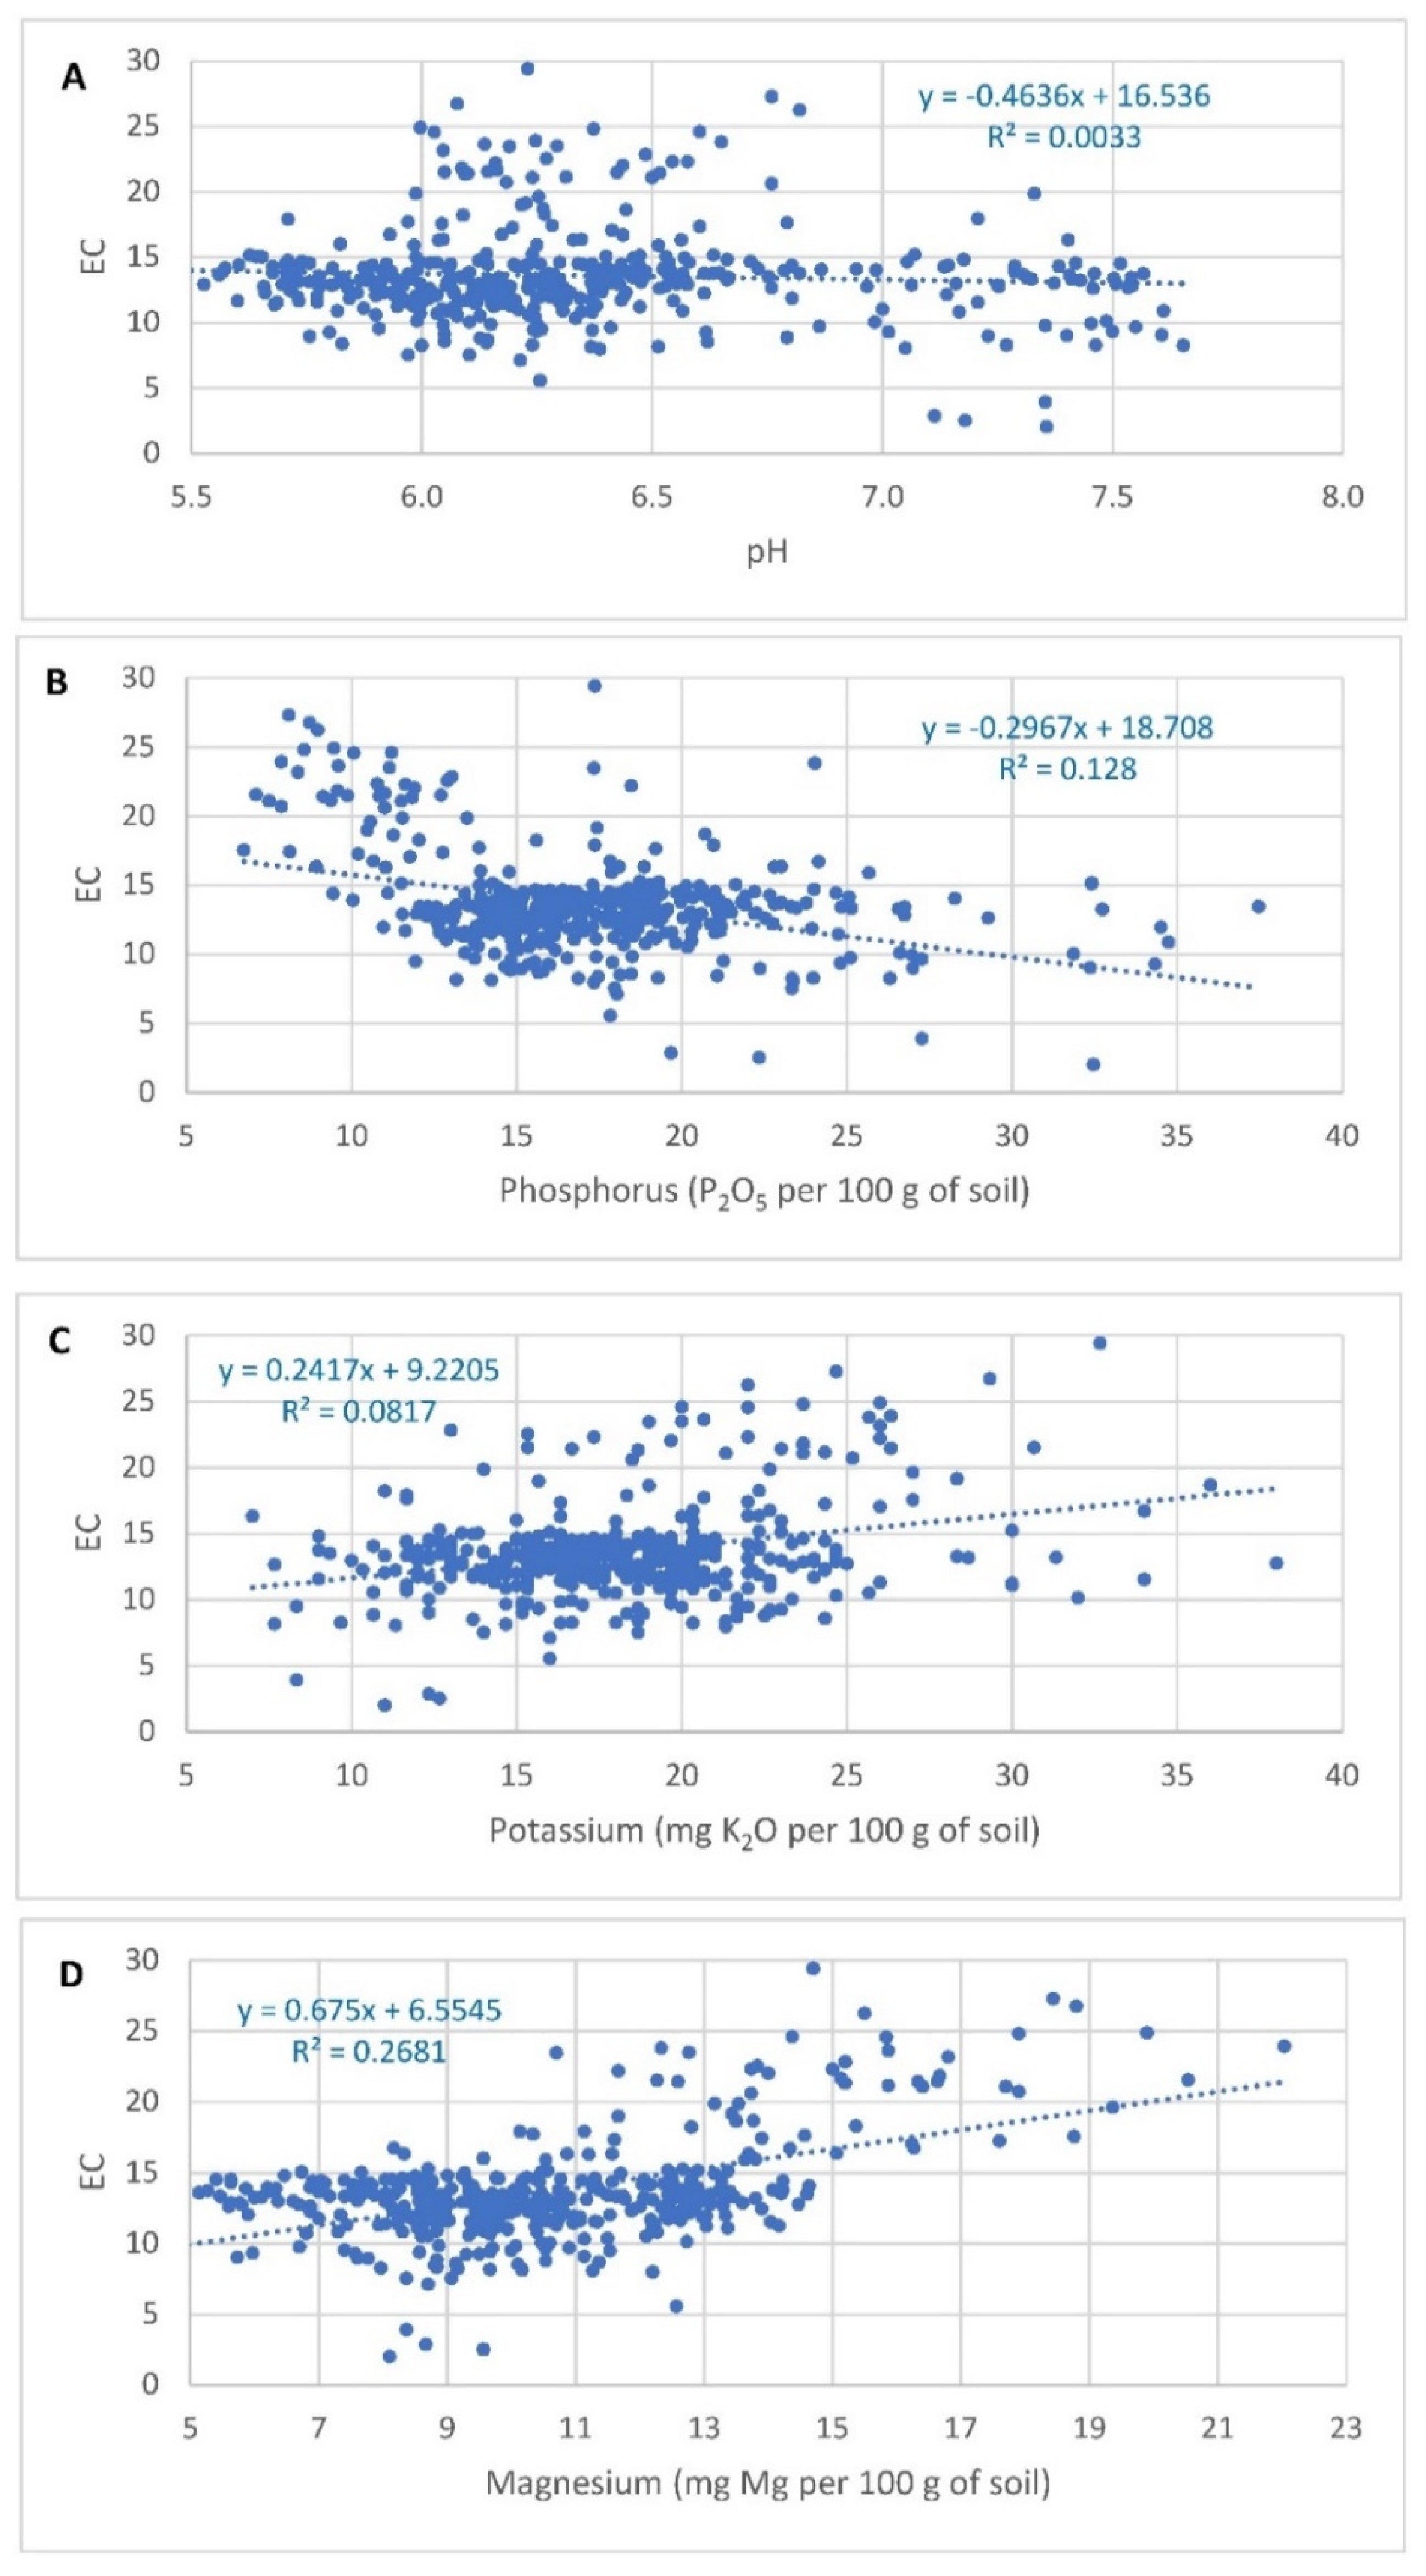
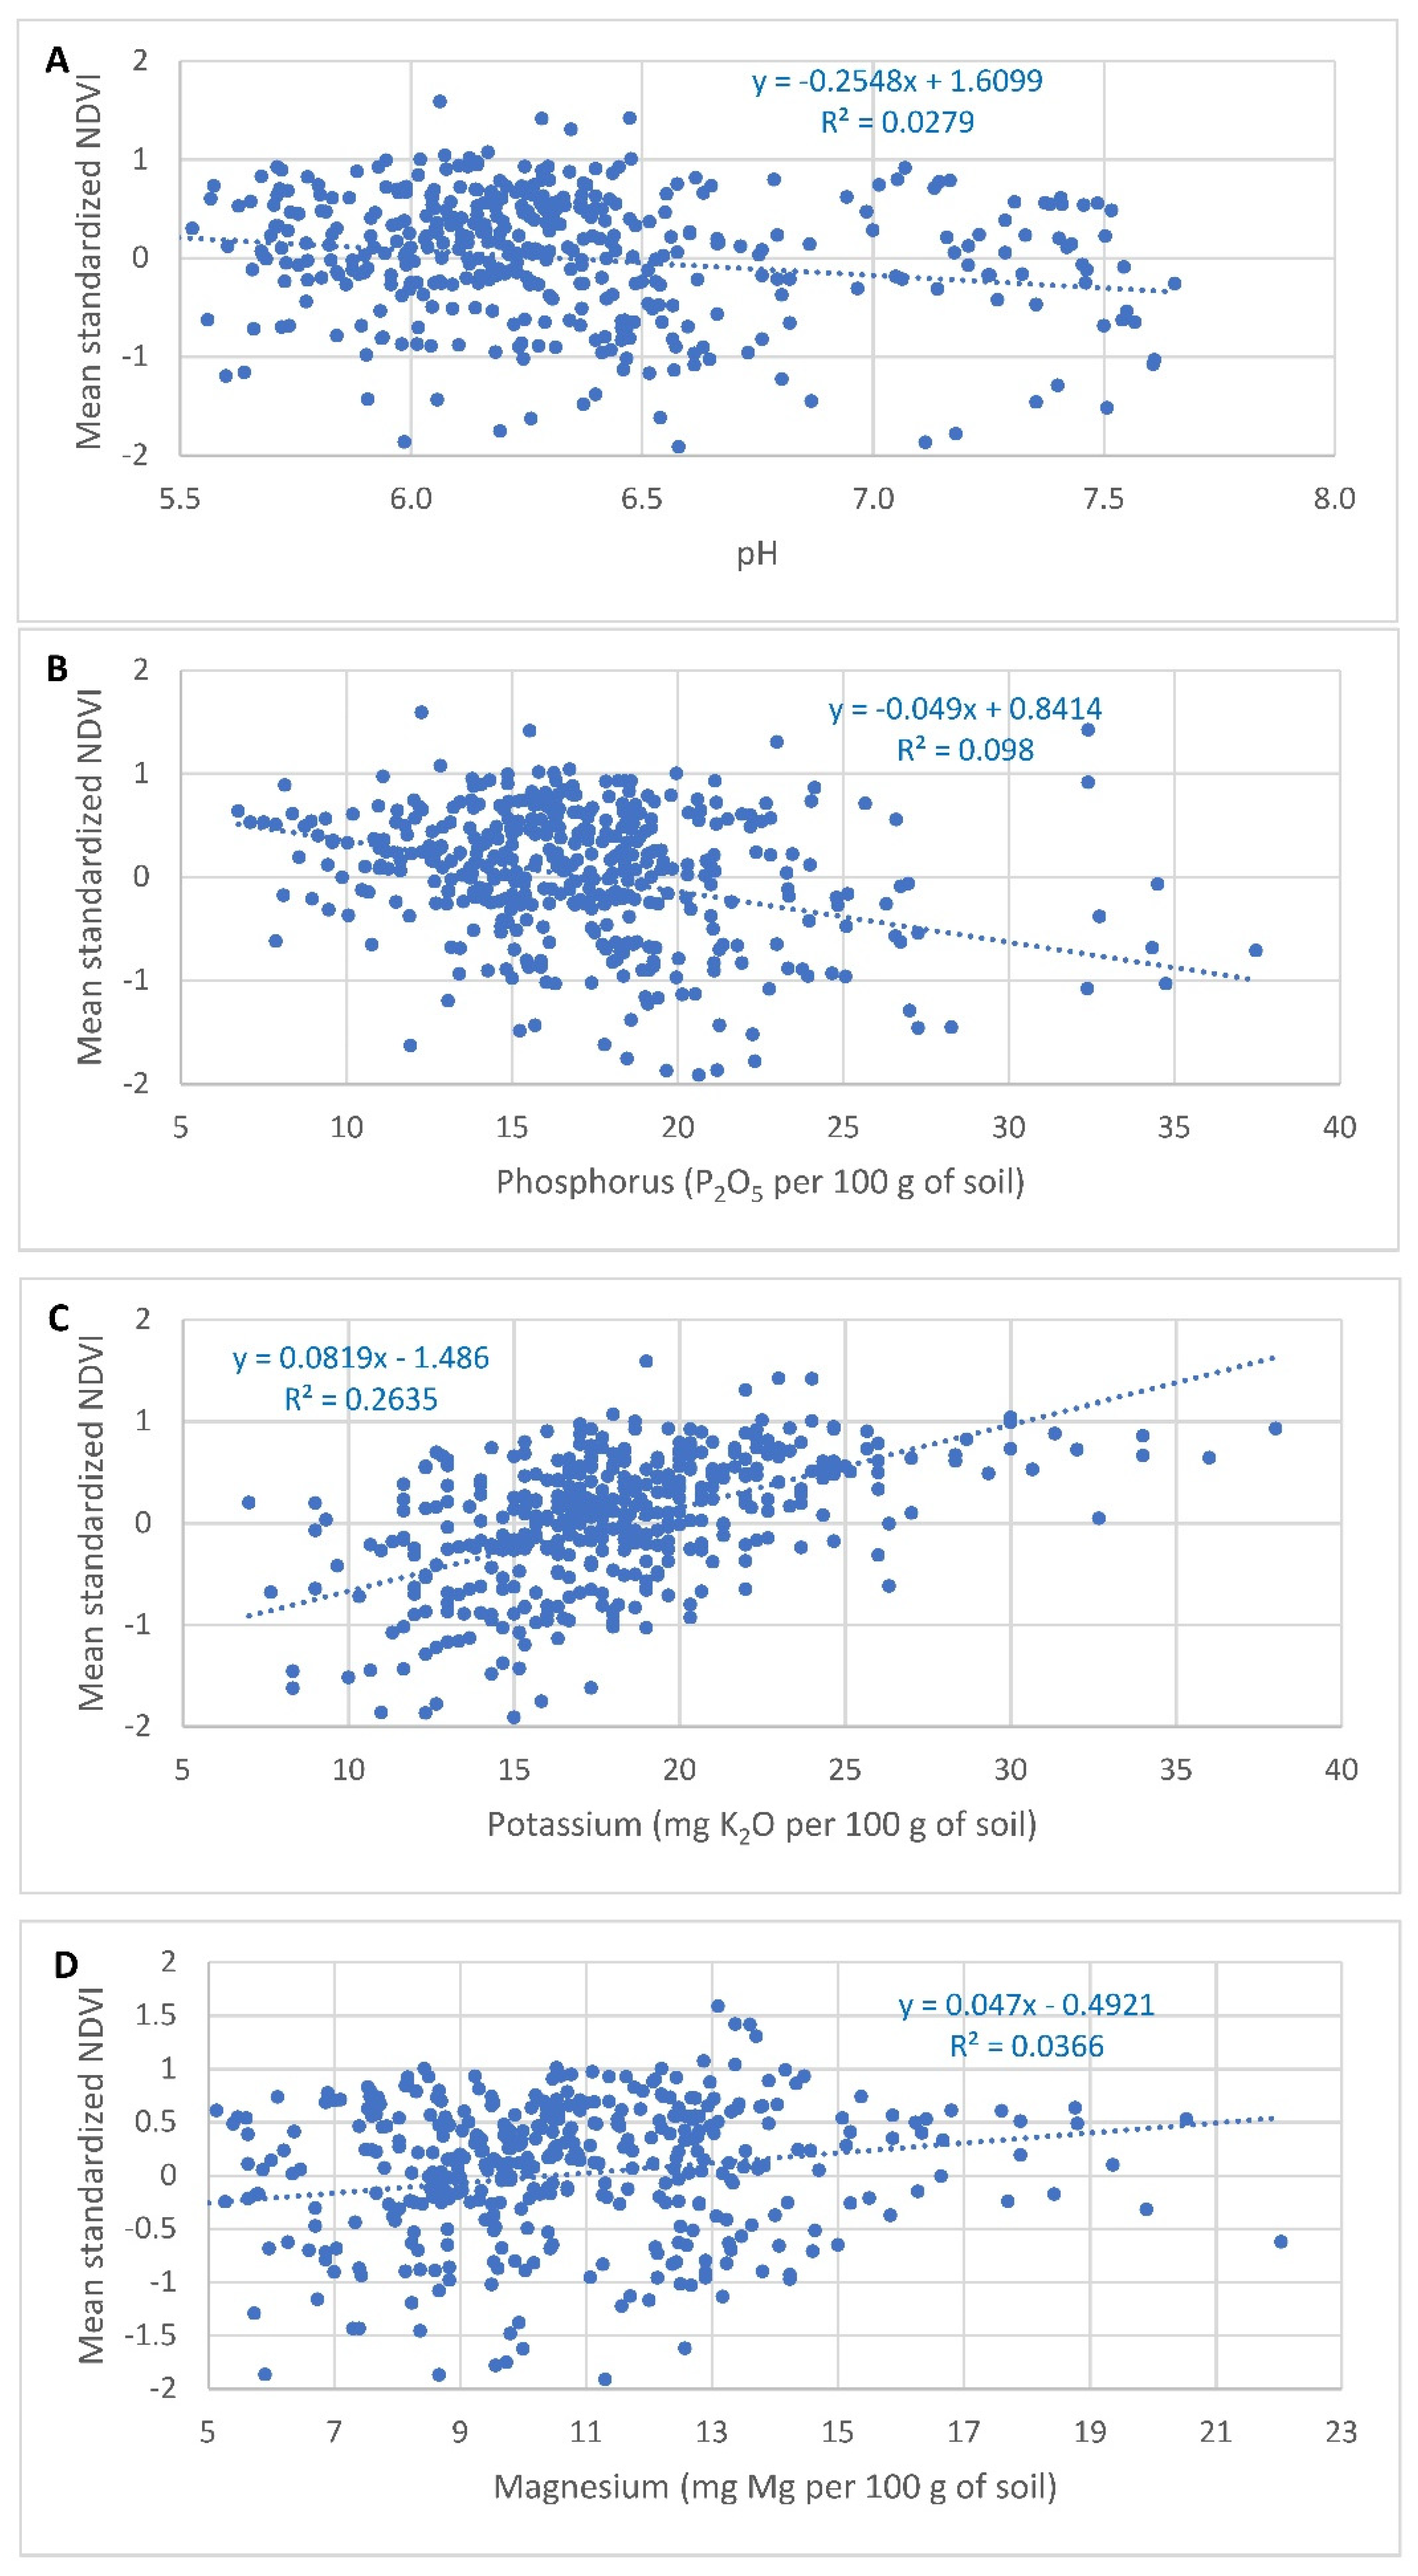
3.3. Relationships between NDVI and EC with pH and Content of Nutrients

Because various crops (wheat, barley, and rapeseed) were cultivated in each year, standardized NDVI (standard score) was used for calculation of correlation coefficients between NDVI for all crops together with pH and content of nutrients in soil. Standardization was performed separately for each crop based on mean NDVI and standard deviation. The results presented in Table 5 proved a strong positive correlation between NDVI in the year 2019 and average potassium content for years 2017–2019 (r = 0.562). Positive but weaker correlations (r = 0.228 in 2017 and 0.332 in 2018) were observed between NDVI for other years. A positive but slightly weaker correlation was found between NDVI in 2019 with magnesium content (r = 0.455). For the other two years (2017 and 2018), the correlations were very weak (−0.124 for 2017 and 0.083 for 2028). Negative correlations were observed between NDVI and phosphorus content, the strongest in year 2019, i.e., r = −0.411, for average content of phosphorus for the years 2017–2019. For the other two years, the correlations between NDVI and average content of phosphorus were weaker (r = −0.063 in 2017 and −0.202 in 2018). Very weak negative correlations were found between NDVI and average pH for years 2017–2019 (r = −0.004 in 2017, r = −0.189 in 2018, and r = −0.176 in 2019). Positive correlations observed between EC with average (for 2017–2019) macronutrients content were with magnesium (r = 0.518) and potassium (r = 0.286) and negative between EC with phosphorus and pH (r = −0.358 and r = 0.057). The direction of the relationships was similar for both NDVI and EC, which confirmed that these two variables are positively correlated (the strongest positive correlation between EC and NDVI was observed in 2019, r = 0.287).
Correlation coefficients were calculated not only for total area of the study (all fields together), but also separately for each crop, for all fields with the same crop species (Table 6, Table 7 and Table 8).
The results proved moderate or strong positive correlations between NDVI (depending on the year) and EC with content of potassium and magnesium for winter wheat (Table 6). Most of the correlation coefficients with NDVI ranged from 0.36 to 0.63 for fields with winter wheat while with EC ranged from 0.63 to 0.70.
Most of the correlations observed between NDVI and EC with pH and phosphorus content in soil were negative (for NDVI for years 2018 and 2018) or positive but very weak (for NDVI for year 2017). These correlations for all winter wheat fields between NDVI and pH for years 2017–2019 ranged from −0.45 to 0.28, while between NDVI and phosphorus ranged −0.75 to 0.23. The correlation coefficient between EC with average pH for years 2017–2019 was equal to −0.29 and between EC and phosphorus equal to −0.68.
Correlation coefficients between NDVI and EC with content of potassium and magnesium for barley for all fields together (Table 7) proved similar relationships to those observed for winter wheat. Positive correlations were observed between NDVI and EC with potassium and magnesium in 2018 and 2019; negative or very weak correlations were observed between NDVI and EC with pH and phosphorus content in soil. The correlations for all barley fields and average content of K and Mg for years 2017–2019 were stronger between potassium with NDVI (r = 0.63 for year 2019 and 0.23 for 2018 and very weak in 2017, r = 0.05) than between magnesium with NDVI (r = 0.40 in 2019, 0.11 in 2018 and negative in 2017, r = −0.35). Correlations between EC with K and Mg were positive, respectively r = 0.18 and 0.40. Correlations between NDVI and EC with pH and P were rather weak. For all barley fields and average content P in soil for years 2017–2019, the strongest correlation was with NDVI in 2019 (r = −0.33), and for years 2017 and 2018 they were weaker (−0.18 and −0.16 respectively). The correlations for content of nutrients for individual years were quite consistent with these, which were observed for average content of nutrients, i.e., correlations between NDVI and EC with K and Mg were positive and significant, while between NDVI and EC with pH and P were negative or very weak. Stronger correlations were observed for NDVI in comparison with correlations with EC, but only for the year 2019, while for the other two years they were weaker.
Correlation coefficients between NDVI and EC with content of potassium and magnesium for winter rapeseed for all fields together (Table 8) proved similar relationships (positive correlations) to these observed for winter wheat and barley; however, the correlations were slightly weaker. The correlations for all rapeseed fields and average content of K for years 2017–2019 were the strongest between potassium with NDVI for the year 2019 (r = 0.53) and in the same year the strongest between magnesium with NDVI (r = 0.32). For other years were weaker. Correlations between EC with K and Mg were positive but weaker (respectively r = 0.23 and 0.17). Correlations between NDVI and EC with pH and P were weaker. For all rapeseed fields and average P for years 2017–2019, positive but weak correlations were observed between phosphorus with EC (r = 0.18). The correlations between nutrients and NDVI and EC for years were similar to those which were observed for average content of nutrients.
The relationships are presented in graphical form in Figure 3 and Figure 4 with regression equations and coefficients of determination. Increase of potassium content by 1 unit (mg of K2O per 100 g of soil) was related to an increase of the standardized NDVI for all crops together by about 0.08 units. In case of magnesium, an increase of magnesium content by 1 unit (mg of Mg per 100 g of soil) was related to increase of the standardized NDVI by about 0.05 units. Increase of phosphorus content by 1 unit (mg of P2O5 per 100 g of soil) was related to an decrease of standardized NDVI of winter wheat by about 0.05 units. A negative relationship between pH and NDVI based on linear regression proved that an increase of pH by one unit was related to the decrease of the standardized NDVI by about 0.25 units. Moreover, an increase of potassium by 1 unit (mg K2O per 100 g of soil) for fields with winter wheat was related to an increase of EC by about 0.24 units. For magnesium, an increase of content by 1 unit (mg of Mg per 100 g of soil) was related to an increase of EC by 0.68 units. An increase of phosphorus by one unit (mg of P2O5 per 100 g of soil) was related to a decrease of EC by 0.3 units. The relationship between EC and pH was negative but very weak.

4. Discussion

The results obtained in this study proved positive significant relationships between potassium and magnesium content in soil with NDVI and EC. Stronger relationships in this study were observed for cereals (winter wheat and winter barley) than for rapeseed. Since NDVI is strongly correlated with grain yield, we can conclude that the content of potassium and magnesium have a strong positive effect on the grain yield of winter wheat and winter barley. In this study, stronger relationships were observed between content of macronutrients with NDVI in the year 2019 than with EC, but for the other two years (2017 and 2018) the relationships were weaker. This means that delineation of management zones for stratified soil sampling can be efficient based on EC, which is directly connected with soil properties as well as based on NDVI, which is indirectly (by crop status) related to soil properties. EC is variable and can be used for the delineation management zones for site-specific crop management as a sole attribute or together with other auxiliary variables [17,18,19,20,21]. Such an approach demands proximal soil sensing using special equipment as well performing mapping of the fields at an appropriate time (very often after the crop harvest). Instead of EC maps, it is possible to use other mapping techniques of the field, including satellite remote sensing. Satellite remote-sensing data are available for free from, e.g., Sentinel and Landsat satellites. It allows the use of such data for the delineation of management zones without any additional measurements [48]. However, we should notice that cereals like winter wheat or barley are better crops for NDVI-based delineation of management zones in comparison with rapeseed because of stronger relationships with the contents of nutrients in soil. Moreover, the relationships between NDVI and soil properties can vary in different years.
In this study, negative significant relationships were observed between pH and phosphorus content in soil with NDVI and EC. Especially strong relationships were observed for winter wheat. The results were opposite to the expected because they mean that the higher pH and phosphorus content, the lower NDVI, and as a result the lower the grain yield. However, we should notice that negative correlations between potassium and magnesium content with phosphorus content were observed. Moreover, high phosphorus content in soil was related with high pH. High pH can cause lower ability for uptake by plants of phosphorus because of phosphorus fixation by calcium (precipitation of Ca phosphate minerals) [49,50,51]. Negative correlations between content of phosphorus content in soil with yields of various crops, including cereals, were found in some previous studies [27,52]. Similar results, i.e., a negative relation between NDVI with content of phosphorus in soil and pH, were observed in the study of Serrano et al. [27]. The highest phosphorus content (more than 50 mg P per kg) and the highest pH (5.6) were observed for the within-field management zone where NDVI as well yield potential was the lowest in comparison with medium- and high-potential management zones (P in the range of 20–30 mg per kg and pH in the range of 5.4–5.5). Another study [16] which presented relationships between soil properties with NDVI and grain yield of cereals (wheat and barley) proved a positive correlation between content of potassium with NDVI and grain yield (positive values of regression coefficients in multivariate model), but the relationship with content of phosphorus was not consistent, relatively weak, but in some cases positive and in some cases negative. A study on the delineation of management zones for a cotton field in Eastern China [53] proved negative relations between content of potassium as well pH with NDVI and cotton yield. The lowest pH (7.56) and content of available potassium (96 mg per kg) was observed for the management zone with the highest productivity, while the highest values (pH = 7.90 and 14 mg K per kg) were observed for the zone with the lowest productivity. Other factors such as content of nitrogen and organic matter were positively correlated with grain yield and NDVI. The results prove that potassium and phosphorus are not crucial for obtaining high yields. We should notice that usage of NDVI have some limitations including lack of availability of satellite images because of cloud cover [54], atmospheric effects, sensor factors, the saturation phenomenon [55], or other problems such as the existence of weeds which affect the value of the spectral index [56]. These problems should be avoided, e.g., by using multi-temporal satellite data.

5. Conclusions

Relationships between NDVI of cereals with macronutrients content in soil and pH were similar to relationships between EC and soil chemical properties. Because of this, both satellite-derived NDVI and EC are variables of similar usefulness for the delineation of within field management zones. The same relationships were much weaker and not consistent for winter rapeseed and because of that NDVI for rapeseed should, rather, not be used as a variable for the delineation of management zones for precision agriculture. Other spectral vegetation indices should be tested in future research on management zones delineation. In the case of EC, measurements at various soil moisture should be tested to find the optimal soil conditions for EC measurement for management zones delineation. Soil chemical properties such as pH and content of P, K, and Mg are quite stable in recent years and because of that delineated management zones can be used for stratified soil sampling in a period of about 5 years when these properties are quite stable in time.

Author Contributions

Conceptualization, P.M. and D.G.; methodology, P.M. and D.G.; validation, P.M. and A.W.; formal analysis, P.M. and D.G.; investigation, P.M.; data curation, P.M. and D.G.; writing—original draft preparation, P.M. and D.G.; writing—review and editing, P.M., A.W. and D.G.; visualization, P.M., A.W. and D.G.; supervision, D.G. All authors have read and agreed to the published version of the manuscript.

Funding

This research received no external funding.

Data Availability Statement

The data presented in this study are available on request from the corresponding author. The data are not publicly available due to ongoing unpublished research.

Conflicts of Interest

The authors declare no conflict of interest.

References

  1. Serrano, J.; Shahidian, S.; Marques da Silva, J.; Paixão, L.; Moral, F.; Carmona-Cabezas, R.; Garcia, S.; Palha, J.; Noéme, J. Mapping Management Zones Based on Soil Apparent Electrical Conductivity and Remote Sensing for Implementation of Variable Rate Irrigation—Case Study of Corn under a Center Pivot. Water 2020, 12, 3427. [Google Scholar] [CrossRef]
  2. Rasmussen, J.; Azim, S.; Boldsen, S.K.; Nitschke, T.; Jensen, S.M.; Nielsen, J.; Christensen, S. The Challenge of Reproducing Remote Sensing Data from Satellites and Unmanned Aerial Vehicles (UAVs) in the Context of Management Zones and Precision Agriculture. Precis. Agric. 2020, 22, 834–851. [Google Scholar] [CrossRef]
  3. Cicore, P.; Serrano, J.; Shahidian, S.; Sousa, A.; Costa, J.L.; da Silva, J.R.M. Assessment of the Spatial Variability in Tall Wheatgrass Forage Using LANDSAT 8 Satellite Imagery to Delineate Potential Management Zones. Environ. Monit. Assess. 2016, 188, 513. [Google Scholar] [CrossRef]
  4. Breunig, F.M.; Galvão, L.S.; Dalagnol, R.; Santi, A.L.; Della Flora, D.P.; Chen, S. Assessing the Effect of Spatial Resolution on the Delineation of Management Zones for Smallholder Farming in Southern Brazil. Remote Sens. Appl. Soc. Environ. 2020, 19, 100325. [Google Scholar] [CrossRef]
  5. Breunig, F.M.; Galvão, L.S.; Dalagnol, R.; Dauve, C.E.; Parraga, A.; Santi, A.L.; Della Flora, D.P.; Chen, S. Delineation of Management Zones in Agricultural Fields Using Cover–Crop Biomass Estimates from PlanetScope Data. Int. J. Appl. Earth Obs. Geoinf. 2020, 85, 102004. [Google Scholar] [CrossRef]
  6. Labus, M.P.; Nielsen, G.A.; Lawrence, R.L.; Engel, R.; Long, D.S. Wheat Yield Estimates Using Multi-Temporal NDVI Satellite Imagery. Int. J. Remote Sens. 2002, 23, 4169–4180. [Google Scholar] [CrossRef]
  7. Benincasa, P.; Antognelli, S.; Brunetti, L.; Fabbri, C.A.; Natale, A.; Sartoretti, V.; Modeo, G.; Guiducci, M.; Tei, F.; Vizzari, M. Reliability of NDVI Derived by High Resolution Satellite and UAV Compared to In-Field Methods for the Evaluation of Early Crop n Status and Grain Yield in Wheat. Exp. Agric. 2018, 54, 604–622. [Google Scholar] [CrossRef]
  8. Panek, E.; Gozdowski, D. Analysis of Relationship between Cereal Yield and NDVI for Selected Regions of Central Europe Based on MODIS Satellite Data. Remote Sens. Appl. Soc. Environ. 2020, 17, 100286. [Google Scholar] [CrossRef]
  9. Wall, L.; Larocque, D.; Léger, P. The Early Explanatory Power of NDVI in Crop Yield Modelling. Int. J. Remote Sens. 2008, 29, 2211–2225. [Google Scholar] [CrossRef]
  10. Mkhabela, M.S.; Bullock, P.; Raj, S.; Wang, S.; Yang, Y. Crop Yield Forecasting on the Canadian Prairies Using MODIS NDVI Data. Agric. For. Meteorol. 2011, 151, 385–393. [Google Scholar] [CrossRef]
  11. Sulik, J.J.; Long, D.S. Spectral Considerations for Modeling Yield of Canola. Remote Sens. Environ. 2016, 184, 161–174. [Google Scholar] [CrossRef] [Green Version]
  12. White, J.; Berg, A.A.; Champagne, C.; Zhang, Y.; Chipanshi, A.; Daneshfar, B. Improving Crop Yield Forecasts with Satellite-Based Soil Moisture Estimates: An Example for Township Level Canola Yield Forecasts over the Canadian Prairies. Int. J. Appl. Earth Obs. Geoinf. 2020, 89, 102092. [Google Scholar] [CrossRef]
  13. Stępień, M.; Samborski, S.; Gozdowski, D.; Dobers, E.S.; Chormański, J.; Szatyłowicz, J. Assessment of Soil Texture Class on Agricultural Fields Using ECa, Amber NDVI, and Topographic Properties. J. Plant Nutr. Soil Sci. 2015, 178, 523–536. [Google Scholar] [CrossRef]
  14. Wu, W.; Yang, Q.; Lv, J.; Li, A.; Liu, H. Investigation of Remote Sensing Imageries for Identifying Soil Texture Classes Using Classification Methods. IEEE Trans. Geosci. Remote Sens. 2019, 57, 1653–1663. [Google Scholar] [CrossRef]
  15. Schumann, A.W. Nutrient Management Zones for Citrus Based on Variation in Soil Properties and Tree Performance. Precis. Agric. 2006, 7, 45–63. [Google Scholar] [CrossRef]
  16. Whetton, R.; Zhao, Y.; Shaddad, S.; Mouazen, A.M. Nonlinear Parametric Modelling to Study How Soil Properties Affect Crop Yields and NDVI. Comput. Electron. Agric. 2017, 138, 127–136. [Google Scholar] [CrossRef] [Green Version]
  17. Fraisse, C.W.; Sudduth, K.A.; Kitchen, N.R. Delineation of Site-Specific Management Zones by Unsupervised Classification of Topographic Attributes and Soil Electrical Conductivity. Trans. ASAE 2001, 44, 155–166. [Google Scholar] [CrossRef] [Green Version]
  18. Johnson, C.K.; Mortensen, D.A.; Wienhold, B.J.; Shanahan, J.F.; Doran, J.W. Site-Specific Management Zones Based on Soil Electrical Conductivity in a Semiarid Cropping System. Agron. J. 2003, 95, 303–315. [Google Scholar] [CrossRef]
  19. Moral, F.J.; Terrón, J.M.; da Silva, J.R.M. Delineation of Management Zones Using Mobile Measurements of Soil Apparent Electrical Conductivity and Multivariate Geostatistical Techniques. Soil Tillage Res. 2010, 106, 335–343. [Google Scholar] [CrossRef]
  20. Peralta, N.R.; Costa, J.L. Delineation of Management Zones with Soil Apparent Electrical Conductivity to Improve Nutrient Management. Comput. Electron. Agric. 2013, 99, 218–226. [Google Scholar] [CrossRef] [Green Version]
  21. Peralta, N.R.; Costa, J.L.; Balzarini, M.; Angelini, H. Delineation of Management Zones with Measurements of Soil Apparent Electrical Conductivity in the Southeastern Pampas. Can. J. Soil Sci. 2013, 93, 205–218. [Google Scholar] [CrossRef]
  22. Yu, R.; Kurtural, S.K. Proximal Sensing of Soil Electrical Conductivity Provides a Link to Soil-Plant Water Relationships and Supports the Identification of Plant Water Status Zones in Vineyards. Front. Plant Sci. 2020, 11, 244. [Google Scholar] [CrossRef] [Green Version]
  23. Behera, S.K.; Shukla, A.K.; Prakash, C.; Tripathi, A.; Kumar, A.; Trivedi, V. Establishing Management Zones of Soil Sulfur and Micronutrients for Sustainable Crop Production. Land Degrad. Dev. 2021, 32, 3614–3625. [Google Scholar] [CrossRef]
  24. Heil, K.; Schmidhalter, U. The Application of EM38: Determination of Soil Parameters, Selection of Soil Sampling Points and Use in Agriculture and Archaeology. Sensors 2017, 17, 2540. [Google Scholar] [CrossRef] [Green Version]
  25. Lajili, A.; Cambouris, A.N.; Chokmani, K.; Duchemin, M.; Perron, I.; Zebarth, B.J.; Biswas, A.; Adamchuk, V.I. Analysis of Four Delineation Methods to Identify Potential Management Zones in a Commercial Potato Field in Eastern Canada. Agronomy 2021, 11, 432. [Google Scholar] [CrossRef]
  26. Novais, W.; Rodríguez-Mejías, J.C.; Perret, J.; Soto, C.; Villalobos, J.E.; Fuentes, C.L.; Abdalla, K. Calibración y Validación Del Equipo Veris MSP3 En Dos Suelos de Guanacaste, Costa Rica. Agron. Mesoam. 2019, 535–551. [Google Scholar] [CrossRef]
  27. Serrano, J.; Shahidian, S.; Marques da Silva, J.; Paixão, L.; Calado, J.; de Carvalho, M. Integration of Soil Electrical Conductivity and Indices Obtained through Satellite Imagery for Differential Management of Pasture Fertilization. AgriEngineering 2019, 1, 567–585. [Google Scholar] [CrossRef] [Green Version]
  28. Rossi, R.; Pollice, A.; Bitella, G.; Labella, R.; Bochicchio, R.; Amato, M. Modelling the Non-Linear Relationship between Soil Resistivity and Alfalfa NDVI: A Basis for Management Zone Delineation. J. Appl. Geophys. 2018, 159, 146–156. [Google Scholar] [CrossRef]
  29. Hubbard, S.S.; Schmutz, M.; Balde, A.; Falco, N.; Peruzzo, L.; Dafflon, B.; Léger, E.; Wu, Y. Estimation of Soil Classes and Their Relationship to Grapevine Vigor in a Bordeaux Vineyard: Advancing the Practical Joint Use of Electromagnetic Induction (EMI) and NDVI Datasets for Precision Viticulture. Precis. Agric. 2021, 1–24. [Google Scholar] [CrossRef]
  30. Nogueira Martins, R.; Magalhães Valente, D.S.; Fim Rosas, J.T.; Souza Santos, F.; Lima Dos Santos, F.F.; Nascimento, M.; Campana Nascimento, A.C. Site-Specific Nutrient Management Zones in Soybean Field Using Multivariate Analysis: An Approach Based on Variable Rate Fertilization. Commun. Soil Sci. Plant Anal. 2020, 51, 687–700. [Google Scholar] [CrossRef]
  31. Osterholz, W.; King, K.; Williams, M.; Hanrahan, B.; Duncan, E. Stratified Soil Sampling Improves Predictions of P Concentration in Surface Runoff and Tile Discharge. Soil Syst. 2020, 4, 67. [Google Scholar] [CrossRef]
  32. Wollenhaupt, N.C.; Wolkowski, R.P.; Clayton, M.K. Mapping Soil Test Phosphorus and Potassium for Variable-Rate Fertilizer Application. J. Prod. Agric. 1994, 7, 441–448. [Google Scholar] [CrossRef]
  33. Fleming, K.L.; Westfall, D.G.; Wiens, D.W.; Brodahl, M.C. Evaluating Farmer Defined Management Zone Maps for Variable Rate Fertilizer Application. Precis. Agric. 2000, 2, 201–215. [Google Scholar] [CrossRef]
  34. Mallarino, A.P.; Wittry, D.J. Efficacy of Grid and Zone Soil Sampling Approaches for Site-Specific Assessment of Phosphorus, Potassium, PH, and Organic Matter. Precis. Agric. 2004, 5, 131–144. [Google Scholar] [CrossRef]
  35. FAO; IUSS Working Group WRB. World Reference Base for Soil Resources, 2nd ed.; World Soil Resources Reports, 103th ed.; International Union of Soil Sciences: Rome, Italy, 2006. [Google Scholar]
  36. Kabała, C.; Świtoniak, M.; Charzyński, P. Correlation between the Polish Soil Classification (2011) and International Soil Classification System World Reference Base for Soil Resources (2015). Soil Sci. Annu. 2016, 67, 88–100. [Google Scholar] [CrossRef]
  37. Costa, M.M.; Queiroz, D.M.D.; Pinto, F.D.A.D.C.; Reis, E.F.D.; Santos, N.T. Moisture Content Effect in the Relationship between Apparent Electrical Conductivity and Soil Attributes. Acta Sci. Agron. 2014, 36, 395. [Google Scholar] [CrossRef] [Green Version]
  38. McNeill, J.D. Electromagnetic Terrain Conductivity Measurement at Low Induction Numbers. Tech. Note TN-6. 1980. Available online: http://www.geonics.com/pdfs/technicalnotes/tn6.pdf (accessed on 26 December 2021).
  39. Trimble Data Management Sollution. Available online: https://agriculture.trimble.com/solutions/data-management/ (accessed on 5 April 2021).
  40. Wintex, A. Automatic Soil Samplers. Available online: https://wintexagro.com/ (accessed on 5 April 2021).
  41. Mclean, E.O. Soil PH and Lime Requirement. In Agronomy Monographs; Page, A.L., Ed.; American Society of Agronomy, Soil Science Society of America: Madison, WI, USA, 2015; pp. 199–224. ISBN 978-0-89118-977-0. [Google Scholar]
  42. Zawartka, L.; Huszcza-Ciolkowska, G.; Szumska, E. Effects of Poly- and Orthophosphates on the Dynamics of Some Macro- and Micro-nutrient Elements in Soil Material of Varied Ph. I. Comparison of Nutrient Element Content in Soil Determined by the Methods of Egner-Riehm-Domingo and Rinkis. Commun. Soil Sci. Plant Anal. 1999, 30, 635–643. [Google Scholar] [CrossRef]
  43. Vona, V.; Centeri, C.; Giczi, Z.; Kalocsai, R.; Biro, Z.; Jakab, G.; Milics, G.; Kovacs, A.J. Comparison of Magnesium Determination Methods on Hungarian Soils. Soil Water Res. 2020, 15, 173–180. [Google Scholar] [CrossRef]
  44. Pettorelli, N. The Normalized Difference Vegetation Index; Oxford University Press: Oxford, UK, 2013; ISBN 978-0-19-969316-0. [Google Scholar]
  45. TIBCO Software Inc. Statistica (Data Analysis Software System); Version 13; TIBCO: Palo Alto, CA, USA, 2017. [Google Scholar]
  46. Jordan-Meille, L.; Rubaek, G.H.; Ehlert, P.A.I.; Genot, V.; Hofman, G.; Goulding, K.; Recknagel, J.; Provolo, G.; Barraclough, P. An Overview of Fertilizer-P Recommendations in Europe: Soil Testing, Calibration and Fertilizer Recommendations. Soil Use Manag. 2012, 28, 419–435. [Google Scholar] [CrossRef]
  47. Fotyma, M.; Shepherd, M. Soil Fertility Evaluation in Czech Republic, Latvia, Poland, Slovak Republic and the United Kingdom. Nawozy i Nawożenie 2000, 2, 1–65. [Google Scholar]
  48. Damian, J.M.; Pias, O.H.C.; Cherubin, M.R.; Fonseca, A.Z.; da Fornari, E.Z.; Santi, A.L. Applying the NDVI from Satellite Images in Delimiting Management Zones for Annual Crops. Sci. Agric. 2020, 77, e20180055. [Google Scholar] [CrossRef]
  49. Penn, C.; Camberato, J. A Critical Review on Soil Chemical Processes That Control How Soil PH Affects Phosphorus Availability to Plants. Agriculture 2019, 9, 120. [Google Scholar] [CrossRef] [Green Version]
  50. Curtin, D.; Syers, J.K. Lime-Induced Changes in Indices of Soil Phosphate Availability. Soil Sci. Soc. Am. J. 2001, 65, 147–152. [Google Scholar] [CrossRef]
  51. Murrmann, R.P.; Peech, M. Effect of PH on Labile and Soluble Phosphate in Soils. Soil Sci. Soc. Am. J. 1969, 33, 205–210. [Google Scholar] [CrossRef]
  52. Stępień, M. Usefulness of Farmyard Manure for Improving Productivity and Properties of Soils Degraded by Long-Term Unbalanced Mineral Fertilization. Ph.D. Thesis, Warsaw University of Life Sciences, Warsaw, Poland, 2004. [Google Scholar] [CrossRef]
  53. Li, Y.; Shi, Z.; Wu, C.; Li, H.; Li, F. Determination of Potential Management Zones from Soil Electrical Conductivity, Yield and Crop Data. J. Zhejiang Univ. Sci. B 2008, 9, 68–76. [Google Scholar] [CrossRef] [PubMed] [Green Version]
  54. Santaga, F.S.; Benincasa, P.; Toscano, P.; Antognelli, S.; Ranieri, E.; Vizzari, M. Simplified and Advanced Sentinel-2-Based Precision Nitrogen Management of Wheat. Agronomy 2021, 11, 1156. [Google Scholar] [CrossRef]
  55. Huang, S.; Tang, L.; Hupy, J.P.; Wang, Y.; Shao, G. A Commentary Review on the Use of Normalized Difference Vegetation Index (NDVI) in the Era of Popular Remote Sensing. J. For. Res. 2021, 32, 1–6. [Google Scholar] [CrossRef]
  56. Pisman, T.I.; Erunova, M.G.; Botvich, I.Y.; Shevyrnogov, A.P. Spatial Distribution of NDVI Seeds of Cereal Crops with Different Levels of Weediness According to PlanetScope Satellite Data. J. Sib. Fed. Univ. Eng. Technol. 2020, 578–585. [Google Scholar] [CrossRef]
Figure 1. Location of the study area and management zones with average EC (in mS/m) within crop fields which were included in the study.
Agronomy 12 00354 g001
Figure 2. Fields included in the study with crops in subsequent years (2017–2019).
Agronomy 12 00354 g002
Figure 3. Relationships between EC versus pH and content of macronutrients.
Agronomy 12 00354 g003
Figure 4. Relationships between NDVI versus pH and content of macronutrients.
Agronomy 12 00354 g004
Table 1. Mineral fertilization (P, K, and Mg) applied for the studied crops.
CropWinter WheatWinter BarleyWinter Rapeseed
Expected seed yield (tons per hectare)884.5
Doses of mineral fertilization (kg per hectare)
Kieserite (magnesium sulfate—MgSO4·H2O) applied before sowing100100200
Korn-Kali (40% K2O and 6% MgO, 12.5% SO3) applied before sowing308308445
Korn-Kali (40% K2O and 6% MgO, 12.5% SO3) applied in spring100100200
Polidap (Ammonium phosphate—(NH4)3PO4, i.e., 46% P2O5 and 18% N)145145120
Table 2. Number and percentage of managements zones for different classes of soil pH and content of nutrients [46,47] (available forms of phosphorus, potassium, and magnesium) based on averaged data for all three years of study (2017–2019).
pH
Soil Reaction RangeRange (pH Units)Number of Management ZonesPercent of Management Zones
Very strongly acidicto 5.0000.0%
Strongly acidic5.01–5.5061.4%
Moderately acidic5.51–6.009922.6%
Slightly acidic6.01–6.5022350.9%
Neutral6.51–7.307918.0%
Slightly alkaline7.31–7.80317.1%
Phosphorus
Content ClassRange (mg P2O5 per 100 g of Soil)Number of Management ZonesPercent of Management Zones
Very lowto 5.000.0%
Low5.01–10.00194.3%
Medium10.01–15.0012328.1%
High15.01–20.0020546.8%
Very highfrom 20.19120.8%
Potassium
Content ClassRange (mg K2O per 100 g of Soil)Number of Management ZonesPercent of Management Zones
Very lowto 7.5010.2%
Low7.51–12.50439.8%
Medium12.51–20.0027362.3%
High20.01–25.009421.5%
Very highfrom 25.01276.2%
Magnessium
Content ClassRange (mg Mg per 100 g of Soil)Number of Management ZonesPercent of Management Zones
Very lowto 3.0000.0%
Low3.01–5.00153.4%
Medium5.01–7.00327.3%
High7.01–9.009922.6%
Very highod 9.0129266.7%
Table 3. Means, standard deviations (SD), ranges (min-max), and coefficients of variation (CV) for the studied variables.
MeanMinMaxSDCV (%)
pH 20176.385.317.600.487.45
Phosphorus 201715.313.0037.805.0533.01
Potassium 201716.425.0036.004.8029.23
Magnesium 201710.072.6019.502.7527.30
pH 20186.234.807.700.558.84
Phosphorus 201819.898.5046.205.3326.78
Potassium 201817.435.0038.005.5131.60
Magnesium 201810.533.2023.703.4032.33
pH 20196.355.007.700.518.05
Phosphorus 201916.395.2041.605.5333.75
Potassium 201920.568.0044.005.1625.10
Magnesium 201910.743.3022.903.2230.01
pH avg. 2017–20196.325.137.650.487.60
Phosphorus avg. 2017–201917.206.7337.474.6927.25
Potassium avg. 2017–201918.147.0038.004.6025.34
Magnesium avg. 2017–201910.453.2322.032.9828.54
Soil EC13.602.0143.843.8928.56
NDVI 2017-05-19—Landsat 80.500.230.600.0611.68
NDVI 2018-06-03—Sentinel-20.750.450.900.0810.02
NDVI 2019-06-05—Sentinel-20.820.370.900.056.27
Table 4. Correlation coefficients between pH and content of macronutrients in subsequent years of the study and averages for three years (significant correlations at 0.05 significance level are in bold).
pH 2017P 2017K 2017Mg 2017pH 2018P 2018K 2018Mg 2018pH 2019P 2019K 2019Mg 2019pH Avg 2017 2019P Avg 2017 2019K Avg 2017 2019Mg Avg 2017 2019
pH 2017 0.40−0.23−0.340.820.36−0.23−0.100.780.34−0.26−0.160.920.42−0.27−0.20
Phosphorus 2017 −0.21−0.440.350.66−0.30−0.360.340.65−0.23−0.360.390.87−0.28−0.40
Potassium 2017 0.55−0.17−0.160.740.39−0.17−0.110.690.37−0.20−0.170.900.45
Magnesium 2017 −0.26−0.380.560.83−0.27−0.410.430.85−0.31−0.470.570.93
pH 2018 0.45−0.16−0.040.840.40−0.20−0.110.950.45−0.20−0.13
Phosphorus 2018 −0.19−0.240.370.70−0.16−0.280.420.89−0.19−0.31
Potassium 2018 0.50−0.22−0.270.650.49−0.22−0.290.900.54
Magnesium 2018 −0.11−0.390.300.90−0.09−0.370.450.96
pH 2019 0.48−0.26−0.160.930.45−0.25−0.18
Phosphorus 2019 −0.11−0.440.440.89−0.19−0.43
Potassium 2019 0.30−0.25−0.190.870.36
Magnesium 2019 −0.15−0.410.440.97
pH avg. 2017–2019 0.47−0.25−0.18
Phosphorus avg. 2017–2019 −0.24−0.43
Potassium avg. 2017–2019 0.50
Magnesium avg. 2017–2019
Color scale for correlation coefficients (the same for Table 5, Table 6 and Table 7): Agronomy 12 00354 i001.
Table 5. Correlation coefficients between EC and standardized NDVI versus soil pH and nutrients content (significant correlations at 0.05 significance level are in bold; color background scale for correlations the same as in Table 4).
Standardized NDVI
19 May 2017—Landsat 8
Standardized NDVI
3 June 2018—Sentinel-2
Standardized NDVI
5 June 2019—Sentinel-2
Soil EC
pH 20170.067−0.156−0.153−0.039
Phosphorus 2017−0.048−0.145−0.397−0.284
Potassium 20170.1890.2910.5000.240
Magnesium 2017−0.1000.1090.4810.448
pH 2018−0.001−0.190−0.149−0.048
Phosphorus 2018−0.088−0.190−0.308−0.329
Potassium 20180.2560.2840.5210.371
Magnesium 2018−0.0910.0690.4130.497
pH 2019−0.070−0.182−0.191−0.074
Phosphorus 2019−0.031−0.199−0.384−0.333
Potassium 20190.1620.3130.4800.145
Magnesium 2019−0.1620.0640.4160.530
pH avg. 2017–2019−0.004−0.189−0.176−0.057
Phosphorus avg. 2017–2019−0.063−0.202−0.411−0.358
Potassium avg. 2017–20190.2280.3320.5620.286
Magnesium avg. 2017–2019−0.1240.0830.4550.518
Soil EC−0.0700.1120.283
Table 6. Correlation coefficients between EC and standardized NDVI with soil pH and nutrients content for winter wheat (significant correlations at 0.05 significance level are in bold; color background scale for correlations the same as in Table 4).
Standardized NDVI
19 May 2017—Landsat 8
Standardized NDVI
3 June 2018—Sentinel-2
Standardized NDVI
5 June 2019—Sentinel-2
EC
pH 20170.417−0.121−0.478−0.356
Phosphorus 20170.276−0.339−0.699−0.697
Potassium 20170.3730.5060.5600.608
Magnesium 20170.3090.5090.6530.675
pH 20180.299−0.148−0.397−0.218
Phosphorus 20180.242−0.396−0.713−0.564
Potassium 20180.5050.5100.5970.651
Magnesium 20180.3910.5120.5910.672
pH 20190.028−0.181−0.422−0.286
Phosphorus 20190.066−0.451−0.713−0.649
Potassium 20190.0570.5200.4750.443
Magnesium 20190.3440.4840.6110.696
pH avg. 2017–20190.284−0.158−0.446−0.293
Phosphorus avg. 2017–20190.226−0.460−0.749−0.678
Potassium avg. 2017–20190.3650.5490.5990.630
Magnesium avg. 2017–20190.3770.5300.6320.699
Table 7. Correlation coefficients between EC and standardized NDVI with soil pH and nutrients content for barley (significant correlations at 0.05 significance level are in bold; color background scale for correlations the same as in Table 4).
Standardized NDVI
19 May 2017—Landsat 8
Standardized NDVI
3 June 2018— Sentinel-2
Standardized NDVI
5 June 2019—Sentinel-2
EC
pH 20170.042−0.247−0.039−0.138
Phosphorus 2017−0.121−0.163−0.3830.026
Potassium 20170.0160.1930.5580.179
Magnesium 2017−0.3090.1260.3750.376
pH 2018−0.081−0.1590.012−0.044
Phosphorus 2018−0.347−0.167−0.167−0.136
Potassium 20180.0670.2110.6110.169
Magnesium 2018−0.3400.0550.4020.358
pH 2019−0.027−0.027−0.1230.003
Phosphorus 2019−0.032−0.097−0.326−0.094
Potassium 20190.0250.1410.5950.143
Magnesium 2019−0.3570.1370.3670.407
pH avg. 2017–2019−0.028−0.166−0.049−0.061
Phosphorus avg. 2017–2019−0.180−0.160−0.332−0.087
Potassium avg. 2017–20190.0450.2320.6320.175
Magnesium avg. 2017–2019−0.3470.1080.4030.400
Table 8. Correlation coefficients between EC and standardized NDVI with soil pH and nutrients content for winter rapeseed (significant correlations at 0.05 significance level are in bold; color background scale for correlations the same as in Table 4).
Standardized NDVI
19 May 2017—Landsat 8
Standardized NDVI
3 June 2018—Sentinel-2
Standardized NDVI
5 June 2019—Sentinel-2
EC
pH 2017−0.089−0.1620.0780.073
Phosphorus 2017−0.2110.017−0.1010.177
Potassium 20170.2810.1590.4890.183
Magnesium 2017−0.026−0.1920.4240.131
pH 2018−0.085−0.266−0.0260.064
Phosphorus 2018−0.023−0.015−0.1420.120
Potassium 20180.3950.1460.3500.174
Magnesium 2018−0.022−0.1840.2380.118
pH 2019−0.209−0.3030.0340.103
Phosphorus 2019−0.098−0.044−0.1550.184
Potassium 20190.3600.2380.3870.163
Magnesium 2019−0.200−0.2090.2930.240
pH avg. 2017–2019−0.132−0.2600.0290.090
Phosphorus avg. 2017–2019−0.120−0.014−0.1460.176
Potassium avg. 2017–20190.3720.1920.5330.225
Magnesium avg. 2017–2019−0.084−0.2000.3240.172
Publisher’s Note: MDPI stays neutral with regard to jurisdictional claims in published maps and institutional affiliations.

