Article

Different Types of Fertilizers Enhanced Salt Resistance of Oat and Associated Physiological Mechanisms in Saline Soils

1
Joint International Research Laboratory of Agriculture and Agri-Product Safety, Ministry of Education of China, Yangzhou University, Yangzhou 225009, China
2
Jiangsu Key Laboratory of Crop Genetics and Physiology, Agricultural College of Yangzhou University, Yangzhou 225009, China
3
Jiangsu Key Laboratory of Crop Cultivation and Physiology, Agricultural College of Yangzhou University, Yangzhou 225009, China
4
Jiangsu Co-Innovation Center for Modern Production Technology of Grain Crops, Yangzhou University, Yangzhou 225009, China
*
Author to whom correspondence should be addressed.
Agronomy 2022, 12(2), 317; https://doi.org/10.3390/agronomy12020317
Submission received: 9 December 2021 / Revised: 19 January 2022 / Accepted: 25 January 2022 / Published: 26 January 2022
(This article belongs to the Special Issue Advances in Forages, Cover Crops, and Biomass Crops Production)

Abstract

:
Soil salinization is more aggravating than ever before; suitable fertilizer application is essential for promoting crop growth and productivity in saline soils. A field experiment was conducted to study the effects of different types of fertilizers on oat (Avena sativa L.) growth and associated physiological mechanism in saline soils. Two oat varieties (V1 = Baiyan 2 and V2 = Baiyan 7) were used and four fertilizer treatments (T1 = control, T2 = nitrogen fertilizer, T3 = Giza Fertile fertilizer, T4 = Powder fertilizer) were evaluated in this study. The results showed that fertilizer treatments significantly improved plant growth and associated physiological traits, grain yield, forage yield, and forage quality of both oat varieties. Plant height, leaf area, superoxide dismutase, peroxidase, proline, forage yield, panicles, spikelets per panicle, grain weight, and grain yield were significantly increased by fertilizer application, and the maximum values were all produced under T2 (nitrogen fertilizer). But the highest values of catalase, soluble sugar, and crude fat were observed under T4 (powder fertilizer). On the contrary, malondialdehyde and crude fiber were significantly decreased by fertilizer application, and the highest value was recorded under T2 and T4, respectively. V2 was superior in plant growth, grain yield, forage yield, and forage quality than V1. This study suggested that nitrogen fertilizer was superior in promoting growth, biomass yield and grain yield production, and Powder fertilizer was better in enhancing forage quality of oat in saline soils.

1. Introduction

Soil salinization is one of the major abiotic stresses affecting crop production in the world, especially in arid and semi-arid areas [1,2]. At present, more than 20% of the arable land in the world has been affected by salt to various extents, which poses a severe threat to global sustainable development of agriculture [3]. In China, over 33.3 million ha of lands are salinized, nearly 13.3 million ha of which can be potentially improved for crop production, including 0.67 million ha saline lands that are located in the coastal area of Jiangsu Province [4]. The development and utilization of saline lands for agricultural production has become a national strategy to ensure food security in China [5]. At present, two major approaches are used to improve and utilize saline soils, including screening and breeding of salt-tolerant crop varieties and development of salt-tolerant promoting cultivation techniques [6,7].
Oat (Avena sativa L.) is an important worldwide food and feed crop with high content of carbohydrates, fat, vitamins, and various minerals [8]. It is also considered medium salt tolerant (100 mM) and can be used as a pioneer crop having an important ecological value for improving saline-alkali lands [9]. It was reported that oat had germinated well under low salinity (50 mM) and root length and root number of oat seedlings were even significantly improved [10,11,12]. However, the germination index and vigor index decreased sharply when salinity level was increased to 150~200 mM [10,12]. Under salt stress, the activity of peroxidase (POD), catalase (CAT), and superoxide dismutase (SOD) in oat leaves were significantly increased at the initial stage of salt stress, which enhanced the tolerance of oat to salt stress [13]. In addition, the accumulation of proline, soluble sugar, and soluble protein in oat plants also relieved salt damage and enhanced tolerance of oat under saline conditions [9]. On the other hand, Na+ accumulation in oat plants could be reduced by changing the distribution of Na+ or by using stomatal outflow Na+ to decrease Na+/K+ ratio, thus remittance the damage caused by salt stress [14]. In recent years, a large quantity of studies mainly focused on the growth and physiological traits of oat under salt stress, but little was concentrated on exploring salt-tolerant cultivation techniques in saline soils.
Of all the salt-tolerant cultivation techniques, fertilizer management is one of the most important strategies [15]. Salt tolerance of rice (Oryza sativa L.) was significantly improved by appropriate fertilizer application under salt stress [4]. It was reported that nitrogen fertilizer increased oat grain yield by improving photosynthesis and nitrogen accumulation under salt stress [16]. Manimaran and Poonkodi found that phosphorus and potassium fertilizer alleviated salt stress in maize (Zea mays L.) in saline soils [17]. Tunturk also found that micronutrients elements promoted the growth of soybean [Glycine max (L.) Merr.] under salt stress [18]. The possible mechanisms for how fertilizers could promote growth in salt conditions can be summarized as both antioxidant capacity and osmotic adjustment ability were enhanced by fertilizer application, which maintained higher water content and chlorophyll content of leaves and resulted in photosynthetic rate promoted [4,16]. Although different types of fertilizers have been proved to be able to enhance crop growth and relieve salt stress, associated physiological mechanism is still not fully understood.
Therefore, a field study was conducted with two oat varieties and three types of fertilizers in saline soil of coastal area of China. The purposes of this study were to: (1) evaluate the regulating effects of different types of fertilizers on oat production in saline soils; (2) explore the associated physiological mechanism of different types of fertilizer regulating on oat growth; and (3) select the applicable fertilizer for oat production in saline soils.

2. Material and Method

2.1. Plant Materials and Experimental Arrangement

A field study was conducted on Coastal Forest Farm of Dafeng, Dafeng county (33°20′ N, 120°47′ E), Yancheng City, Jiangsu Province, China in 2018 and 2019. The experimental field was coastal beach reclamation soil, which had the texture of clay loam with 0.73 g kg−1 total N, 1.42 mg kg−1 available P, 279 mg kg−1 available K, 19.75 g kg−1 organic matter, 1.48 g kg−1 soluble salt. The pH of the soil was 8.6 and soil EC (electrical conductivity) was 0.87 mS/cm.
Two oat varieties, Baiyan 2 (V1) and Baiyan 7 (V2), were used in this study, which were provided by the Grassland Research Institute of the Chinese Academy of Agricultural Sciences. Healthy and uniform size seeds were sown at the seeding rate of 180 kg hm−2 on November 23rd, both in 2018 and 2019. Three different types of fertilizers were used and four treatments were arranged as T1: Control (CK, without any fertilizer), T2: Nitrogen fertilizer (225 kg N ha−1, as 46% urea), T3: Giza Fertile fertilizer (2.5 L ha−1, containing 2.7% Fe, 1.3% Zn, 1.7% Mn, and 0.2% Cu), and T4: Powder fertilizer (489 kg ha−1, containing 5% P2O5, 0.5% K2O, 30% S, 1.5% MgO and 9% CaO). All the fertilizers were applied at the ratio of 5:5 as base fertilizer before sowing and topdressing fertilizer at booting stage. The field study was arranged in a randomized block design with three replicates. The plot size was 30 m2 (3 m × 10 m). Other field practices were used in conformity with local recommendations to avoid yield losses.

2.2. Observations and Measurements

Growth (plant height and leaf area index), physiological traits (the activity of SOD, POD, and CAT; the content of proline (Pro), malondialdehyde (MDA), and soluble sugar), forage quality (the content of crude fat, crude protein, and crude fiber), and yield related parameters (biomass yield, grain weight, and grain yield) were measured in 2018 and 2019, respectively.

2.2.1. Agronomic Parameters

Ten representative oat plants were selected from each plot to measure plant height and leaf area at tillering stage (TS), jointing stage (JS), heading stage (HS), and filling stage (FS). After the measurements of plant height, the sampled plants were separated into leaves and shoots, and then oven-dried at 80 °C to constant weight for biomass determination. After that, samples of each part were ground to powder to assay the content of soluble sugar. The content of soluble sugar was tested following the method of Short [19].

2.2.2. Physiological Parameters

At each growth stage, the upper expanded leaves from five oat plants in each plot were sampled and immersed in liquid nitrogen immediately, and then stored in an ultra-low temperature refrigerator (−80 °C) for physiological assay.
Peroxidase (POD) was measured following the method of Assaha [20]. In brief, 0.1 g fresh leaf was ground in 3 mL of 0.1 mol L−1 phosphate buffer (pH 7.0) to extract POD. The extraction was centrifuged at 18,000× g at 4 °C for 15 min. The supernatant was used as the enzyme source. The oxidized o-diphenylamine was determined at 430 nm. Phosphate buffer (0.1 mol L−1, pH 6.5) was placed in colorimetric dishes containing enzyme extract. Then, 0.2 mL 0.2 mol L−1 H2O2 was added and mixed, and the absorbance per minute was recorded. The POD activity unit expressed as the rate of increase in absorbance per minute per milligram of protein [20].
Catalase (CAT) was assayed using the method of Jini and Joseph [21]. About 0.1 g of fresh leaf was homogenized in 5 mL assay mixtures which contained 2.9 mL substrate solution (30% hydrogen peroxide in 50 mmol L−1 potassium phosphate buffer) and 0.1 mL of enzyme extraction. The decomposition of H2O2 was stopped by adding 2 mL potassium-dichromate (5%) to the mixed solution. The absorbency was measured at 620 nm. Enzyme-specific activity is expressed as mmol L−1 H2O2 (mg protein) oxidized per minute.
Superoxide dismutase (SOD) was measured following the method of Jini and Joseph. In total, 0.2 g fresh leaf was homogenized in 5 mL 100 mmol L−1 potassium phosphate buffer (pH 7.8) which containing 0.1 mmol L−1 EDTA (ethylenediamine tetraacetic acid disodium salt), 0.1% Triton X-100, and 2% polyvinyl pyrrolidone. The extraction was filtered and centrifuged with 15,000× g at 4 ℃ for 15 min and the supernatant was used for determination. The total volume of 3 mL of the assay mixture contained 50 mmol L−1 sodium carbonate/sodium bicarbonate buffer (pH 9.8), 0.1 mmol L−1 EDTA, 0.6 mmol L−1 epinephrine, and enzyme. One unit of SOD activity is expressed as the amount of enzyme required to cause 50% inhibition of epinephrine oxidation [21].
Proline (Pro) was determined following the method of Burcu [22]. About 0.5 g fresh leaf was ground in 80% anhydrous ethanol solution to prepare proline extraction, and then 0.4 g artificial zeolite and 0.2 g activated carbon were added and fully oscillate for 5 min to remove the interference of other amino acids and filtrate for backup. After that, 2 mL of the extract was placed in a test tube, followed by adding 2 mL glacial acetic acid and 2 mL of newly prepared acid triketone solution (2.5 g ninhydrin dissolved in 60 mL glacial acetic acid and 40 mL 6 mol L−1 phosphoric acid). The absorbance was recorded at 520 nm after heating in a boiling water bath for 15 min. The content of free proline in each sample was determined using the standard curve of preparation of analytical grade proline.
Malondialdehyde (MDA) was assayed following the method of Seckin [22]. About 0.5 g of fresh leaf was ground in 0.1% trichloroacetic acid (TCA), then mixed and centrifuged at 12,000× g for 15 min to prepare for the MDA extraction. After that, 1 mL supernatant with 4 mL 0.5% thiobarbituric acid (containing 20% trichloroacetic acid) was heated at 95 °C for 15 min and then centrifuged at 10,000× g for 15 min. Then the sample was recorded for the absorption at 600, 532 and 450 nm and MDA content were calculated.

2.2.3. Forage Yield, Forage Quality and Grain Yield

At heading stage, 3 m2 of oat plants from each plot were selected to measure the fresh weight of biomass (as fresh forage yield) and then dried to weight dry biomass (as biomass yield). In addition, the plants were determined for forage quality, including crude fat, crude protein, and crude fiber [23].
At maturity stage, 5 m2 oat plants from each plot were harvested for the determination of grain yield and grain weight [24].

2.3. Statistical Analysis

Analysis of variance was performed with Statistix 9.0 (Analytical Software, Tallahassee, FL, USA). The mean values were compared based on the least significant difference (LSD) test at p < 0.05. Figures were performed using Sigmaplot 10.0 (SPSS, PointRichmond, CA, USA). All the parameters are shown as the average values of the 2-year experiments because the tendency of each parameter was similar in each year and there was no significant difference between the two years.

3. Results

3.1. Plant Height

Plant height was significantly affected by fertilizer at all the growth stages, by variety at TS, JS, and FS, and by the interaction between variety and fertilizer at HS (p < 0.05 or 0.01). In general, fertilizer enhanced plant height significantly as compared with T1 (control), especially at HS and FS (with an increase of 22.5% and 8.6% with V1, and 19.2% and 10.9% with V2, respectively). Of all the treatments, T2 and T4 showed higher plant height at each growth stage. On the contrary, T3 produced the least effect on increasing plant height for both varieties (Table 1).

3.2. Leaf Area Index

Leaf area index (LAI) was significantly affected by fertilizer and variety at each growth stage (p < 0.01), by the interaction between the two factors at TS (p < 0.01), HS (p < 0.01), and FS (p < 0.05). LAI was significantly enhanced by fertilizer application at all the growth stage except in V1 under T3 and T4 treatment at TS. At TS, only T2 significantly improved LAI by 17.6% in V1. On average, LAI was increased by 38.3%, 57.4%, and 63.1% at JS, HS, and FS in V1, and by 23.5%, 28.3%, 37.5%, and 46.3% at TS, JS, HS, and FS in V2 compared with T1, respectively. In general, LAI was significantly higher in V2 than in V1 regardless of growth stages and fertilizer treatments (Table 1).

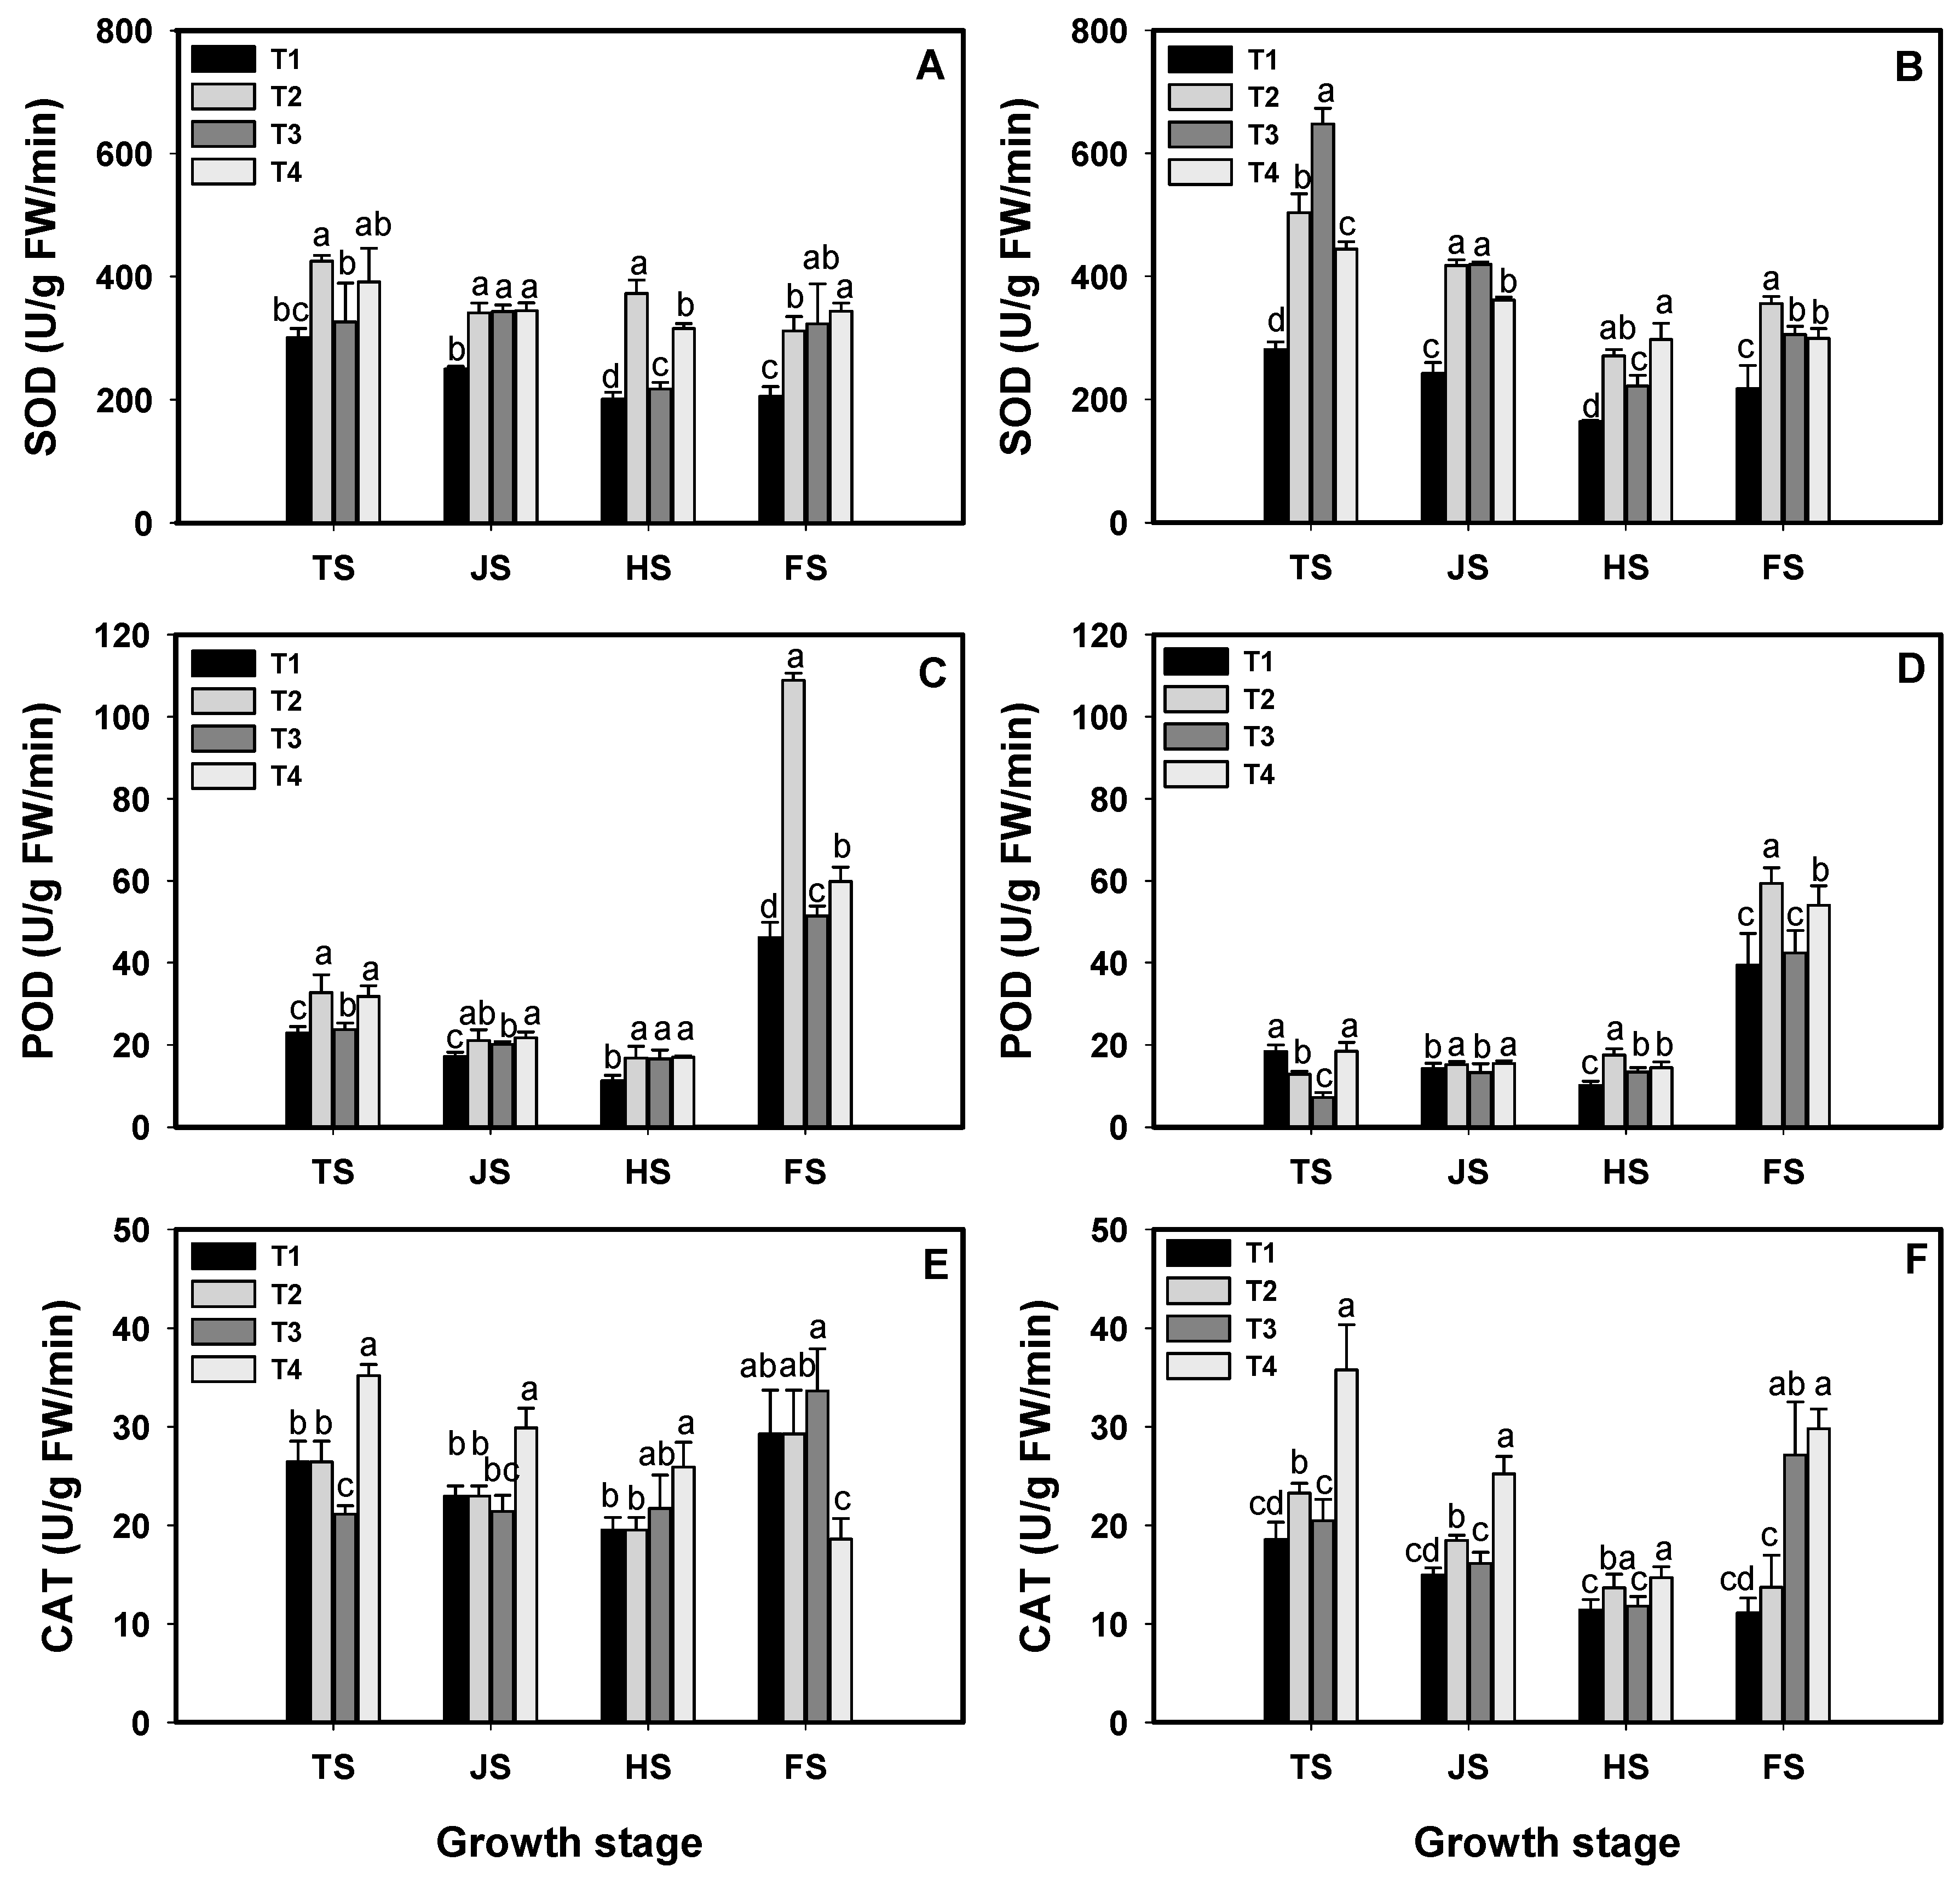
3.3. SOD, POD and CAT

The SOD activity was significantly affected by fertilizer and variety (p < 0.01), and by the interaction between fertilizer and variety at TS, HS, and FS (p < 0.05 or 0.01, Table 2). The SOD activities of both varieties were significantly improved by fertilizer (p < 0.05 or 0.01). Overall, SOD activity gradually decreased as the growth period, and the maximum value was produced at TS. Compared with V1T1, the maximum increase was achieved under V1T2 and V1T4 (91.4% and 62.3% higher than V1T1 at HS, respectively) (Figure 1A). However, the SOD activities of V2T2, V2T3, and V2T4 were increased by 79.3%, 130.5%, and 58.2% at TS as compared with V2T1, respectively (Figure 1B). In general, the SOD activity was higher in V2 than V1 at TS and JS stages under each fertilizer treatments (Figure 1A,B).
The POD activity was significantly affected by fertilizer at all growth stages (p < 0.05 or 0.01), by variety at TS, JS, and FS (p < 0.01), and by the interaction between the two factors at HS (p < 0.01, Table 2). At each growth stage, fertilizer enhanced the POD activity significantly and the highest activities were recorded at FS in both varieties (Figure 1C,D). At FS, the highest activity of POD was produced under T2 treatment, which was 136.0%, 111.3%, and 54.0% higher than T1, T3, and T4 in V1 (Figure 1C), and 50.4%, 39.8%, and 10.0% higher than that in V2, respectively. (Figure 1D). Overall, the POD activity was obviously higher in V1 than V2 regardless of growth stages and fertilizer treatments (Figure 1C,D).
The CAT activity was significantly affected by fertilizer and variety (p < 0.01), and by their interaction at TS (p < 0.05) and FS (p < 0.01) (Table 2). Similarly, the CAT activity was prominently increased by fertilizer treatments. Among the treatments, T4 showed the highest CAT activity in both variety (except at FS in V1), which was increased by 31.5%, 27.2%, and 60.6% at TS, 30.2%, 29.6%, and 47.2% at JS, and by 28.4%, 28.4%, and 12.6% at HS compared with T1, T2, and T3 in V1, respectively (Figure 1E). As well as in V2, the CAT activity under T4 was 97.3%, 56.0%, and 62.2% higher at TS, 54.5%, 35.6%, and 46.6% higher at JS, 31.2%, 6.7%, and 28.0% higher at HS, and 164.9%, 132.3%, and 6.3% higher at FS than T1, T2, and T3, respectively. In addition, the CAT activity of V1 was obviously higher than that of V2 (Figure 1F).

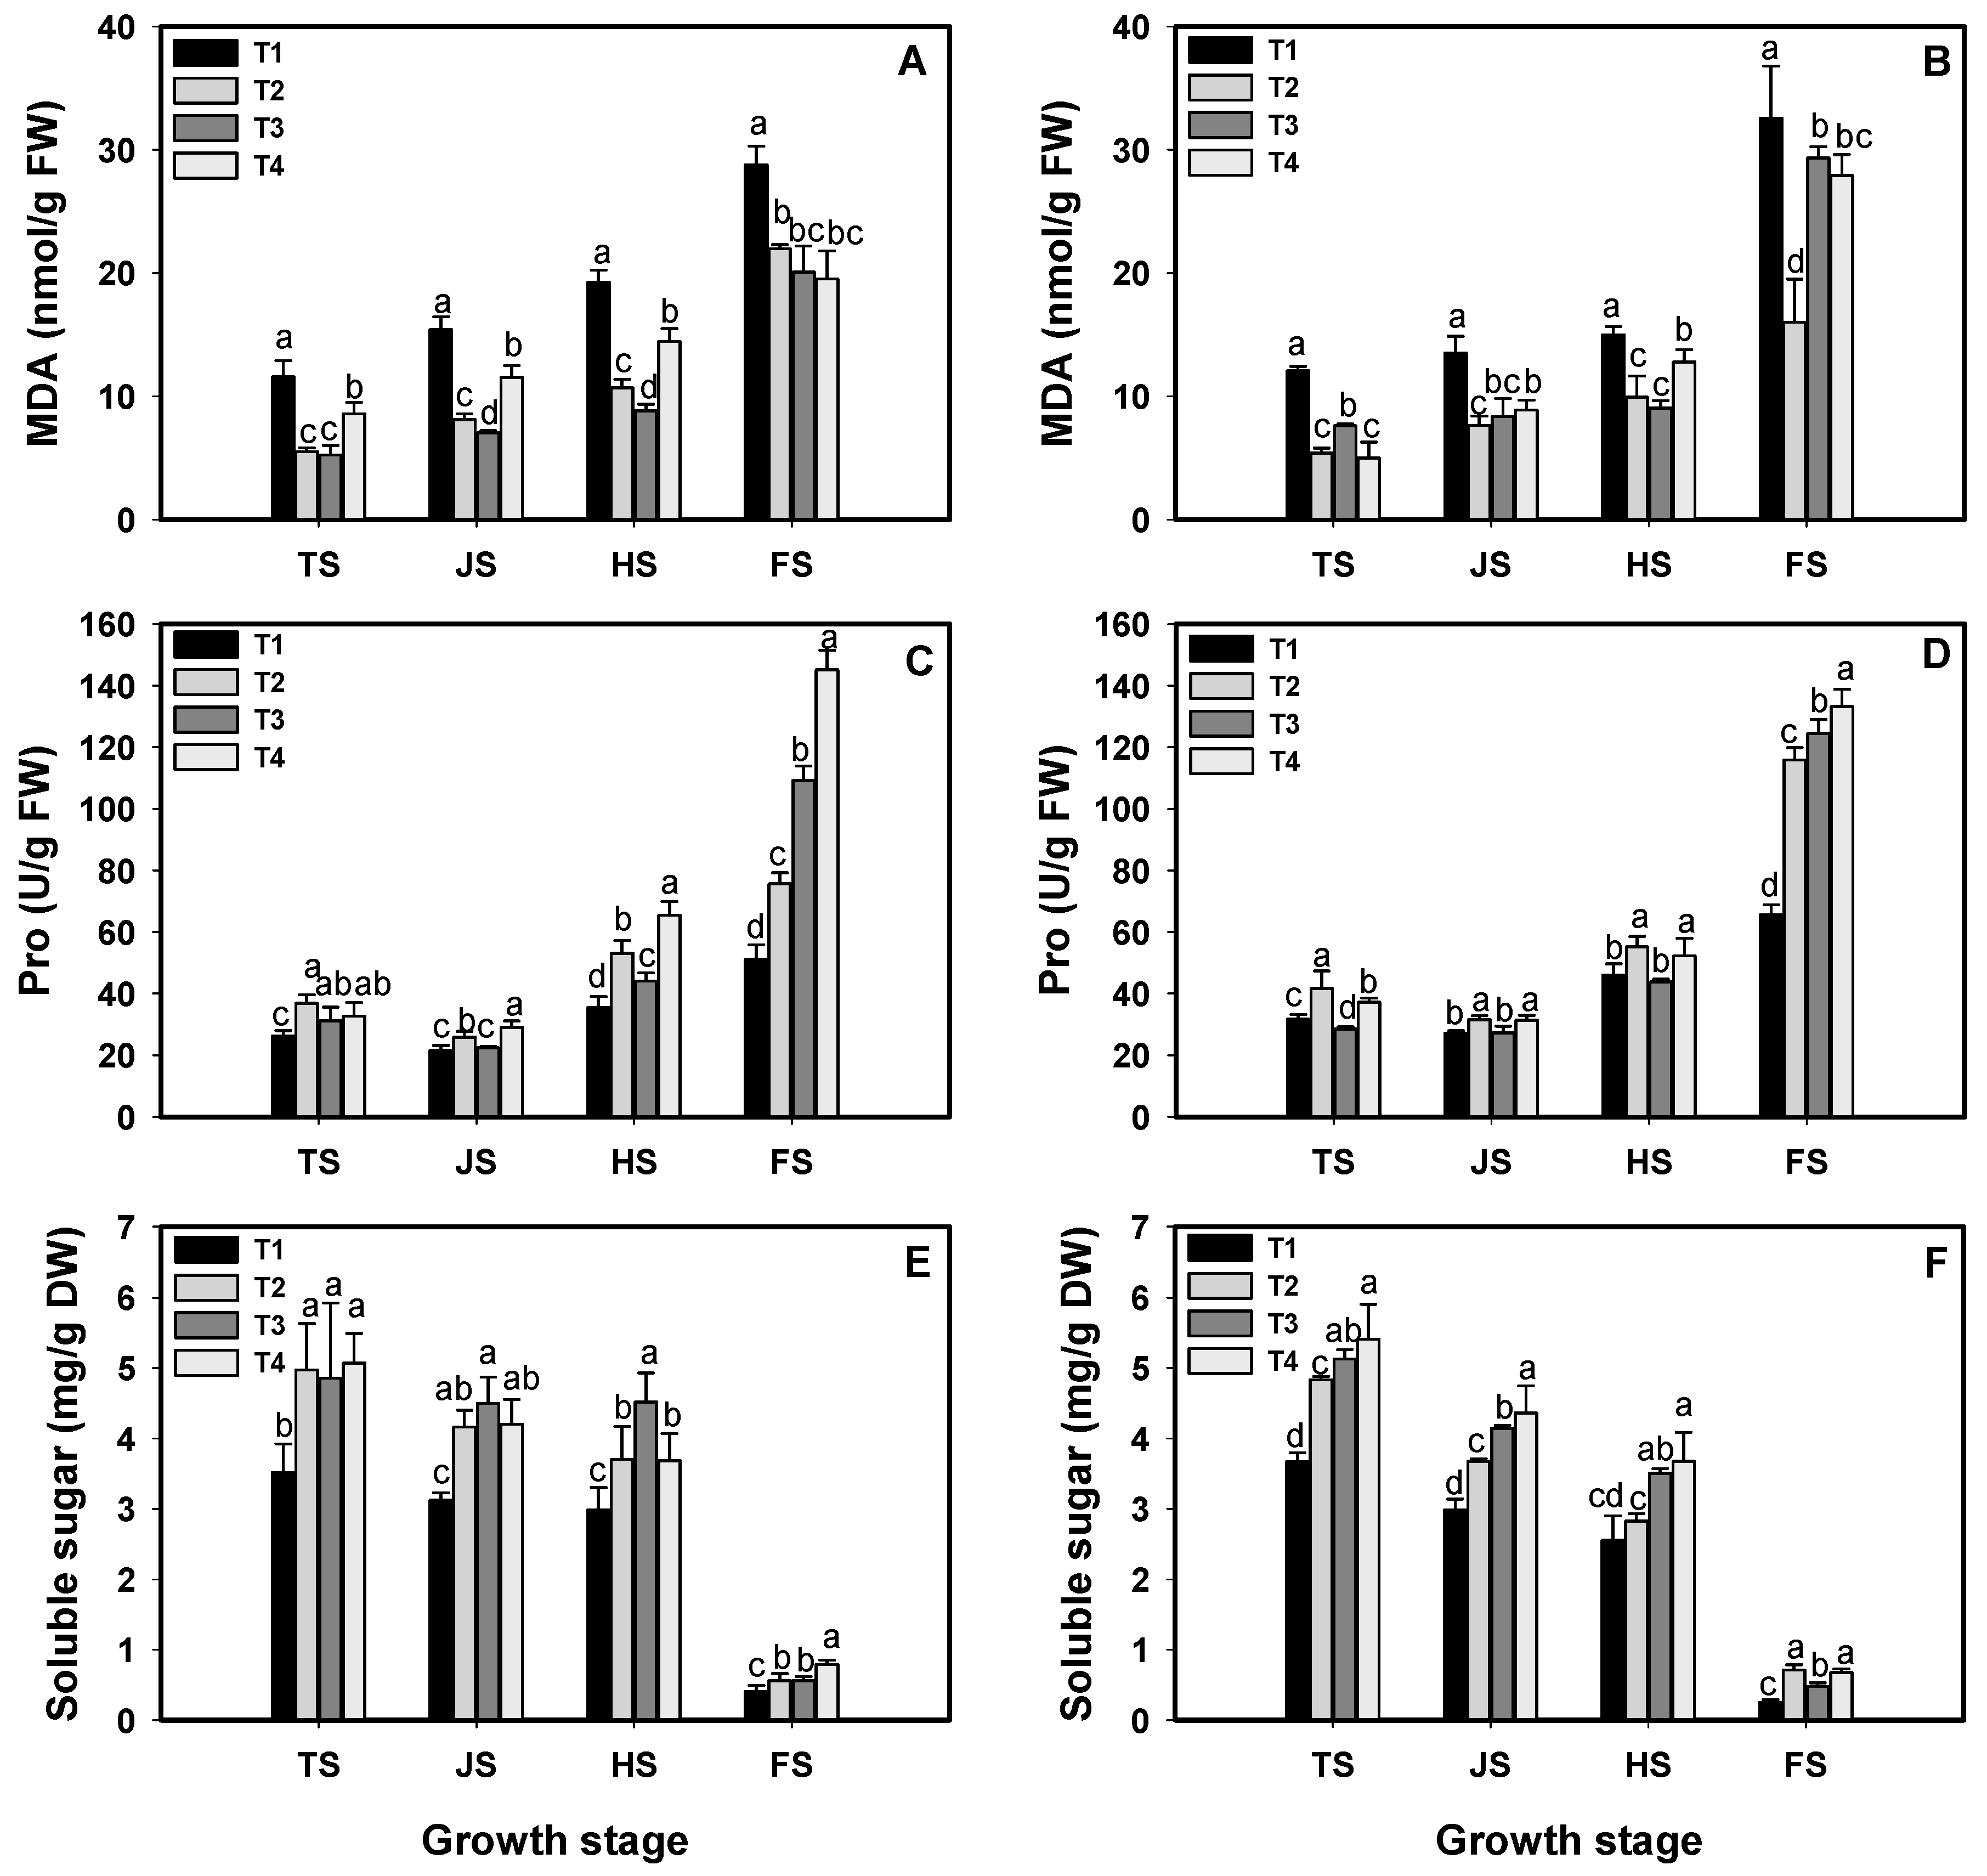
3.4. MDA, Proline and Soluble Sugar

The MDA content was significantly affected by fertilizer at all the growth stages (p < 0.05 or 0.01), by variety at TS, JS, and FS (p < 0.01), and by the interaction between fertilizer and variety at HS (p < 0.01, Table 3). The MDA content of two oat varieties increased gradually as the growth proceeded, but it decreased sharply under fertilizer treatments. On average, the MDA content of fertilizer treatments decreased by 79.7%, 73.4%, 69.8%, and 40.1% in V1, and by 101.3%, 63.1%, 41.5%, and 33.3% in V2 compared with T1 at TS, JS, HS, and FS, respectively. Overall, the lowest content of MDA was showed under T3 at TS, JS, and HS in V1, but under T2 at TS, JS, and FS in V2 (Figure 2A,B).
The proline (Pro) content was significantly affected by fertilizer (p < 0.05 or 0.01) and the interaction between variety and fertilizer at HS and FS (Table 3). The Pro content was significantly increased by fertilizer. The maximum content was produced under T2 and T4 at TS, JS, and HS and under T4 at FS in both oat varieties. Under FS, the Pro content under T4 was 184.0%, 92.2%, and 32.9% higher than that under T1, T2, and T3 in V1, and 102.9%, 14.9%, and 6.9% higher in V2, respectively (Figure 2C,D).
The soluble sugar content was significantly affected by fertilizer at each growth stage, by variety at HS, and by the interaction between fertilizer and variety at FS (p < 0.01, Table 3). Fertilizer significantly improved the content of soluble sugar in both varieties at all the growth stages. In V1, T4 showed the higher content of soluble sugar than other treatments at TS and FS. However, at JS and HS, the maximum content of soluble sugar was performed under T3, which was 44.2%, 8.2%, and 7.1% higher than T1, T2, and T4 at JS, and 51.2%, 22.2%, and 22.8% higher at HS, respectively (Figure 2E). In V2, the content of soluble sugar was performed T4 > T3 > T2 > T1 at TS, JS, and HS. But at FS, it showed a descending order of T2 > T4 > T3 > T1 (Figure 2F). Besides, the content of soluble sugar was higher in V1 than V2 at both JS and HS stages (Figure 2E,F).

3.5. Biomass Yield, Grain Yield and Yield Components

3.5.1. Biomass Yield

Biomass yield was significantly affected by variety, fertilizer, and their interaction (p < 0.01, Table 4). Biomass yield was prominently increased under each fertilizer treatment. Compared with T1, biomass yield was increased 20.0% in V1 and 35.2% in V2. In general, T2 produced the maximum biomass yield. The biomass yield was 26.3%, 4.7%, and 11.8%, and 49.0%, 11.1%, and 21.4% higher under T2 than that under T1, T3, and T4 in V1 and V2, respectively (Table 4). In addition, the biomass yield was obviously higher in V2 than V1 under each fertilizer treatments (Table 4).

3.5.2. Panicles, Spikelets per Panicle, Grain Weight, and Grain Yield

Panicles number was significantly affected by fertilizer and the interaction between fertilizer and variety (p < 0.01), but not by variety (p > 0.05, Table 4). Fertilizer significantly increased the number of panicles in both oat varieties. In V1, the maximum panicles were showed under T2 and T4, which was 13.7% and 14.4% higher than T1, respectively. However, in V2, there was no significant difference in the number of panicles under T2, T3, and T4, but still increased 18.4%, 20.9%, and 24.4% compared with T1 (Table 4).
Spikelets per panicle were significantly affected by fertilizer and variety (p < 0.01), but not by their interaction (p > 0.05, Table 4). Fertilizer application significantly increased the number of spikelets per panicle. The number of spikelets per panicle was 40.0%, 13.2%, and 28.0% higher under T2, T3, and T4 than that under T1 in V1, and 22.3%, 11.0%, and 16.7% higher in V2, respectively. In addition, the maximum number of spikelets per panicle was produced under T2 in both varieties. And V2 generated more spikelets per panicle than V1 under both control and fertilizer treatments (Table 4).
Grain weight and grain yield were significantly affected by variety and fertilizer, but not by the interaction between fertilizer and variety (Table 4). Fertilizer significantly promoted the grain weight and grain yield. The highest grain weight and grain yield were produced under T2 treatment. As for grain weight, the grain weight of T2 was 6.9%, 5.4%, and 2.6% higher than that under T1, T3, and T4 in V1, and 12.2%, 5.8%, and 5.3% in V2, respectively. In addition, V2 showed higher grain weight conspicuously than V1 regardless of the treatments (Table 4). Compared with T1, the grain yields of T2, T3, and T4 were increased by 69.9%, 16.4%, and 52.8% in V1, and increased by 62.3%, 42.3%, and 54.6% in V2. Similar to grain weight, the grain yield of V2 was prominently higher than V1 (Table 4).

3.5.3. Crude Fat, Crude Protein, and Crude Fiber

Fertilizer significantly affected the content of crude fat, crude protein, and crude fiber (p < 0.01). Variety only affected crude protein and crude fiber (p < 0.05 or 0.01). The interaction between fertilizer and variety had no significant effects on the above parameters (p > 0.05, Table 5). Among the two varieties, fertilizer significantly increased crude fat and crude protein, but decreased crude fiber (except for T4). On average, fertilizer significantly increased crude fat by 10.6% and 15.8%, and crude protein by 19.7% and 12.5% in V1 and V2, respectively. As for the treatments, the maximum of crude fat that was produced under T4 in both V1 and V2, as well as crude protein, was under T3 in V1 but T4 in V2. However, crude fiber was significantly decreased by 10.9% and 5.7% in V1, and 15.1% and 9.3% in V2 under T2 and T3, respectively. On the contrary, the crude fiber was slightly increased under T4 in V1 and V2, respectively (Table 5).

4. Discussion

Salt stress is one of the most important abiotic factors in limiting crop production. As showen in the present study, oat growth, biomass yield, grain yield, panicles, spikelets per panicle, grain weight, and forage quality were all lower in T1 than T2, T3, and T4 in saline soil. Plants response to salinity stress is a complex network affecting almost all processes, especially nutrient uptake and photosynthesis [7]. Salinity in soils diminished plant growth and yield by affecting three major physiological metabolic pathways, i.e., osmotic, ionic, and oxidative stresses [25]. In osmotic effect, a reduction in water uptake of the plant was caused by more negative osmotic potential in soil. This effect also triggers chemical signaling that lead to a reduction in stomatal aperture and photosynthetic rate. In addition, excess Na+ in saline soil also exerts ionic toxicity effects that reduces uptake of other nutrition ions and injures cell membrane, which lead to the generation of reactive oxygen species (ROS) in all cell compartments to damage DNA, proteins, pigments, and membranes [4]. These processes could inhibit biomass accumulation and allocation, which could further decrease plant height, LAI, biomass yield, and grain yield as shown in this study.
Fertilizer is one of the most important factors determining crop growth and production. Appropriate fertilizer application can promote both plant growth and yield and alleviate salt stress [26]. In the present study, application fertilizer prominently enhanced plant growth, physiological traits, and grain yield of oat. An increasing study confirmed that the growth inhibition and adverse effects induced by saline stress could be alleviated by the proper use of fertilizer [4]. The reason was that fertilizer can play both nutritional and osmotic roles in saline conditions [16]. In the present study, the antioxidative enzymes (SOD, POD, CAT) and osmotic substances (Pro, soluble sugar) were significantly increased under fertilizers treatments. The increased antioxidative enzymes could alleviate the damage of ROS (reactive oxygen species, including superoxide (O2), hydroxyl radicals (OH), hydrogen peroxide (H2O2), and singlet oxygen (O2)) that generate under salt stress on DNA, proteins, pigments, and membranes [27]. In addition, the osmotic substances, such as Pro, MDA, and soluble sugar that were regulated by fertilizers, could enhance water uptake by increasing the positive osmotic potential in soil, which could trigger chemical signaling that leads to increased stomatal aperture and photosynthetic rate [28]. Consequently, plant height, LAI, biomass yield, grain yield, and forage quality of oats were increased by fertilizers in the saline soils in the present study.
Understanding the interactions between salinity and fertilizer is essential for crop production with high economic value in saline soils. A large number of studies have been carried out to determine the effects of fertilizer on plant growth under saline conditions [29,30]. Ibrahim and Song reported that nitrogen promoted seedling growth, yield, and yield components of oat by improving root vigor, photosynthetic productivity, and chlorophyll fluorescence [16,30]. The increased root system and toot vigor by fertilizer under salinity conditions could enhance nutrients and water uptake and further improve plant growth and yield formation. That may be another reason for fertilizers improve plant growth and yield formation. This should be further studied in the present study. To date, more attention was focused on the effect of nitrogen on plant growth under salt stress, but less on other types of fertilizer. However, different types of fertilizer had different functions in promoting plant growth in saline soils.
Although it has been confirmed that fertilizers, such as N, phosphorus, potassic, and micronutrients fertilizer, can alleviate salt stress in crops in saline soils [17,18], among the three types of fertilizer in the present study, it was nitrogen fertilizer (T2) rather than Giza Fertile (T3) and Powder fertilizer (T4) that had the best promoting effect on growth, yield production, and forage quality of oat. The possible reason was that nitrogen is an essential fertilizer in agricultural production and crop plants grown in saline conditions are usually N deficient [31,32]. Salinity stress causes the ion imbalance in the soil, resulting in the decreased absorption of phosphorus, potassium in the root. In a wheat study, Ibrahim also found that it was nitrogen that had the best enhanced effects on crop production as compared with other types of fertilizer [31]. Although different types of fertilizers have been proved to be able to enhance crop growth and relieve salt stress, the associated physiological mechanism is different and still not fully understood.
Under saline conditions, nitrogen application could enhance the accumulation of osmoregulation substances, adjust stomas close and open, and improve water use efficiency, photosynthesis and other possible metabolisms [16]. All the above processes are beneficial to enhancing plant growth and biomass production, resulting in both increased biomass yield and grain yield of oat as shown in this study. As for Giza Fertile fertilizer and Powder fertilizer, they are fertilizers that mainly contain abundant microelements, such as Fe, Zn, Cu, Mn, and MgO, which can reinforce the absorption of microelements in plants (data not shown). The micro-fertilizer can significantly decline the fiber content and improve the forage quality of oat. That was the possible reason as to why nitrogen fertilizer was superior in promoting effects on growth, biomass yield, and grain yield production, and Powder fertilizer was better at enhancing the forage quality of oat in saline land. Furthermore, Baiyan 7 (V2) was superior in promoting plant growth, grain yield, forage yield, and forage quality than Baiyan 2 (V1) under both control and fertilizers treatment in the saline soils in this study. This suggests that Baiyan 7 had a more salt-tolerant ability and higher fertilizer use efficiency than Baiyan 2.

5. Conclusions

Plant growth and yield of oat were significantly limited in saline soils and fertilizer application significantly improved plant growth and associated physiological traits, grain yield and yield components, forage yield, and forage quality of oat. Fertilizer also enhanced antioxidant enzymes and osmotic substances, which was beneficial to alleviating salt stress and improving growth and yield production. Nitrogen fertilizer was superior in promoting growth, biomass yield, and grain yield production, and Powder fertilizer was better at enhancing the forage quality of oat in the saline soils. Fertilizer improved forage quality of oat by increasing the content of crude fat and crude protein and decreasing crude fiber content. Baiyan 7 was more salt tolerant and had higher fertilizer use efficiency than Baiyan 2.

Author Contributions

Conceptualization, G.Z. (Guanglong Zhu) and H.L.; methodology, H.L.; software, Z.X.; validation, G.Z. (Guanglong Zhu), Y.X. and Z.J.; formal analysis, H.L.; investigation, Z.X.; resources, G.Z. (Guisheng Zhou); data curation, Z.X.; writing—original draft preparation, H.L.; writing—review and editing, G.Z. (Guanglong Zhu); visualization, Z.J.; supervision, G.Z. (Guisheng Zhou); project administration, G.Z. (Guanglong Zhu); funding acquisition, G.Z. (Guisheng Zhou). All authors have read and agreed to the published version of the manuscript.

Funding

This work was partially funded by National Key Research and Development Program of China (2018YFE0108100), Postgraduate Research & Practice Innovation Program of Jiangsu Province (SJCX21_1624), the Open Project Program of Joint International Research Laboratory of Agricul-ture and Agri-Product Safety, the Ministry of Education of China, Yangzhou University (JI-LAR-KF202004, JILAR-KF202106), the Science and Technology Innovation Cultivating Fund of Yangzhou University (2019CXJ198), the Innovation and Promotion of Forestry Science and Technology Program of Jiangsu Province (LYKJ[2019]47), the Talent Project of ‘LvYangJinFeng’ of Yangzhou Government (2018), and the International Academic Exchange Fund for Graduate Students of Yangzhou University (2019).

Institutional Review Board Statement

Not applicable.

Informed Consent Statement

Not applicable.

Data Availability Statement

Not applicable.

Acknowledgments

We thank for the Coastal forest farm, Dafeng District that provided the research field for us. And especially thank for the Innovation and Promotion of Forestry Science and Technology Program of Jiangsu Province (LYKJ[2019]47) and the International Academic Exchange Fund for Graduate Students of Yangzhou University (2019).

Conflicts of Interest

No conflict of interest exits in the submission of this manuscript and the manuscript is approved by all authors for publication.

References

  1. Viswanathan, C.; André, J.; Zhu, J.K. Understanding and improving salt tolerance in plants. Crop Sci. 2005, 45, 437–448. [Google Scholar]
  2. Zhang, H.B.; Cui, J.; Cao, T.; Zhang, J.; Liu, Q.; Liu, H. Response to salt stresses and assessment of salt tolerability of soybean varieties in emergence and seedling stages. Acta Ecol. Sin. 2011, 31, 2805–2812. [Google Scholar]
  3. Pooja, S.; Rajesh, K. Soil salinity: A serious environmental issue and plant growth promoting bacteria as one of the tools for its alleviation. Saudi J. Biol. Sci. 2015, 22, 123–131. [Google Scholar]
  4. Zhu, G.; Lu, H.; Shi, X.; Wang, Y.; Zhi, W.; Chen, X.; Liu, J.; Ren, Z.; Shi, Y.; Ji, Z.; et al. Nitrogen Management enhanced plant growth, antioxidant ability, and grain yield of rice under salinity stress. Agron. J. 2020, 112, 550–563. [Google Scholar] [CrossRef]
  5. Zhen, Y.; Wang, B. Present status of saline soil resources and countermeasures for improvement and utilization in China. Shandong Agric. Sci. 2015, 47, 125–130. [Google Scholar]
  6. Szabolcs, I. Global overview of sustainable management of salt affected soils. Bur. Soils Water Manag. 1995, 569–575. [Google Scholar]
  7. Wang, J.L.; Huang, X.J.; Zhong, T.Y. Review on sustainable utilization of salt affected land. ACTA Geogr. Sin. 2011, 66, 673–684. [Google Scholar]
  8. Pinthus, M.J. Lodging in Wheat, Barley, and Oats: The phenomenon, its causes, and preventive measures. In Advances in Agronomy; Academic Press: Cambridge, MA, USA, 1974; Volume 25, pp. 209–263. [Google Scholar]
  9. Bo, W.; Song, F. Physiological responses and adaptive capacity of oats to saline-alkali stress. Ecol. Environ. 2006, 15, 625–629. [Google Scholar]
  10. Wu, J.; Liu, J.; Li, Q.; Fu, Z. Effect of salt stress on oat seed germination and seeding membrane permeability. J. Triticeae Crops 2009, 29, 341–345. [Google Scholar]
  11. Lu, X.; Wang, Q.; Zhao, H.; Zhang, X.; Han, Y. Effects of salt stress on seed germination and emergence of different oat varieties. Pratacultural Sci. 2009, 26, 77–81. [Google Scholar]
  12. Luo, G.N.; Zhao, G.Q.; Liu, H. The comprehensive evaluation of salt tolerance for 24 oat cultivars. Grassl. Turf 2012, 32, 34–38. [Google Scholar]
  13. Liu, F.; Liu, J.; Zhu, R.; Zhang, Y.; Guo, Y.; Han, G.; Tang, F. Physiological responses and tolerance of four oat varieties to salt stress. Acta Prataculturae Sin. 2015, 24, 183–189. [Google Scholar]
  14. Yuan, F.; Chang-zhong, R.; Pin-fang, L.; Tu-sheng, R. Oat growth and cation absorption characteristics under salt and alkali stress. Chin. J. Appl. Ecol. 2011, 22, 2875–2882. [Google Scholar]
  15. Ladha, J.K.; Pathak, H.; Krupnik, T.J.; Six, J.; van Kessel, C. Efficiency of fertilizer nitrogen in cereal production: Retrospect and prospects. Adv. Agron. 2005, 87, 85–156. [Google Scholar]
  16. Song, X.; Zhou, G.; Ma, B.L.; Wu, W.; Ahmad, I.; Zhu, G.; Yan, W.; Jiao, X. Nitrogen application improved photosynthetic productivity, chlorophyll fluorescence, yield and yield components of two oat genotypes under saline conditions. Agronomy 2019, 9, 115. [Google Scholar] [CrossRef] [Green Version]
  17. Manimaran, M.; Poonkodi, P. Yield and yield attributes of maize as influenced by graded levels of phosphorus fertilization in salt affected soils. Ann. Agric. Res. 2014, 30, 26–28. [Google Scholar]
  18. Tunturk, M.; Tunturk, R.; Yasar, F. Changes in micronutrients, dry weight and plant growth of soybean (Glycine Max L. Merrill) cultivars under salt stress. Afr. J. Biotechnol. 2008, 7, 1650–1654. [Google Scholar]
  19. Short, T.W. Biochemistry and molecular biology of plants. Biochem. Mol. Biol. Educ. 2001, 29, 37–38. [Google Scholar] [CrossRef]
  20. Assaha, D.V.M.; Mekawy, A.M.M.; Liu, L.; Noori, M.S.; Kokulan, K.S.; Ueda, A.; Nagaoka, T.; Saneoka, H. Na+ retention in the root is a key adaptive mechanism to low and high salinity in the glycophyte, talinum paniculatum (Jacq.) gaertn. (Portulacaceae). J. Agron. Crop Sci. 2017, 203, 56–67. [Google Scholar] [CrossRef]
  21. Jini, D.; Joseph, B. Physiological mechanism of salicylic acid for alleviation of salt stress in rice. Rice Sci. 2017, 2, 97–107. [Google Scholar] [CrossRef]
  22. Seckin, B.; Sekmen, A.H.; Türkan, S. An enhancing effect of exogenous mannitol on the antioxidant enzyme activities in roots of wheat under salt stress. J. Plant Growth Regul. 2009, 28, 12–20. [Google Scholar] [CrossRef]
  23. Glasser, F.; Doreau, M.; Maxin, G.; Baumont, R. Fat and fatty acid content and composition of forages: A meta-analysis. Anim. Feed. Sci. Technol. 2013, 185, 19–34. [Google Scholar] [CrossRef]
  24. Czapla, J.; Stasiulewicz, L.; Nogalska, A. Effects of growth regulators, applied alone or in combination with magnesium sulfate, on nitrogen and magnesium economy in spring triticale plants. Pol. J. Nat. Sci. 2007, 22, 357–366. [Google Scholar] [CrossRef]
  25. Munns, R.; Tester, M. Mechanisms of salinity tolerance. Annu. Rev. Plant Biol. 2008, 59, 651–681. [Google Scholar] [CrossRef] [Green Version]
  26. Peng, S.; Huang, J.; Zhong, X.; Yang, J.; Wang, G.; Zou, Y.; Zhang, F.; Zhu, Q.; Buresh, R.; Witt, C.; et al. Research strategy in improving fertilizer-nitrogen use efficiency of irrigated rice in China. Sci. Agric. Sin. 2002, 35, 1095–1103. [Google Scholar]
  27. Jayakumar, B.; Rodrigo-Moreno, A.; Shabala, S. ROS homeostasis in halophytes in the context of salinity stress tolerance. (Special Issue: Oxidative stress and cell death.). J. Exp. Bot. 2014, 65, 1241–1257. [Google Scholar]
  28. Zhu, G.; Chen, Y.; Ella, E.S.; Ismail, A.M. Mechanisms associated with tiller suppression under stagnant flooding in rice. J. Agron. Crop Sci. 2019, 205, 235–247. [Google Scholar] [CrossRef]
  29. Chen, W.; Hou, Z.; Wu, L.; Liang, Y.; Wei, C. Effects of salinity and nitrogen on cotton growth in arid environment. Plant Soil 2010, 326, 61–73. [Google Scholar] [CrossRef] [Green Version]
  30. Ibrahim, M.E.H.; Zhu, X.; Zhou, G.; Ali, A.Y.A.; Ahmad, I.; Elsiddig, A.M.I.; Zhu, G.; Nimir, N.E.A. Promoting salt tolerance in wheat seedlings by application of nitrogen fertilizer. Pak. J. Bot. 2019, 51, 1995–2002. [Google Scholar] [CrossRef]
  31. Ibrahim, M.E.H.; Zhu, X.; Zhou, G.; Abidallhaa, E.H.M.A. Effects of Nitrogen on seedling growth of wheat varieties under salt stress. J. Agric. Sci. 2016, 8, 131. [Google Scholar] [CrossRef]
  32. Rui, M.; Almeida, M. Soil salinity: Effect on vegetable crop growth. management practices to prevent and mitigate soil salinization. Horticulturae 2017, 3, 30. [Google Scholar]
Figure 1. Activity of SOD, POD, and CAT of the leaves of oat at each growth stage under different types of fertilizer treatments in saline land. Different letters within each column indicate significant differences between control and fertilizer treatments means at p < 0.05. TS: tillering stage; JS: jointing stage; HS: heading stage; FS: filling stage. T1: Control; T2: Nitrogen fertilizer; T3: Giza Fertile fertilizer; T4: Powder fertilizer. (A,C,E) means in V1 (Baiyan 2); (B,D,F) means in V2 (Baiyan 7).
Agronomy 12 00317 g001
Figure 2. Contents of MDA (malondialdehyde), Pro (proline), and soluble sugar of the leaves of oat at each growth stage under different types of fertilizers treatments in saline land. Different letters within each column indicate significant differences between control and fertilizer treatments means at p < 0.05. TS: tillering stage; JS: jointing stage; HS: heading stage; FS: filling stage. T1: Control; T2: Nitrogen fertilizer; T3: Giza Fertile fertilizer; T4: Powder fertilizer. (A,C,E) means in V1 (Baiyan 2); (B,D,F) means in V2 (Baiyan 7).
Agronomy 12 00317 g002
Table 1. Effect of different types of fertilizers on plant height, fresh weight, and leaf area index (LAI) of oat at different growth stages in saline soil.
VarietyFertilizerPlant Height (cm)LAI
TSJSHSFSTSJSHSFS
V1T117.1 ± 0.8 d45.2 ± 2.0 f68.6 ± 4.0 d100.1 ± 4.1 abc1.7 ± 0.07 bc2.7 ± 0.03 e3.6 ± 0.12 d2.8 ± 0.06 e
T223.6 ± 1.0 a53.6 ± 1.7 cd81.1 ± 2.3 bc111.0 ± 4.8 a2.0 ± 0.09 a3.8 ± 0.16 b5.6 ± 0.19 b4.5 ± 0.04 c
T321.8 ± 1.1 b49.7 ± 1.5 e80.3 ± 2.5 c106.1 ± 1.4 ab1.5 ± 0.07 c3.9 ± 0.18 b5.9 ± 0.34 b4.9 ± 0.25 b
T422.2 ± 1.1 ab54.5 ± 1.8 bc90.6 ± 4.8 a109.1 ± 16.2 a1.6 ± 0.02 bc3.5 ± 0.16 c5.5 ± 0.32 b4.3 ± 0.23 c
V2T119.3 ± 1.0 c50.2 ± 1.1 de70.8 ± 2.6 d88.6 ± 2.3 c1.7 ± 0.08 b3.3 ± 0.12 d4.8 ± 0.26 c3.6 ± 0.17 d
T222.9 ± 0.8 ab58.0 ± 2.6 ab86.2 ± 3.8 abc106.6 ± 9.2 ab2.2 ± 0.20 a4.4 ± 0.03 a6.6 ± 0.15 a5.3 ± 0.06 a
T319.4 ± 0.2 c52.8 ± 2.5 cde80.0 ± 2.8 c93.6 ± 8.7 c2.0 ± 0.13 a4.3 ± 0.04 a6.7 ± 0.19 a5.3 ± 0.11 a
T420.2 ± 0.5 c59.5 ± 3.1 a87.0 ± 4.5 ab94.5 ± 7.0 bc2.1 ± 0.08 a4.3 ± 0.15 a6.5 ± 0.26 a5.2 ± 0.19 ab
V****ns**********
T***************
V × Tnsns**ns**ns***
* Significant at the 0.05 probability level; ** Significant at the 0.01 probability level. ns, not significant. Values in the table means average ± SD. Values in the same column followed by different lowercase letters within different treatments are significantly different at p < 0.05. TS, tillering stage; JS, jointing stage; HS, heading stage; FS. Filling stage; V, variety; T, fertilizer treatment. V1, Baiyan 2; V2, Baiyan 7. T1: Control; T2: Nitrogen fertilizer; T3: Giza Fertile fertilizer; T4: Powder fertilizer.
Table 2. ANOVA analysis of POD, CAT and SOD activity of the leaves of oat plants under different types of fertilizer treatments at different growth stages.
TreatmentSOD (U/g FW/min)POD (U/g FW/min)CAT (U/g FW/min)
TSJSHSFSTSJSHSFSTSJSHSFS
V************ns**********
T***********************
V × T**ns***nsns**ns*nsns**
* Significant at the 0.05 probability level; ** Significant at the 0.01 probability level. ns, not significant. TS, tillering stage; JS, jointing stage; HS, heading stage; FS. Filling stage; V, variety; T, fertilizer treatment.
Table 3. ANOVA analysis content of MDA, Pro, and soluble sugar of oat under different types of fertilizer treatments at different growth stages.
TreatmentMDA (nmol/g FW)Pro (ug/g FW)Soluble Sugar (mg/g DW)
TSJSHSFSTSJSHSFSTSJSHSFS
V****ns*****ns**nsns**ns
T***********************
V × Tnsns**nsnsns****nsnsns**
* Significant at the 0.05 probability level; ** Significant at the 0.01 probability level. ns, not significant. TS, tillering stage; JS, jointing stage; HS, heading stage; FS, Filling stage; V, variety; T, fertilizer treatment.
Table 4. Effect of different types of fertilizer on biomass yield, panicles, spikelets per panicle, grain weight, and grain yield of oat in saline soils.
VarietyFertilizerBiomass YieldPaniclesSpikelets per Grain WeightGrain Yield
(kg ha−1)(×104 ha−1)panicle(mg)(kg ha−1)
V1T16238 ± 108.2 e289.5 ± 2.7 bc25.0 ± 1.0 f21.8 ± 0.58 f1577.6 ± 25.5 e
T27881 ± 344.2 bcd329.1 ± 3.0 a35.0 ± 1.0 ab23.3 ± 0.50 d2680.6 ± 46.1 b
T37530 ± 402.8 cde293.9 ± 6.7 b28.3 ± 1.0 e22.1 ± 0.35 ef1836.2 ± 57.4 d
T47048 ± 426.0 cde331.2 ± 2.1 a32.0 ± 1.5 cd22.7 ± 0.10 de2410.6 ± 225.6 c
V2T16708 ± 188.8 de274.7 ± 1.5 c30.0 ± 0.6 de24.6 ± 0.50 c2029.6 ± 55.9 d
T29992 ± 412.4 a325.3 ± 5.0 a36.7 ± 0.6 a27.6 ± 0.26 a3293.7 ± 46.3 a
T38994 ± 151.2 ab332.0 ± 2.7 a33.3 ± 1.5 bc26.1 ± 0.21 b2888.7 ± 78.5 b
T48230 ± 160.5 bc341.7 ± 7.8 a35.0 ± 1.0 ab26.2 ± 0.25 b3136.8 ± 67.7 a
V**ns******
T**********
V × T****nsnsns
** Significant at the 0.01 probability level. ns, not significant. Values in the table means average ± SD. Values in the same column followed by different lowercase letters within different treatments are significantly different at p < 0.05. V, variety; T, fertilizer treatment. V1, Baiyan 2; V2, Baiyan 7. T1: Control; T2: Nitrogen fertilizer; T3: Giza Fertile fertilizer; T4: Powder fertilizer.
Table 5. Effect of different types of fertilizes on crude fat, crude protein, and crude fiber of oat in saline soils.
VarietyFertilizerCrude Fat
(%)
Crude Protein
(%)
Crude Fiber
(%)
V1T11.35 ± 0.02 d10.27 ± 0.05 d37.44 ± 0.15 a
T21.49 ± 0.02 bc12.56 ± 0.02 ab33.35 ± 0.10 cd
T31.44 ± 0.01 c12.74 ± 0.02 a35.30 ± 0.44 b
T41.55 ± 0.02 b11.59 ± 0.82 bc38.12 ± 0.47 a
V2T11.35 ± 0.02 d10.21 ± 0.03 d38.33 ± 0.09 a
T21.55 ± 0.03 b11.51 ± 0.10 bc32.53 ± 0.25 d
T31.48 ± 0.02 bc11.02 ± 0.13 cd34.78 ± 0.28 bc
T41.66 ± 0.02 a11.93 ± 0.58 abc38.34 ± 0.12 a
Vns***
T******
V × Tnsnsns
* Significant at the 0.05 probability level; ** Significant at the 0.01 probability level. ns, not significant. Values in the table means average ± SD. Values in the same column followed by different lowercase letters within different treatments are significantly different at p < 0.05. V, variety; T, fertilizer treatment. V1, Baiyan 2; V2, Baiyan 7. T1: Control; T2: Nitrogen fertilizer; T3: Giza Fertile fertilizer; T4: Powder fertilizer.
Publisher’s Note: MDPI stays neutral with regard to jurisdictional claims in published maps and institutional affiliations.

