Article

Root Growth and Architecture of Wheat and Brachypodium Vary in Response to Algal Fertilizer in Soil and Solution

1
IBG2- Plant Sciences, Forschungszentrum Jülich GmbH, 52428 Jülich, Germany
2
Institute of Crop Science and Resource Conservation, University of Bonn, 53115 Bonn, Germany
3
School of BioSciences, University of Melbourne, Parkville, VIC 3010, Australia
*
Author to whom correspondence should be addressed.
Agronomy 2022, 12(2), 285; https://doi.org/10.3390/agronomy12020285
Submission received: 12 December 2021 / Revised: 7 January 2022 / Accepted: 19 January 2022 / Published: 23 January 2022
(This article belongs to the Special Issue Improving Nutrient Use Efficiency from Lab to Field)

Abstract

:
Alternative, recycled sources for mined phosphorus (P) fertilizers are needed to sustain future crop growth. Quantification of phenotypic adaptations and performance of plants with a recycled nutrient source is required to identify breeding targets and agronomy practices for new fertilization strategies. In this study, we tested the phenotypic responses of wheat (Triticum aestivum) and its genetic model, Brachypodium (Brachypodium distachyon), to dried algal biomass (with algae or high or low mineral P) under three growing conditions (fabricated ecosystems (EcoFABs), hydroponics, and sand). For both species, algal-grown plants had similar shoot biomass to mineral-grown plants, taking up more P than the low mineral P plants. Root phenotypes however were strongly influenced by nutrient form, especially in soilless conditions. Algae promoted the development of shorter and thicker roots, notably first and second order lateral roots. Root hairs were 21% shorter in Brachypodium, but 24% longer in wheat with algae compared to mineral high P. Our results are encouraging to new recycled fertilization strategies, showing algae is a nutrient source to wheat and Brachypodium. Variation in root phenotypes showed algal biomass is sensed by roots and is taken up at a higher amount per root length than mineral P. These phenotypes can be selected and further adapted in phenotype-based breeding for future renewal agriculture systems.

1. Introduction

Modern agricultural crop production relies heavily on the supply of fertilizers, mostly by employing mineral fertilizer. In the case of phosphorus (P), mineral fertilizer in the form of mined rock phosphate is used, which is a non-renewable resource that is increasing in price. When applied in excess amounts, mineral P enters waterways and then promotes eutrophication of open water bodies. Similar to recent recommendations of the European Union that strongly limit nitrogen (N) fertilization of agricultural land, P will most likely be the next target of this policy. Ideally, all nutrients should be recycled and made available for agricultural crop production. One possibility to save mined P and other resources and to reduce run-off from fields will be to move towards a more circular fertilization and bioeconomy using microalgae as a platform (reviewed in [1]). Algal biomass has come into focus for future renewable agriculture. It is a complex nutrient form compared to mineral fertilizers. Algae can store high amounts of P and N in vacuoles or the cytosol [2]. Crystalline guanine has been recently described as a ubiquitously occurring non-specific N depot among microalgae species [3,4]. Phosphorus can be accumulated and stored in granules in storage bodies in the form of polyphosphate [5], allowing the storage of P in much larger extents than would be necessary for immediate microalgae growth, and thus may serve as a dynamic P-depot [6,7]. Another P storage molecule in algae is myo-inositol-hexakisphosphate, also termed phytate or InsP6, which is also considered a high-abundance phosphate storage compound in vascular plants [8,9]. Phosphorylated forms of phytate have recently been investigated for potential signaling roles in nutrient sensing in algae and higher plants [8,10,11] as well as for their potential roles in plant defense and hormone perception [12,13,14,15].
Algae is a viable source of plant nutrients [16,17]. The unicellular Chlorella vulgaris can act as fertilizer for wheat plants leading to comparable biomass production to mineral fertilization [17]. This fertilization is achieved using either wet or dry algal biomass from germination onwards to the beginning of booting and has been attributed to different forms of P contained in algae which were suggested to be accessible to wheat roots [16]. Indeed, by labeling algae with 33P and analyzing the P isotopes in plants, it was shown that algal P is taken up by soil-grown wheat plants [18]. Algae-provided complex inorganic or organic P forms need to be solubilized and/or mineralized by specialized root functions or microbial activity prior to uptake and hence might have a longer lasting nutritional effect of fertilization compared to phosphate P forms available from mineral fertilizers [16]. Major groups of organic P compounds (e.g., DNA, RNA, ATP) contained in algal cells have been used to fertilize wheat plants and shown to be taken up at comparable rates to mineral fertilizers [19]. The release of mineral P from free polyphosphate in soils depends on their chain length and complexity [20]. Furthermore, Chlorella sp. released increasing amounts of mineral P in soils at a slower rate compared to conventional P fertilizers [21]. Longer lasting fertilizer forms may reduce the risk of nutritional run-off from fields and in turn minimize eutrophication of surrounding ground water.
Wheat (Triticum aestivum, common wheat) is the most widely grown crop world-wide [22]. A challenge for research for the next decades is to double wheat yield by 2050 without causing environmental damage to soils and water systems (International Wheat Yield Partnership). Wheat has complex genetics [23] and a large and complex root system [24]. Brachypodium (Brachypodium distachyon, purple false brome) is a model plant for wheat with a closely related but much smaller genome (272 Mbp, [25]) and a much smaller but similar root development [26] and microbiome [27]. Brachypodium is a unique genetic model for wheat [28], in which variation in root architecture in response to mineral nutrients [29] and water [30] has been identified with phenotyping.
Here, we phenotype the shoots, root architecture, and nutrient uptake of wheat and Brachypodium in response to an algal nutrient supply and two levels of mineral P in three simplified growth systems, thus generating information on the availability and subsequent uptake of these nutrients and the involvement of the plants and their root systems. Our aim is to better understand the mechanisms underlying the uptake of nutrients from a complex source such as algae, for future adaptive breeding and more sustainable agronomy strategies. The first step is a thorough understanding of the ability of plants to grow on algal biomass under different growth conditions, here addressed using different growth systems allowing detailed phenotypic analyses. We hypothesize, first, that wheat and Brachypodium would be able to mobilize and take up nutrients from algae and, second, that the root architecture of both species may vary in response to the nutrient form and growing media with or without soil.

2. Materials and Methods
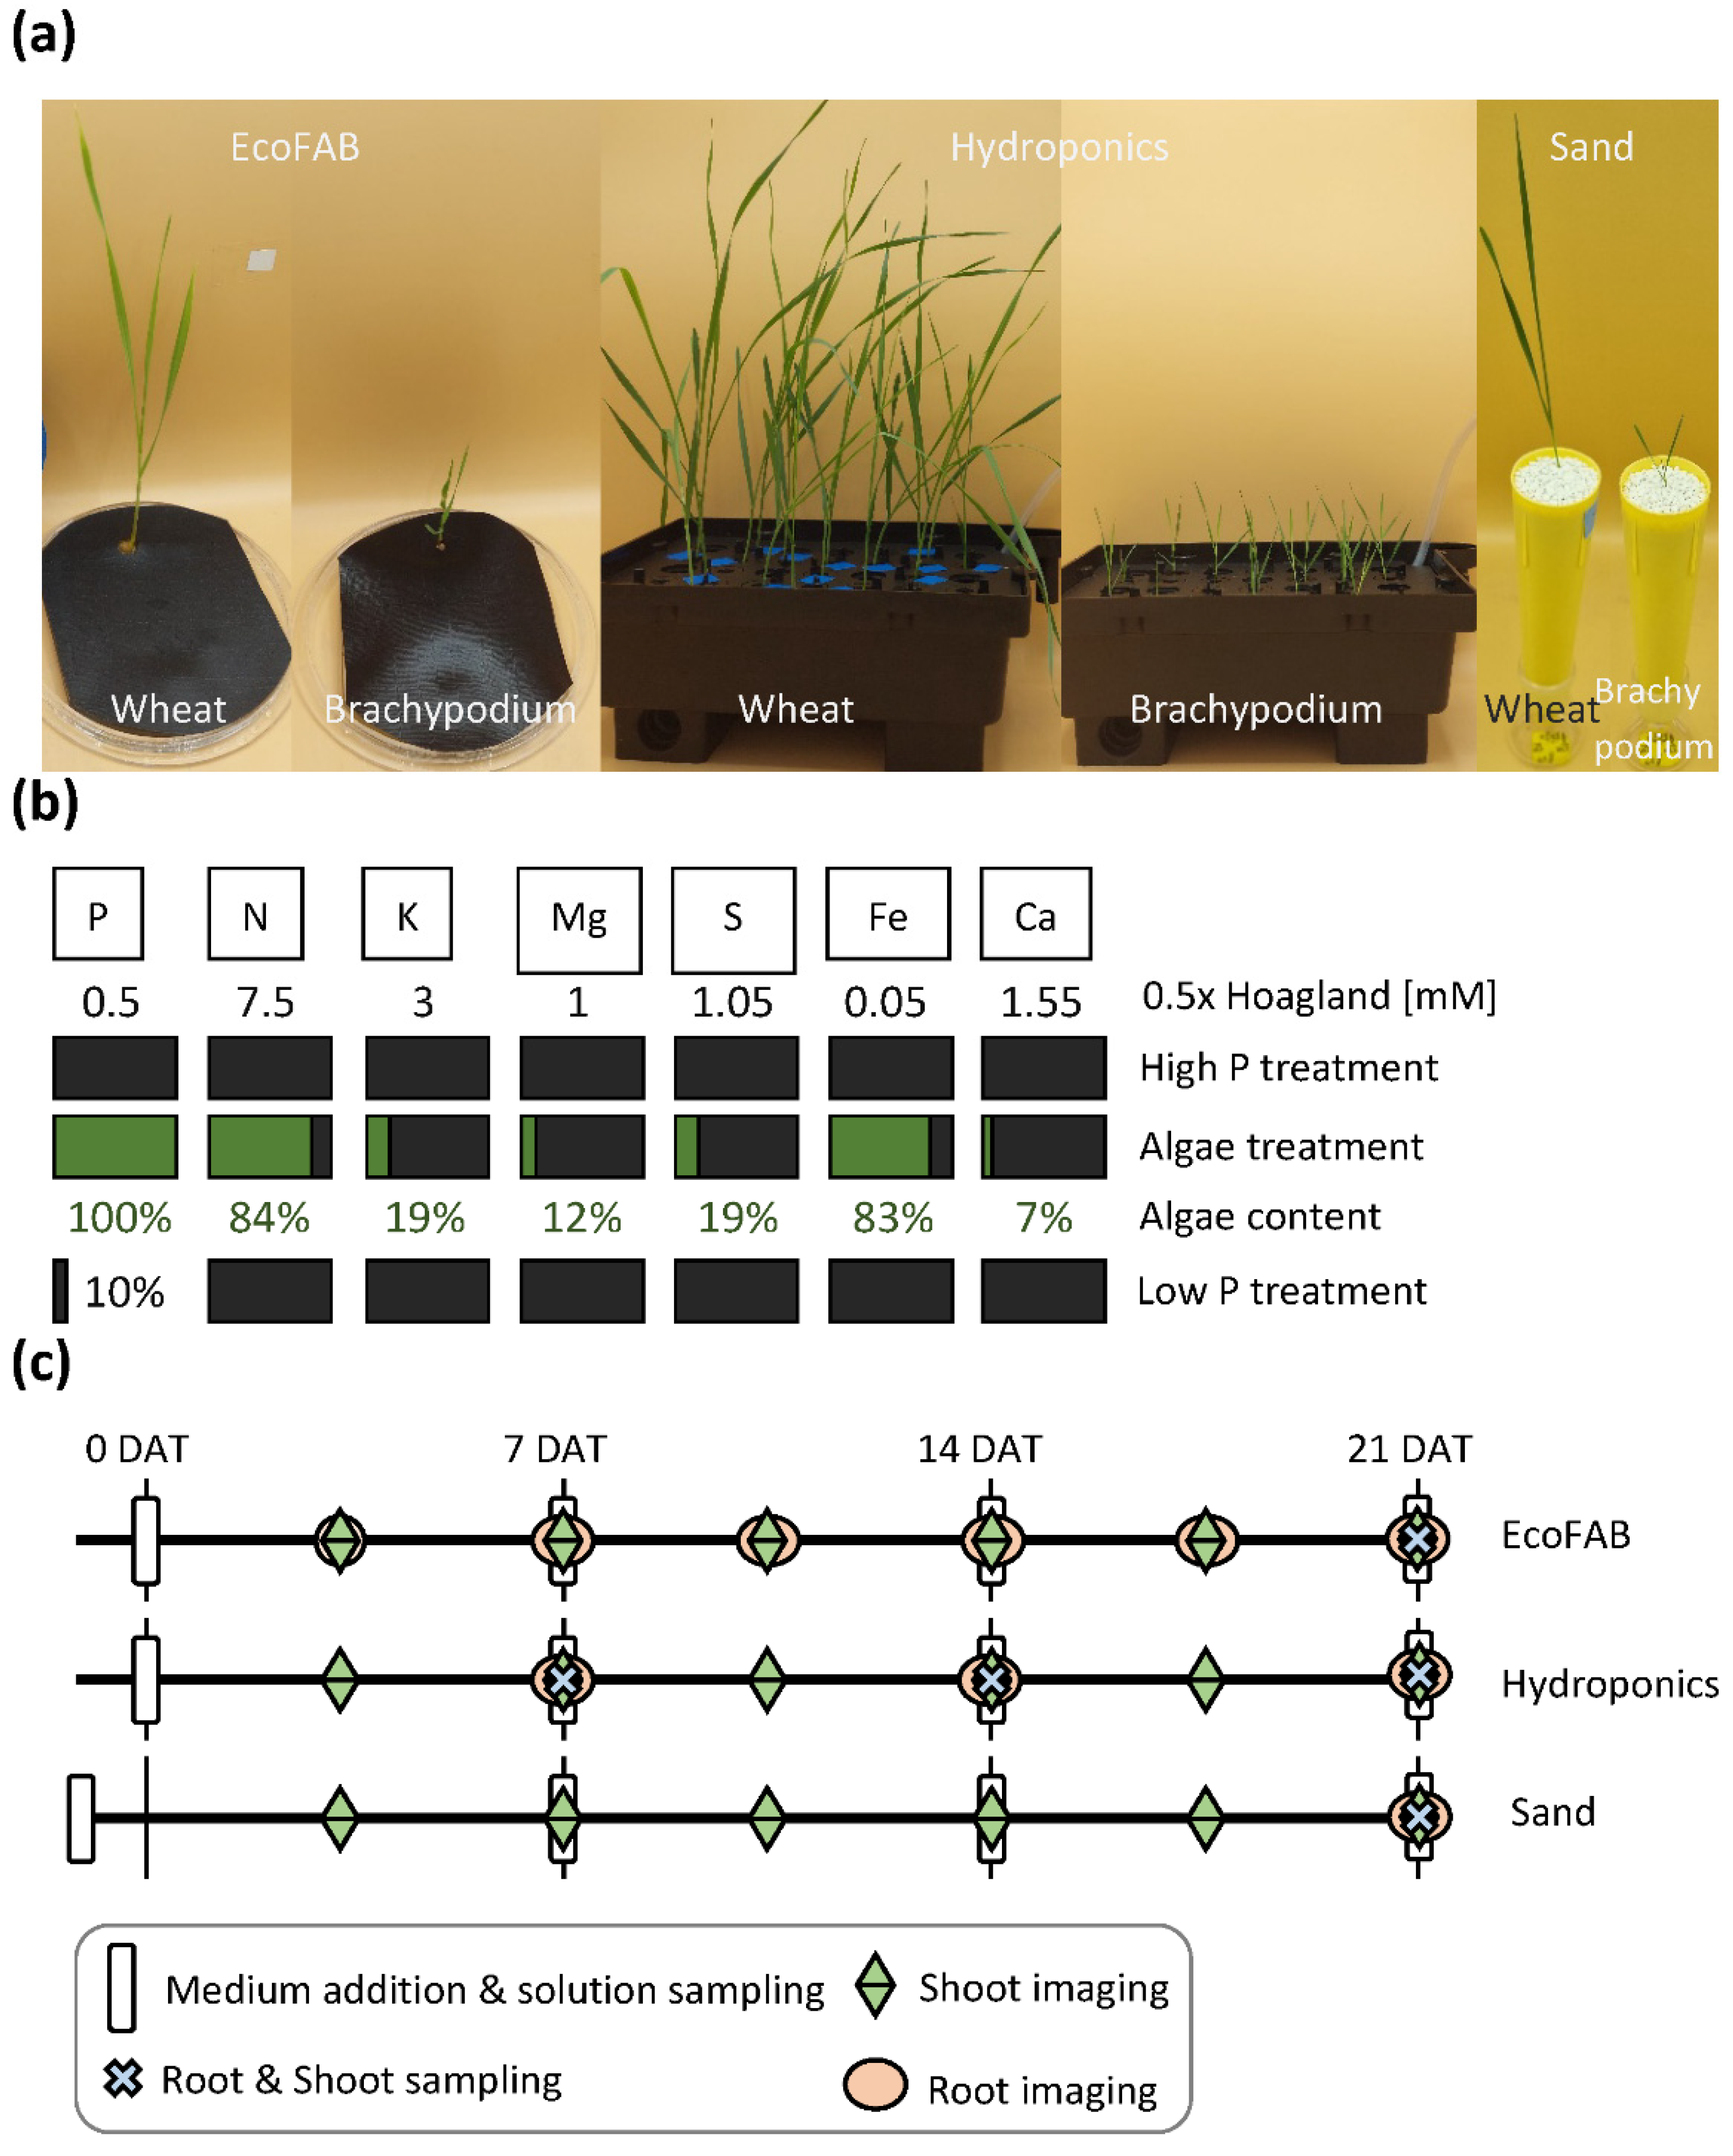
2.1. Plant Material

Brachypodium distachyon (Bd21-3) and Triticum aestivum (cv. Cadenza; provided by C. Uauy, John Innes Centre, Norwich, UK) seeds were treated with 70% ethanol for 30 s (wheat 5 min), rinsed with distilled water, surface sterilized using 6% NaOCl (wheat 10%) 0.01% Triton-X-100 for 5 min (wheat 15 min), and washed repeatedly with water. These sterilized seeds were either directly seeded in sand or pre-germinated (6 °C, dark) in moist filter paper in a micropore tape-sealed petri dish. Wheat seeds were transferred to either EcoFAB or hydroponic system (Araponics, Liege, Belgium) growth systems three days after sowing (DAS) (wheat 1 DAS).

2.2. Experimental Setups and Growth Conditions

The experiments were performed in three setups: (i) in sterile, highly controllable EcoFABs adapted to wheat, (ii) in a hydroponic system, and (iii) in small, sand-filled containers. All experimental setups were set to a 16 h and 22 °C day (with 150 µE/m2s PAR (photosynthetically active radiation)) and 8 h, 20 °C night (dark), with a general relative humidity of 50%. Sand and hydroponics systems were in a greenhouse growth chamber, while the EcoFABs were grown in a laboratory growth cabinet (AR-22L1pLED, Percival, Perry, IA, USA). Following germination (sand) or transfer (Hydroponics, EcoFAB), plants were kept for 21 days after transfer (DAT) with non-invasive phenotyping before final, invasive harvest. The hydroponic system allowed for more plants per replicate and included additional invasive harvests at 7 and 14 DAT. Sand and EcoFAB experiments were run with five replicates per treatment and hydroponics with three boxes per treatment (21 plants per box). All replicates were sorted in randomized block design.

2.2.1. Nutrient Treatments

In all three experimental setups, three treatments were imposed: (1) full mineral nutrition using 0.5× Hoagland [31] (‘High P’); (2) algal nutrition (Chlorella vulgaris powder, Algomed, Klötze; supplemented with additional mineral elements to match high P) normalized using P (‘Algae’); and (3) mineral nutrition of 0.5× Hoagland with 0.05× P level (‘Low P’). Elemental comparison of all treatments (Figure 1b) and full media compositions are summarized (Supplemental Table S1). For pH stability and comparability between treatments 6 mM MES buffer (2-(N-morpholino)ethanesulfonic acid buffer) was added to all treatments. pH measurements in hydroponics are represented in Supplementary Figure S1. Over the three weeks of experimental time each plant received 0.39 mg, 5.27 mg, or 0.31 mg P when grown in EcoFABs, hydroponics, or sand, respectively.

2.2.2. EcoFAB

The EcoFABs were adapted from a published system [32] with the following adaptations. The total containable solution volume was increased to 8.5 cm3 by 3D printing larger casting molds using photopolymer (methyl methacrylate (MMA) (RS-F2-GPCL-04), formlabs, Berlin) (Figure 1a). A total of 33 g PDMS (polydimethylsiloxane, Dow Sylgard 184 Silicon encapsulant clear, DOWchemical, Midland, MI, USA) 1:10 mixture was solidified at 75 °C for 30 min and cured for 3.5 h. Custom made microscope slides were made from borosilicate glass as bottom. Plasma bonding was performed for 30 s in a plasma oven (Femto basic unit c, Diener electronic, Ebhausen, Germany) and sealed for 10 min at 80 °C. Covers (for root shading during growth) were cut from pond liner (black polyvinyl chloride (PVC)), and EcoFABs and covers were sterilized with 70% ethanol for 30 min and dried overnight on a clean bench followed by UV light treatment for 1 h. Larger outer container boxes were prepared from plexiglas (poly methyl methacylate (PMMA)). Following previous EcoFAB protocols [33] the nutrient solutions were replaced every seven days and additional water was added to account for evaporation when necessary. EcoFAB sterility was monitored at 3.5, 10.5, and 17.5 DAT by incubating 5 µL of solution at 37 °C on LB agar plates overnight. EcoFABs that showed clear signs of fungal contamination were removed from the experiment.

2.2.3. Hydroponics

For the hydroponics experiment, containers of 18 × 24 × 7 cm size with lids equipped for 5 × 7 seedlings were used (Araponics, Liege, Belgium). For sterility, containers were incubated with 1% HCl (w/v) for 30 min and then rinsed with distilled water, 70% ethanol, and finally distilled water. For air supply, an aeration system was designed: each hydroponic box was equipped with a tube (diameter 4.6 mm, GARDENA Manufacturing GmbH, Ulm, Germany) connected with a Y connector (6 mm diameter, GEKA, Baknang, Germany) to form a loop with the Y connector placed in a corner. Along the tube length in each box, 7 holes with 2.5 cm spacing were made with a 1 mm needle. Three hydroponics boxes were connected to one pond pump (PondOxi, JBL GmbH & Co. KG, Neuhofen, Germany) with a constant airflow of 200 lh−1. Each container was filled with 1.3 L of the corresponding nutrient solution. Every seven days the nutrient solutions were exchanged while water loss was countered via addition of water-to-weight daily.

2.2.4. Sand

The sand (quartz sand 0.71–1.4 mm grain size, Quarzwerke Witterschlick, Alfter, Germany) was washed thoroughly overnight in deionized water and dried for 24 h at 60 °C. The dried sand was mixed with each growth medium at 0.055 mL per g of sand and incubated overnight before cone filling. Next, 212 g of treated sand was added per cone (3.75 cm diameter, 20.6 cm high; Ray Leach super cell UV ‘Cone-tainer’, Stuewe & Sons Inc., Tangent, OR, USA) on top of a cotton ball plug. Following direct seeding (3 seeds per cone) the wet sand was covered with white granules (polyethylene (PE), RAL9010, Macomass Verkaufs AG, Wallisellen, Switzerland) to reduce evaporation, and the cones were covered with see-through plastic wrap attached via wire until germination. After emergence, the plastic wrap was removed and the seedlings were thinned down to one seedling per cone. The cones were watered with 4 mL of distilled water daily. Seven and 14 DAT nutrient solution was added amounting to 20 mL of 0.5× Hoagland in total.

2.3. Measurements

An overview of all non-invasive and invasive measurements is presented in Figure 1c.

2.3.1. Non-Invasive Phenotyping

For all three experimental setups, non-invasive shoot images were taken over the entire experimental time twice a week with a standard smartphone (camera with 12.2 Mpx; 4272 × 2848 px) from 3 different angles. The projected leaf area was determined via color segmentation with the Color Segmentation software [34]. In the EcoFAB setup, roots were imaged twice per week using a scanner (Expression 10000XL, Epson, Suwa-shi, Nagano, Japan) at 600 dpi and root length was analyzed with WinRhizo (WinRhizo Pro 2017a, Regent Instruments Inc., Quebec, QC, Canada). Hydroponics and EcoFAB setups allowed nutrient solution sampling once a week, prior to the replacement of nutrient solution.

2.3.2. Invasive Phenotyping

At 21 DAT, all plants were destructively harvested. First, the shoot was cut and fresh weight determined, followed by leaf scanning at 600 dpi (Expression 1680, Epson, Suwa-shi, Nagano, Japan) and leaf area determination using WinRhizo software (WinRhizo Reg 2013e, Regent Instruments Inc., Quebec, QC, Canada) before shoots were dried for >7 days for dry weight measurement at 65 °C. Fresh weights of the cut roots were measured before the longest seminal root, and if present, the longest crown root was transferred to microscopy. Using a stereomicroscope (MX12.5, Leica Camera, Wetzlar, Germany), three images per root type (seminal, crown, 1st order lateral, 2nd order lateral root; differentiation zone) were taken for root diameter and root hair length (10 per image) determination via Image J (FIJI) according to [35]. The whole root systems were scanned at 600 dpi (Expression 12000XL, Epson) for root length determination via WinRhizo (WinRhizo Pro 2020a, Regent Instruments Inc., Quebec, QC, Canada) employing the diameter classification identified earlier. Last, the roots were dried at 65 °C for dry weight determination.

2.3.3. Nutrient Content Determination

Shoot and root dry material of all three experimental setups was used for nutrient determination via ICP-OES (inductively coupled plasma-optical emission spectrometry, iCAP 6500, Thermo Scientific, Dreieich, Germany) or elemental analyzer (Vario EL cube, Elementar Analysensysteme GmbH, Langenselbold, Germany). The ground plant material was treated with 2 mL HNO3 (65%) and 1 mL H2O2 (30%) and digested for 3 min at 200 °C in a microwave. Measurements were conducted on two separate dilutions per sample. All Brachypodium replicate samples and several of the wheat samples had to be pooled in order to reach the minimal analysis amount (20 mg dry tissue).
Polyphosphate determination in algal biomass was performed via TiO2 beads and PAGE (polyacrylamide gel electrophoresis) separation based on established protocols [11,36]. To avoid TiO2 bead saturation during extraction, 2 technical replicates of 0.5 mg, 1.0 mg, 2.0 mg, 4.0 mg, 8.0 mg, and 16.0 mg of algal biomass were used to determine the “maximum” weight possible for optimal loading of 20 mg TiO2 beads (titanium (IV) oxide, rutile, Sigma Aldrich). Briefly, 20 mg of TiO2 beads were washed with water followed by 1 M ice-cold perchloric acid (PA). Dry algal biomass was resuspended with 1 mL of 1 M ice-cold PA by vortexing for 30 s and then kept on ice for 10 min with 3 short, intermediate rounds of vortexing of 5 s each followed by centrifugation for 10 min at 19,083× g at 4 °C. The supernatant was centrifuged for 5 min at 19,083× g at 4 °C and then added to the prewashed TiO2 beads and resuspended by pipetting. The mixture was rotated for 45 min on a rotation wheel at 4 °C, centrifuged for 1 min at 8000× g at 4 °C, and the TiO2 beads were washed twice with 500 µL 1 M PA. For elution, 200 µL of 10% ammonium hydroxide was added to the beads, rotated for 5 min on a rotation wheel at room temperature (Rt), and centrifuged for 1 min at 8000× g at Rt. The elution step was repeated (400 µL in total). The eluted samples were SpeedVac dried for 2:30 h at 45 °C. For polyphosphate visualization, the SpeedVac-dried samples were frozen in liquid N2 and solved with 20 µL of water at 400 rpm for 1 h at 40 °C. An equal sample mass (equaling 1.0 mg algal biomass input, e.g., ¼ of the 4.0 mg, etc., except for the 0.5 mg sample) was loaded on 33% PAGE with 7 µL of 6× orange G dye, and visualized with toluidine blue staining, followed by DAPI (4′,6-diamidino-2-phenylindole) staining according to the previous protocols [13,36,37].
ICP-MS (inductively coupled plasma-mass spectrometry, 7900 ICP-MS, Agilent) analysis was done from additionally purified samples and the initial amount of algal powder to express the highly anionic polyphosphates purified with this method relative to the total phosphate from the algal biomass. The measurements were conducted after a microwave-assisted digestion in H2O2:HCl (0.25 mL 30%:1 mL 30%) that was heated to 160 °C for 15 min after 20 min of warming up. The diluted samples were measured in three technical replicates.
Sequential phosphate extraction was conducted following the protocol of [38], adapted to algal biomass by reducing the extracted material to 50 mg and the used extraction volume to 1.8 mL. The extraction steps were conducted sequentially on sample duplicates.

2.4. Statistical Analyses

Raw data summary and sorting as well as graph preparation was performed in Excel (Office 2019, Microsoft) while statistical analyses were done using the software R (RStudio version 1.2.5019, CRAN). Statistical differences were tested using one-way ANOVA with Tukey HSD as a post hoc test.

3. Results

3.1. Wheat and Brachypodium Took Up P from Algal Biomass

In order to increase the robustness of our investigation, we grew each species in three growth systems in parallel for three weeks. Brachypodium and wheat plants were grown to observe their growth responses when supplied either with high or low P mineral nutrition (0.5× Hoagland) or algae biomass (Figure 1). While wheat inherently produced ~10× more biomass compared to Brachypodium, both developed comparably well in all treatments over 21 DAT with most significant differences found in the hydroponics experiment (Figure 2).
Brachypodium plants in EcoFABs produced their highest leaf area and biomass when grown with high P, leading to a significantly larger leaf area over both algae and low P treatment. In hydroponics, no difference was found between the leaf area of high and low P treatment, while algae-grown plants had smaller leaves and shorter roots, but the same biomass. Sand-grown Brachypodium plants supplied with algae biomass had significantly larger leaves and roots compared to low P treatment and were comparable to high P-treated plants (Figure 2a–c).
Wheat plants showed a different growth response to the nutrient treatments. Grown in EcoFABs, wheat plants did not differ among the nutrient treatments, except in root biomass between high P and algae-grown plants. The largest wheat plants (leaf area, root length, and biomass) were found in hydroponically grown plants, with the high P treatment leading to the largest shoots, while low P caused the longest roots, and algae treated plants had significantly smaller leaves, shorter roots, and less shoot biomass. In sand we saw no differences in the shoot leaf area for wheat, while the root showed a trend similar to Brachypodium, with algae treated plants having the longest root length (Figure 2d–f).
Measuring elemental composition in roots and shoots allowed further insights into the nutrient uptake of Brachypodium (Table 1) and wheat (Table 2). Due to the dry tissue requirements, roots and shoots could be measured separately only for EcoFAB-grown plants, while in hydroponics and sand whole Brachypodium plants were analyzed. In EcoFABs, Brachypodium grown with algae reached P concentrations between 73% and 100% of those grown with high P nutrition, while low P-fertilized plants only contained ~20% of the high P concentrations (Table 1). Brachypodium plants grown in hydroponics reached higher P concentrations in algae and low P solutions compared to the high P-treated plants but were overall very small. Sand-grown Brachypodium had decreasing P concentrations from high P, over algae, to low P nutrition. N concentrations on the other hand were comparable between high and low P while algae-fertilized plants contained less N when grown in EcoFABs and similar concentrations when grown in hydroponics or sand (Table 1).
Wheat, being a larger plant, allowed separate analysis of roots and shoots in addition to whole plant measurements (Table 2). In line with the biomass measurements, wheat plants had higher P concentrations and total P when grown in hydroponics compared to growth in EcoFABs as well as sand. Furthermore, high P fertilized wheat plants contained more P than the algae fertilized plants, but those in turn contained higher amounts and concentrations of P compared to low P-treated wheat plants (Table 2). N concentrations were comparable for wheat plants grown in high and low P in EcoFABs, while in hydroponics the N concentrations decreased from high P over algae to low P treatment, and sand-grown plants had comparable and higher N concentrations in high P and algae plants compared to low P treated wheat (Table 2).

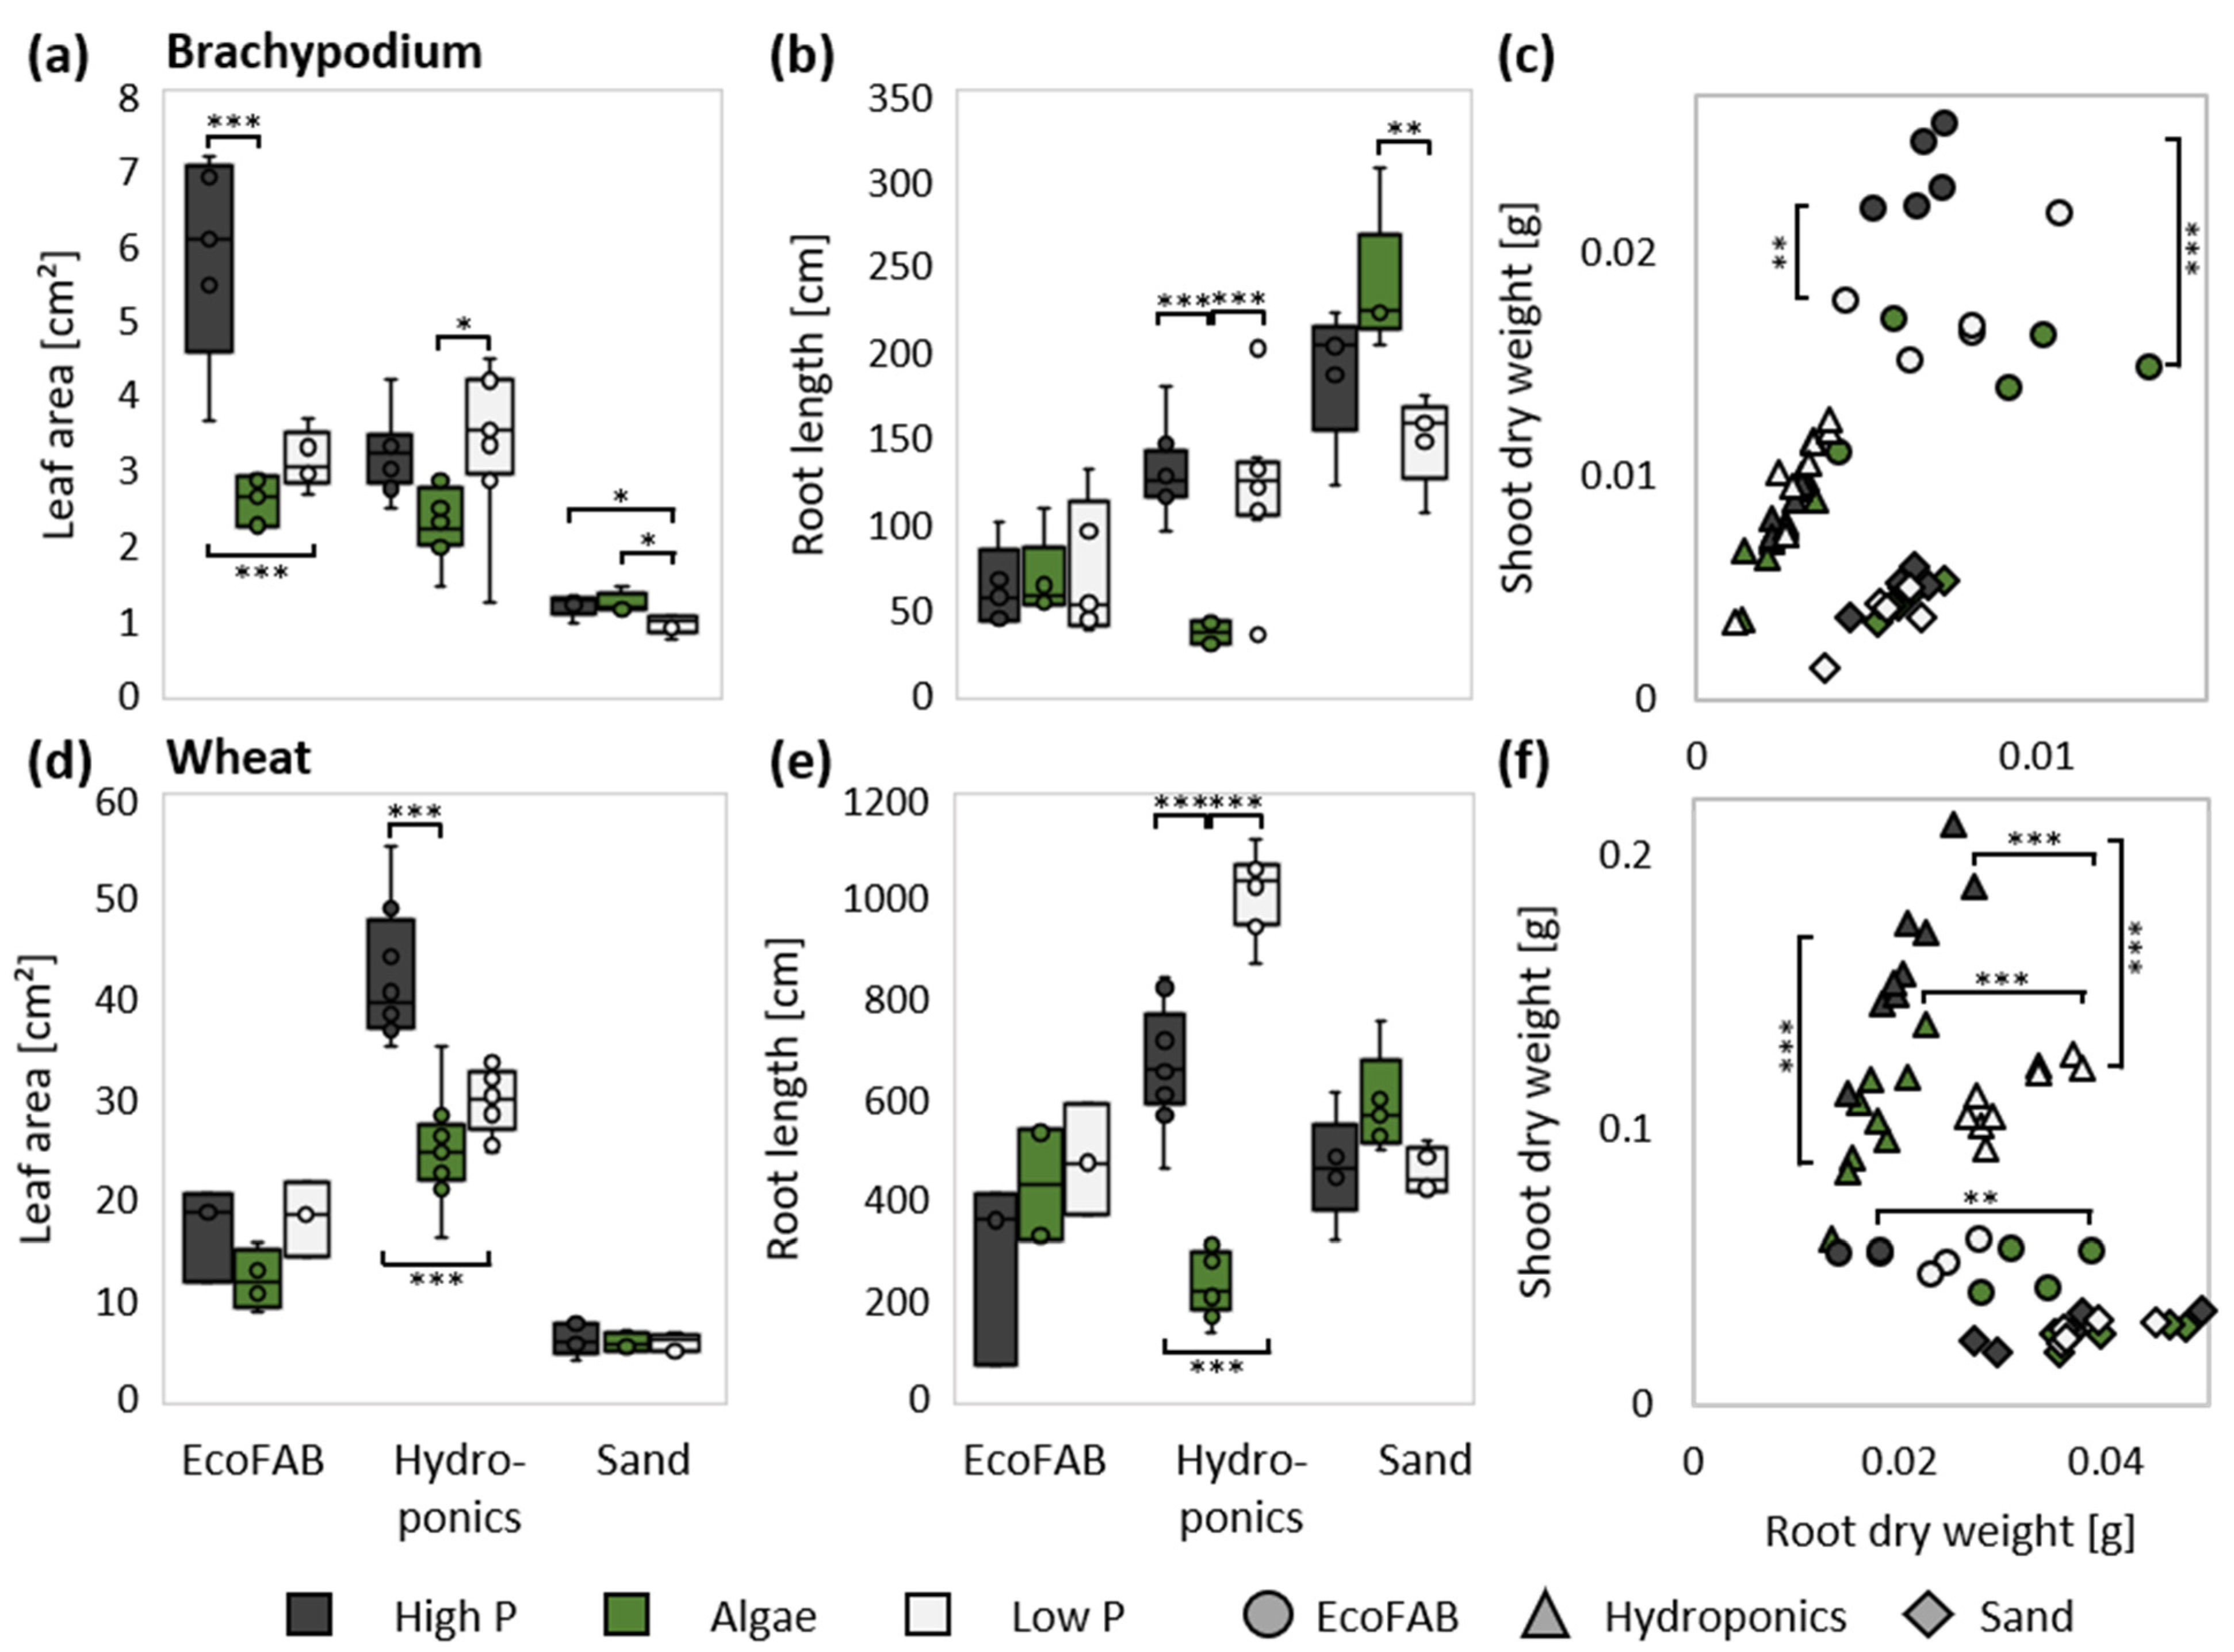
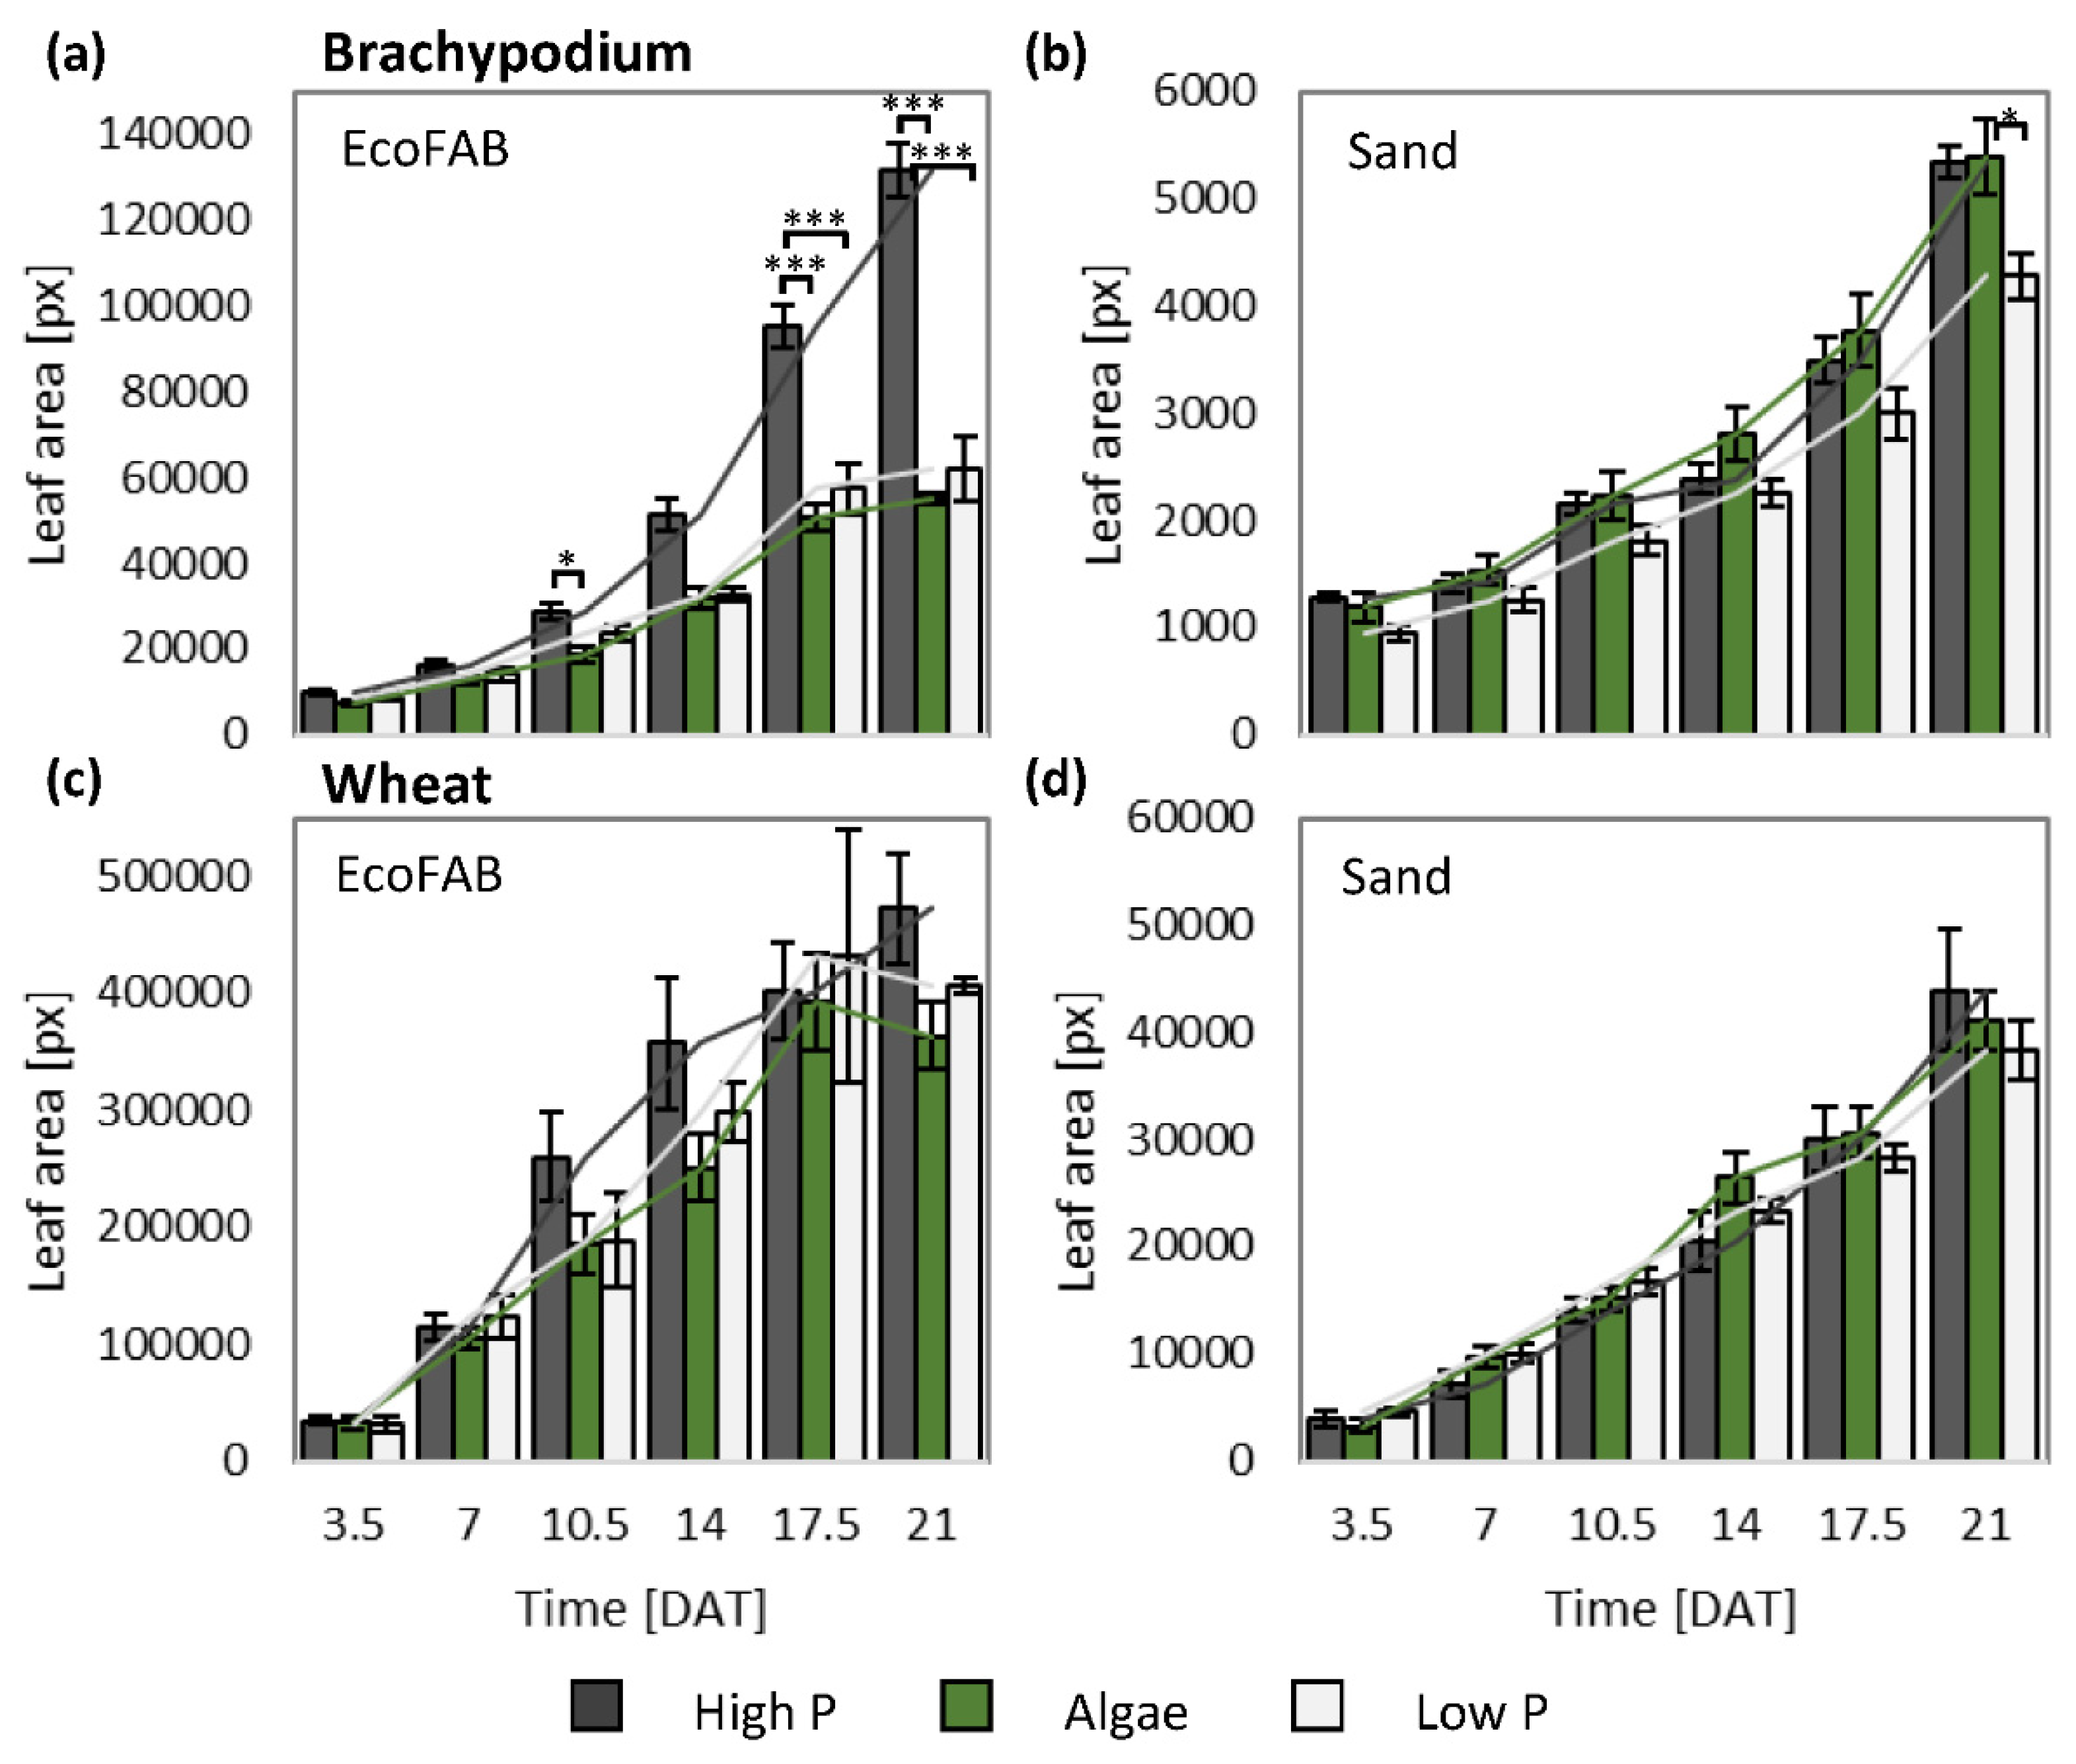
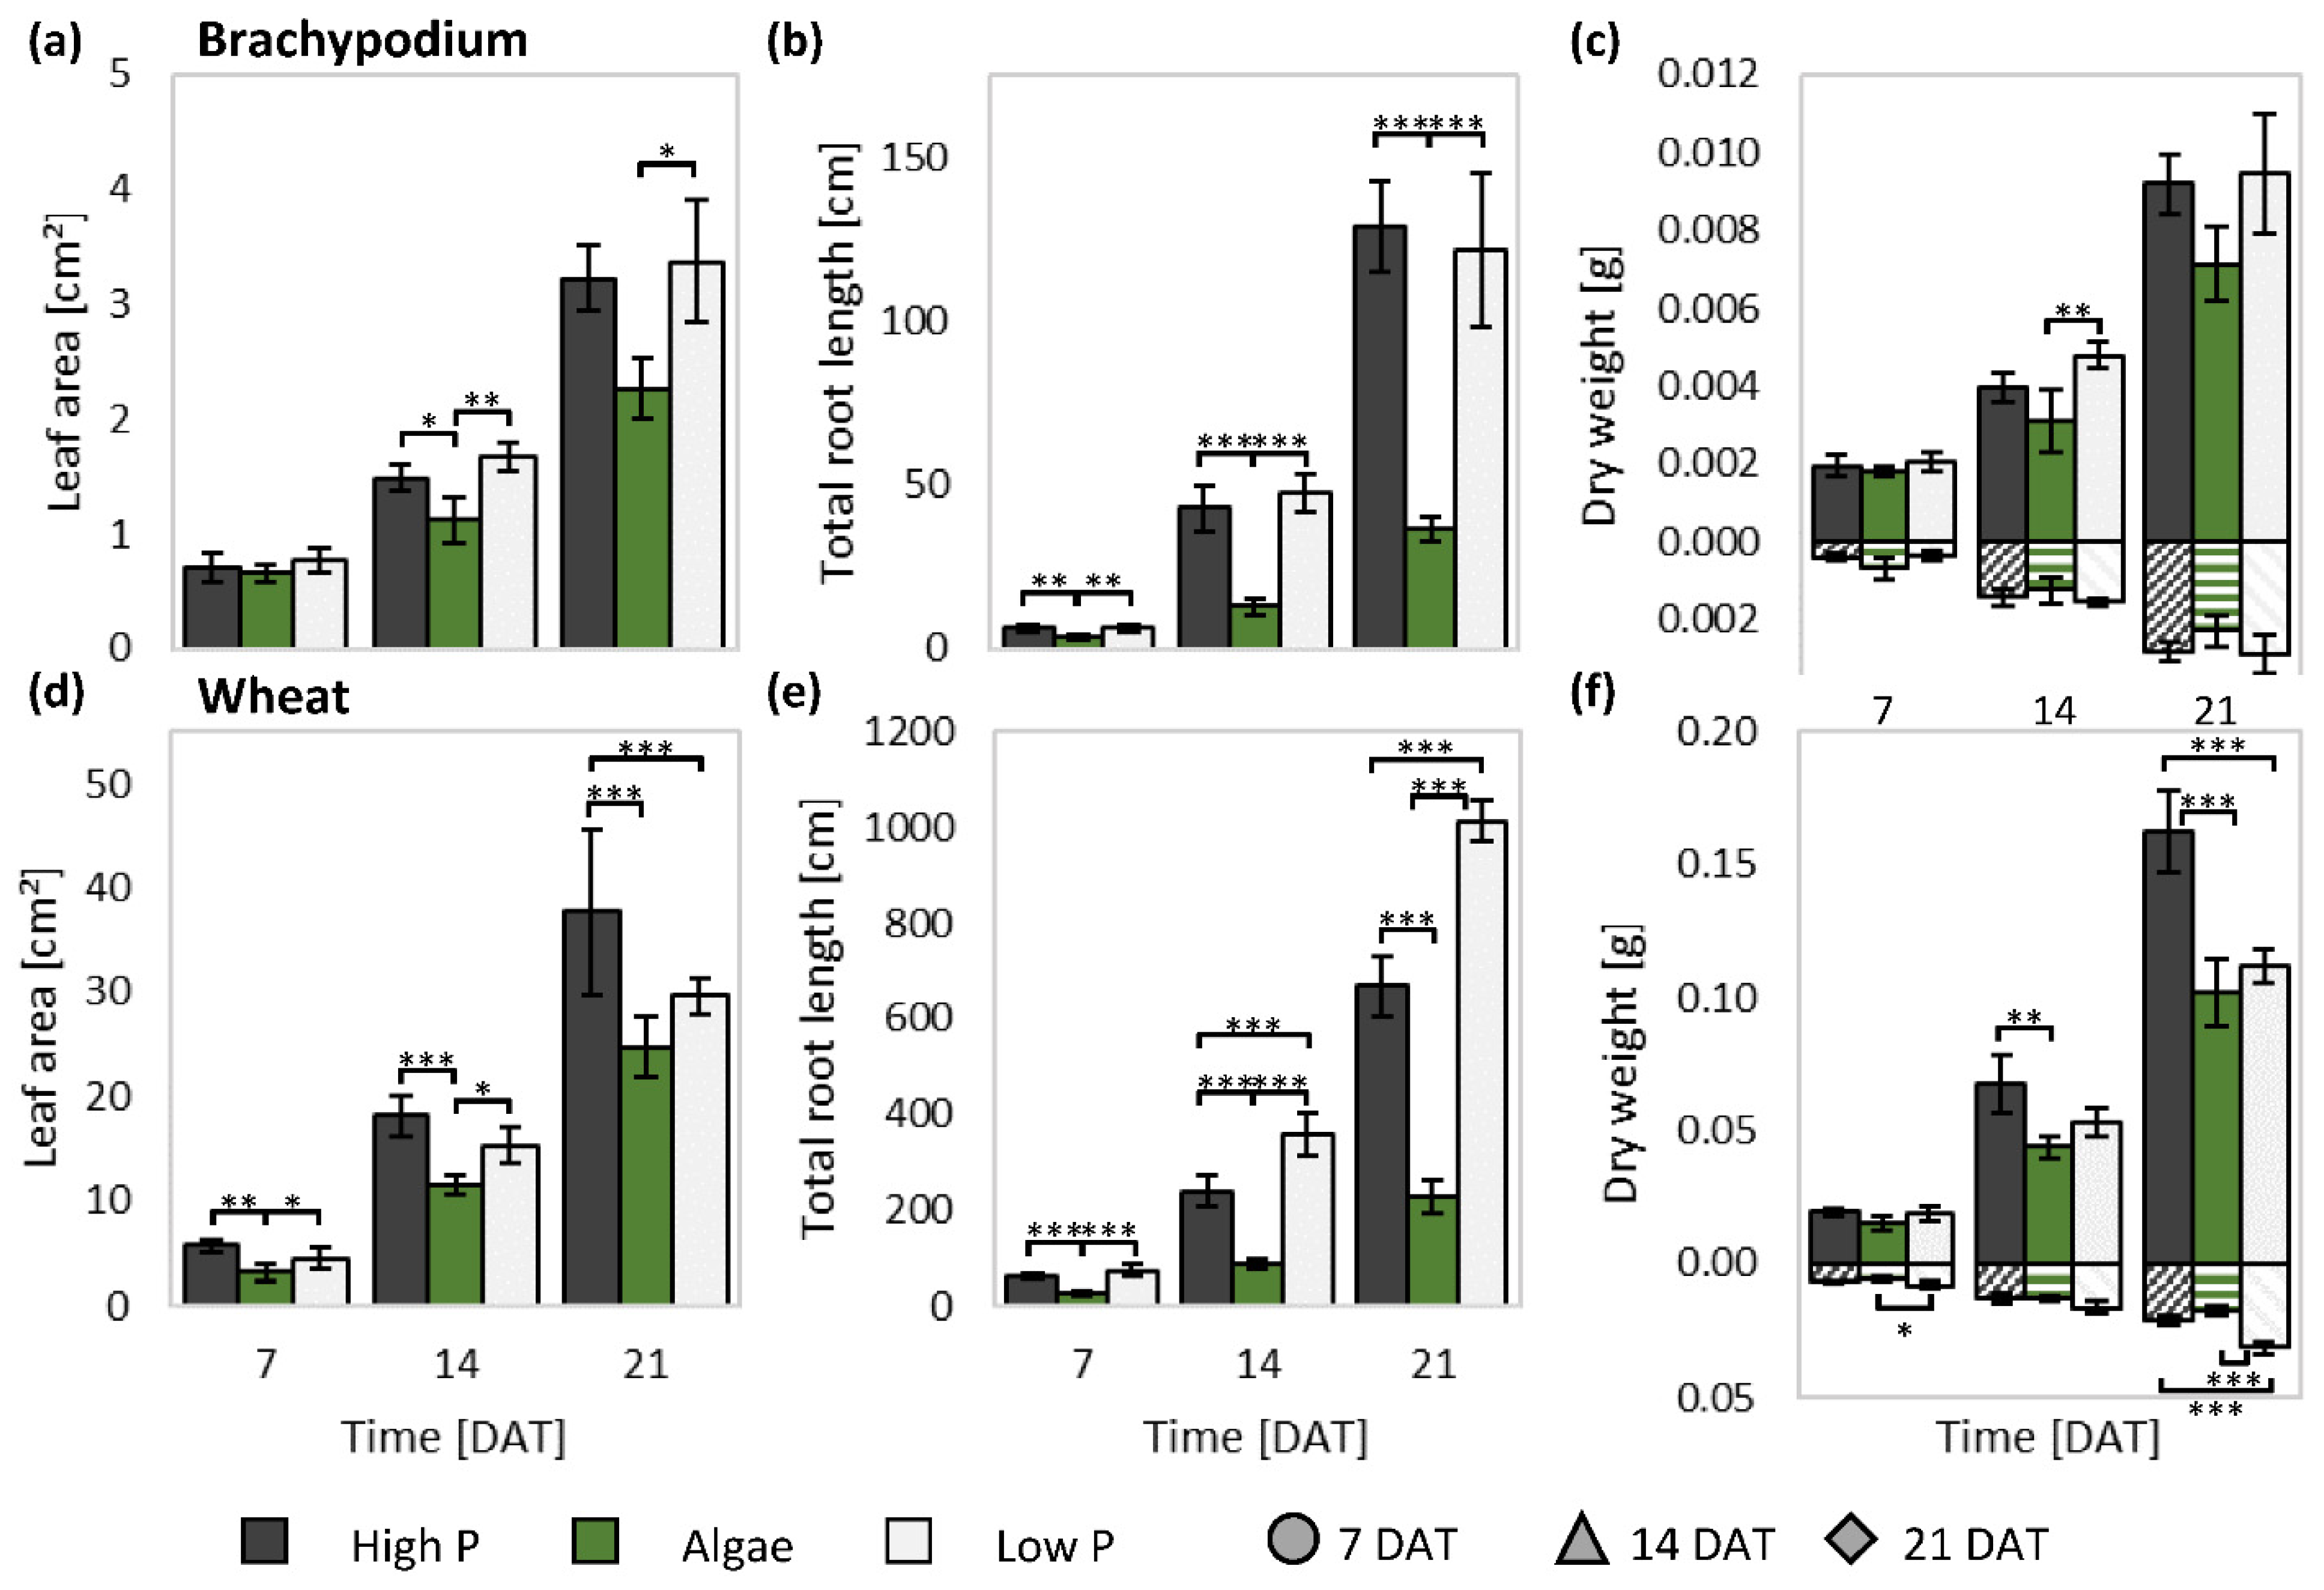
3.2. Non-Invasive and Invasive Measurements Allowed Dynamic Phenotyping

To map shoot growth dynamically, we determined non-invasively the projected leaf area throughout the experimental time (Figure 3, Supplemental Figure S2). The projected leaf area determined using non-invasive images during experimental growth and the destructively measured leaf area at harvest had high correlations (R2 between 0.92–0.97). In EcoFABs the trends observed invasively at harvest at 21 DAT (Figure 2) became visible already at 10 DAT with high P-supplied plants forming a larger leaf area compared to the other two treatments for both Brachypodium and wheat (Figure 3). Hydroponically-grown Brachypodium plants had no significantly different growth until 14 DAT (Supplemental Figure S2a), while the wheat projected leaf area started to differ at 7 DAT (Supplemental Figure S2d). Brachypodium plants grown in sand showed the first differences at the first imaging time point, 3 DAT, with low P treatment leading to significantly reduced projected leaf area at 21 DAT, while algae and high P treated plants had equal values (Figure 3). Sand-grown wheat plants had very similar trajectories, showing only slight differences decreasing from high P over algae to low P treatment at 21 DAT.
The hydroponics experiment allowed 21 plants to be grown per replicate and therefore enabled additional invasive measurements at 7, 14, and 21 DAT (Figure 1c) identifying leaf area, root length, and root and shoot biomass (Figure 4). Brachypodium plants supplied with high P did not differ from those supplied with low P at all measurement time points, but both differed from the algae treatment. At 7 DAT, algae-treated Brachypodium plants had significantly shorter roots, compared to low P- and high P-treated plants. At 14 DAT leaf area, root length, and shoot biomass were lower in algae-treated Brachypodium, and this was true for leaf area and root length at 21 DAT too (Figure 4). Brachypodium root biomass followed a similar trend as the shoot biomass, but the treatments did not significantly differ from each other, which was surprising given the difference in length.
Wheat plants had a somewhat different response to the nutrient treatments. While high P-treated plants had a greater leaf area than algae and low P-treated plants already at 7 DAT, shoot biomass significantly increased only at 14 DAT. Both leaf area and biomass of high P wheat had significantly higher values 21 DAT (Figure 4). Wheat root length was greatest in the low P treatment, and at 7 and 21 DAT the low P wheat roots had the highest biomass. Interestingly, there was no significant difference in the biomass of high P and algae-treated wheat roots, even though at all three time points the high P wheat roots were longer than the algae-treated roots. Plotting the root vs shoot dry weight through time showed that Brachypodium invested almost equally in roots and shoots in all treatments and in all growth systems (Supplementary Figure S2b). On the other hand, low P wheat showed larger investment in root biomass, whereas algae and high P wheat plants invest in roots and shoots similarly to Brachypodium (Supplementary Figure S2e).

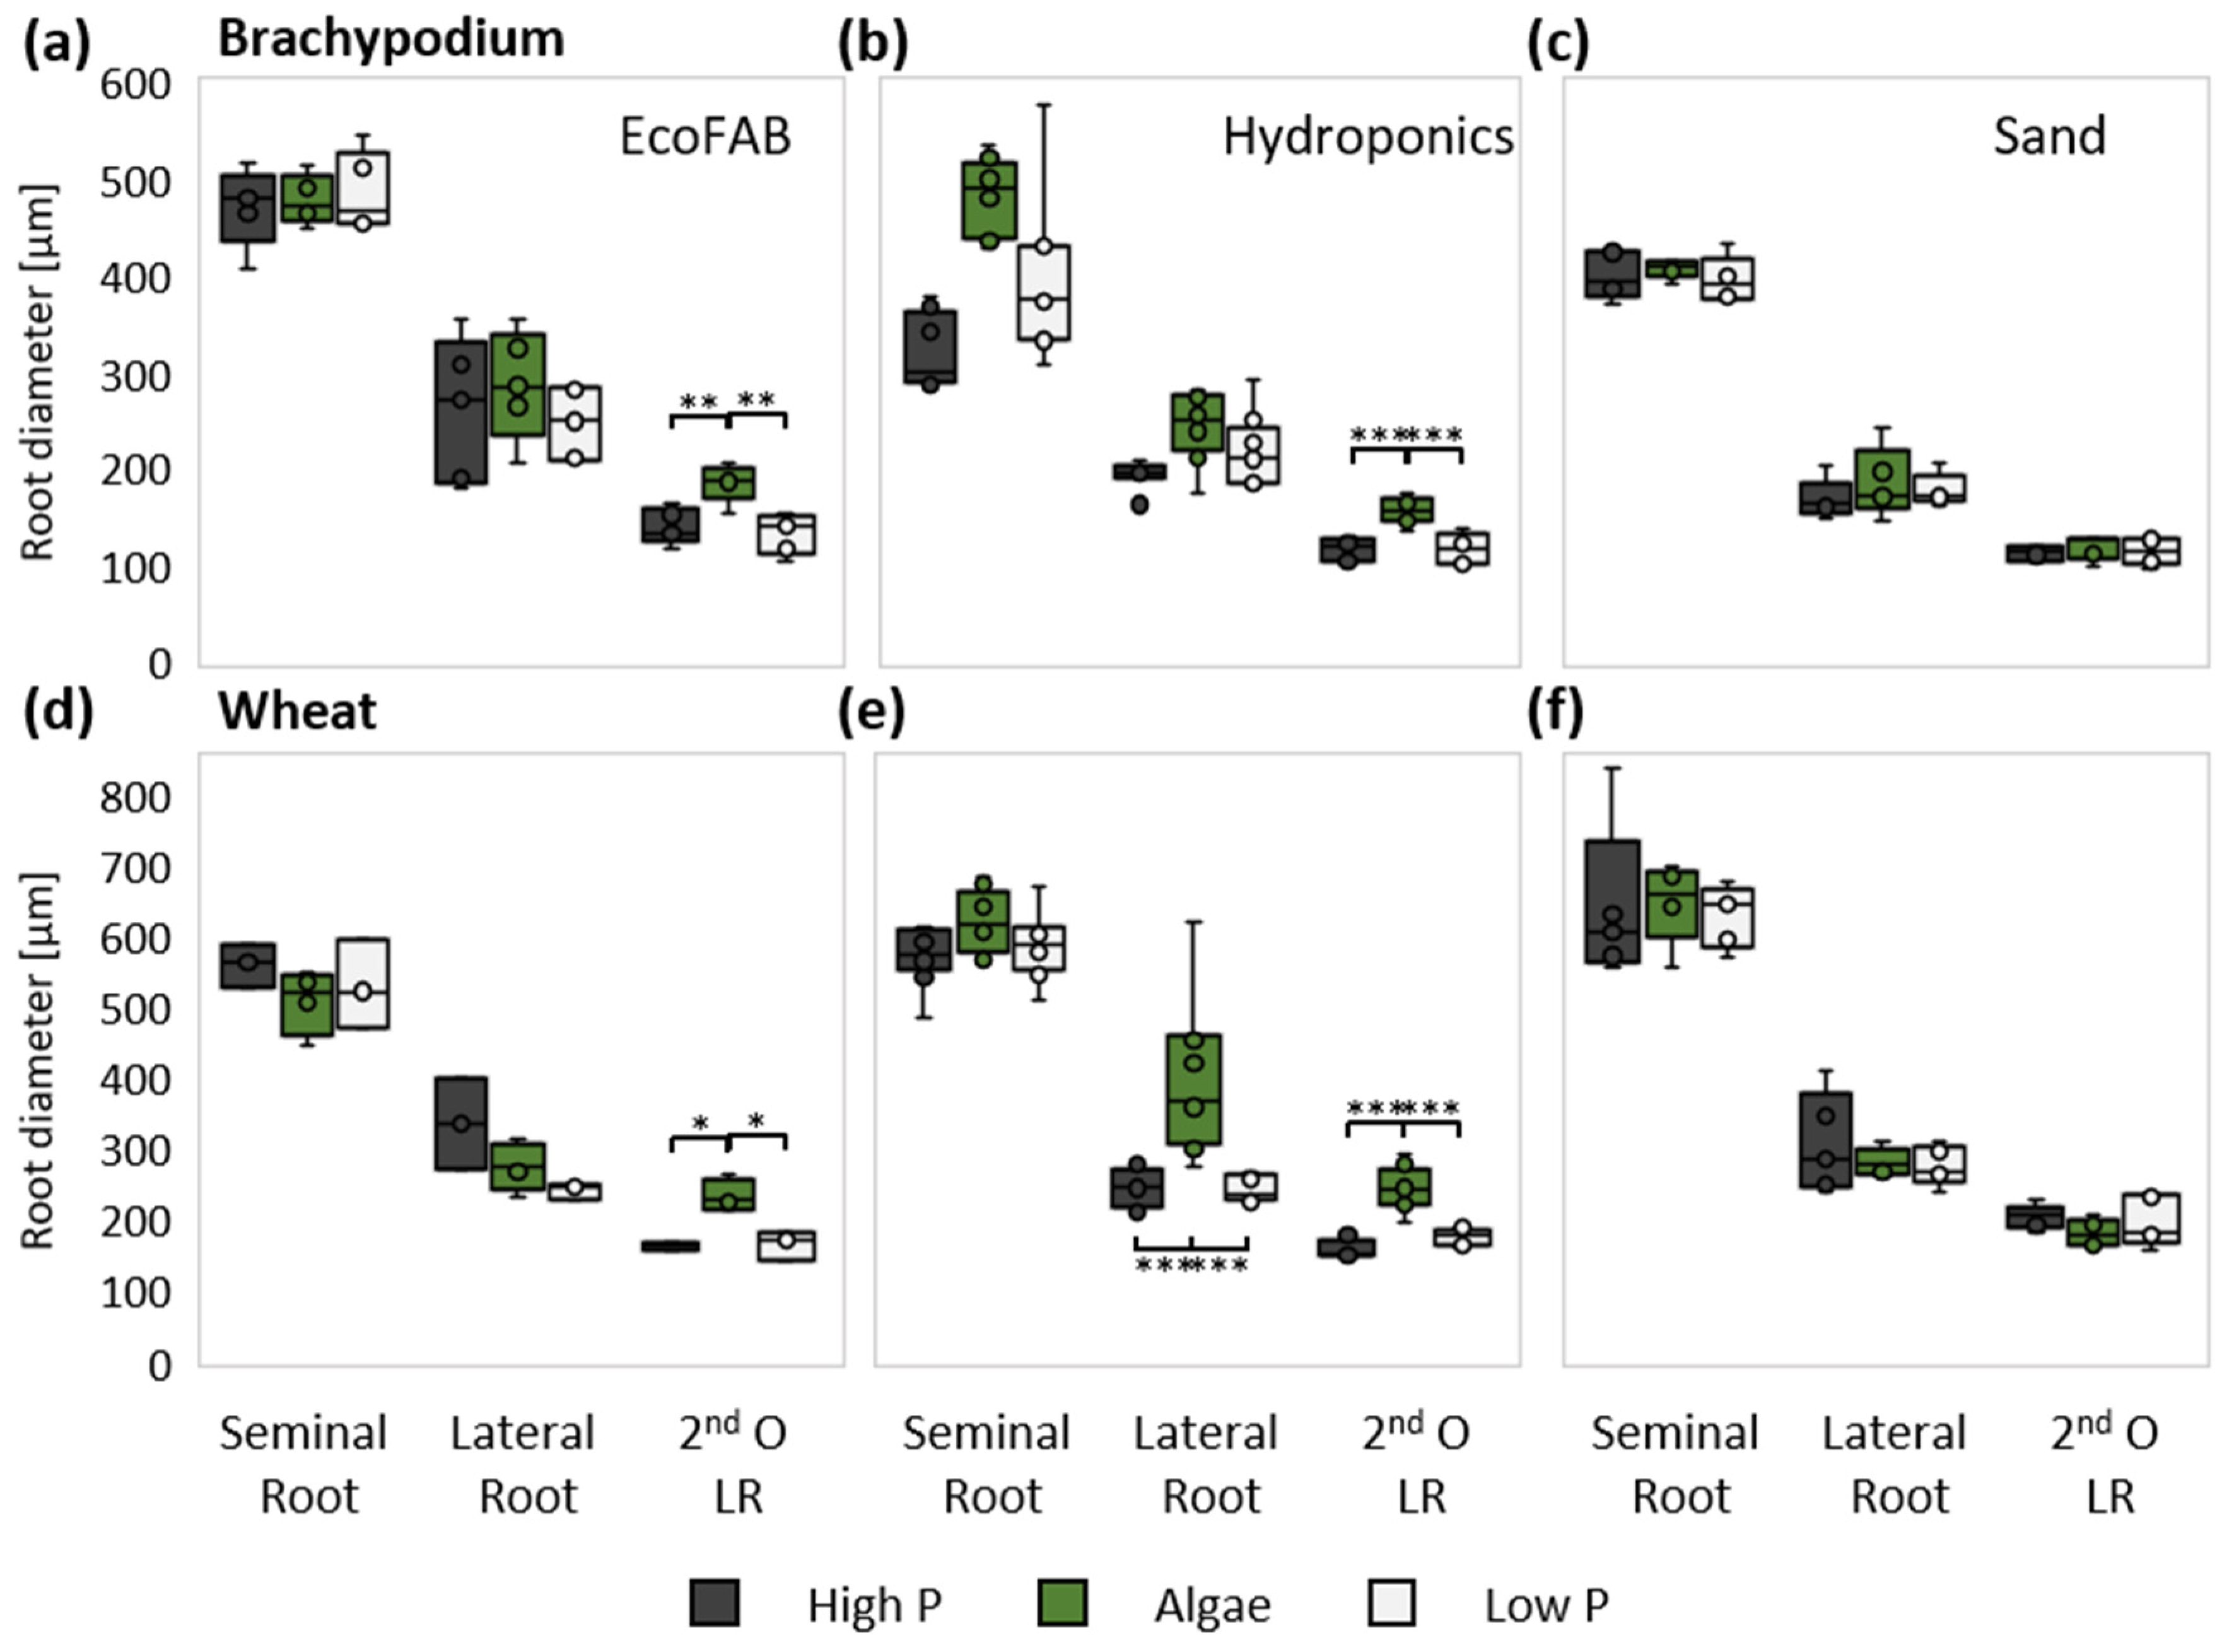
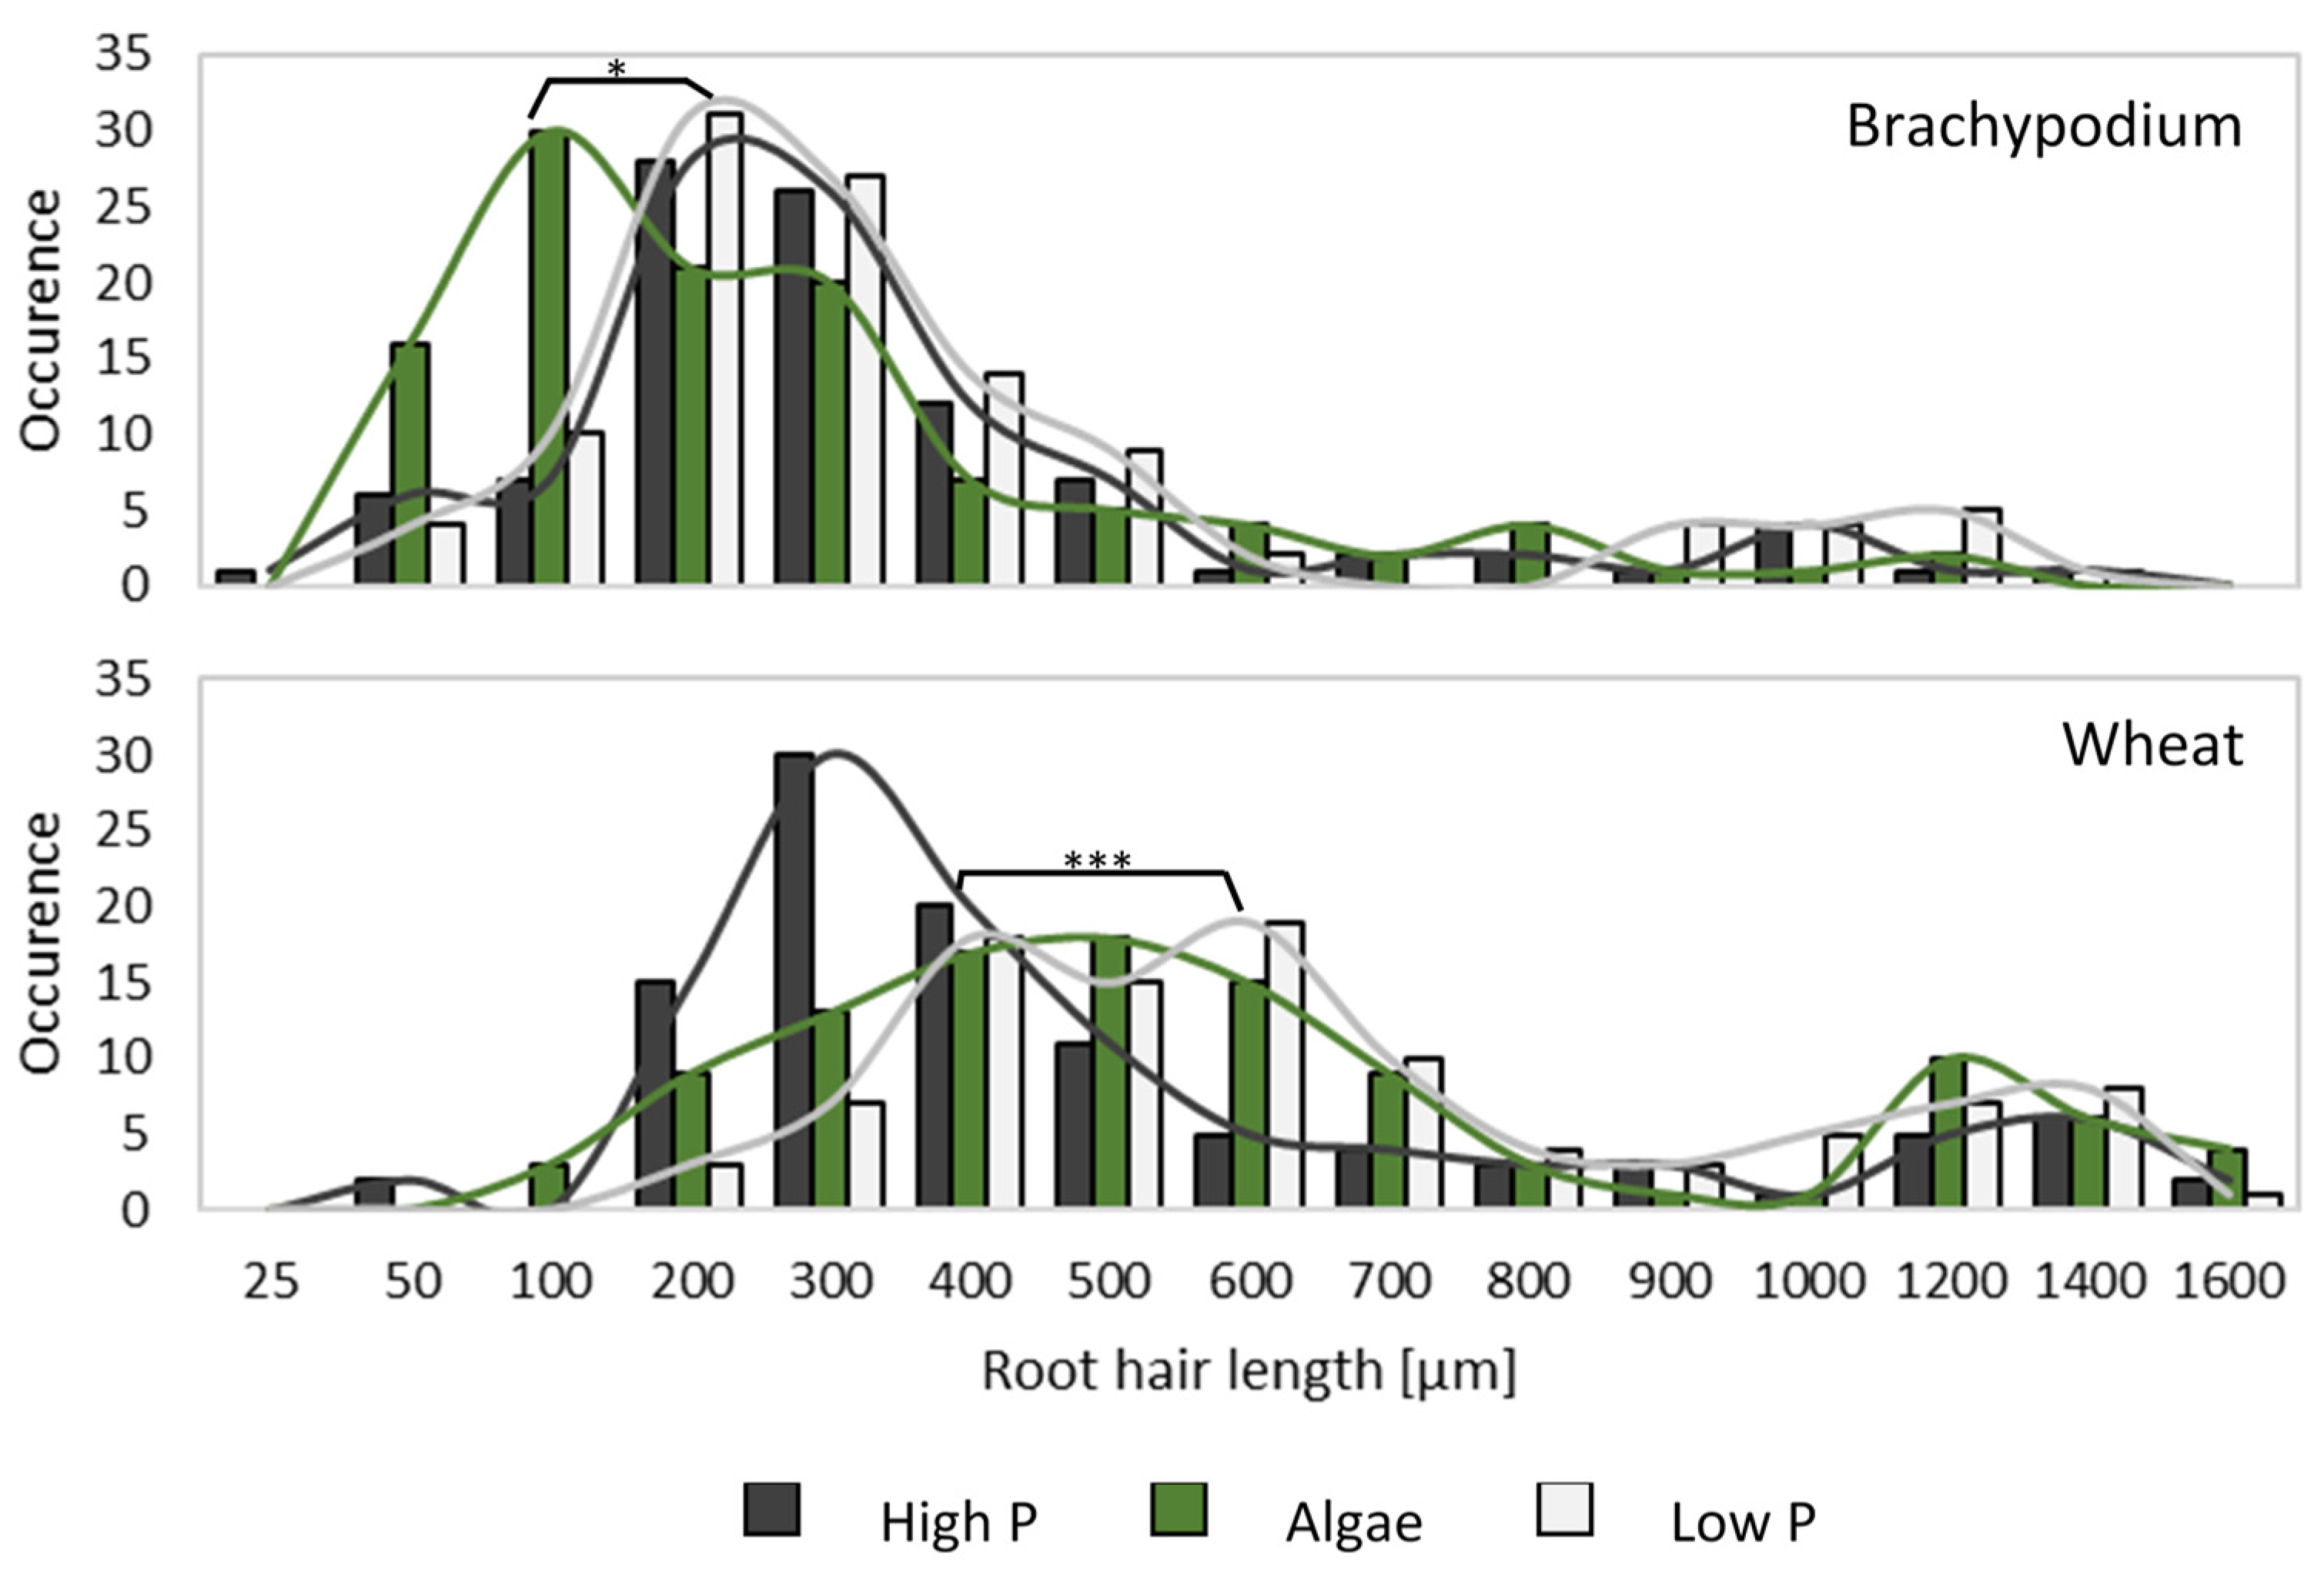
3.3. Presence of Algae Changed Root Morphology in Wheat and Brachypodium

For a deeper understanding of differences at the root level, stereo microscopic analyses were performed allowing determination of root diameter (Figure 5), number (Supplementary Figure S3), and root hair structures (Figure 6, Supplementary Figure S4) at 21 DAT of seminal roots and their first and second order lateral roots (LRs). Both plant species had decreasing root diameters from seminal roots over first to second order lateral roots and little difference between the experimental setups, but some interesting variation among the treatments (Figure 5). For Brachypodium plants, significant differences were found in the EcoFAB and hydroponic experiments with algae-grown roots having thicker roots compared to high and low P treatments. This increase in diameter was most pronounced for LRs, especially the second order LRs. Sand-grown Brachypodium plants had slightly thinner roots of all types compared to EcoFAB- and hydroponic-grown plants, but without differences between the treatments. Wheat plants followed the same trends as did Brachypodium plants: thicker roots in response to the algae treatment, most pronounced for second order lateral roots (Figure 5). In addition, wheat and Brachypodium plants had formed few crown roots at 21 DAT in EcoFAB and hydroponics, but none were found in sand-grown plants (data not shown).
Further microscopic analyses concentrated on root hair development (Figure 6, Supplementary Figure S4), a well-known response in P-deficient plants [35]. The three analyzed root types, seminal roots and their first and second order LRs, formed root hairs of a wide distribution of length varying between experimental setup, root type, and treatment (Supplementary Figure S4). To gain a broader overview of the differences between the nutrient treatments, the distribution of all root hair lengths was compared in histograms (Figure 6). Wheat and Brachypodium formed root hairs from 25 µm to well over 1500 µm length with the highest occurrence in the range 100–500 µm for Brachypodium and 200–700 µm for wheat. Brachypodium plants supplied with algae had a higher proportion of shorter root hairs, while the distribution of root hair length between high P and low P did not differ. Contrary to this, wheat roots supplied with algae formed longer root hairs compared to high P-treated plants, with a similar distribution to low P-treated roots (Figure 6).
Measuring pH regularly was possible in the hydroponics setup and revealed a rather stable value for high P- and low P-supplied plants, while the pH with algal biomass increased within seven days to almost 8.0 for Brachypodium plants and ~7.6 for wheat plants (Supplementary Figure S1). Hydroponics boxes without plants were used as controls and their pH was stable for high P and low P treatments, while boxes with algal biomass increased up to pH 8.0 within three days and plateaued until medium exchange.
Since both, different, and similar physiological responses were found for algae and mineral fertilizer supplied plants, we asked the question how much of the algae containing P was available to the plant, by analyzing the total P and highly anionic polyphosphates. We found that a large portion of algae P is bound in various polyphosphates, low molecular as well as higher molecular forms (Figure 7). The PAGE analysis of the TiO2 pull-down showed that inorganic polyphosphates with a typical ladder pattern are abundant in the algal biomass. Organic polyphosphates co-migrating with phytic acid (InsP6) and the phytic acid-derived signaling molecules InsP7 and InsP8 [11,12] were not clearly visible by PAGE, but might have been covered by the inorganic polyphosphates (Figure 7a). Subsequently, algal biomass and the purified polyphosphates were analyzed via ICP-MS to determine the amount of presumably plant unavailable polyphosphates. Relative to the total P from the algal biomass, the inorganic polyphosphates were calculated to represent 11% of the total P in algae (Figure 7b). In addition, sequential phosphate extraction and measurement was performed on the algal biomass leading to a portion of 33% total P either readily available or available after incubation with citric acid (Figure 7c). Taken together with the unavailable polyphosphate content, a little over 50% P contained in the algal biomass remains unaccounted for by our measurements, most likely bound in organic molecules such as nucleotides, lipids, and proteins.

4. Discussion

4.1. Wheat and Brachypodium Are Taking Up P from Algal Biomass

When aiming at future usage of algal biomass as a renewable fertilizer source, the first question to answer is always ‘if plants can grow with such a nutrient source’, while the following questions are ‘how’, ‘to what extent’, and ‘how to optimize’. Initial studies showed that microalgae-provided P was taken up by wheat [18] and that pot-grown wheat showed comparable growth when fertilized with algae or mineral nutrition over eight weeks [17], however, the effect on early development, particularly on the root phenotype, was not investigated. To answer these questions, we performed parallel experiments supplying wheat and Brachypodium plants either with mineral nutrients or algal biomass. Both species, wheat and Brachypodium, grew similarly in all these conditions without severe deficiency symptoms. Strikingly, algal biomass supply led to higher P uptake than low P mineral nutrition, a difference already measurable 14 DAT in hydroponics (Table 1 and Table 2, Supplementary Figure S2). High P content in plants supplied with algae are partially supported by biomass accumulation. The remaining nutrients come into play in the discrepancy, since the majority of N supply from algal biomass is less readily available compared to purely mineral N supply. N uptake was similar for plants grown in high and low P, while plants grown with algae had lower values, which suggests that their growth was to some degree N-limited (Table 1 and Table 2). Another possibility is the uptake of larger organic molecules without their incorporation and use as mineral P, as suggested for the use of phosphotidylcholine by barley [39].

4.2. P Efficiency in Three Inherently Different Systems

In this study, three experimental systems were used. In addition to having floating roots in aerated nutrient solution rather than roots growing in sand or soil, the total amount of nutrients and algal biomass was ~10× higher in hydroponics compared to our sand experiment over the three-week growth period. Measuring the pH regularly resulted in the finding of a strong pH increase in the hydroponic growth medium, although weakened by the plant’s presence (Supplementary Figure S1). Living algal cultures are known for altering their medium’s pH towards the alkaline spectrum fast and intensely (reaching pH 10–11 within a few hours to days) [40], however, since our algal biomass was not living it can be assumed that the pH increase was either caused by remaining algal growth medium still attached to the cells or ongoing decomposition of algal cells releasing pH-increasing compounds. The latter has been described for Scenedesmus sp. biomass [41]. Both can only be speculated about, therefore, it would be very interesting to follow the pH development over longer time periods and compare living and dead algal biomass. The change in pH can spatially and temporarily be measured via optodes in direct contact with roots and/or medium [42]. pH has been shown to affect root traits, e.g., root diameter.

4.3. Algal Biomass Impacts Root Development and Medium pH

The most pronounced root phenotype in algal-fertilized plants was the formation of short and thick roots, especially pronounced in lateral roots (Supplementary Figure S5). While plants supplied with either low or high P mineral fertilization had the same root diameter in all conditions, algal-fertilized plants formed thicker roots in hydroponics and to some degree in the EcoFABs (Figure 5). A highly reduced root length with algae biomass compared to the other treatment was found also for root length in hydroponics (Figure 2), measurable as early as seven DAT (Figure 4). In the sand experiment, no change in root diameter was found. This agrees with [17] who reported similar or even decreasing root diameters of algal-fertilized plants, grown in soil- or sand-filled pots. Mediated by basipetal auxin transport, lateral root frequency is negatively affected by low phosphate availability in wheat seedlings [43]. Since auxin and other phytohormones are present in algae such as Chlorella spec. [44], a direct effect on wheat and Brachypodium root growth can be expected, reflected partially in total root numbers (Supplementary Figure S3).

4.4. Nutrient Supply by Algae Is Complementing Mineral Nutrition

Our experimental design was specifically designed to answer the question regarding whether fertilization with algal biomass would be able to supplement full mineral fertilized plants as well as specifically P deficient plants. The three different setups and two plant species studied here led to combinations of sufficient and insufficient nutrition based on the total amount of nutrients (same for both species) and the different requirements by both Brachypodium and wheat. Wheat plants grown in sand and EcoFABs grew with 10% of total nutrients compared to those grown in hydroponics. This difference in nutrition may be the main reason that we found the expected response to low P supply (lower shoot biomass, but higher root length) only in wheat when grown in hydroponics. Brachypodium grown in EcoFABs on the other hand had better shoot growth when supplied with high P compared to algal biomass and low P, confirming that high P nutrition in EcoFABs was sufficient and low P was limiting. On the other hand, Brachypodium grown in hydroponics did not experience P deficiency in any condition as the total amount of P per plant was ten times higher than in the EcoFABs due to the higher volume of the system and lower requirement of the plant. Thus, hydroponics worked as the optimal nutritional system for wheat, but EcoFABs for Brachypodium.
Due to the organic nature of fertilization with algal biomass, the availability of nutrients such as P is largely different from mineral fertilizers. About 33% of algal P was readily available (Figure 7c) without further breakdown. Measuring total P uptake, however, revealed that the plants took up about 69% P (Table 2) supplied by algae, which in turn means that more complex pools of P within the cells were accessed. Wheat plants have been shown to utilize different strategies to improve P availability in the rhizosphere. Even though a previous study showed only minor effects on P availability [45], the spatial limitation in the EcoFABs could have enhanced the effects of the exudation of organic anions and acid phosphatases related to P solubilization in soils. These strategies, while allowing the plant to access P, are costly and therefore only administered if needed [46].
Overall, algal-fertilized plants grew at least comparably to low P and sometimes even to the high P fertilized plants in our experiments This is in some contrast to earlier studies describing similar or the same development of algal-fertilized plants within the vegetative phase of wheat development [16,17]. As the aforementioned studies analyzed soil- and sand-grown plants, it has to be mentioned that our plants grew with little or no difference among the nutrient treatments in sand, too, which may be attributed to the small volume of nutrient added and the possible sorption of nutrients by sand particles and therefore less immediately available nutrients. The smaller plant biomass found in our solution-based systems, EcoFABs and hydroponics, when fertilized with algal biomass may be dependent on several factors: (i) availability of organic nutrient forms, (ii) direct contact to algal biomass, (iii) increased medium pH, or (iv) lower diffusion of nutrients within the sand medium.

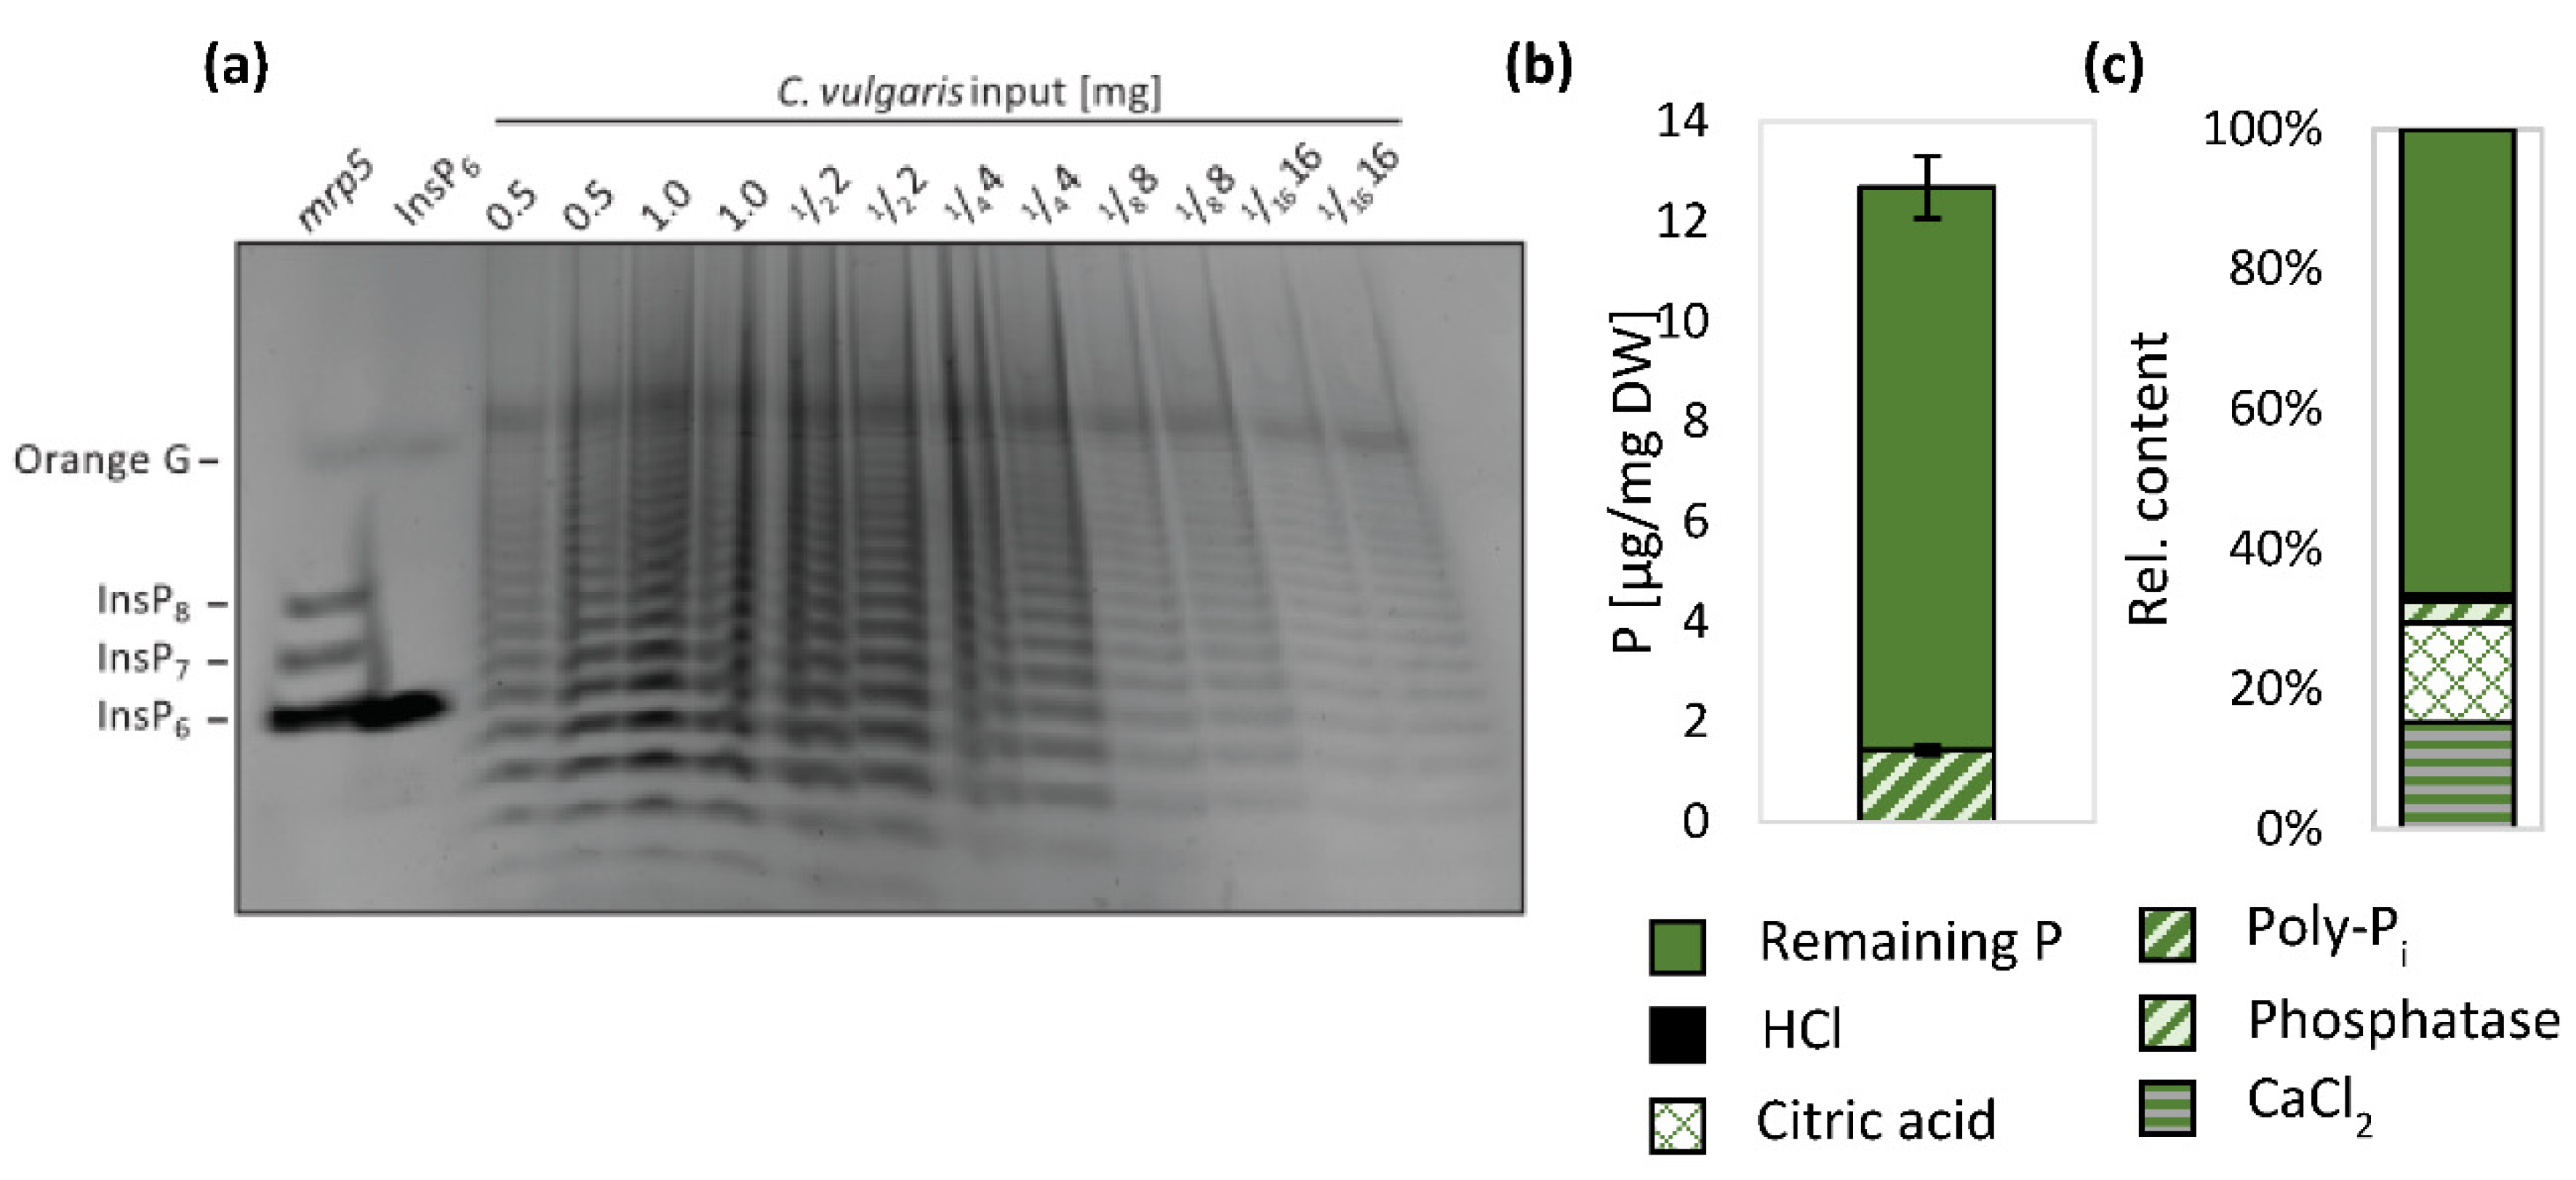
4.5. P-Form Complexity within Algae Biomass Offers Potential for Slow Release P Fertilizer

As nutrients supplied with the algal biomass (present as highly anionic polyphosphates or organically bound) are still within algal cells with rigid cell walls, availability of those nutrients requires decomposition events as suggested by [16] and seen in pot experiments with native microbiomes [17]. The release of P from Chlorella sp. biomass has been shown to increase soil-available P and to decline more slowly than that released from conventional fertilizers [21]. Application of digestate, another organic fertilizer, needs at least six weeks before roots preferentially grow into the application site, suggesting an ongoing decomposition event and more available nutrients afterwards [47]. In addition, highly anionic polyphosphates that can not be taken up by plant roots via plasma membrane transport in a direct manner, are abundant in this algal biomass, most likely resulting in a delay in P acquisition (Figure 7).
Direct contact with algal cells in high concentrations, especially in hydroponics, led to the attachment of bulks of algal cells on the root epidermis (Supplementary Figure S5). An earlier study on soil- and sand-grown wheat roots found discoloration, but no algal attachment to the root surface [17]. It is possible and probable that algal cell attachment can cause a certain amount of biotic stress response of wheat and Brachypodium roots [48]. Furthermore, microbial and algal cells are known to produce plant-active effectors such as auxin-like molecules affecting root phenotypes [44].
Last but not least, in hydroponics we noticed a strong increase in pH. Although pH values in plant-free control boxes increased faster, Brachypodium cultures reached the same pH after seven days, while wheat was able to lower it by 0.5 units (Supplementary Figure S1), suggesting that the larger wheat root system was able to acidify the surrounding medium more. A pH of 7.5–8.0 has some, but not a dramatic, effect on nutrient availability in solutions [49], yet it has been shown to affect root growth in some species. Lupinus angustifolius for example develops shorter roots with a disintegrated root surface in high pH solution, while Pisum sativum was unaffected [50]. When grown in sand, L. angustifolius develops shorter and a higher proportion of thick roots in pH 7.5 [51]. Another study using pH 4–6 found that genotypic differences among wheat lines are larger than root growth difference in different pH levels [52]. Contrastingly, soil-grown durum wheat roots were shown to increase their rhizosphere pH to ~8.0 [42]. Our results suggest that a steadily increasing pH up to 7.5–8.0 in solution reduces the root length and increases the root diameter of wheat and Brachypodium. Interestingly, the larger wheat root system was able to slow down the pH increase in algal solution and even lower it at the end of our growth time frame of 21 DAT suggesting that given more time wheat may be able to decrease the pH further, probably below 6, which would be closer to the ideal hydroponic growth pH [49].

4.6. Wheat and Brachypodium Have a Divergent Shoot, but Similar Root Response to Algal Biomass

Wheat and Brachypodium plants grown when fertilized with algal biomass exhibited a noticeable root phenotype, shorter and thicker lateral roots, while their root hair response was less similar. In addition, wheat and Brachypodium differed in response to algal and mineral nutrition based on the growth setup they are grown in, which will mostly be due to the total nutrient amount contained and the species-specific demands as discussed above. Overall, the similarities between wheat and Brachypodium’s response to algal biomass, uptake, and potential growth, as well as the root phenotype found in EcoFABs and hydroponics are larger than their differences. Therefore, Brachypodium is a good model for further analyses evaluating usage of algal or other renewable fertilizers for wheat nutrition as it can be grown longer in controlled conditions using fewer growth requirements. Finally, algae are a promising source of circular fertilizer that should be further explored.
Our results are encouraging to new recycled fertilization strategies, showing algae is a nutrient source for wheat and its genetic model Brachypodium in three experimental setups. Variation in root phenotypes showed algal biomass is sensed by roots and is taken up at a higher amount per root length than mineral P. The total P uptake, however, declined, therefore, genetic variation with improved root performance under algae fertilization might be a possible future perspective. These phenotypes can be selected and further adapted in phenotype-based breeding for future renewal agriculture systems.

4.7. Future Research for Renewable Fertilizer Use by Crop

The use of algae as an alternative source for crop fertilization will possibly profit from mixed mineral and algae fertilization, as the main nutrient forms will only preferably be accessed under limiting conditions, while P and other nutrients will also be released over time. Microbial decomposition of algal biomass can aid in nutrient availability, therefore, a pre-incubation in soil with native microbiome before plant germination is recommended. Furthermore, research could focus on strategies that make use of algae biomass as a long-term depot in addition to conventional fertilizer application. N supply may be more limiting than P, which needs to be considered when aiming for agricultural application of algal fertilizers. Besides investigating the plants side, there is also great potential in attenuating the nutrient content and composition of the algal biomass via adaption of their growth conditions.

Supplementary Materials

The following are available online at https://www.mdpi.com/article/10.3390/agronomy12020285/s1, Figure S1: pH changes over the experimental time frame in hydroponics, Figure S2: Brachypodium and wheat plant development over time in hydroponics, Figure S3: Total root number of Brachypodium and wheat plants, Figure S4: Detailed root hair analysis for Brachypodium and wheat plants grown in all three experimental setups, Figure S5: Brachypodium and wheat root phenotype in hydroponics, Table S1: Composition of treatments based on 0.5× Hoagland.

Author Contributions

Conceptualization: J.K., B.A., G.S., U.R., M.W.; experimentation: L.M., S.J., J.M.K., H.B., Y.E.M.; data analysis: L.M., J.K., H.B., Y.E.M.; figure preparation: J.K., L.M., H.B.; supervision: J.K., B.A., S.D.S., G.S.; writing original draft: J.K., L.M., B.A.; writing, reviewing, and editing: J.K., L.M., G.S., U.R., M.W., B.A. All authors have read and agreed to the published version of the manuscript.

Funding

We acknowledge institutional funding by the Helmholtz Association for Forschungszentrum Jülich. L.M. acknowledges funding by the Jülich-University of Melbourne Postgraduate Academy (JUMPA). G.S. acknowledges funding from the Deutsche Forschungsgemeinschaft (DFG, German Research Foundation) under Germany’s Excellence Strategy—EXC 2070—390732324, PhenoRob.

Data Availability Statement

All data for this study has been included in the figures and Supplemental Material.

Acknowledgments

We would like to thank the micro scale bioengineering group of Junprof. D. Kohlheyer at IBG-1, Forschungszentrum Jülich GmbH for technical advice and equipment lending for plasma bonding of the EcoFAB setup.

Conflicts of Interest

The authors declare no conflict of interest.

References

  1. Solovchenko, A.; Verschoor, A.M.; Jablonowski, N.D.; Nedbal, L. Phosphorus from wastewater to crops: An alternative path involving microalgae. Biotechnol. Adv. 2016, 34, 550–564. [Google Scholar] [CrossRef]
  2. Ismagulova, T.; Shebanova, A.; Gorelova, O.; Baulina, O.; Solovchenko, A. A new simple method for quantification and locating P and N reserves in microalgal cells based on energy-filtered transmission electron microscopy (EFTEM) elemental maps. PLoS ONE 2018, 13, e0208830. [Google Scholar] [CrossRef] [PubMed]
  3. Moudříková, Š.; Nedbal, L.; Solovchenko, A.; Mojzeš, P. Raman microscopy shows that nitrogen-rich cellular inclusions in microalgae are microcrystalline guanine. Algal Res. 2017, 23, 216–222. [Google Scholar] [CrossRef]
  4. Mojzeš, P.; Gao, L.; Ismagulova, T.; Pilátová, J.; Moudříková, Š.; Gorelova, O.; Solovchenko, A.; Nedbal, L.; Salih, A. Guanine, a high-capacity and rapid-turnover nitrogen reserve in microalgal cells. Proc. Natl. Acad. Sci. USA 2020, 117, 32722–32730. [Google Scholar] [CrossRef] [PubMed]
  5. Miyachi, S.; Kanai, R.; Mihara, S.; Aoki, S. Metabolic roles of inorganic polyphosphates in chlorella cells. Biochim. Biophys. Acta 1964, 93, 625–634. [Google Scholar] [CrossRef]
  6. Brown, N.; Shilton, A. Luxury uptake of phosphorus by microalgae in waste stabilisation ponds: Current understanding and future direction. Rev. Environ. Sci. Bio/Technol. 2014, 13, 321–328. [Google Scholar] [CrossRef]
  7. Moudříková, Š.; Ivanov, I.N.; Vítová, M.; Nedbal, L.; Zachleder, V.; Mojzeš, P.; Bišová, K. Comparing Biochemical and Raman Microscopy Analyses of Starch, Lipids, Polyphosphate, and Guanine Pools during the Cell Cycle of Desmodesmus quadricauda. Cells 2021, 10, 62. [Google Scholar] [CrossRef]
  8. Couso, I.; Evans, B.S.; Li, J.; Liu, Y.; Ma, F.; Diamond, S.; Allen, D.K.; Umen, J.G. Synergism between Inositol Polyphosphates and TOR Kinase Signaling in Nutrient Sensing, Growth Control, and Lipid Metabolism in Chlamydomonas. Plant Cell 2016, 28, 2026–2042. [Google Scholar] [CrossRef] [PubMed] [Green Version]
  9. Raboy, V. myo-Inositol-1,2,3,4,5,6-hexakisphosphate. Phytochemistry 2003, 64, 1033–1043. [Google Scholar] [CrossRef]
  10. Zhu, J.; Lau, K.; Puschmann, R.; Harmel, R.K.; Zhang, Y.; Pries, V.; Gaugler, P.; Broger, L.; Dutta, A.K.; Jessen, H.J.; et al. Two bifunctional inositol pyrophosphate kinases/phosphatases control plant phosphate homeostasis. eLife 2019, 8, e43582. [Google Scholar] [CrossRef]
  11. Riemer, E.; Qiu, D.; Laha, D.; Harmel, R.K.; Gaugler, P.; Gaugler, V.; Frei, M.; Hajirezaei, M.-R.; Laha, N.P.; Krusenbaum, L.; et al. ITPK1 is an InsP6/ADP phosphotransferase that controls phosphate signaling in Arabidopsis. Mol. Plant 2021, 14, 1864–1880. [Google Scholar] [CrossRef]
  12. Laha, D.; Johnen, P.; Azevedo, C.; Dynowski, M.; Weiß, M.; Capolicchio, S.; Mao, H.; Iven, T.; Steenbergen, M.; Freyer, M.; et al. VIH2 Regulates the Synthesis of Inositol Pyrophosphate InsP8 and Jasmonate-Dependent Defenses in Arabidopsis. Plant Cell 2015, 27, 1082–1097. [Google Scholar] [CrossRef] [PubMed] [Green Version]
  13. Blüher, D.; Laha, D.; Thieme, S.; Hofer, A.; Eschen-Lippold, L.; Masch, A.; Balcke, G.; Pavlovic, I.; Nagel, O.; Schonsky, A.; et al. A 1-phytase type III effector interferes with plant hormone signaling. Nat. Commun. 2017, 8, 2159. [Google Scholar] [CrossRef]
  14. Laha, N.P.; Dhir, Y.W.; Giehl, R.F.H.; Schäfer, E.M.; Gaugler, P.; Shishavan, Z.H.; Gulabani, H.; Mao, H.; Zheng, N.; von Wirén, N.; et al. ITPK1-Dependent Inositol Polyphosphates Regulate Auxin Responses in Arabidopsis thaliana. bioRXiv 2020. [Google Scholar] [CrossRef] [Green Version]
  15. Gulabani, H.; Goswami, K.; Walia, Y.; Roy, A.; Noor, J.J.; Ingole, K.D.; Kasera, M.; Laha, D.; Giehl, R.F.H.; Schaaf, G.; et al. Arabidopsis inositol polyphosphate kinases IPK1 and ITPK1 modulate crosstalk between SA-dependent immunity and phosphate-starvation responses. Plant Cell Rep 2021. [Google Scholar] [CrossRef] [PubMed]
  16. Mau, L.; Kant, J.; Walker, R.; Kuchendorf, C.M.; Schrey, S.D.; Roessner, U.; Watt, M. Wheat Can Access Phosphorus From Algal Biomass as Quickly and Continuously as From Mineral Fertilizer. Front. Plant Sci. 2021, 12, 631314. [Google Scholar] [CrossRef] [PubMed]
  17. Schreiber, C.; Schiedung, H.; Harrison, L.; Briese, C.; Ackermann, B.; Kant, J.; Schrey, S.D.; Hofmann, D.; Singh, D.; Ebenhöh, O.; et al. Evaluating potential of green alga Chlorella vulgaris to accumulate phosphorus and to fertilize nutrient-poor soil substrates for crop plants. J. Appl. Phycol. 2018, 30, 2827–2836. [Google Scholar] [CrossRef]
  18. Siebers, N.; Hofmann, D.; Schiedung, H.; Landsrath, A.; Ackermann, B.; Gao, L.; Mojzeš, P.; Jablonowski, N.D.; Nedbal, L.; Amelung, W. Towards phosphorus recycling for agriculture by algae: Soil incubation and rhizotron studies using 33P-labeled microalgal biomass. Algal Res. 2019, 43, 101634. [Google Scholar] [CrossRef]
  19. Richardson, A.E.; Hadobas, P.A.; Hayes, J.E. Acid phosphomonoesterase and phytase activities of wheat (Triticum aestivum L.) roots and utilization of organic phosphorus substrates by seedlings grown in sterile culture. Plant Cell Environ. 2000, 23, 397–405. [Google Scholar] [CrossRef]
  20. Torres-Dorante, L.O.; Claassen, N.; Steingrobe, B.; Olfs, H.-W. Hydrolysis rates of inorganic polyphosphates in aqueous solution as well as in soils and effects on P availability. J. Plant Nutr. Soil Sci. 2005, 168, 352–358. [Google Scholar] [CrossRef]
  21. Mukherjee, C.; Chowdhury, R.; Ray, K. Phosphorus Recycling from an Unexplored Source by Polyphosphate Accumulating Microalgae and Cyanobacteria—A Step to Phosphorus Security in Agriculture. Front. Microbiol. 2015, 6, 1421. [Google Scholar] [CrossRef] [PubMed] [Green Version]
  22. FAOstat. Food and Agriculture Organization of the United Nations, 2019. Available online: https://www.fao.org/faostat/en/#data/QCL (accessed on 11 December 2021).
  23. Appels, R.; Eversole, K.; Stein, N.; Feuillet, C.; Keller, B.; Rogers, J.; Pozniak, C.J.; Choulet, F.; Distelfeld, A.; Poland, J.; et al. Shifting the limits in wheat research and breeding using a fully annotated reference genome. Science 2018, 361, eaar7191. [Google Scholar] [CrossRef] [PubMed] [Green Version]
  24. Watt, M.; Magee, L.J.; McCully, M.E. Types, structure and potential for axial water flow in the deepest roots of field-grown cereals. New Phytol. 2008, 178, 135–146. [Google Scholar] [CrossRef] [PubMed]
  25. Vogel, J.P.; Garvin, D.F.; Mockler, T.C.; Schmutz, J.; Rokhsar, D.; Bevan, M.W.; Barry, K.; Lucas, S.; Harmon-Smith, M.; Lail, K.; et al. Genome sequencing and analysis of the model grass Brachypodium distachyon. Nature 2010, 463, 763–768. [Google Scholar] [CrossRef]
  26. Watt, M.; Schneebeli, K.; Dong, P.; Wilson, I.W. The shoot and root growth of Brachypodium and its potential as a model for wheat and other cereal crops. Funct. Plant Biol. 2009, 36, 960–969. [Google Scholar] [CrossRef] [PubMed] [Green Version]
  27. Kawasaki, A.; Donn, S.; Ryan, P.R.; Mathesius, U.; Devilla, R.; Jones, A.; Watt, M. Microbiome and Exudates of the Root and Rhizosphere of Brachypodium distachyon, a Model for Wheat. PLoS ONE 2016, 11, e0164533. [Google Scholar] [CrossRef] [Green Version]
  28. Chochois, V.; Vogel, J.P.; Watt, M. Application of Brachypodium to the genetic improvement of wheat roots. J. Exp. Bot. 2012, 63, 3467–3474. [Google Scholar] [CrossRef] [Green Version]
  29. Poiré, R.; Chochois, V.; Sirault, X.R.R.; Vogel, J.P.; Watt, M.; Furbank, R.T. Digital imaging approaches for phenotyping whole plant nitrogen and phosphorus response in Brachypodium distachyon. J. Integr. Plant Biol. 2014, 56, 781–796. [Google Scholar] [CrossRef]
  30. Chochois, V.; Vogel, J.P.; Rebetzke, G.J.; Watt, M. Variation in Adult Plant Phenotypes and Partitioning among Seed and Stem-Borne Roots across Brachypodium distachyon Accessions to Exploit in Breeding Cereals for Well-Watered and Drought Environments. Plant Physiol. 2015, 168, 953–967. [Google Scholar] [CrossRef] [Green Version]
  31. Hoagland, D.R.; Arnon, D.I. The water-culture method for growing plants without soil. Circular. Calif. Agric. Exp. Stn. 1950, 347, 32. [Google Scholar]
  32. Gao, J.; Sasse, J.; Lewald, K.M.; Zhalnina, K.; Cornmesser, L.T.; Duncombe, T.A.; Yoshikuni, Y.; Vogel, J.P.; Firestone, M.K.; Northen, T.R. Ecosystem Fabrication (EcoFAB) Protocols for The Construction of Laboratory Ecosystems Designed to Study Plant-microbe Interactions. JoVE 2018, 134, e57170. [Google Scholar] [CrossRef] [PubMed] [Green Version]
  33. Sasse, J.; Kant, J.; Cole, B.J.; Klein, A.P.; Arsova, B.; Schlaepfer, P.; Gao, J.; Lewald, K.; Zhalnina, K.; Kosina, S.; et al. Multilab EcoFAB study shows highly reproducible physiology and depletion of soil metabolites by a model grass. New Phytol. 2019, 222, 1149–1160. [Google Scholar] [CrossRef] [PubMed] [Green Version]
  34. Müller-Linow, M.; Wilhelm, J.; Briese, C.; Wojciechowski, T.; Schurr, U.; Fiorani, F. Plant Screen Mobile: An open-source mobile device app for plant trait analysis. Plant Methods 2019, 15, 2. [Google Scholar] [CrossRef] [PubMed] [Green Version]
  35. Nestler, J.; Keyes, S.D.; Wissuwa, M. Root hair formation in rice (Oryza sativa L.) differs between root types and is altered in artificial growth conditions. J. Exp. Bot. 2016, 67, 3699–3708. [Google Scholar] [CrossRef] [Green Version]
  36. Wilson, M.S.C.; Bulley, S.J.; Pisani, F.; Irvine, R.F.; Saiardi, A. A novel method for the purification of inositol phosphates from biological samples reveals that no phytate is present in human plasma or urine. Open Biol. 2015, 5, 150014. [Google Scholar] [CrossRef] [PubMed] [Green Version]
  37. Losito, O.; Szijgyarto, Z.; Resnick, A.C.; Saiardi, A. Inositol Pyrophosphates and Their Unique Metabolic Complexity: Analysis by Gel Electrophoresis. PLoS ONE 2009, 4, e5580. [Google Scholar] [CrossRef]
  38. DeLuca, T.H.; Glanville, H.C.; Harris, M.; Emmett, B.A.; Pingree, M.R.A.; de Sosa, L.L.; Cerdá-Moreno, C.; Jones, D.L. A novel biologically-based approach to evaluating soil phosphorus availability across complex landscapes. Soil Biol. Biochem. 2015, 88, 110–119. [Google Scholar] [CrossRef] [Green Version]
  39. McKercher, R.B.; Tollefson, T.S. Barley response to phosphorus from phospholipids and nucleic acids. Can. J. Soil Sci. 1978, 58, 103–105. [Google Scholar] [CrossRef]
  40. Nguyen, T.D.P.; Frappart, M.; Jaouen, P.; Pruvost, J.; Bourseau, P. Harvesting Chlorella vulgaris by natural increase in pH: Effect of medium composition. Environ. Technol. 2014, 35, 1378–1388. [Google Scholar] [CrossRef]
  41. Otsuki, A.; Hanya, T. Production of dissolved organic matter from dead green algal cells. II. Anaerobic microbial decomposition. Limnol. Oceanogr. 1972, 17, 258–264. [Google Scholar] [CrossRef]
  42. Blossfeld, S.; Schreiber, C.M.; Liebsch, G.; Kuhn, A.J.; Hinsinger, P. Quantitative imaging of rhizosphere pH and CO2 dynamics with planar optodes. Ann. Bot. 2013, 112, 267–276. [Google Scholar] [CrossRef] [PubMed] [Green Version]
  43. Talboys, P.J.; Healey, J.R.; Withers, P.J.A.; Jones, D.L. Phosphate depletion modulates auxin transport in Triticum aestivum leading to altered root branching. J. Exp. Bot. 2014, 65, 5023–5032. [Google Scholar] [CrossRef] [PubMed] [Green Version]
  44. Jirásková, D.; Poulíčková, A.; Novák, O.; Sedláková, K.; Hradecká, V.; Strnad, M. High-throughput screening technology for monitoring phytohormone production in microalgae. J. Phycol. 2009, 45, 108–118. [Google Scholar] [CrossRef] [PubMed]
  45. Wang, Y.; Krogstad, T.; Clarke, J.L.; Hallama, M.; Øgaard, A.F.; Eich-Greatorex, S.; Kandeler, E.; Clarke, N. Rhizosphere Organic Anions Play a Minor Role in Improving Crop Species’ Ability to Take Up Residual Phosphorus (P) in Agricultural Soils Low in P Availability. Front. Plant Sci. 2016, 7, 1664. [Google Scholar] [CrossRef] [Green Version]
  46. Raven, J.A.; Lambers, H.; Smith, S.E.; Westoby, M. Costs of acquiring phosphorus by vascular land plants: Patterns and implications for plant coexistence. New Phytol. 2018, 217, 1420–1427. [Google Scholar] [CrossRef] [Green Version]
  47. Nabel, M.; Schrey, S.D.; Poorter, H.; Koller, R.; Nagel, K.A.; Temperton, V.M.; Dietrich, C.C.; Briese, C.; Jablonowski, N.D. Coming Late for Dinner: Localized Digestate Depot Fertilization for Extensive Cultivation of Marginal Soil with Sida hermaphrodita. Front. Plant Sci. 2018, 9, 1095. [Google Scholar] [CrossRef]
  48. Khan, Z.; Karamahmutoğlu, H.; Elitaş, M.; Yüce, M.; Budak, H. Through the Looking Glass: Real-Time Imaging in Brachypodium Roots and Osmotic Stress Analysis. Plants 2019, 8, 14. [Google Scholar] [CrossRef] [Green Version]
  49. Lennard, W.; Goddek, S. Aquaponics: The Basics. In Aquaponics Food Production Systems: Combined Aquaculture and Hydroponic Production Technologies for the Future; Goddek, S., Joyce, A., Kotzen, B., Burnell, G.M., Eds.; Springer International Publishing: Cham, Switzerland, 2019; pp. 113–143. [Google Scholar]
  50. Tang, C.; Kuo, J.; Longnecker, N.E.; Thomson, C.J.; Robson, A.D. High pH Causes Disintegration of the Root Surface in Lupinus angustifolius L. Ann. Bot. 1993, 71, 201–207. [Google Scholar] [CrossRef]
  51. Robles-Aguilar, A.A.; Pang, J.; Postma, J.A.; Schrey, S.D.; Lambers, H.; Jablonowski, N.D. The effect of pH on morphological and physiological root traits of Lupinus angustifolius treated with struvite as a recycled phosphorus source. Plant Soil 2019, 434, 65–78. [Google Scholar] [CrossRef] [Green Version]
  52. Camargo, C.E.D.O.; Ferreira Filho, A.W.P.; Salomon, M.V. Temperature and pH of the nutrient solution on wheat primary root growth. Sci. Agric. 2004, 61, 313–318. [Google Scholar] [CrossRef]
Figure 1. Experimental overview for wheat and Brachypodium growth. Exemplary wheat (left) and Brachypodium (right) images of all three experimental setups 14 DAT from left to right: EcoFABs, hydroponics, and sand (a). Elemental composition of nutrient treatments (b). High P and Low P treatments only differ in P amount while algae content (green) was substituted with mineral nutrients to fill up to 0.5× Hoagland level (black). All treatments received 0.5 mM micronutrients and 6% MES. Timely experimental overview for all three experimental setups indicating timepoints of non-destructive and destructive measurements (c).
Agronomy 12 00285 g001
Figure 2. Leaf area, root length, and biomass of Brachypodium and wheat plants grown in EcoFABs, hydroponics, and sand. Total leaf area (a,d), total root length (b,e), and shoot and root dry weight (c,f) for Brachypodium (ac) and wheat (df) are depicted 21 DAT. Box plots (a,b,d,e) and individual values (c,f) of 5 (EcoFAB, sand) or 9 (hydroponics) independent plants are shown. Significant differences tested via ANOVA with Tukey HSD per growth setup, referring to * p < 0.05, ** p < 0.01, *** p < 0.001.
Agronomy 12 00285 g002
Figure 3. Brachypodium and wheat shoot development over time. Projected leaf area determined non-invasively for Brachypodium (a,b) and wheat (c,d) plants grown in EcoFABs (a,c) or sand (b,d). Mean +/− SE of 5 independent plants are shown. Significant differences tested via ANOVA with Tukey HSD per time point, referring to * p < 0.05, *** p < 0.001.
Agronomy 12 00285 g003
Figure 4. Development of hydroponically-grown Brachypodium and wheat plants over time. Leaf area (a,d), total root length (b,e), and root mass fraction (c,f) of shoot and root (striped) dry weight measured at 7, 14, and 21 DAT for Brachypodium (ac) and wheat (d–f) plants. Bar graphs represent mean +/− SE (n = 3 ∗ 3). Significant differences tested via ANOVA with Tukey HSD per growth setup, referring to * p < 0.05, ** p < 0.01, *** p < 0.001.
Agronomy 12 00285 g004
Figure 5. Detailed root diameter analysis for Brachypodium and wheat plants grown in all three experimental setups. Root diameter of Brachypodium (ac) and wheat (df) grown either in EcoFABs (a,d), hydroponics (b,e), or sand (c,f) setup for 21 DAT. Box plots from 5 (a,c) or 9 (b) independent plants are depicted. Significant differences tested via ANOVA with Tukey HSD per growth setup and root type, referring to * p < 0.05, ** p < 0.01, *** p < 0.001.
Agronomy 12 00285 g005
Figure 6. Detailed root hair analysis for Brachypodium and wheat plants grown in all three experimental setups. Histogram detailing root hair length distribution over all three growth setups and time points. One occurrence = mean root hair length on one root. Significant differences tested via ANOVA with Tukey HSD between treatments, referring to * p < 0.05, *** p < 0.001.
Agronomy 12 00285 g006
Figure 7. Polyphosphate profile and available and unavailable P content of algal biomass (Chlorella vulgaris). Extracted and TiO2-purified polyphosphates resolved via 33% PAGE using indicated mg amounts and imaged under UV light after DAPI staining and de-staining (a). Organic polyphosphates purified from the Arabidopsis mrp5 seeds and InsP6 (Sichem) were used as InsP6, InsP7, and InsP8 standards. Total P from algal biomass and purified polyphosphates (b), measured after a HCl: H₂O₂ digestion via ICP-MS, as mean +/− standard deviation (n = 8). Sequential extraction using either CaCl2, citric acid, phosphatase, or HCl incubation followed by Pi measurement (n = 2) (c).
Agronomy 12 00285 g007
Table 1. Brachypodium P and N content. P and N concentration (conc. in mg/g dry weight) and total P and N (in mg per plant) determined via ICP-OES or elemental analyzer from pooled replicate samples for whole plants or shoot and root tissue; where separation was not possible measurements were not determined (nd).
TissueTreatmentEcoFABHydroponicsSand
P Conc.Total P UptakeN Conc.Total N UptakeP Conc.Total P UptakeN Conc.Total N UptakeP Conc.Total P UptakeN Conc.Total N Uptake
ShootHigh P3.620.0941.90.99ndndndndndndndnd
Algae2.630.0423.60.35ndndndndndndndnd
Low P0.770.0135.00.62ndndndndndndndnd
RootHigh P3.610.0229.90.20ndndndndndndndnd
Algae3.720.0320.20.17ndndndndndndndnd
Low P0.700.0130.80.23ndndndndndndndnd
WholeHigh P3.620.1139.281.183.980.0550.60.611.780.0226.50.29
plantAlgae3.030.0722.350.525.870.0656.80.541.350.0123.70.25
Low P0.750.0233.740.855.960.0851.00.680.900.0122.00.20
Table 2. Wheat P and N content. P and N concentration (conc. in mg/g dry weight) and total P and N (in mg per plant) determined via ICP-OES or elemental analyzer from pooled replicate samples for whole plants or shoot and root tissue. Where replicated measurements were possible (n = 3, depicted as mean ± SE) statistical comparison via one-way ANOVA and Tukey HSD was performed within a system and trait; different letters indicate p < 0.05.
TissueTreatmentEcoFABHydroponicSand
P Conc.Total P UptakeN Conc.Total N UptakeP Conc.Total P UptakeN Conc.Total N UptakeP Conc.Total P UptakeN Conc.Total N Uptake
ShootHigh P5.070.2844.202.469.69 a ± 0.141.58a ± 0.1163.50 a ± 0.6110.33 a ± 0.753.06 A ± 0.210.08 A ± 0.0134.37 A ± 1.170.96 A ± 0.08
Algae4.120.2124.701.288.27 b ± 0.150.84 b ± 0.1159.40 b ± 0.866.04 b ± 0.712.12 A ± 0.410.06 A ± 0.0127.37 B ± 1.340.72 A ± 0.05
Low P2.200.1247.502.522.76 c ± 0.380.30 c ± 0.0364.23 a ± 0.647.20 b ± 0.482.16 A ± 0.070.06 A ± 0.0032.2 A,B ± 1.110.88 A ± 0.06
RootHigh P2.270.0418.900.324.32 a ± 0.430.09 a ± 0.0028.07 a ± 1.750.58 a ± 0.011.36 A ± 0.210.05 A ± 0.0112.53 A ± 0.410.42 A ± 0.03
Algae1.650.0611.100.383.68 a ± 0.380.06 a ± 0.0136.10 b ± 0.470.63 a ± 0.051.08 A ± 0.150.04 A ± 0.019.47 B ± 0.240.39 A ± 0.04
Low P0.650.0216.200.411.05 b ± 0.110.03 b ± 0.0120.73 c ± 1.290.65 a ± 0.081.12 A ± 0.260.04 A ± 0.0110.23 B ± 0.340.40 A ± 0.02
Whole plantHigh P4.420.3238.332.789.08 a ± 0.141.67 a ± 0.1059.45 a ± 0.5510.92 a ± 0.102.12 A ± 0.030.13 A ± 0.0129.83 A ± 1.051.84 A ± 0.01
Algae3.130.2719.241.667.60 b ± 0.120.91 b ± 0.1155.94 b ± 0.546.67 b ± 0.111.48 A ± 0.220.10 A ± 0.0217.18 B ± 1.081.15 B ± 0.02
Low P1.700.1337.452.932.39 c ± 0.290.34 c ± 0.0254.75 b ± 0.597.85 b ± 0.021.54 A ± 0.150.10 A ± 0.0124.27 C ± 0.991.60 A ± 0.01
Publisher’s Note: MDPI stays neutral with regard to jurisdictional claims in published maps and institutional affiliations.

