
Livelihood Diversification Helps Herder Households on the Mongolian Plateau Reduce Emissions: A Case Study of a Typical Pastoral Area


1
Institute of Geographic Sciences and Natural Resources Research, Chinese Academy of Sciences, Beijing 100101, China
2
University of Chinese Academy of Sciences, Beijing 100049, China
*
Author to whom correspondence should be addressed.
Agronomy 2022, 12(2), 267; https://doi.org/10.3390/agronomy12020267
Submission received: 10 November 2021
/
Revised: 13 January 2022
/
Accepted: 18 January 2022
/
Published: 21 January 2022
(This article belongs to the Special Issue Mitigation of Ammonia and Greenhouse Gas Emissions from Livestock Systems)
Abstract
:Environmental issues caused by energy consumption have become increasingly prominent in recent years. In some ecologically vulnerable areas of developing countries, the negative environmental effects caused by farmers’ household energy consumption are closely related to the local (and even global) ecological environment and human health. Taking a typical ecologically vulnerable area of the Mongolian Plateau as an example, we combined a regression model, energy popularity rate, and average energy consumption to explore the impact of livelihood diversification on herder households’ energy consumption structures. We also attempted to quantify the environmental effects of the energy transition in terms of greenhouse gas and air pollutant emissions. The findings show that the average consumption of livestock dung, gasoline, coal, liquefied gas, solar, and wind of livelihood diversification households (LDHs) is lower than that of pure herder households (PHHs), whereas the average consumption of electricity is higher than that of PHHs. As a result, the average emission of CO2 by LDHs is 5.14 t/a lower than that of PHHs. And compared with PHHs, the average emission reductions of air pollutants by LDHs are ranked as follows: CO: 153.20 kg/a, PM10: 36.56 kg/a (including PM2.5: 32.94 kg/a), VOCs: 12.47 kg/a, SO2: 3.14 kg/a, and NOx: 3.06 kg/a. Therefore, livelihood diversification can help herder households on the Mongolian Plateau reduce emissions through energy consumption transitions. Strengthening education (especially language education) can help herder households engage in livelihood diversification. This study provides a scientific means for ecologically vulnerable areas in developing countries to resolve conflicts between farming households’ energy consumption and the environment.
1. Introduction
Alongside economic growth, the human demand for energy has gradually increased [1]. An extensive use of energy can easily lead to damage to the ecological environment [2]. As a result, energy use is closely linked to environmental issues and has become a focus of global concern [3,4,5]. Currently, the proportion of global energy demand due to household energy consumption continues to grow [6], and household energy has become an important source of increased carbon emissions [7,8]. In some areas, the rate of household energy consumption growth has exceeded that of the industrial sector [9]. Household energy consumption behavior is closely tied to regional (and even global) ecological environmental and human health [10,11]. Household energy consumption characteristics are also affected by geographic and cultural factors and show significant spatial and social differences [12,13,14].
The rational use of energy is necessary for rural economic development [15,16]. Biomass energy is one of the main energy sources for rural households in most developing countries [17,18,19]. Especially in many poor and ecologically vulnerable areas, due to limited resources and a lack of livelihood capital, farmers rely on biomass energy (hay, livestock dung, firewood, and straw) for cooking and heating. This dependence has greatly aggravated vegetation destruction and soil erosion problems, and it has had a critical impact on ecological degradation [20].
How can we solve the dilemma of environmental damage caused by the energy consumption of rural households in developing countries? Transitioning to a suitable energy consumption structure is an effective approach [21]. When farmers gradually reduce their dependence on traditional energy sources and increase their use of commercial and clean energy consumption, positive environmental effects will occur [22]. How can we achieve a transition in the energy consumption structure among farmers? Numerous studies have explored the influencing factors of rural household energy consumption and transition using field research and econometric models, and the findings indicate that farmers’ income levels, living areas, education levels, assets, and other factors affect their energy decisions to a certain extent [23,24,25,26,27]. Among these factors, income is central to the transition of rural households’ energy consumption, especially nonagricultural income. For this study, we defined herder households engaged in non-agricultural employment as livelihood diversification households (LDHs), and herder households solely engaged in animal husbandry as pure herder households (PHHs). Whereas non-agricultural employment significantly affects agricultural production [28,29,30,31], it also changes farmers’ energy consumption patterns. For example, Ma revealed that the nonagricultural income of rural households in developing countries is positively correlated with expenditures on clean energy (electricity and natural gas). As the deagriculturalization of rural households increases, such households will become more inclined to use clean energy [32]. Démurger and Wang’s survey of China also showed that non-agricultural income has significantly increased farmers’ spending on durable goods such as household appliances, furniture, and transportation equipment. The addition of these energy-consuming items indirectly affects farmers’ energy consumption structure [33]. Studies have confirmed that diversifying farmers’ livelihoods facilitates energy consumption transition. However, these studies mainly focus on traditional crop farmers, and there is a lack of research on herder households in grasslands. The production methods of animal husbandry and plantations are very different. The energy consumption patterns of grower and herder households are also very different. In exploring the effects of livelihood diversification on energy, the consumption transition of herder households can contribute to research on energy and environmental issues faced in ecologically vulnerable areas. In addition, studies have only qualitatively described the positive environmental effects of livelihood diversification, whereas there is a lack of quantitative research on these outcomes. Quantifying the energy and environmental effects of rural livelihood diversification in developing countries will provide a scientific basis for policy-makers to formulate corresponding sustainable development strategies.
China’s New Barag Left Banner is a typical pastoral area on the Mongolian Plateau, which is located in the southeastern part of the plateau. It is both an ecologically functional and ecologically vulnerable zone [34]. Grassland is the main ecosystem in New Barag Left Banner, and pastoralism is the chief method of production [35]. Due to the high latitude and altitude of the plateau and low temperatures in the winter, local residents have to consume a considerable amount of energy for heating. Biomass, coal, and other high-emission energy sources are widely used due to their low costs and accessibility, but they pose challenges to local air quality and global climate change [13,36]. The ecological environment of the Mongolian Plateau has been seriously degraded, and governments of various countries have actively taken countermeasures [37,38]. The grassland ecological compensation policy in China serves as an example of government to providing subsidies to promote the transition of local pastoralism. Under the guidance of such policies, many herder households have reduced their livestock numbers. Some herder households have also dedicated their surplus labor to other jobs, gradually forming livelihood diversification to cope with the challenges of ecological environment degradation [39,40,41]. Since the Mongolian Plateau plays an important role in global climate change and ecological environment improvement [42,43], we examined New Barag Left Banner to explore the impact of livelihood diversification on the energy consumption transitions of herder households on the Mongolian Plateau, and we attempted to quantify the resulting environmental effects.
2. Materials and Methods
2.1. Study Sites
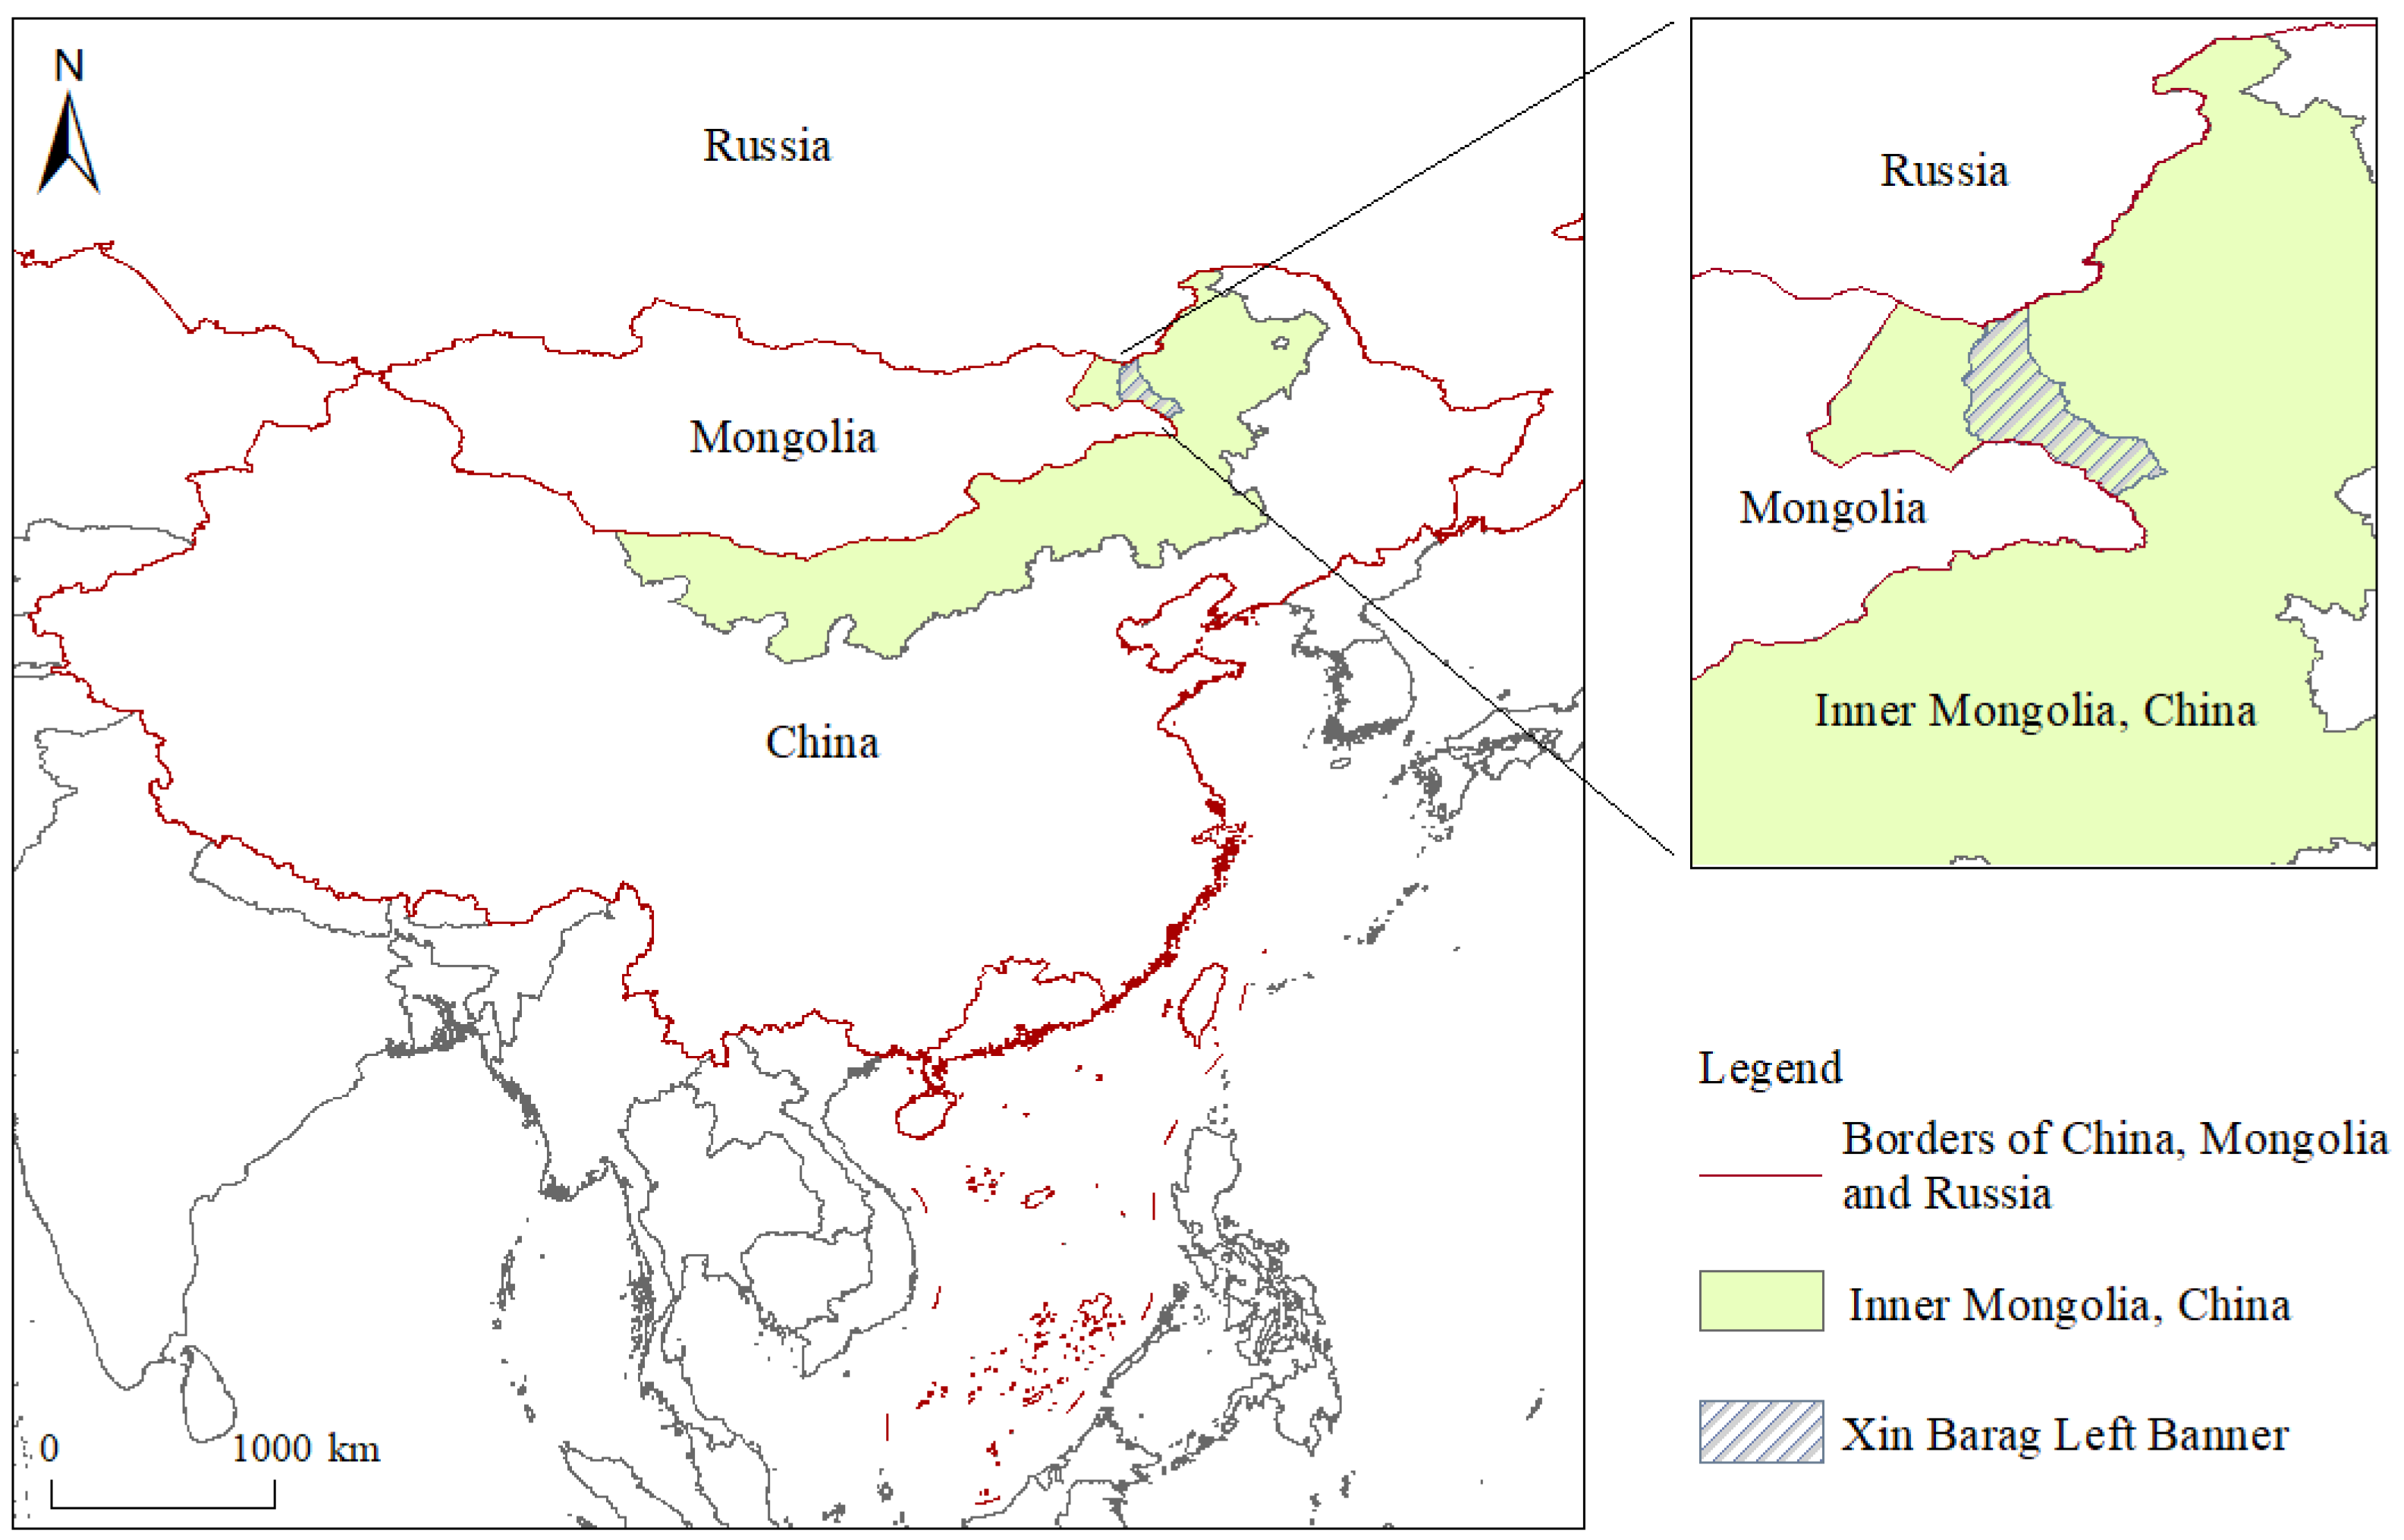
This study takes New Barag Left Banner, Inner Mongolia Autonomous Region, China as the research area. (Figure 1). New Barag Left Banner (E117°33′–120°12′ and N47°10′–49°47′) is located on the southeast border of the Mongolian Plateau and borders Russia along the Argun River to the north and Mongolia to the southwest. We selected this location for the following three reasons. First, New Barag Left Banner covers 22,200 km2, of which more than 80% is grassland. In 2016, the Chinese government recognized it as one of the first national key ecological function areas. Despite having important ecological value, it has become a typical ecologically vulnerable area due to low precipitation levels (approximately 300–400 mm/a), long snow seasons (approximately 140 days/a), and long-term overgrazing. Second, the total population of New Barag Left Banner is 41,813, of which 68.6% are rural residents (mainly herder households). The region is thus a typical pastoral area. These characteristics provide us with the basic conditions for studying the livelihood and energy consumption of herder households. Third, the annual average temperature in New Barag Left Banner is 0.2 °C. The long and harsh local winter conditions create a higher energy demand for heating. Additionally, abundant mineral resources and unique nomadic methods of production have rendered traditional energy sources, such as fossil fuels (coal and gasoline) and biomass (livestock dung), as the primary local energy sources. In summary, based on its three typical characteristics in terms of ecological value, methods of production, and energy use, we selected New Barag Left Banner as our research area.
2.2. Data Acquisition
The research team traveled to New Barag Left Banner to conduct the study during April and May 2020. We first interviewed local government staff to better understand the circumstances of the ground. With their help, we used random sampling to send survey questionnaires to herder households. The sample households covered every town in the entire banner (Amugulang Town, Cuogang Town, Ganzhuer sumu, New Baolige sumu, Wubuerbaolige sumu, Jibuhulangtu sumu, and Handagai sumu, for a total of 7 towns/sumus); the sample for each township was proportional to its total number of herder households. Finally, we obtained a total of 203 valid questionnaires. These 203 respondents came from 39 different villages/gachas in New Barag Left Banner (for a total of 71 villages/gachas in the whole banner). The distributions of income and livelihood types of the sample households are similar to the actual local situation we learned about during the interviews (Table 1). Therefore, the sample households can represent the overall circumstances of New Barag Left Banner to a certain extent.
The questionnaire included three sections. The first section focused on basic information on herder households, including current household sizes, education and income levels. The second section focused on livelihood status and specifically whether households engaged in other sectors in addition to animal husbandry and could be categorized under livelihood diversification. The last section focused on energy consumption. The goal was to understand the energy types, uses, and consumption levels of the herder households for a year.
2.3. Methodology
2.3.1. Method
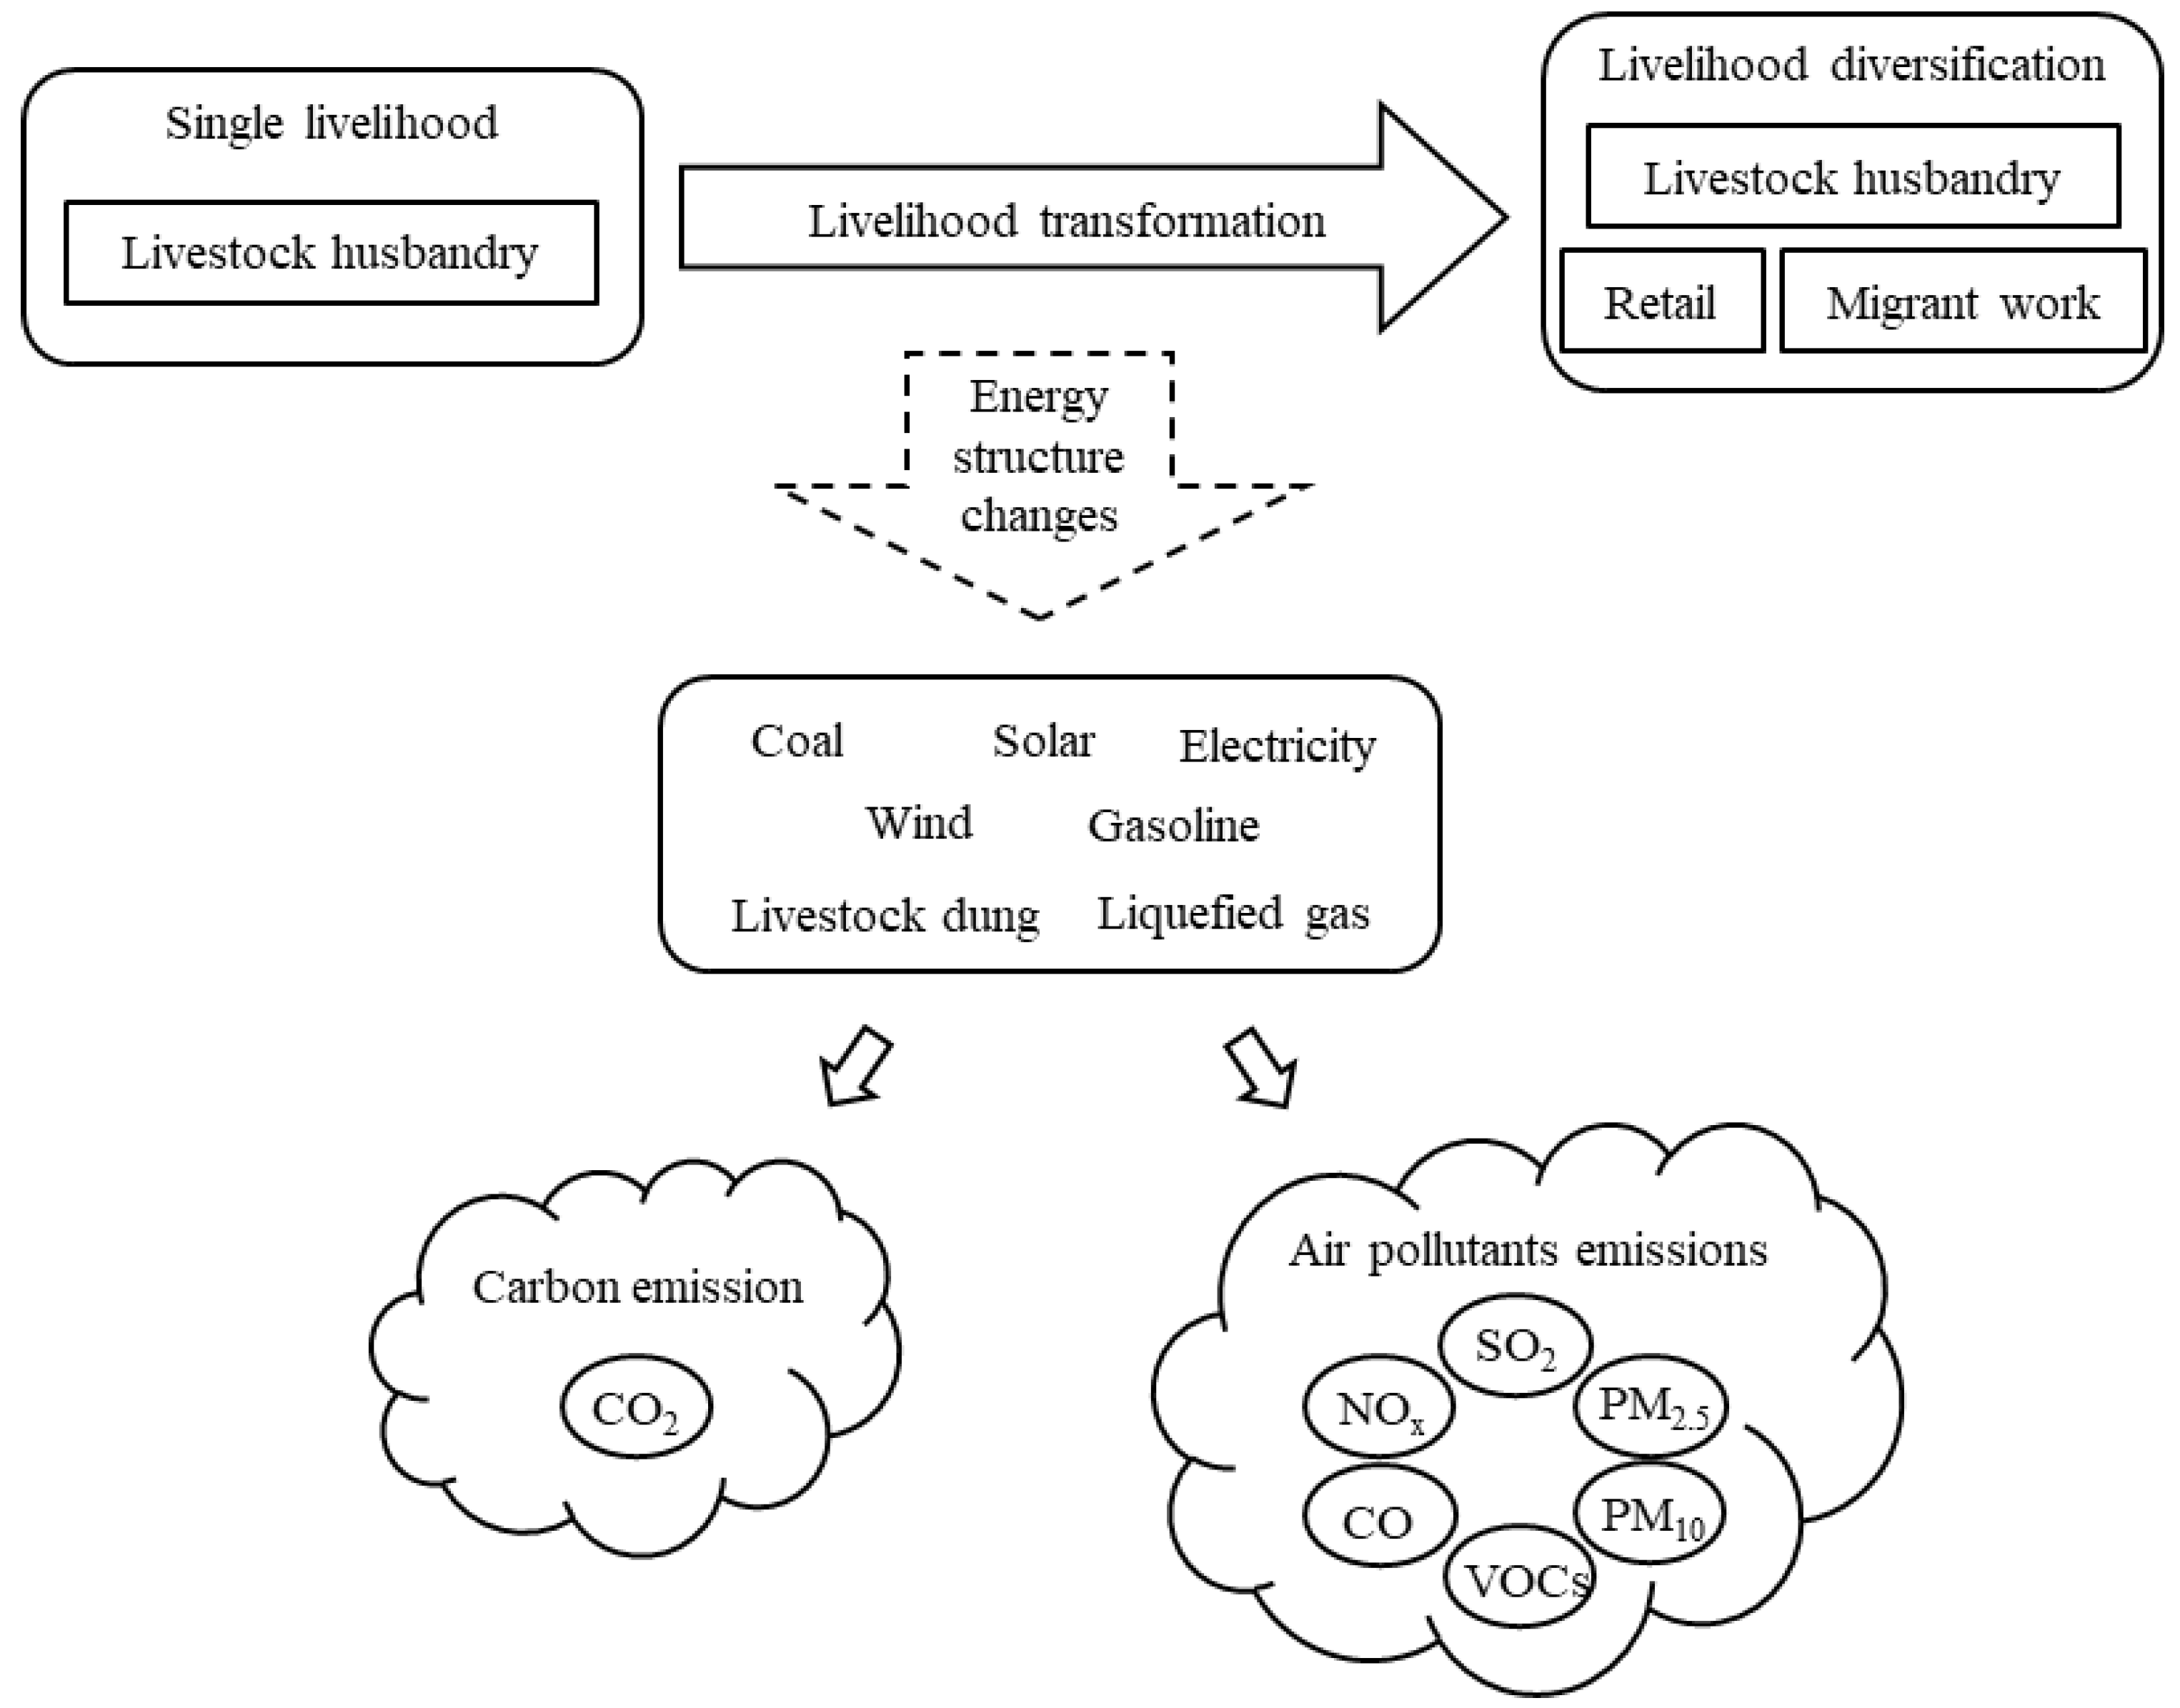
We explored the impact of livelihood diversification on the energy consumption transitions of herder households on the Mongolian Plateau and quantified the resulting environmental effects. During the survey, we found that since 2011, China’s grassland ecological compensation policy strictly limits the number of herder households’ livestock while providing subsidies to them in New Barag Left Banner. Under the combined influence of the policy and other factors, some herder households began to enter the retail industry or let young laborers come to work in towns while retaining restricted livestock production. These circumstances created livelihood diversification. For this study, we combined a regression model, energy popularity rate, and average energy consumption to explore the impact of livelihood diversification on herder households’ energy consumption structures, and then quantified the resulting environmental effects based on energy emission factors (Figure 2).
2.3.2. Impact of Livelihood Diversification on the Energy Consumption Structure of Herder Households
We examined two types of herder households: Pure herder households (PHHs) and livelihood diversification households (LDHs). Thus, we used a binomial logistic regression model to explore the correlations between different livelihood types and various kinds of energy consumption. The equation used is as follows:
In the equation, is the probability of herder household i forming a diversified livelihood; is the variable of herder household i’s consumption of the kth type of energy; is the estimated parameter value corresponding to the kth type of energy; n is the number of energy types; is the intercept; and μ is a random variable.
In addition, we describe the results of the energy consumption transition through the popularity and average consumption of various types of energy sources by herder households.
2.3.3. Environmental Effects of the Energy Consumption Structure Transition
Changes in the consumption of different kinds of energy will affect the emissions of greenhouse gases and air pollutants. We used the equivalent factor of pollutant emissions to calculate the difference in emissions. Among the greenhouse gases, we selected CO2 due to its internationally recognized high contribution to the greenhouse effect. Air pollutants in this study include sulfur dioxide (SO2), nitrogen oxides (NOX), carbon monoxide (CO), volatile organic compounds (VOCs), inhalable particulate matters (PM10), and fine inhalable particulate matters (PM2.5). The calculation formula for the mass of the above emissions is as follows:
In the formula, is the mass of emission from energy consumption by the herder households; is the mass of the kth type of energy consumed by the herder households; and is the the emission factor of pollutant corresponding to the kth type of energy.
3. Results
3.1. Livelihood Diversification of Herder Households Improves the Energy Consumption Structure
Through the interviews and questionnaire surveys, we learned that the energy consumed by the 203 sampled herder households in New Barag Left Banner includes livestock dung, coal, gasoline, electricity, liquefied gas, solar and wind (Table 2). Regarding the consumption of electricity, liquefied gas, gasoline, and coal, we calculated it based on the fees paid by the herdsmen within a year. As most herder households do not have detailed statistics on the amount of livestock dung collected every year, we defined the consumption of livestock dung as a range variable, and estimated it based on households’ daily collection volume and the length of their use each year. Similarly, due to the simple equipment, it is difficult to quantify the specific consumption of solar and wind energy. In the survey, we only judged whether the herder households consumed these two kinds of energy by equipment usage. Among these energy sources, livestock dung and coal are mainly used for indoor heating in the autumn and winter. Livestock dung is mostly collected outdoors, and coal needs to be purchased. Gasoline is used for automobile transportation and agricultural equipment. Electricity (from sources such as the electrical grid, solar and wind) is primarily used for electrical appliances in daily life. Liquefied gas is chiefly used for cooking.
Under the combined influence of public policies and other natural and social factors, 54 of the 203 sampled herder households have formed livelihood diversification. The results of the binomial logistic regression show that livelihood diversification among the sampled herder households is inversely correlated with the consumption of livestock dung, coal, gasoline, and solar (the significance level of gasoline reaches 0.1, and that of solar energy reaches 0.05), whereas it is positively correlated with the consumption of electricity, liquefied gas, and wind (the significance level of electricity reaches 0.05). The findings indicate that, to a certain degree, with the formation of livelihood diversification in herder households, their consumption of livestock dung, coal, gasoline, and solar has a tendency to decrease, and their consumption of electricity, liquefied gas, and wind has a tendency to increase (Table 3).
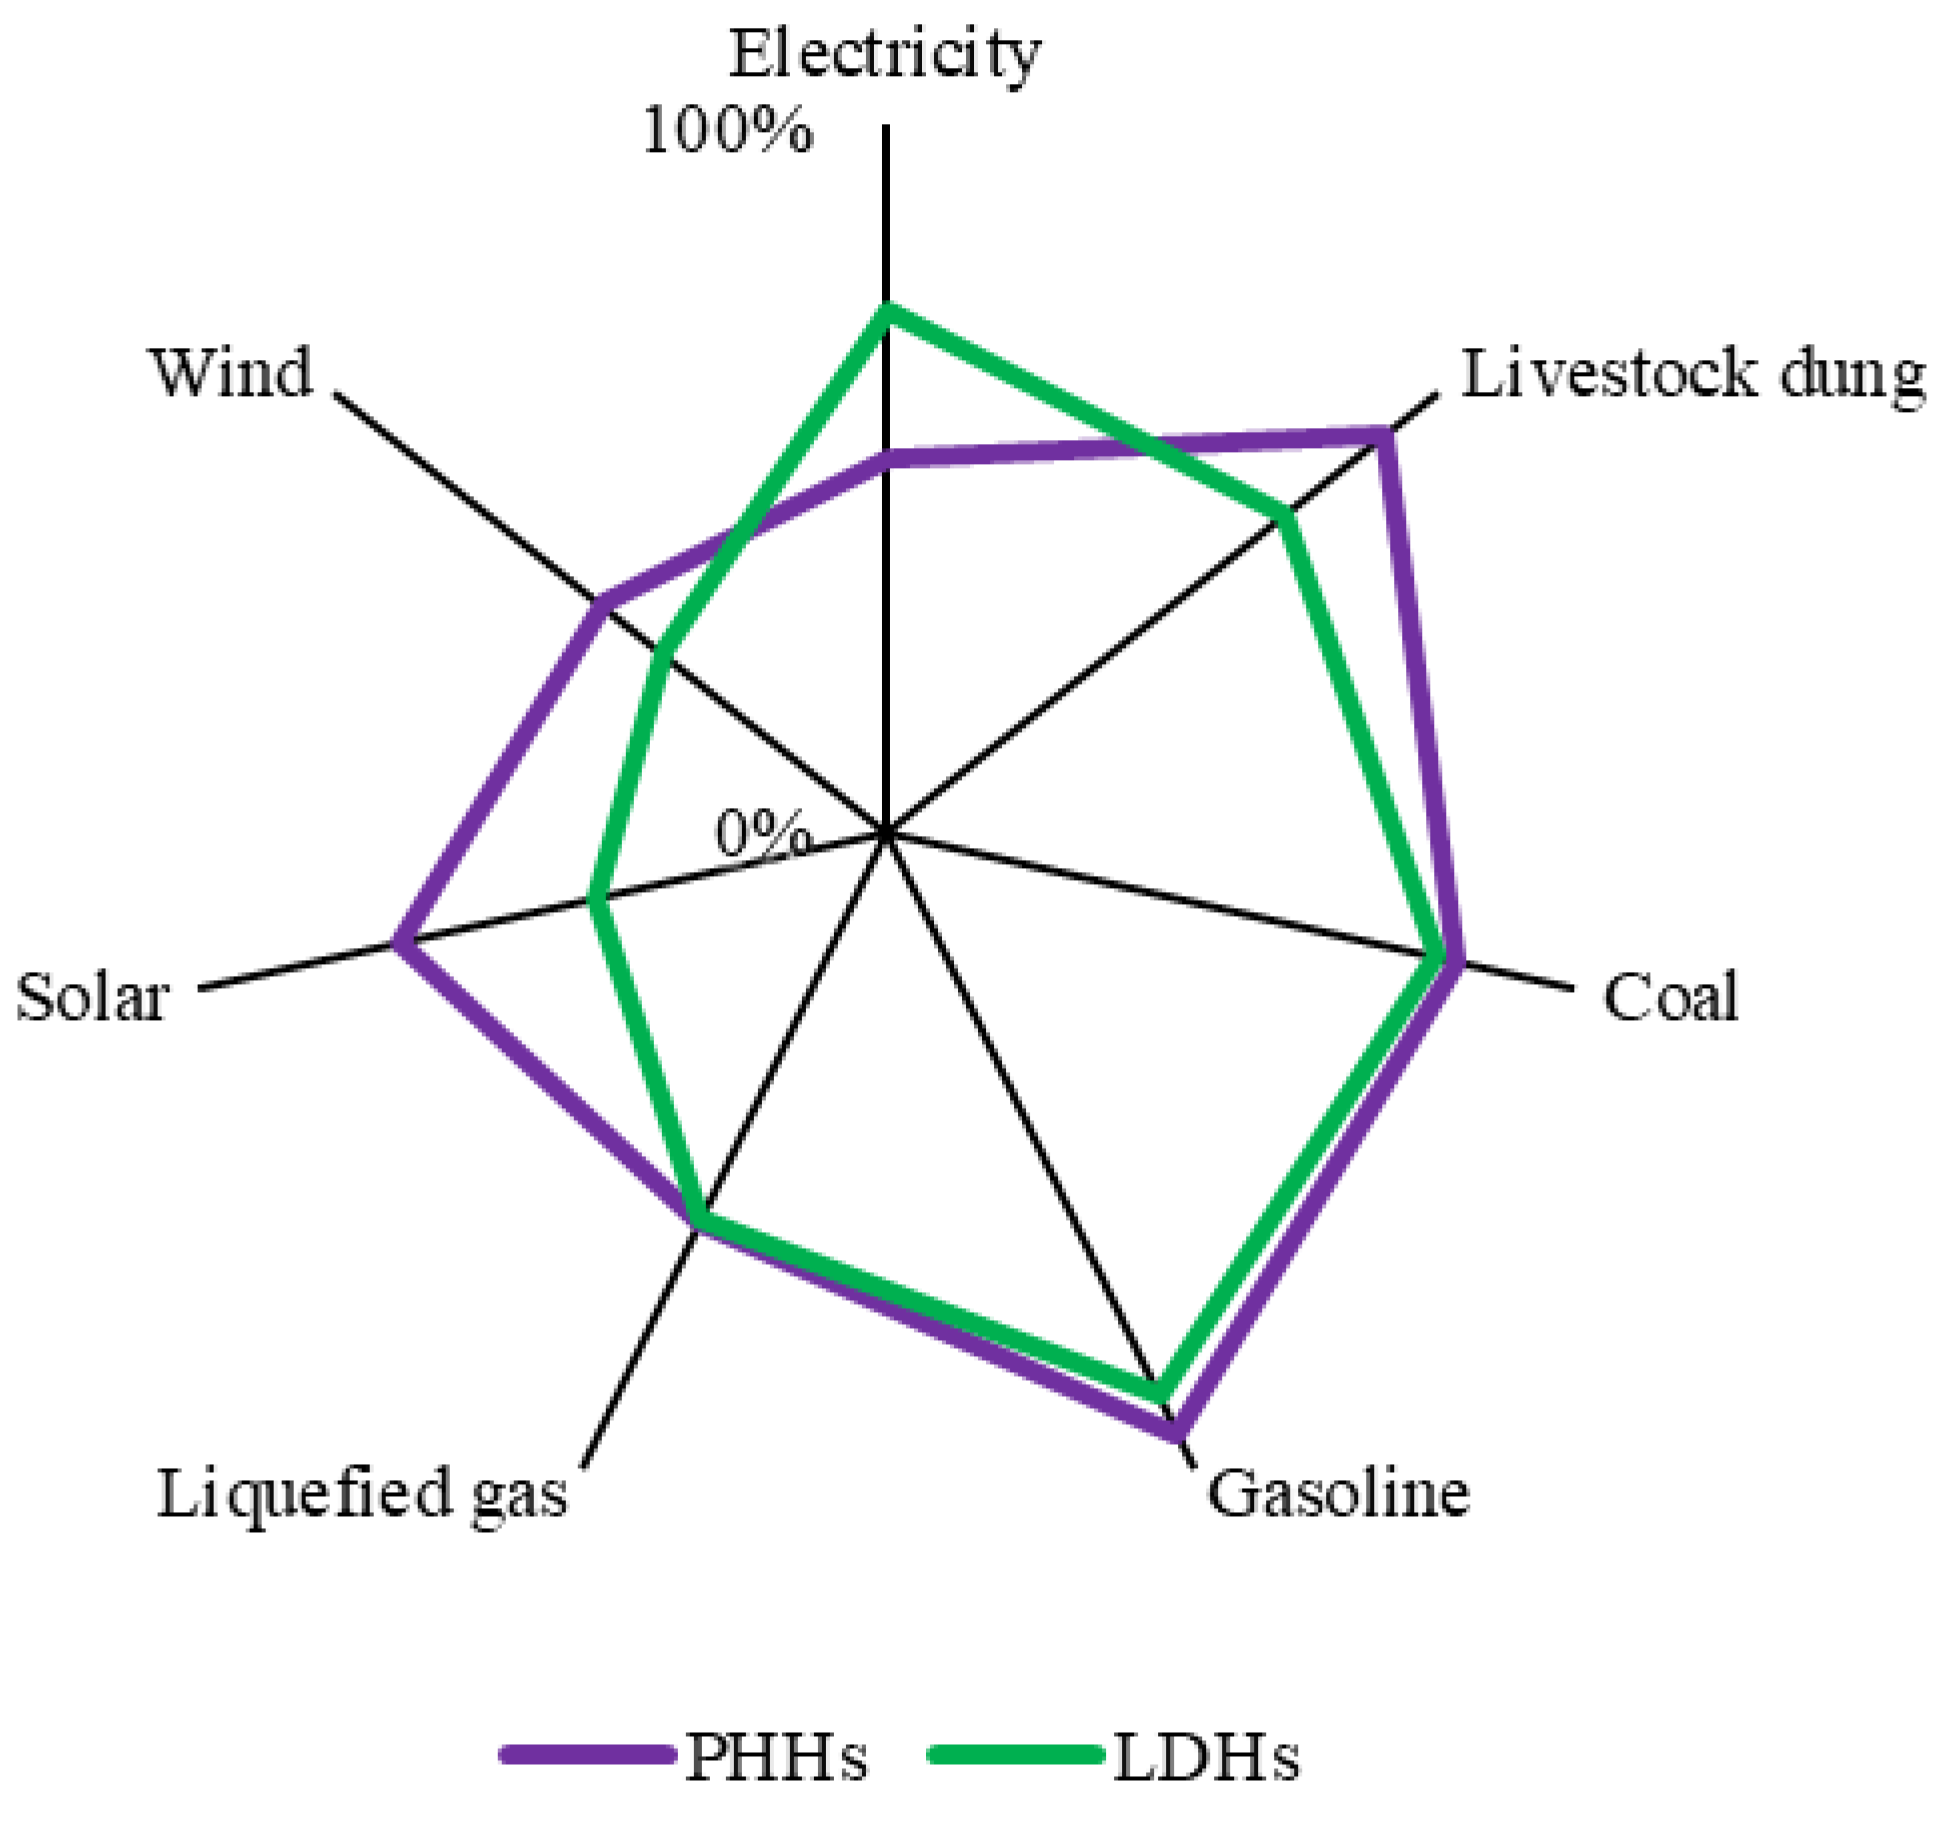
Regarding the popularity of various energy sources consumed by the two types of herder households (Figure 3), excluding electricity, the other six energy sources are less popular among LDHs than among PHHs. The changes in electricity and solar are the most obvious. Electricity is 21.05% more popular among LDHs than among PHHs, whereas the popularity of solar is 28.55% lower among LDHs. This is because the Chinese government started the Village-to-Village project in 2004, and full access to electricity in villages is one of its main goals. From the implementation of the project, most of the towns and villages in New Barag Left Banner are now connected to the electrical grid. To ensure that every household has access to electricity, the government has funded the construction of solar facilities for residents not connected to the grid. Most of these residents are PHHs in remote pastoral areas. With the formation of livelihood diversification, some PHHs moved into town or rural settlements (areas connected to the grid), and solar was replaced by the electrical grid. Some of the abandoned solar infrastructure was wind-solar combined equipment, causing the popularity of wind among LDHs to decline by 10.94%. In addition, the popularity of livestock dung for diversified livelihood herders has also been reduced by 17.77%. This shows that when herder households form livelihood diversification, livestock dung is also an easily replaceable energy source. For coal, gasoline, and liquefied gas, the gap in their popularity is relatively small.
According to China’s General Principles for the Calculation of Comprehensive Energy Consumption (GB/T 2589-2020) [44] and related research [45], we converted the annual consumption of each type of energy used by the sampled herder households into a standard unit (coal equivalent) (Table 4).
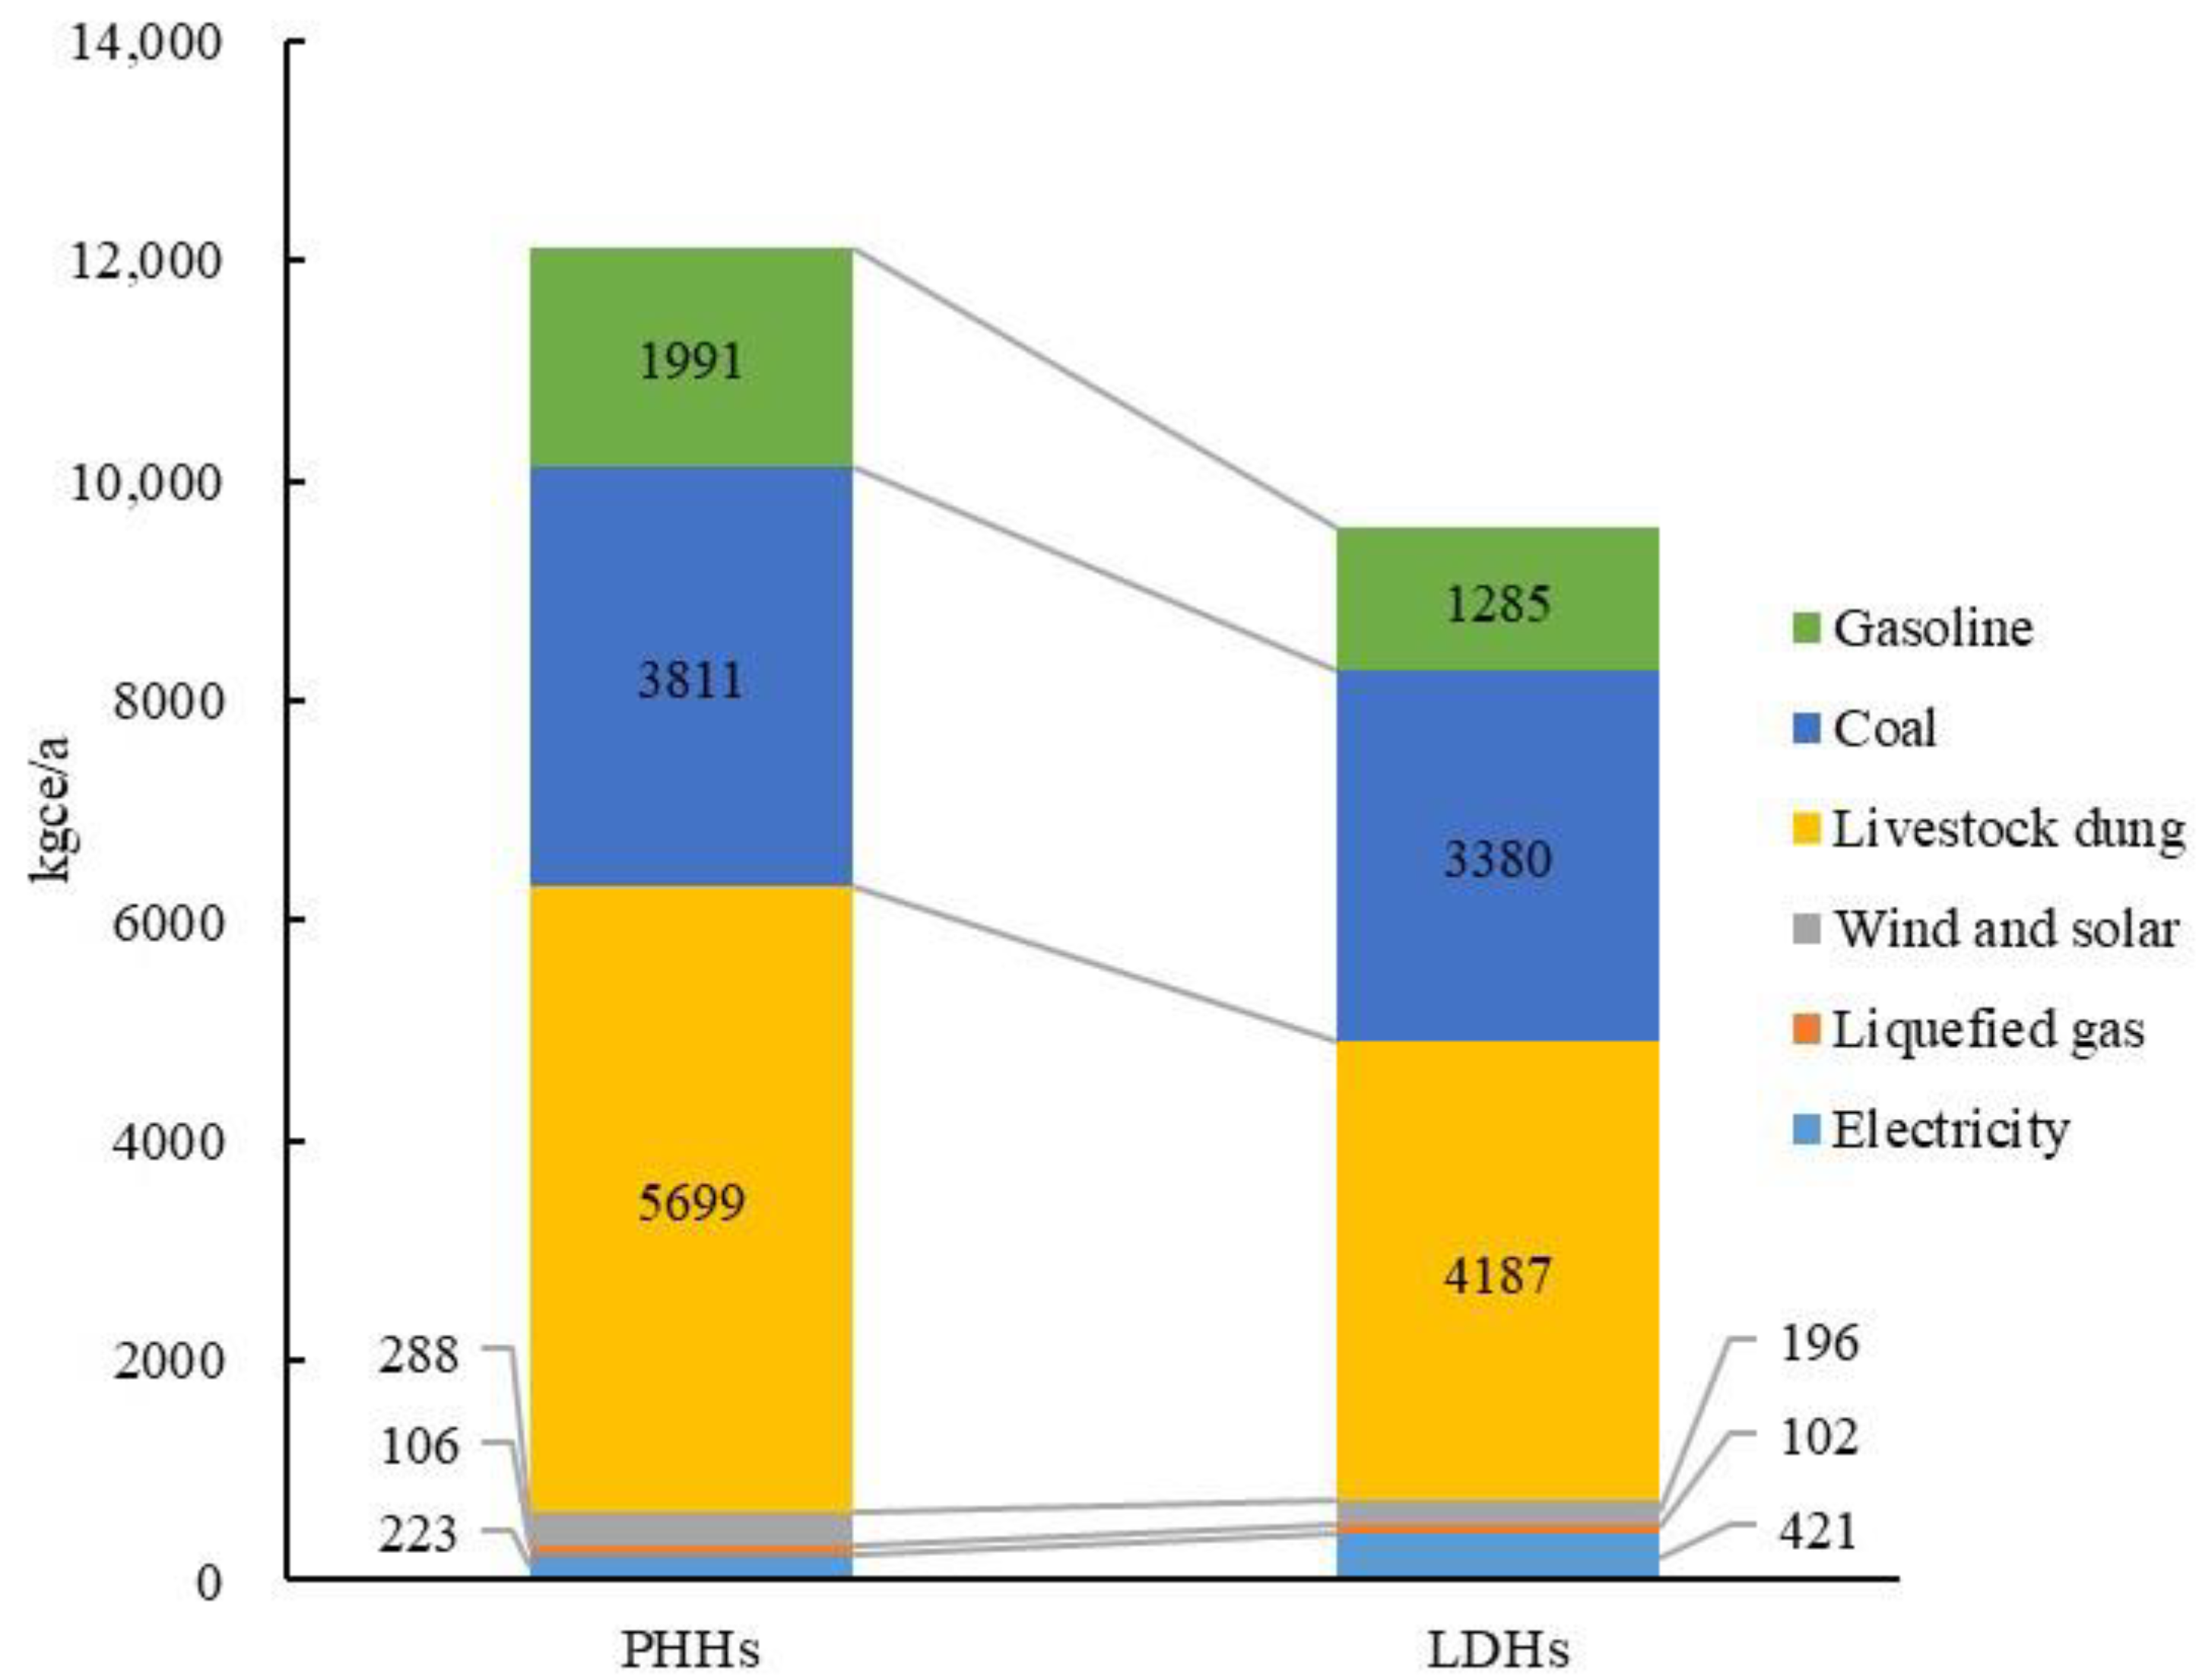
Combining the energy consumption of herder households (Table 2) and the coal equivalent coefficient (Table 4), we obtained the average energy consumption of the two types of herder households. The consumptions of coal, gasoline, liquefied gas, and electricity are obtained by direct calculation. As solar and wind are difficult to quantify and they are often used as an alternative to electrical grid power, the average level of electricity consumption by herder households connected to the electrical grid is used instead. The livestock dung is measured as a range variable, and the median is used instead. Finally, the overall energy consumption structure of the sample households (livestock dung: 5297 kgce/a, coal: 3696 kgce/a, gasoline: 1803 kgce/a, liquefied gas: 105 kgce/a, electricity: 275 kgce/a, solar and wind: 264 kgce/a) and the respective energy consumption structures of the two types of households (Figure 4) are obtained.
Results show that livestock dung, coal, and gasoline are the main forms of energy consumed by herder households, accounting for 94.37% of total energy consumption. Livestock dung is the energy source most used by the herder households, comprising 47.03% of the energy consumption of PHHs and 43.75% of that of LDHs. Compared to PHHs, the consumption of the three central energy sources by LDHs has decreased. Among the three energy sources, gasoline consumption shows the greatest decline at 35.46%. This is the case because diversified livelihood herder households perform less work in the pastoral area than PHHs. As transport time has shortened, the use of agricultural machinery has also fallen, so the demand for gasoline has decreased. The consumption of livestock dung decreased by 26.53% because after some PHHs formed livelihood diversification, the reduction in livestock production made it more difficult to collect livestock dung. The relocation of their residences has also allowed these households to gradually phase out the use of poorly insulated yurts, reducing their consumption of livestock dung. For coal, since it is inexpensive, easily available, and efficient, the two types of herder households exhibit relatively stable demand for it, and the difference in consumption is not obvious.
3.2. Livelihood Diversification of Herder Households Helps Reduce emissions
In the process of energy generation and consumption, large amounts of CO2 and air pollutants are produced. Combining relevant data platforms, government work reports, and scholars’ research conclusions, we have listed CO2 emissions inventories from the energy used by sample herder households (Table 5). Specifically, the emission factors for thermal power generation and coal mining come from the IPCC official website [46]. The consumption emission factors of coal, gasoline, and liquefied gas come from the Building Carbon Emission Calculation Standards promulgated by Ministry of Housing and Urban-Rural Development of the People’s Republic of China [47]. Based on the work of related scholars [48,49], we used 80 kgoe/t as the unit of energy consumption for oil refining and gas refining, then through calculation, we obtained the CO2 emission factors of gasoline and liquefied gas during the production process. Finally, we obtained the CO2 emission factor for livestock dung consumption from related research [50]. Due to the relatively small emissions, we ignored the CO2 emissions from electricity consumption, livestock dung production, and wind/solar equipment.
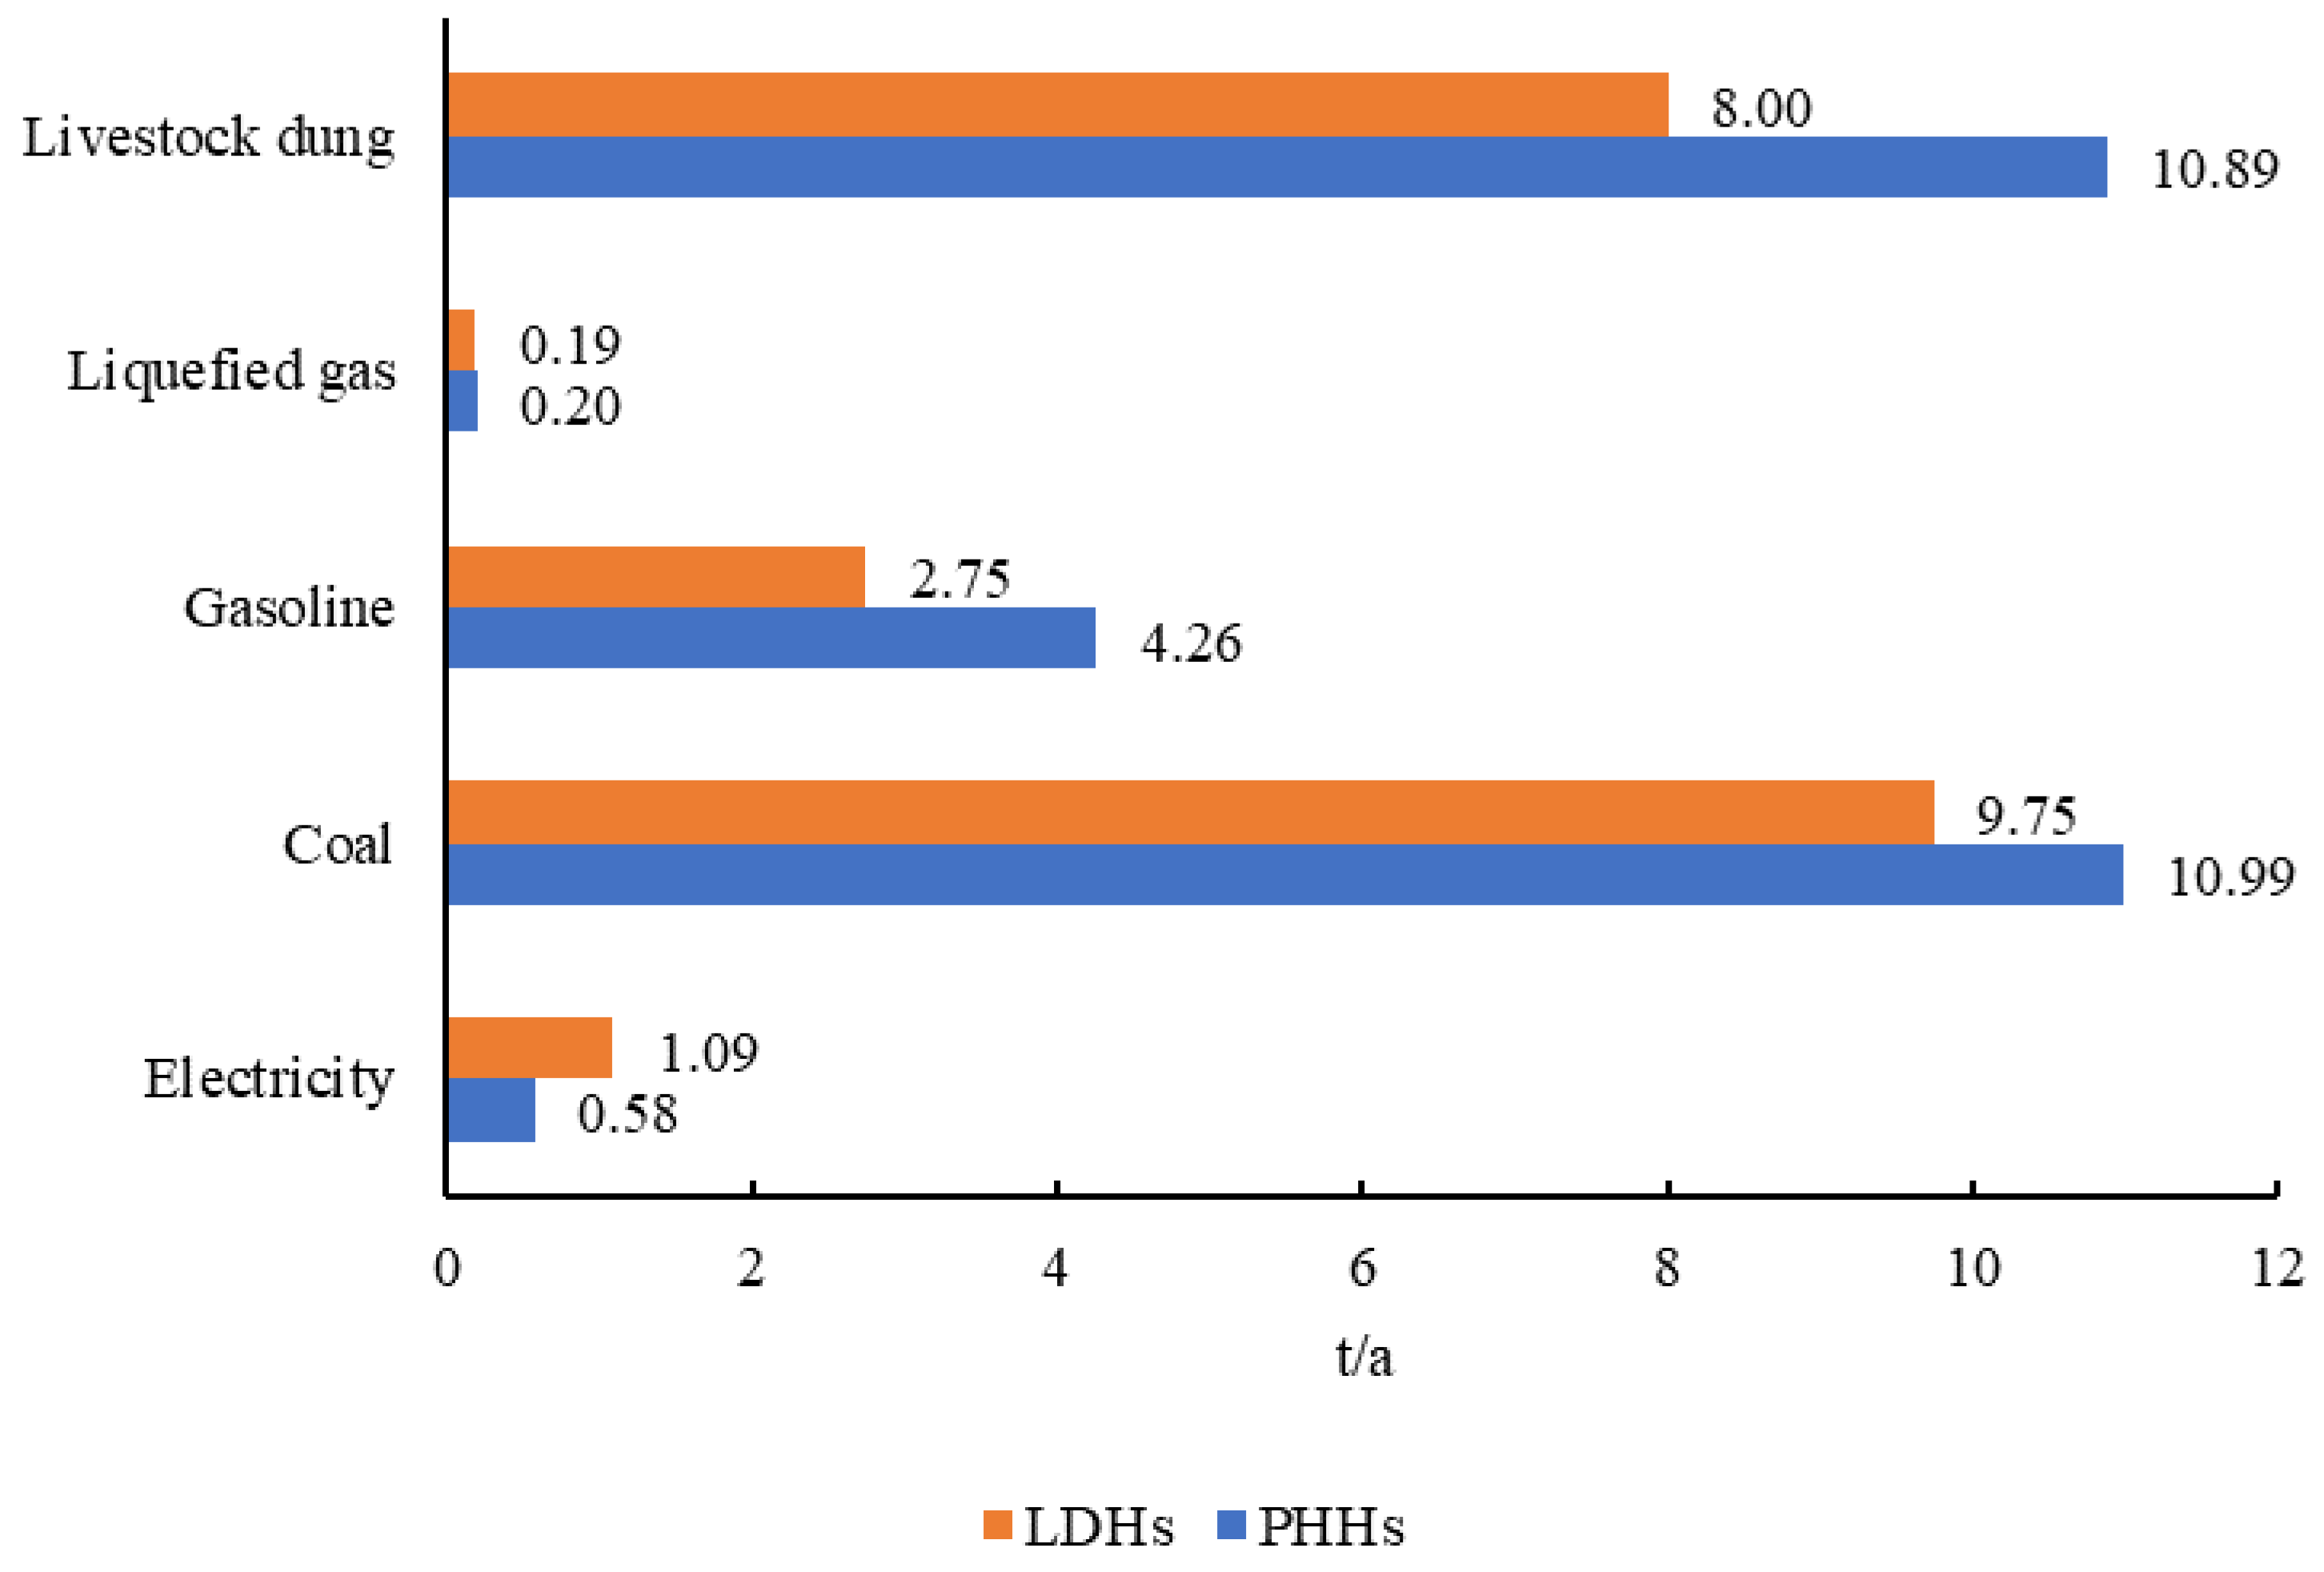
According to the statistics, the average consumption levels of the five energy sources by the sampled PHHs are 12.10 t/a of livestock dung, 5.34 t/a of coal, 1.35 t/a of gasoline, 60 kg/a of liquefied gas, and 1811 kW·h of electricity. The average consumption levels of the five energy sources by the sampled LDHs are 8.89 t/a of livestock dung, 4.73 t/a of coal, 0.87 t/a of gasoline, 58 kg/a of liquefied gas, and 3426 kW·h of electricity. Based on the emissions inventory, we calculated the CO2 emissions of the two types of herder households (Figure 5). The average CO2 emissions of the sampled herder households’ energy consumption reach 25.56 t/a. A total of 41.71% of the CO2 comes from coal, 39.60% comes from livestock dung, 15.10% comes from gasoline, 2.8% comes from electricity, and 0.78% comes from liquefied gas. The average CO2 emissions of LDHs are 5.14 t/a lower than those of PHHs. Specifically, the emissions from livestock dung decrease by 2.89 t/a, the emissions from liquefied gas decrease by 0.01 t/a, the emissions from gasoline decrease by 1.51 t/a, the emissions from coal decrease by 1.24 t/a, and the emissions from electricity increase by 0.51 t/a.
For the emissions of air pollutants, we only considered the energy consumption stage. As electricity, liquefied gas, wind, and solar emit fewer air pollutants during the consumption process and account for a fairly small share of the energy consumption of households, our study only covers coal, livestock dung, and gasoline. According to Technical Guidelines for the Compilation of an Air Pollutant Emission Inventory of Civil Coal (Trial), Technical Guidelines for the Compilation of an Air Pollutant Emission Inventory of Biomass Combustion Sources (Trial), Technical Guidelines for the Compilation of an Air Pollutant Emissions Inventory of Road Motor Vehicles (Trial) and Technical Guidelines for the Compilation of an Air Pollutant Emissions Inventory of Non-road Mobile Sources (Trial) [51] issued by the Ministry of Ecology and Environment of the People’s Republic of China, we compiled an air pollutant emissions inventory for the abovementioned three energy sources (Table 6).
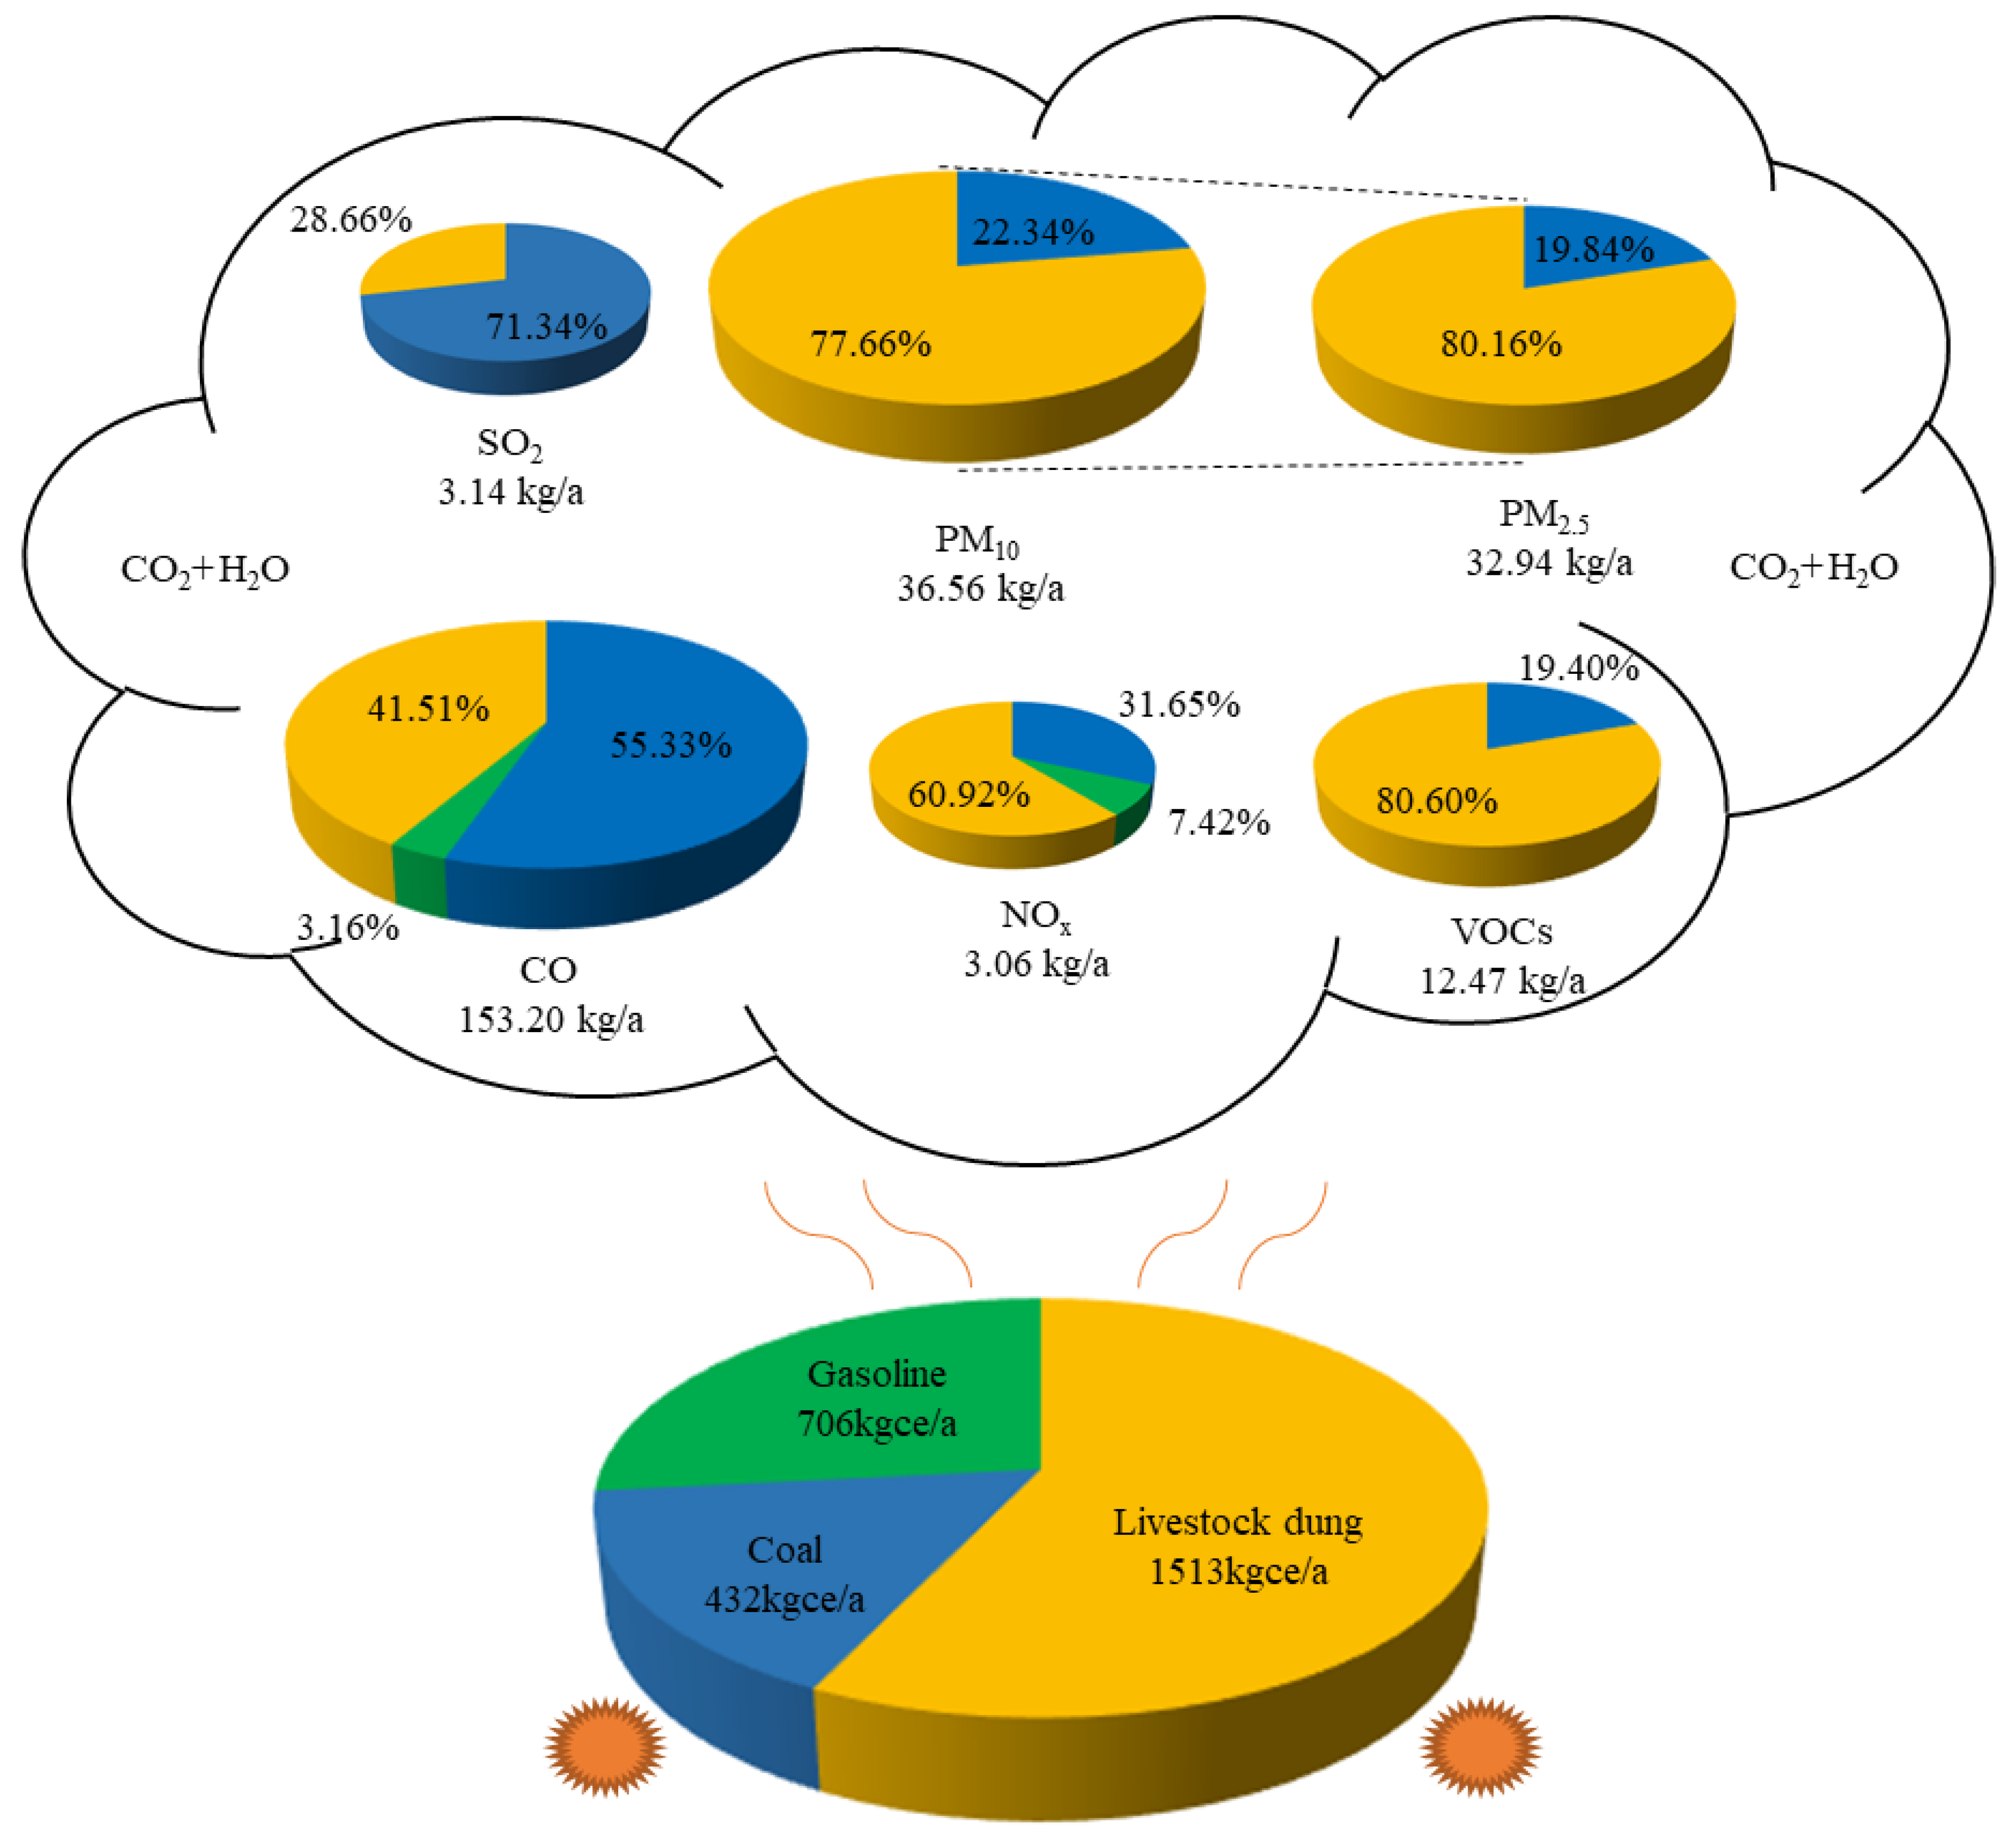
Compared with PHHs, LDHs reduce the consumption of these three energy sources by 1513 kgce/a of livestock dung, 706 kgce/a of gasoline, and 432 kgce/a of coal. The emission reductions of air pollutants by LDHs compared to those of PHHs are as follows: CO: 153.20 kg/a, PM10: 36.56 kg/a (including PM2.5 32.94 kg/a), VOCs: 12.47 kg/a, SO2: 3.14 kg/a, and NOx: 3.06 kg/a (Figure 6). CO is harmful to human health [52,53] and is the air pollutant most heavily generated through energy consumption among the sampled herder households. The CO emissions per unit mass of coal and livestock dung consumption are higher than those of gasoline, especially for coal, whose CO emission factor is approximately 15 times that of gasoline. Thus, although the reduction of coal consumption by LDHs compared to that of PHHs only accounts for 16.30% of the reduction of the three energy sources, the CO reduction of coal accounts for 55.33% of the total reduction. Moreover, for developing countries that are rapidly advancing in terms of industrialization, PM10 and PM2.5 are indicators of great concern in the atmospheric environment. PM2.5, considered the main component of air smog, is becoming a common problem faced by many developing countries [54]. In this study, we found PM10 (including PM2.5) to be the second most abundant air pollutant produced through energy consumption among the sampled herder households, following only CO. Unlike what we found for CO, the reduction of PM10 (including PM2.5) among LDHs, compared to PHHs, mainly comes from the reduction in the use of livestock dung. This is the case because the difference between the PM10 and PM2.5 emission factors of livestock dung and coal is relatively small, whereas the reduction of livestock dung consumption by LDHs, compared to PHHs, is approximately 3.50 times the reduction of coal.
PM10 and PM2.5 produced by gasoline consumption in this study represent less than 1% of the production by livestock dung or coal and are therefore ignored.
4. Discussion
Previous studies have found that livelihood diversification can help increase the proportion of clean energy consumption among growers [32,33]. We draw the similar conclusion for herder households. On this basis, we quantified the environmental effects of herder households’ energy consumption transition through the equivalent factor of material emissions of the energy consumption.
Livelihood diversification can indeed help herder households on the Mongolian Plateau reduce emissions, but in research, only 26.6% of the sample households have undergone livelihood diversification. Therefore, how can this proportion be expanded to obtain greater environmental effects? The transformation of rural households’ livelihoods is mainly affected by public policies, the natural environment, and livelihood capital [55]. Regarding public policies, as mentioned in the Introduction and Section 2.3, China has implemented a grassland ecological compensation policy. This policy has helped many households to form livelihood diversification. As for the natural environment, it is difficult for us to change. Hence, we want to emphasize promoting the livelihood diversification of herder households by enhancing their livelihood capital.
The change of livelihood capital, especially the improvement of human capital (the number of people in the labor force and education level), can foster the formation of livelihood diversification [56,57]. In this study, 43.8% of the sampled households have the highest education levels of primary school or junior high school. These levels of education make it difficult for them to eliminate dependence on traditional animal husbandry to engage in new jobs. In addition, most households in the study area are ethnic minorities in China. The language barrier between them and the outside also limits the formation of livelihood diversification. Hence, the local government should enhance the human capital of herdsmen by strengthening education, especially language education. This will provide them with conditions for jobs other than animal husbandry.
Finally, this study has limitations. First, we quantified the environmental effects of livelihood diversification among herder households based on the literature and emission inventories provided by government agencies. These data may deviate from actual local conditions. Second, as many emission mechanisms are not clear, the air pollutant emissions calculated in this study only consider the consumption process. Therefore, we look forward to more specific, accurate, and multidimensional energy and environmental research in the future.
5. Conclusions
Taking a typical ecologically vulnerable area of the Mongolian Plateau as an example, we combined a regression model, energy popularity rate, and average energy consumption to explore the impact of livelihood diversification on herder households’ energy consumption structures. We also attempted to quantify the environmental effects of the energy transition in terms of greenhouse gas and air pollutant emissions. The average consumption of livestock dung, gasoline, coal, liquefied gas, solar, and wind energy of LDHs is lower than that of PHHs, whereas the average consumption of electricity is higher than that of PHHs. As a result, the average emission of CO2 by LDHs is 5.14 t/a lower than that of PHHs. And compared with PHHs, the average emission reductions of air pollutants by LDHs are ranked as follows: CO: 153.20 kg/a, PM10: 36.56 kg/a (including PM2.5 32.94 kg/a), VOCs: 12.47 kg/a, SO2: 3.14 kg/a, and NOx: 3.06 kg/a. Hence, livelihood diversification can help herder households on the Mongolian Plateau achieve emissions reduction via energy consumption transition. Strengthening education (especially language education) can help herder households to form livelihood diversification.
Author Contributions
Conceptualization, M.L.; methodology, M.L.; software, Z.L.; formal analysis, Z.L.; investigation, Z.L.; resources, M.L.; data curation, Z.L.; writing—original draft preparation, Z.L.; writing—review and editing, M.L.; supervision, M.L.; project administration, Z.L.; funding acquisition, M.L. All authors have read and agreed to the published version of the manuscript.
Funding
This work was jointly supported by the National Natural Science Foundation of China (grant 42171279) and the Mobility Programme DFG-NSFC (grant M-0342).
Institutional Review Board Statement
Not applicable.
Informed Consent Statement
Not applicable.
Data Availability Statement
Most of the data are available in all tables and figures of the manuscripts. If scholars need more specific data, they can send an email to the corresponding author or the first author.
Acknowledgments
The authors appreciate the government staff of New Barag Left Banner for their help in the questionnaire survey.
Conflicts of Interest
Authors would hereby like to declare that there is no conflict of interest for the article.
References
- Soytas, U.; Sari, R. Energy consumption and GDP: Causality relationship in G-7 countries and emerging markets. Energy Econ. 2003, 25, 33–37. [Google Scholar] [CrossRef]
- Li, F.; Dong, S.; Xue, L.; Liang, Q.; Yang, W. Energy consumption-economic growth relationship and carbon dioxide emissions in China. Energy Policy 2011, 39, 568–574. [Google Scholar] [CrossRef]
- Sherman, P.; Chen, X.; McElroy, M. Offshore wind: An opportunity for cost-competitive decarbonization of China’s energy economy. Sci. Adv. 2020, 6, eaax9571. [Google Scholar] [CrossRef] [Green Version]
- Eom, J.; Hyun, M.; Lee, J.; Lee, H. Increase in household energy consumption due to ambient air pollution. Nat. Energy 2020, 5, 976–984. [Google Scholar] [CrossRef]
- Carter, E.; Yan, L.; Fu, Y.; Robinson, B.; Kelly, F.; Elliott, P.; Wu, Y.; Zhao, L.; Ezzati, M.; Yang, X.; et al. Household transitions to clean energy in a multiprovincial cohort study in China. Nat. Sustain. 2019, 3, 42–50. [Google Scholar] [CrossRef]
- Niu, S.; Li, Z.; Qiu, X.; Dai, R.; Wang, X.; Qiang, W.; Hong, Z. Measurement of effective energy consumption in China’s rural household sector and policy implication. Energy Policy 2019, 128, 553–564. [Google Scholar] [CrossRef]
- Musti, S.; Kortum, K.; Kockelman, K.M. Household energy use and travel: Opportunities for behavioral change. Transp. Res. Part D Transp. Environ. 2011, 16, 49–56. [Google Scholar] [CrossRef] [Green Version]
- Gao, B.; Liu, X.; Zhu, Z. A Bottom-Up Model for Household Load Profile Based on the Consumption Behavior of Residents. Energies 2018, 11, 2112. [Google Scholar] [CrossRef] [Green Version]
- Sheng, C.; Cao, Y.; Xue, B. Residential Energy Sustainability in China and Germany: The Impact of National Energy Policy System. Sustainability 2018, 10, 4535. [Google Scholar] [CrossRef] [Green Version]
- Hamamoto, M. Energy-saving behavior and marginal abatement cost for household CO2 emissions. Energy Policy 2013, 63, 809–813. [Google Scholar] [CrossRef]
- Ping, X.; Li, C.; Jiang, Z. Household energy consumption patterns in agricultural zone, pastoral zone and agro-pastoral transitional zone in eastern part of Qinghai-Tibet Plateau. Biomass Bioenergy 2013, 58, 1–9. [Google Scholar] [CrossRef]
- Ding, W.; He, L.; Zewudie, D.; Zhang, H.; Zafar, T.B.; Liu, X. Gender and renewable energy study in Tibetan pastoral areas of China. Renew. Energy 2019, 133, 901–913. [Google Scholar] [CrossRef]
- Jiang, L.; Chen, X.; Xue, B. Features, Driving Forces and Transition of the Household Energy Consumption in China: A Review. Sustainability 2019, 11, 1186. [Google Scholar] [CrossRef] [Green Version]
- Jiang, L.; Yu, L.; Xue, B.; Chen, X.; Mi, Z. Who is energy poor? Evidence from the least developed regions in China. Energy Policy 2020, 137, 111122. [Google Scholar] [CrossRef]
- Miah, M.D.; Kabir, R.R.M.S.; Koike, M.; Akther, S.; Yong Shin, M. Rural household energy consumption pattern in the disregarded villages of Bangladesh. Energy Policy 2010, 38, 997–1003. [Google Scholar] [CrossRef]
- Casillas, C.; Kammen, D. The Energy-Poverty-Climate Nexus. Science 2010, 330, 1181–1182. [Google Scholar] [CrossRef] [PubMed]
- Mirza, U.K.; Ahmad, N.; Majeed, T. An overview of biomass energy utilization in Pakistan. Renew. Sustain. Energy Rev. 2008, 12, 1988–1996. [Google Scholar] [CrossRef]
- Devi, R.; Singh, V.; Dahiya, R.P.; Kumar, A. Energy consumption pattern of a decentralized community in northern Haryana. Renew. Sustain. Energy Rev. 2009, 13, 194–200. [Google Scholar] [CrossRef]
- Joon, V.; Chandra, A.; Bhattacharya, M. Household energy consumption pattern and socio-cultural dimensions associated with it: A case study of rural Haryana, India. Biomass Bioenergy 2009, 33, 1509–1512. [Google Scholar] [CrossRef]
- Liu, G.; Lucas, M.; Shen, L. Rural household energy consumption and its impacts on eco-environment in Tibet: Taking Taktse county as an example. Renew. Sustain. Energy Rev. 2008, 12, 1890–1908. [Google Scholar] [CrossRef]
- Kulindwa, K.; Shechambo, F. The impact of rural energy use on the environment during the economic reforms period (1981-1992): Some evidence from Tanzania. Econ. Cond. 1995, 2, 110–131. [Google Scholar]
- Zhou, Z.; Wu, W.; Wang, X.; Chen, Q.; Wang, O. Analysis of changes in the structure of rural household energy consumption in northern China: A case study. Renew. Sustain. Energy Rev. 2009, 13, 187–193. [Google Scholar] [CrossRef]
- Armah, F.R.; Odoi, J.; Luginaah, I. Indoor Air Pollution and Health in Ghana: Self-Reported Exposure to Unprocessed Solid Fuel Smoke. Ecohealth 2015, 12, 227–243. [Google Scholar] [CrossRef]
- Chen, L.; Heerink, N.; van den Berg, M. Energy consumption in rural China: A household model for three villages in Jiangxi Province. Ecol. Econ. 2006, 58, 407–420. [Google Scholar] [CrossRef]
- Démurger, S.; Fournier, M. Poverty and Firewood Consumption: A Case Study of Rural Households in Northern China. China Econ. Rev. 2010, 22, 512–523. [Google Scholar] [CrossRef] [Green Version]
- Khandker, S.R.; Barnes, D.F.; Samad, H.A. Are the energy poor also income poor? Evidence from India. Energy Policy 2012, 47, 1–12. [Google Scholar] [CrossRef]
- Rahut, D.B.; Behera, B.; Ali, A. Household energy choice and consumption intensity: Empirical evidence from Bhutan. Renew. Sustain. Energy Rev. 2016, 53, 993–1009. [Google Scholar] [CrossRef]
- Pfeiffer, L.; López-Feldman, A.; Taylor, J.E. Is off-farm income reforming the farm? Evidence from Mexico. Agric. Econ. 2009, 40, 125–138. [Google Scholar] [CrossRef]
- Woldeyohanes, T.; Heckelei, T.; Surry, Y. Effect of off-farm income on smallholder commercialization: Panel evidence from rural households in Ethiopia. Agric. Econ. 2017, 48, 207–218. [Google Scholar] [CrossRef]
- Ma, W.; Abdulai, A.; Ma, C. The effects of off-farm work on fertilizer and pesticide expenditures in China. Rev. Dev. Econ. 2018, 22, 573–591. [Google Scholar] [CrossRef]
- Dedehouanou, S.F.A.; Araar, A.; Ousseini, A.; Harouna, A.L.; Jabir, M. Spillovers from off-farm self-employment opportunities in rural Niger. World Dev. 2018, 105, 428–442. [Google Scholar] [CrossRef] [Green Version]
- Ma, W.; Zhou, X.; Renwick, A. Impact of off-farm income on household energy expenditures in China: Implications for rural energy transition. Energy Policy 2019, 127, 248–258. [Google Scholar] [CrossRef]
- Démurger, S.; Wang, X. Remittances and expenditure patterns of the left behinds in rural China. China Econ. Rev. 2016, 37, 177–190. [Google Scholar] [CrossRef] [Green Version]
- Li, Y.; Tong, S.; Bao, Y.; Guo, E.; Bao, Y. Prediction of Droughts in the Mongolian Plateau Based on the CMIP5 Model. Water 2020, 12, 2774. [Google Scholar] [CrossRef]
- Wei, Y.; Zhen, L. The dynamics of livestock and its influencing factors on the Mongolian Plateau. Environ. Dev. 2020, 34, 100518. [Google Scholar] [CrossRef]
- Zhao, X.; Cheng, H.; Zhao, H.; Jiang, L.; Xue, B. Survey on the households’ energy-saving behaviors and influencing factors in the rural loess hilly region of China. J. Clean. Prod. 2019, 230, 547–556. [Google Scholar] [CrossRef]
- Sneath, D. State Policy and Pasture Degradation in Inner Asia. Science 1998, 281, 1147–1148. [Google Scholar] [CrossRef]
- Wang, J.; Brown, D.G.; Agrawal, A. Climate adaptation, local institutions, and rural livelihoods: A comparative study of herder communities in Mongolia and Inner Mongolia, China. Glob. Environ. Chang. 2013, 23, 1673–1683. [Google Scholar] [CrossRef]
- Gao, L.; Kinnucan, H.W.; Zhang, Y.; Qiao, G. The effects of a subsidy for grassland protection on livestock numbers, grazing intensity, and herders’ income in inner Mongolia. Land Use Policy 2016, 54, 302–312. [Google Scholar] [CrossRef] [Green Version]
- Yin, Y.; Hou, Y.; Langford, C.; Bai, H.; Hou, X. Herder stocking rate and household income under the Grassland Ecological Protection Award Policy in northern China. Land Use Policy 2019, 82, 120–129. [Google Scholar] [CrossRef]
- Zhang, J.; Brown, C.; Qiao, G.; Zhang, B. Effect of Eco-compensation Schemes on Household Income Structures and Herder Satisfaction: Lessons From the Grassland Ecosystem Subsidy and Award Scheme in Inner Mongolia. Ecol. Econ. 2019, 159, 46–53. [Google Scholar] [CrossRef]
- John, R.; Chen, J.; Ou-Yang, Z.-T.; Xiao, J.; Becker, R.; Samanta, A.; Ganguly, S.; Yuan, W.; Batkhishig, O. Vegetation response to extreme climate events on the Mongolian Plateau from 2000 to 2010. Environ. Res. Lett. 2013, 8, 035033. [Google Scholar] [CrossRef]
- Jiang, L.; Yao, Z.; Huang, H. Climate variability and change on the Mongolian Plateau: Historical variation and future predictions. Clim. Res. 2016, 67, 1–14. [Google Scholar] [CrossRef]
- General Principles of Comprehensive Energy Consumption Calculation. Available online: http://std.samr.gov.cn/gb/search/gbDetailed?id=B13990C15C2D5DDAE05397BE0A0A0D35 (accessed on 20 December 2021).
- Zhao, X. Thi impact of livelihood strategy on the famer’s living energy consumption pattern: A case of Gannan Plateau. Acta Ecol. Sin. 2015, 35, 1610–1619. [Google Scholar] [CrossRef]
- IPCC-EFDB Emission Factor Database. Available online: https://www.ipcc-nggip.iges.or.jp/EFDB/find_ef.php (accessed on 20 December 2021).
- Ministry of Housing and Urban-Rural Development on the Issuance of National Standards Announcement of “Building Carbon Emission Calculation Standards”. Available online: http://www.mohurd.gov.cn/gongkai/fdzdgknr/tzgg/201905/20190530_240723.html (accessed on 20 December 2021).
- Chen, H.; Tian, H.; Xiao, Y.; Chen, C. The Estimation and Analysis of Carbon Emissions in the Oil Refining Industry of China. Environ. Prot. Oil Gas Fields 2012, 22, 1–3. [Google Scholar] [CrossRef]
- Meng, X. The Estimation and Analysis of Carbon Dioxide Emissions in Refineries. Environ. Prot. Oil Gas Fields 2010, 18, 13–16. [Google Scholar]
- Li, J.; Liu, L. Research on energy and environment cost of household consumption in China. China Popul. Resour. Environ. 2017, 27, 31–39. [Google Scholar] [CrossRef]
- Announcement on the Issuance of 5 Technical Guidelines Including the “Technical Guidelines for the Preparation of Primary Source Emissions Inventory of Inhalable Particulate Matter (Trial)”. Available online: http://www.mee.gov.cn/gkml/hbb/bgg/201501/t20150107_293955.htm (accessed on 20 December 2021).
- Stec, D.; Drummond, H.A.; Vera, T. Role of carbon monoxide in blood pressure regulation. Hypertension 2008, 51, 597–604. [Google Scholar] [CrossRef] [Green Version]
- Neslihan, D.; Nurten, S. Effects of work place carbon monoxide exposure on blood viscosity. Arch. Environ. Occup. Health 2010, 65, 49–53. [Google Scholar] [CrossRef]
- Li, P.; Yan, R.; Yu, S.; Wang, S.; Liu, W.; Bao, H. Reinstate regional transport of PM2.5 as a major cause of severe haze in Beijing. Proc. Natl. Acad. Sci. USA 2015, 112, E2739–E2740. [Google Scholar] [CrossRef] [Green Version]
- Yang, L.; Liu, M.; Min, Q.; He, S.; Jiao, W. Review of eco-environmental effect of farmers’ livelihood strategy transformation. Acta Ecol. Sin. 2019, 39, 8172–8182. [Google Scholar] [CrossRef]
- Liu, Z.; Chen, Q.; Xie, H. Influence of the Farmer’s Livelihood Assets on Livelihood Strategies in the Western Mountainous Area, China. Sustainability 2018, 10, 875. [Google Scholar] [CrossRef] [Green Version]
- Zhao, W.; Yang, S.; Wang, X. The relationship between livelihood capital and livelihood strategy based on logistic regression model in Xinping County of Yuanjiang dry-hot valley. Resour. Sci. 2016, 38, 136–143. [Google Scholar] [CrossRef]
Figure 1.
Study area.

Figure 2.
Research design.

Figure 3.
Popularity of energy sources in the two types of herder households.

Figure 4.
Energy consumption structure of two types of herder households.

Figure 5.
CO2 emissions of two types of herder households’ energy consumption.

Figure 6.
Reduction in air pollutants among LDHs compared to that of PHHs.


Table 1.
Basic characteristics of the sampled herder households.
| Indicator | Category | Sample Size | Proportion |
|---|---|---|---|
| Type of livelihood | PHHs | 149 | 73.4% |
| LDHs | 54 | 26.6% | |
| Household size | 1–3 people | 64 | 31.5% |
| 3–6 people | 131 | 64.6% | |
| More than 6 people | 8 | 3.9% | |
| Highest education level in the household | Primary school | 13 | 6.4% |
| Junior high school | 76 | 37.4% | |
| High school and above | 114 | 56.2% | |
| Income level (yuan/a) | Less than 100,000 | 83 | 40.9% |
| 100,000–200,000 | 64 | 31.5% | |
| 200,000–300,000 | 35 | 17.2% | |
| Above 300,000 | 21 | 10.3% |
Table 2.
Description of energy consumption variables of the sampled herder households in New Barag Left Banner.
Table 2.
Description of energy consumption variables of the sampled herder households in New Barag Left Banner.
| Variable Type | Variable | Variable Description | Mean | Standard Deviation |
|---|---|---|---|---|
| Dependent variable | Livelihood diversification | 1 = Yes, 0 = No | 0.27 | 0.443 |
| Independent variable | Livestock dung | 0 = Not used, 1 = 0–6 t/a, 2 = 6–18 t/a, 3 = 18–30 t/a, 4 = Over 30 t/a | 1.70 | 1.190 |
| Coal | Continuous variable, t/a | 5.17 | 4.400 | |
| Gasoline | Continuous variable, kg/a | 1225.29 | 1122.587 | |
| Electricity | Continuous variable, kW·h/a | 2240.54 | 3365.212 | |
| Liquefied gas | kg/a | 59.69 | 70.320 | |
| Solar | 1 = Yes, 0 = No | 0.64 | 0.482 | |
| Wind | 1 = Yes, 0 = No | 0.49 | 0.501 |
Table 3.
Binomial logistic regression results of livelihood diversification and energy consumption of herder households.
Table 3.
Binomial logistic regression results of livelihood diversification and energy consumption of herder households.
| Variable Type | Variable | Regression Coefficients | Wald Test Statistic |
|---|---|---|---|
| Independent variable | Livestock dung | −0.13122 | 0.643 |
| Coal | −0.01411 | 0.120 | |
| Gasoline | −0.00035 * | 3.170 | |
| Electricity | 0.00011 ** | 4.556 | |
| Liquefied gas | 0.00077 | 0.095 | |
| Solar | −1.08073 ** | 5.230 | |
| Wind | 0.51106 | 1.282 | |
| Constant | - | −0.29480 | 0.537 |
* Represents the significance level of 0.1; ** Represents the significance level of 0.05.
Table 4.
Coal equivalent coefficient of herder household energy.
| Energy Type | Coal | Gasoline | Livestock Dung | Liquefied Gas | Electricity |
|---|---|---|---|---|---|
| Conversion coefficient | 0.7143 | 1.4714 | 0.4710 | 1.7572 | 0.1229 |
| Conversion unit | kgce/kg | kgce/kg | kgce/kg | kgce/kg | kgce/kW·h |
Table 5.
CO2 emissions inventory of energy sources from sampled herder households.
| Stage | Electricity (tCO2/TJ) | Coal (tCO2/t) | Gasoline (tCO2/t) | Liquefied Gas (tCO2/t) | Livestock Dung (tCO2/t) |
|---|---|---|---|---|---|
| Production | 88.7 | 0.20 | 0.23 | 0.23 | - |
| Consumption | - | 1.86 | 2.92 | 3.11 | 0.90 |
Table 6.
Air pollutant emissions inventory of three energy sources from sampled herder households (g/kg).
Table 6.
Air pollutant emissions inventory of three energy sources from sampled herder households (g/kg).
| Energy | SO2 | NOx | CO | VOCs | PM10 | PM2.5 |
|---|---|---|---|---|---|---|
| Livestock dung | 0.28 | 0.58 | 19.8 | 3.13 | 8.84 | 8.22 |
| Coal | 3.7 | 1.6 | 140.1 | 4 | 13.5 | 10.8 |
| Gasoline | - | 0.44 | 9.38 | - | 0.04 | 0.04 |
Gasoline is a liquid fuel, and China’s gasoline is usually desulfurized, so we disregarded VOCs and SO2 emissions.
Publisher’s Note: MDPI stays neutral with regard to jurisdictional claims in published maps and institutional affiliations. |
© 2022 by the authors. Licensee MDPI, Basel, Switzerland. This article is an open access article distributed under the terms and conditions of the Creative Commons Attribution (CC BY) license (https://creativecommons.org/licenses/by/4.0/).
Share and Cite
MDPI and ACS Style
Li, Z.; Liu, M. Livelihood Diversification Helps Herder Households on the Mongolian Plateau Reduce Emissions: A Case Study of a Typical Pastoral Area. Agronomy 2022, 12, 267. https://doi.org/10.3390/agronomy12020267
AMA Style
Li Z, Liu M. Livelihood Diversification Helps Herder Households on the Mongolian Plateau Reduce Emissions: A Case Study of a Typical Pastoral Area. Agronomy. 2022; 12(2):267. https://doi.org/10.3390/agronomy12020267
Chicago/Turabian StyleLi, Zhidong, and Moucheng Liu. 2022. "Livelihood Diversification Helps Herder Households on the Mongolian Plateau Reduce Emissions: A Case Study of a Typical Pastoral Area" Agronomy 12, no. 2: 267. https://doi.org/10.3390/agronomy12020267
Note that from the first issue of 2016, this journal uses article numbers instead of page numbers. See further details here.