Article

Investigating the Responses of Microbial Communities to Banana Fusarium Wilt in Suppressive and Conducive Soils Based on Soil Particle-Size Differentiation

1
Engineering and Technology Center for Modern Horticulture, Jiangsu Vocational College of Agriculture and Forestry, Zhenjiang 212400, China
2
State Key Laboratory of Crop Genetics and Germplasm Enhancement, College of Horticulture, Nanjing Agricultural University, Nanjing 210095, China
3
College of Resources and Environmental Sciences, Nanjing Agricultural University, Nanjing 210095, China
4
Jiangsu Provincial Key Lab for Solid Organic Waste Utilization, Nanjing Agricultural University, Nanjing 210095, China
*
Author to whom correspondence should be addressed.
These authors contributed equally to this work.
Agronomy 2022, 12(2), 229; https://doi.org/10.3390/agronomy12020229
Submission received: 26 November 2021 / Revised: 22 December 2021 / Accepted: 12 January 2022 / Published: 18 January 2022
(This article belongs to the Special Issue Environmental Ecological Remediation and Farming Sustainability)

Abstract

:
The microbiota plays a primary role in inhibiting plant pathogens in the soils. However, the correlation between soil particles and local microbial communities has not been fully confirmed. In this study, we contrasted the different assemblages of microbial communities between suppressive and conducive soils via the differentiation of soil particle-size fractions (PSFs). We further extracted the direct and indirect interactive associations among the soil biotic and abiotic factors by using samples from two continuous banana cropping systems. Notable differences were shown in PSF composition, biological traits (microbial communities and enzyme patterns) and physiochemical parameters between suppressive and conducive soils among the different soil fractions. For example, compared with conducive soils, suppressive soils have higher nutrient contents, fungal abundance and diversity and enzyme activities, and the extent of these differences was explored for fractions of different sizes. Moreover, the microbial taxonomic composition strongly varied between disease-suppressive and disease-conducive soils. For instance, there were significant differences in the relative abundance among key microbiology communities, such as Actinobacteria, Firmicutes, Bacteroidetes, Proteobacteria and Ascomycota, especially for antagonistic microorganisms (i.e., Streptomyces, Pseudomonas, Trichoderma, etc.) across various soil fractions. In addition, structural equation modeling (SEM) showed that the complex associations among soil PSFs, physiochemical parameters and microbial communities were mediated by multiple pathways, which then drive the soil enzyme activities and may further influence the suppressiveness of the soil. These results demonstrate that the resident microbial communities in specific soil particles may play a crucial role in the development of soil suppressiveness against banana Fusarium wilt disease.

1. Introduction

The continuous planting of bananas in many tropical and subtropical areas together with an over-supply of chemical fertilizers and pesticides has led to an increasing rate of Fusarium wilt disease that is caused by Fusarium oxysporum f. sp. cubense race 4. This disease causes great economic losses [1,2,3]. For example, approximately 2000 km2 of banana orchards have been infected in southern China. There is still no reliable solution [4,5], as the causal pathogen can survive for many years as chlamydospores in soils [6]. The Fusarium pathogen’s accumulation is widely known to be controlled by crop rotation [7]. In general, the soils of banana plantations with a high Fusarium wilt disease rate (>60%) over five consecutive production years are defined as conducive soils, and the soils with a low wilt disease rate (<15%) are defined as suppressive soils [8]. The conducive and suppressive soils can be located in adjacent banana orchards. The differences in the Fusarium wilt disease incidence between the geographically proximate fields that share the same climatic conditions and agronomic management [9] may be explained by the distinct resident microbial communities in these soils. For sustainable agriculture and environmental protection, suppressive soils have recently attracted attention [10].
Previous literature has indicated that the primary characteristic of soil suppression is that the indigenous microbiotas have the ability to inhibit pathogens from infecting plants [8]. For instance, soil-borne disease control is largely attributed to biological interactions between antagonistic micro-flora and pathogens [11]. Some representative microbial groups, e.g., Burkholderia, Pseudomonas, Bacillus, Actinomycetes, Trichoderma, Penicillium, Gliocladium, and Sporidesmium, have been reported to have an antagonistic ability to resist soil-borne disease [12,13,14] Simultaneous investigations into the microbial communities of banana soils indicated that they were associated with the rate of soil-borne diseases [8]. In addition, changes in the microbial community or the abundance of major microbial groups (such as Pseudomonas and Tumebacillus) could be the indicators of disease suppression. Microbial identifications based on sequencing technology are now being applied to investigate banana soils infected by Fusarium wilt [15,16], but it is still unclear as to whether there is a difference in the assemblages of microbial communities between suppressive and conducive soils across soil particle-size fractions (PSFs). Previous studies on bananas in the Canary Islands (Spain) have shown that [17] soils are undoubtedly composed of a wide range of differently sized fractions [18]. They act as microhabitats for diverse microbial communities [19]. These contexts are considered to be important for determining the mineral–organic interactions of many soils’ biochemical processes [20], which can affect the renewed assemblages of microbial communities in suppressive and conducive soils. Similarly, soil microorganisms and other binding agents (e.g., organic matter) play major roles in the formation of aggregates [17,21]. For example, filamentous fungi are closely related to the formation and stabilization of macro-aggregates (>0.25 mm). In addition, the extracellular polymeric substances of bacteria and fungi usually contribute to the formation of micro-aggregates (<0.25 mm) [22,23]. In particular, the soil enzyme pattern has been proposed as an appropriate biological indicator. Soil enzyme activities have been widely used as indicators of soil quality and functional potency [24,25]. They could also be sensitive to both shifts in soil properties and microbial traits [26]. Therefore, soil enzyme activities might offer new insights into the functional implications of soil condition shifts (such as suppressive versus conducive soils) [27,28,29,30].
In this study, we contrasted the differences in microbial traits between these two types of soils, and we followed a line of reasoning to tease apart the direct and indirect interactive associations among microbial traits and soil attributes in relation to the enzyme pattern in response to banana Fusarium wilt. Furthermore, we proposed the following hypotheses: (i) there are distinct differences in the microbial community structures and diversity across the different PSFs in suppressive and conducive soils; (ii) second, we expect that the change in soil PSF-associated microbial communities is driven by the interplay between soil microhabitats and the composition of soil PSFs. Multiple approaches, e.g., modern MiSeq amplicon pyrosequencing, soil PSFs separation, a quantitative PCR (q-PCR) approach, and structure equation modeling (SEM) analysis, were employed to analyze our data and demonstrate our hypotheses simultaneously.

2. Materials and Methods

2.1. Soil Collection and Preparation

Hainan province is the major banana-producing area in China. Two typical soils of Cavendish banana in Hainan were collected, i.e., silt loam (ST) and sandy loam (SD). ST soil was collected from Lingao County, Hainan (Suppressive: 109°42.4′ E, 19°47.7′ N; Conducive: 109°39.3′ E, 19°49.1′ N), and SD soil was collected from Ledong County, Hainan (Suppressive: 108°48.5′ E, 18°37.1′ N; Conducive: 108°48.5′ E, 18°36.9′ N). Banana Fusarium wilt disease from the suppressive and conducive soils in ST (Lingao) was 10% and 65%, respectively (in 2015), and the distance between the two field sites is approximately 6 km. The wilt disease incidences of the suppressive and conducive soils in SD (Ledong) were 13% and 70%, respectively (in 2015), and the distance between the two field sites is approximately 0.37 km. The four orchards have been cultivated for more than 15 years under the same management pattern.
Triplicate samples from each orchard soil were collected in September of 2015 according to a modified method described by Shen et al., 2015 [8]. Five individual banana trees placed at least 5 m apart were selected for one sample collection, and the collected soil samples from each tree were mixed into a composite soil sample. For each tree, a composite soil sample from 4 sites under the trunk bases was collected using a 25 mm soil auger to a depth of 20 cm. The soils were stored at 4 °C. The fresh samples were gently broken by hand along natural planes of weakness to pass through an 8 mm sieve. Aliquots weighing 100 g for the 2, 0.25–2, 0.053–0.25 and <0.053 mm aggregate sizes were separated by the wet sieving technique [31]. The soil samples were placed on the top of a column of three sieves with 2, 0.25, and 0.053 mm sizes. The sieves were then submerged in deionized water for 3 min and moved up and down by hand for a total of 50 cycles over 2 min. The remains on the sieves and those that passed through the 0.053 mm sieve were collected separately. The soil was not air-dried before sieving, resulting in fractions that were not dried prior to DNA extraction, and the silt plus clay fraction (<0.053 mm) was isolated via centrifugation (5000 rpm for 10 min). A final sieving step was performed to determine the aggregate size distribution. The total organic carbon (TC) and total nitrogen (TN) were determined for each fraction after they were dried in an oven at 60 °C for 24 h. The TC and TN in all the aggregate fractions were analyzed with a Vario Macro Cube elemental analyzer (Vario MAX; Elementar, Langenselbold, Germany).

2.2. Determination of Enzyme Activities

Multiple enzyme activities were detected by using different Power Soil® enzyme Isolation Kits (CoMin, Suzhou, China). The soil sucrase activity was measured spectrophotometrically (510 nm) by using sucrose as a substrate according to the idea that sucrase can enzymatically hydrolyze sucrose to produce glucose and fructose, followed by the hydrolysis of glucose and 3,5-dinitrosalicylic acid to produce colored compounds. The activity was expressed as milligrams of reducing sugar produced per 24 h per gram of soil. The soil urease activity was measured spectrophotometrically (578 nm) using urea as a substrate. The activity was expressed as milligrams of NH3-N produced per 24 h per gram of soil. The soil neutral phosphatase activity was measured spectrophotometrically (660 nm) using disodium phenyl phosphate as a substrate. The activity was expressed as micromoles of phenol produced per 24 h per gram of soil. The soil catalase activity was measured spectrophotometrically (240 nm) using hydrogen peroxide as a substrate. The activity was expressed as micromoles of hydrogen peroxide resolved per 24 h per gram of soil.

2.3. Soil DNA Extraction and Real-Time PCR

The total soil genomic DNA was extracted using a Power Soil DNA Isolation Kit (MoBio Laboratories Inc., Carlsbad, CA, USA). Real-time PCR amplifications were performed within a total volume of 20 μL on a PRISM thermocycler (Applied Biosystems 7500 Real-Time PCR). Each PCR reaction contained 2 μL of the target DNA extract, 0.4 μL of Rox Reference Dye II, 10 μL of SYBR Premix EX Taq (2×, TaKaRa, Dalian, China), and 6.8 μL of sterile distilled water. In addition, 0.4 μL of each primer (520F (5′-AYTGGGYDTAAAGNG-3′) and 802R (5′-TACNVGGGTATCTAATCC-3′)) [32] targeted the 16S rDNA of bacteria, ITS1F (5′-CTTGGTCATTTAGAGGAAGTAA-3′) [33] and ITS2R (5′-GCTGCGTTCTTCATCGATGC-3′) [34] targeted the internal transcribed spacer (ITS) gene of fungi, AFP308R (5′-CGAATTAACGCGAGTCCCAAC-3′) and ITS1F (5′-CTTGGTCATTTAGAG -GAAGTAA-3′) [35] from Fusarium oxysporum targeted the ITS gene of F. oxysporum. The thermal cycling profile included a first step at 95 °C (30 s), and then 40 cycles at 95 °C (5 s) for 16S rRNA in bacteria and 60 °C (34 s) for 18S rRNA in fungi [36,37]. To evaluate the amplification specificity, a melting curve analysis was performed at the end of each PCR run [38].

2.4. Illumina MiSeq High-Throughput Sequencing and Data Analysis

The V4 hypervariable region of the bacterial 16S rRNA gene was amplified using individual bar-coded reverse primers 520F and 802R [32]. For fungi, the primers ITS1F [33] and ITS2R [34] targeted at the ITS1 region were used for the amplification. Finally, the PCR products were sequenced by Illumina MiSeq (Illumina Inc., San Diego, CA, USA). The sequencing data was processed using the procedures described by Schloss et al. (2009) using Mothur [39]. After the barcode and primer sequences were removed, the remaining sequences were clustered into operational taxonomic units (OTUs) at a 97% level of sequence similarity. They were then annotated via BLAST in the RDP (bacteria) and UNITE (fungi) databases by Quantitative Insights into Microbial Ecology (QIIME) (version 1.7.0) [40]. The remaining high-quality chimaera-free sequences were used for downstream analysis. The Shannon index was calculated using Mothur (version 1.29.2) [39] under the summary single order.

2.5. Statistical Analysis

The data for the microbial counts were log-transformed before statistical analysis. The differences between the means were determined by calculating the least significant difference (LSD) at the 5% level. The resulting data were analyzed statistically using an SPSS 19.0 program. The weighted UniFrac distance was calculated by the R package using ‘UniFrac’ and ‘ade4′ to perform a principal coordinate analysis (PCoA), which showed the dissimilarities between the microbial communities [41]. Simultaneously, a variance partitioning analysis (VPA) with Hellinger-transformed data was used to determine the contributions of the soil physiochemical properties, the composition of soil PSFs, soil conditions (conducive to or suppressive of disease), and the interactions among those factors, leading to the variations in the soil microbial community structures. Furthermore, a multiple regression tree (MRT) analysis was performed to analyze the community structures of the bacteria and fungi.
A structural equation model (SEM) was constructed to extract the indirect or direct effects on enzyme activities by using AMOS software (IBM SPSS AMOS 20.0.0, IBM (International Business Machines Corporation), Armonk, NY, USA). Before the modeling, all the data were normalized, some hypotheses were suggested and an a priori model was established [42]. We selected PC1 from a principal component analysis (PCA) with the multiple enzyme activities as the parameter for the enzyme activities (PC1 alone could explain 78.56% of the total variation). In general, the root mean squared error of approximation (RMSEA, the model has a good fit when RMSEA is <0.05), chi-square (χ2, the model has a good fit when the χ2 is low), Fisher’s statistic p and Akaike information criterionwere employed to synthetically evaluate the models [43].

3. Results

3.1. Soil Properties, Multiple Enzyme Activities and Particle-Size Distribution

The distribution of soil physiochemical properties and PSF composition and their changes varied among the different soil fractions (Table 1). In general, the proportion of 2–0.25 mm-sized fraction was dominant in both the ST and SD soils, accounting for 72.53–78.66%. In suppressive soils, the proportion of >2 mm-sized fractions was higher than it was in conducive soils, whereas the proportion of <0.053 mm-sized fractions was lower (p < 0.05, Table 1). Similarly, the total concentrations of carbon (TC) and nitrogen (TC) were higher in the suppressive soils (p < 0.05). Perhaps surprisingly, the C/N ratios have no notable or similar tendency across the different fractions in the two soils (Table 1). In particular, multiple enzyme activities showed notable distribution across the various soil PSFs (Figure S1). For instance, the decrease in the sucrase, neutral phosphatase and catalase activities across a gradient of decreasing particle-sizes was remarkable in each soil, whereas the urease activity increased across the gradient. All the enzyme activities were relatively higher in the suppressive soils, especially the catalase activity (Figure S1).

3.2. The Gene Abundances for Bacteria, Fungi, and F. oxysporum

There are no broad variations in the bacterial abundance (Figure S2). For example, the bacterial abundances in the aggregates (>2 and 0.25–0.053 mm) of the SD suppressive soils were slightly higher (differences < 5%) than those in SD conducive soils. However, the abundances for the other two particle sizes (2–0.25 and <0.053 mm) were lower than they were in conducive soils. Moreover, in the ST soils, the bacterial abundances in the >0.053 mm-sized fractions of the suppressive soils were slightly higher than those in the conducive soils. However, the fungal abundances show a promising trend in their distribution (Figure S2). The >0.053 mm-sized fractions in the SD and ST suppressive soils have similar abundances with respect to those in the conducive soils (Figure S2), while the abundances in the <0.053 mm-sized fractions within the suppressive soils were 13% to 23% (7.1 vs. 6.3 µg copies g−1 for SD and 6.9 vs. 5.6 µg copies g−1 for ST) higher than those in the conducive soils (Figure S2). The prominent contrasts in fungal abundances between the suppressive and conducive soils in the <0.053 mm aggregates suggested that the fungal enrichment could potentially contribute to the soil’s suppressive ability against Fusarium wilt. The F. oxysporum abundances in different PSFs of suppressive soils were almost all lower than those in conducive soils, except in the <0.053 mm aggregate of ST (Figure S2).

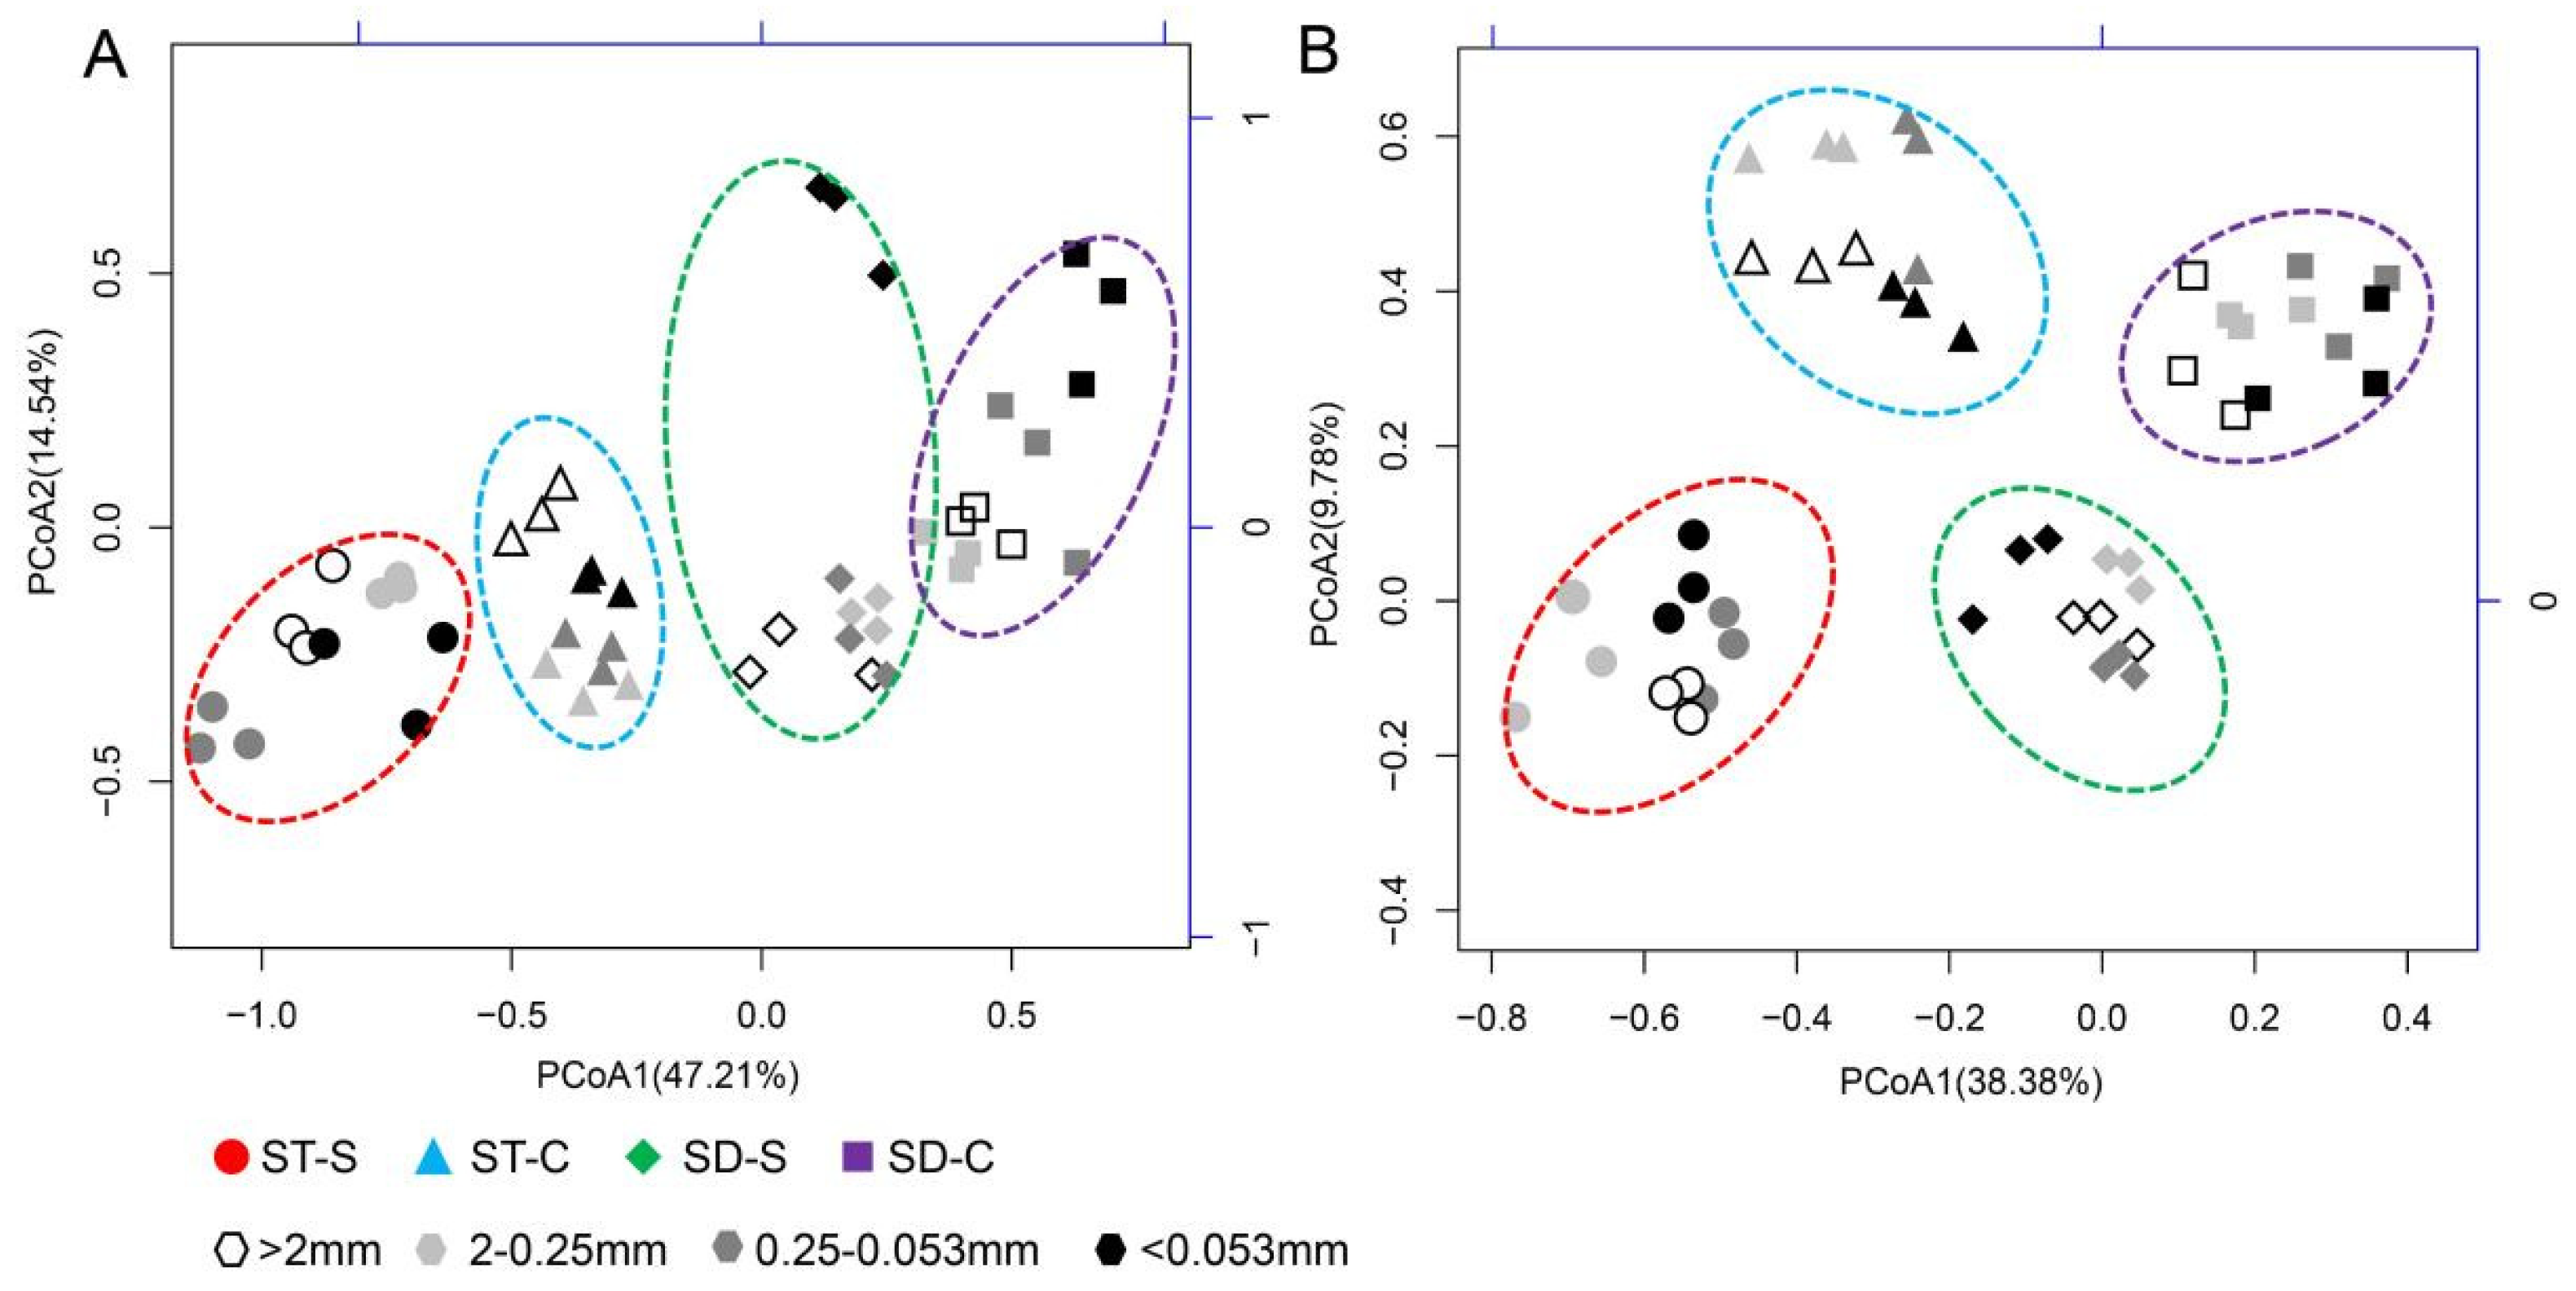
3.3. Community Structure of Bacteria and Fungi in The suppressive and Conducive Soils

A total of 870,611 (SD) and 832,541 (ST) high-quality 16S rRNA gene sequences were generated, and then these high-quality sequences were clustered into 12,997 (SD) and 10,085 (ST) OTUs, respectively, at 97% sequence similarity. The community structure and diversity of the soil bacteria were significantly shifted, and they were mediated by the soil contexts via the renewed assemblages of the soil communities (Table 2; Figure 1A). For example, the Shannon indexes for bacteria in the <0.053 mm-sized fractions of the SD and ST soils were significantly lower than those of the >0.053 mm-sized fractions. The indexes in suppressive soils were only slightly higher than they were in conducive soils, whereas no significant differences were found between suppressive and conducive soils (Table 2). Furthermore, the first and second axes of the unconstrained PCoA when using the weighted UniFrac distance explained 47.21% and 14.54% of the total variations in the bacterial community structure, respectively (Figure 1A). The bacterial communities of all the soils were separated along the first axis, while those within different soil PSFs were not widely separated (Figure 1A).
A total of 876,804 (SD) and 895,048 (ST) high-quality ITS gene sequences were generated from the aggregates, and then they were clustered into 2507 (SD) and 1815 (ST) OTUs, respectively, at 97% sequence similarity. The Shannon indexes for the fungi in the suppressive soils were slightly higher than they were in the conducive soils (except for SD in <0.053 mm-sized fractions), and the in >0.053 mm-sized fractions of the SD soil have significantly higher indexes than that of the <0.053 mm-sized fractions (Table 2). Furthermore, the first and second axes of the unconstrained PCoA using the weighted UniFrac distance explained 38.38% and 9.78% of the total variations in the fungal community structure (Figure 1B). The fungal communities of all the soils were separated along the first axis, while those within different soil aggregates were not notably separated (Figure 1B). In particular, the community structures of the suppressive soils were separated from these of the conducive soils along the second axis (Figure 1B).

3.4. The Taxonomic Composition of Bacteria and Fungi in the Suppressive and Conducive Soils

The distributions of the primary phyla in various PSFs of SD and ST soils (both the suppressive and conducive soils) were similar, in general. For example, the relative abundance of dominant bacterial phyla was larger than 1% across all the samples (both ST and SD), i.e., Acidobacteria, Actinobacteria, Bacteroidetes, Chloroflexi, Firmicutes, Gemmatimonadetes, Planctomycetes and Verrucomicrobia (Figure 2). There are two phyla that are present singly, i.e., Proteobacteria in SD and Latescibacteria in ST. The relative abundances of the bacterial phyla varied greatly over the aggregates of various sizes. For example, in the >0.053 mm-sized fractions, the relative abundances of the top five phyla (Acidobacteria, Actinobacteria, Bacteroidetes, Firmicutes and Proteobacteria) made up 70% of the total bacterial sequences (Figure 2), and in the 2–0.25 mm-sized fractions (with a proportion over 72%), the relative abundances of Actinobacteria, Firmicutes and Proteobacteria in the suppressive soils were all higher than those in the conducive soils, and the Bacteroidetes abundance is reversed (both SD and ST), while it was the dominant phyla in the <0.053 mm-sized fractions (Figure 2). In addition, the Bacteroidetes relative abundances in the suppressive soils were higher than those in the conducive soils. Furthermore, in the suppressive soils, the dominant genera with relative abundances >0.1% in the banana soils were Acidobacterium, Acidothermus, Bacillus, Bryobacter, Flavisolibacter, Pseudomonas, Sediminibacterium, Streptomyces, etc. (Figure S4A and S5A and Table S1). In the conducive soils, the dominant genera were Bacillus, Bryobacter, Gemmatimonas, Mizugakiibacter, Sediminibacterium, etc. (Figure S4B and S5B and Table S1). However, Flavisolibacter (3% to 16%) and Sediminibacterium (6% to 40%) clearly have higher abundances than the other genera in the <0.053 mm-sized fractions. In particular, the relative abundances of Pseudomonas in the SD suppressive soils were doubled compared to those of SD conducive soils (Table S1). Moreover, the contrast is even higher in ST because the abundance of Pseudomonas in the ST conducive soil is <0.1% (Table S1). In the >0.053 mm (>2, 2–0.25, 0.25–0.053 mm)-sized fractions in the SD suppressive soils, the Streptomyces abundances (0.31% to 0.51%) were higher than those (0.12% to 0.36%) in the SD conducive soils, suggesting that it could also be a potentially antagonistic microorganism.
The dominant fungal phyla were Ascomycota and Basidiomycota in various particle size aggregates of SD and ST soils (Figure S3). Additionally, there are four phyla present on their own, i.e., Zygomycota and Chytridiomycota in SD, and Blastocladiomycota and Glomeromycota in ST. The relative abundances of Basidiomycota in the macro-aggregates (>0.25 mm) of the suppressive soils were significantly higher than those in the conducive soils. However, the relative Ascomycota abundances in the conducive soils were almost all higher than those in suppressive soils. In the suppressive soils, the primary genera (Figure S6A and S7A and Table S2) were Acremonium, Chaetomium, Fusarium, Humicola, etc. In the conducive soils, the primary genera (Figure S6B and Table S2) were Aspergillus, Fusarium, Humicola, Myrothecium, Penicillium, etc. The abundances of Aspergillus in the SD and ST suppressive soils were lower than those in the conducive soils. In contrast, the Acremonium levels in all the suppressive soils were higher than those in the conducive soils, but the Fusarium abundance in the suppressive soils was lower than it was in the conducive soils in the >2 and <0.053 mm-sized fractions. Its abundance was significantly higher in the 2–0.053 mm-sized fractions of conducive soils (Table S2). Additionally, the relative abundances of Trichoderma in the macro-aggregate (>0.25 mm) of the ST suppressive soils were significantly higher than in the ST conducive soils (Table S2).

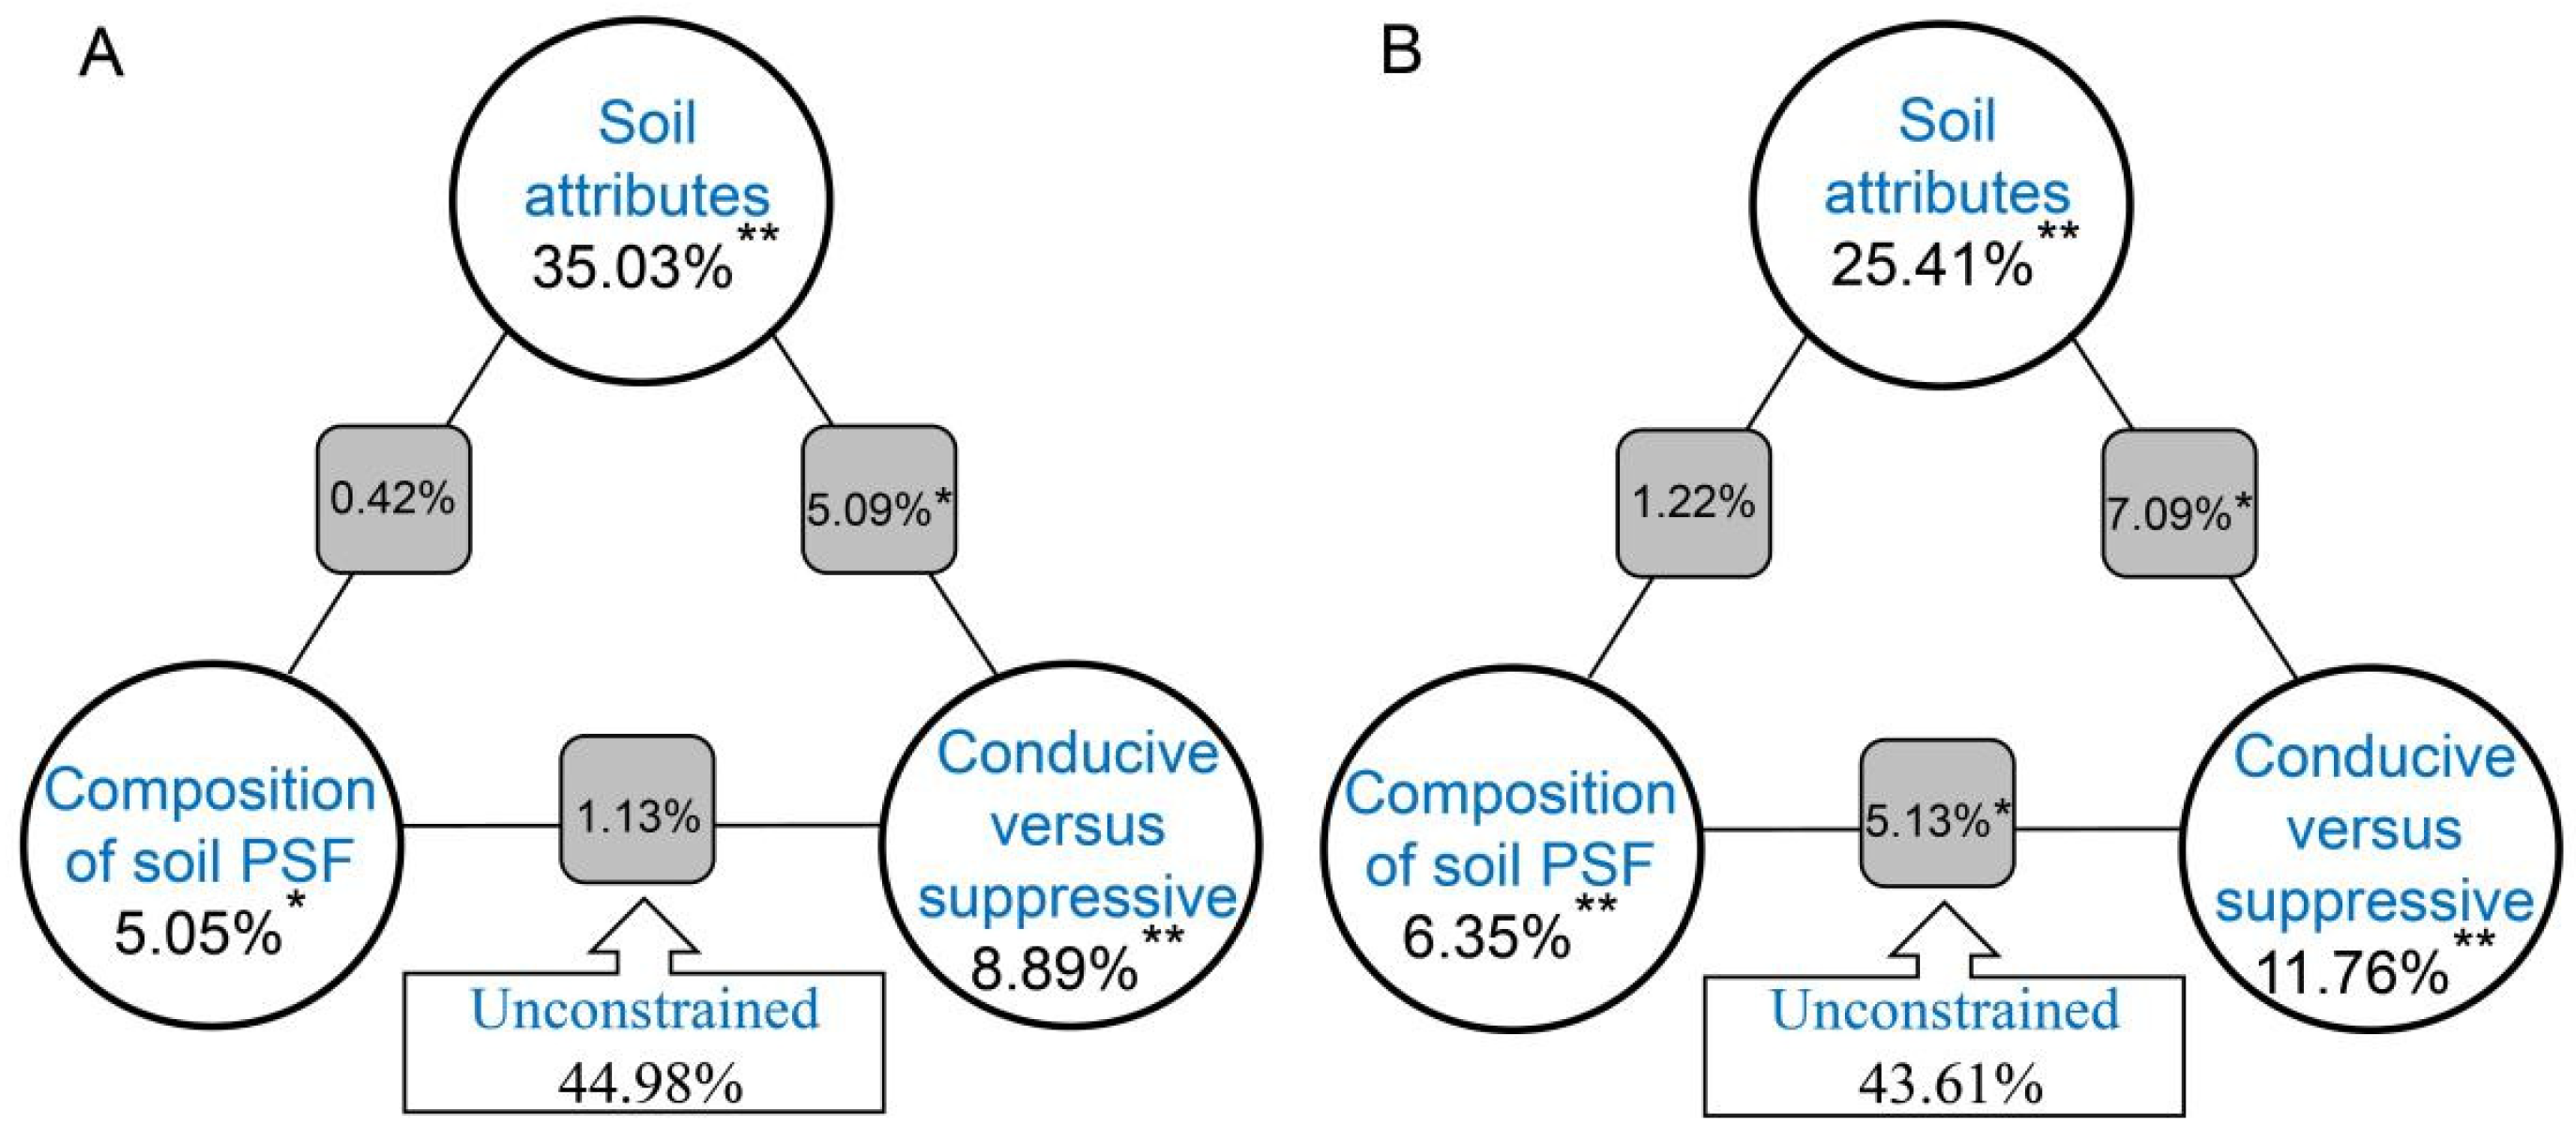
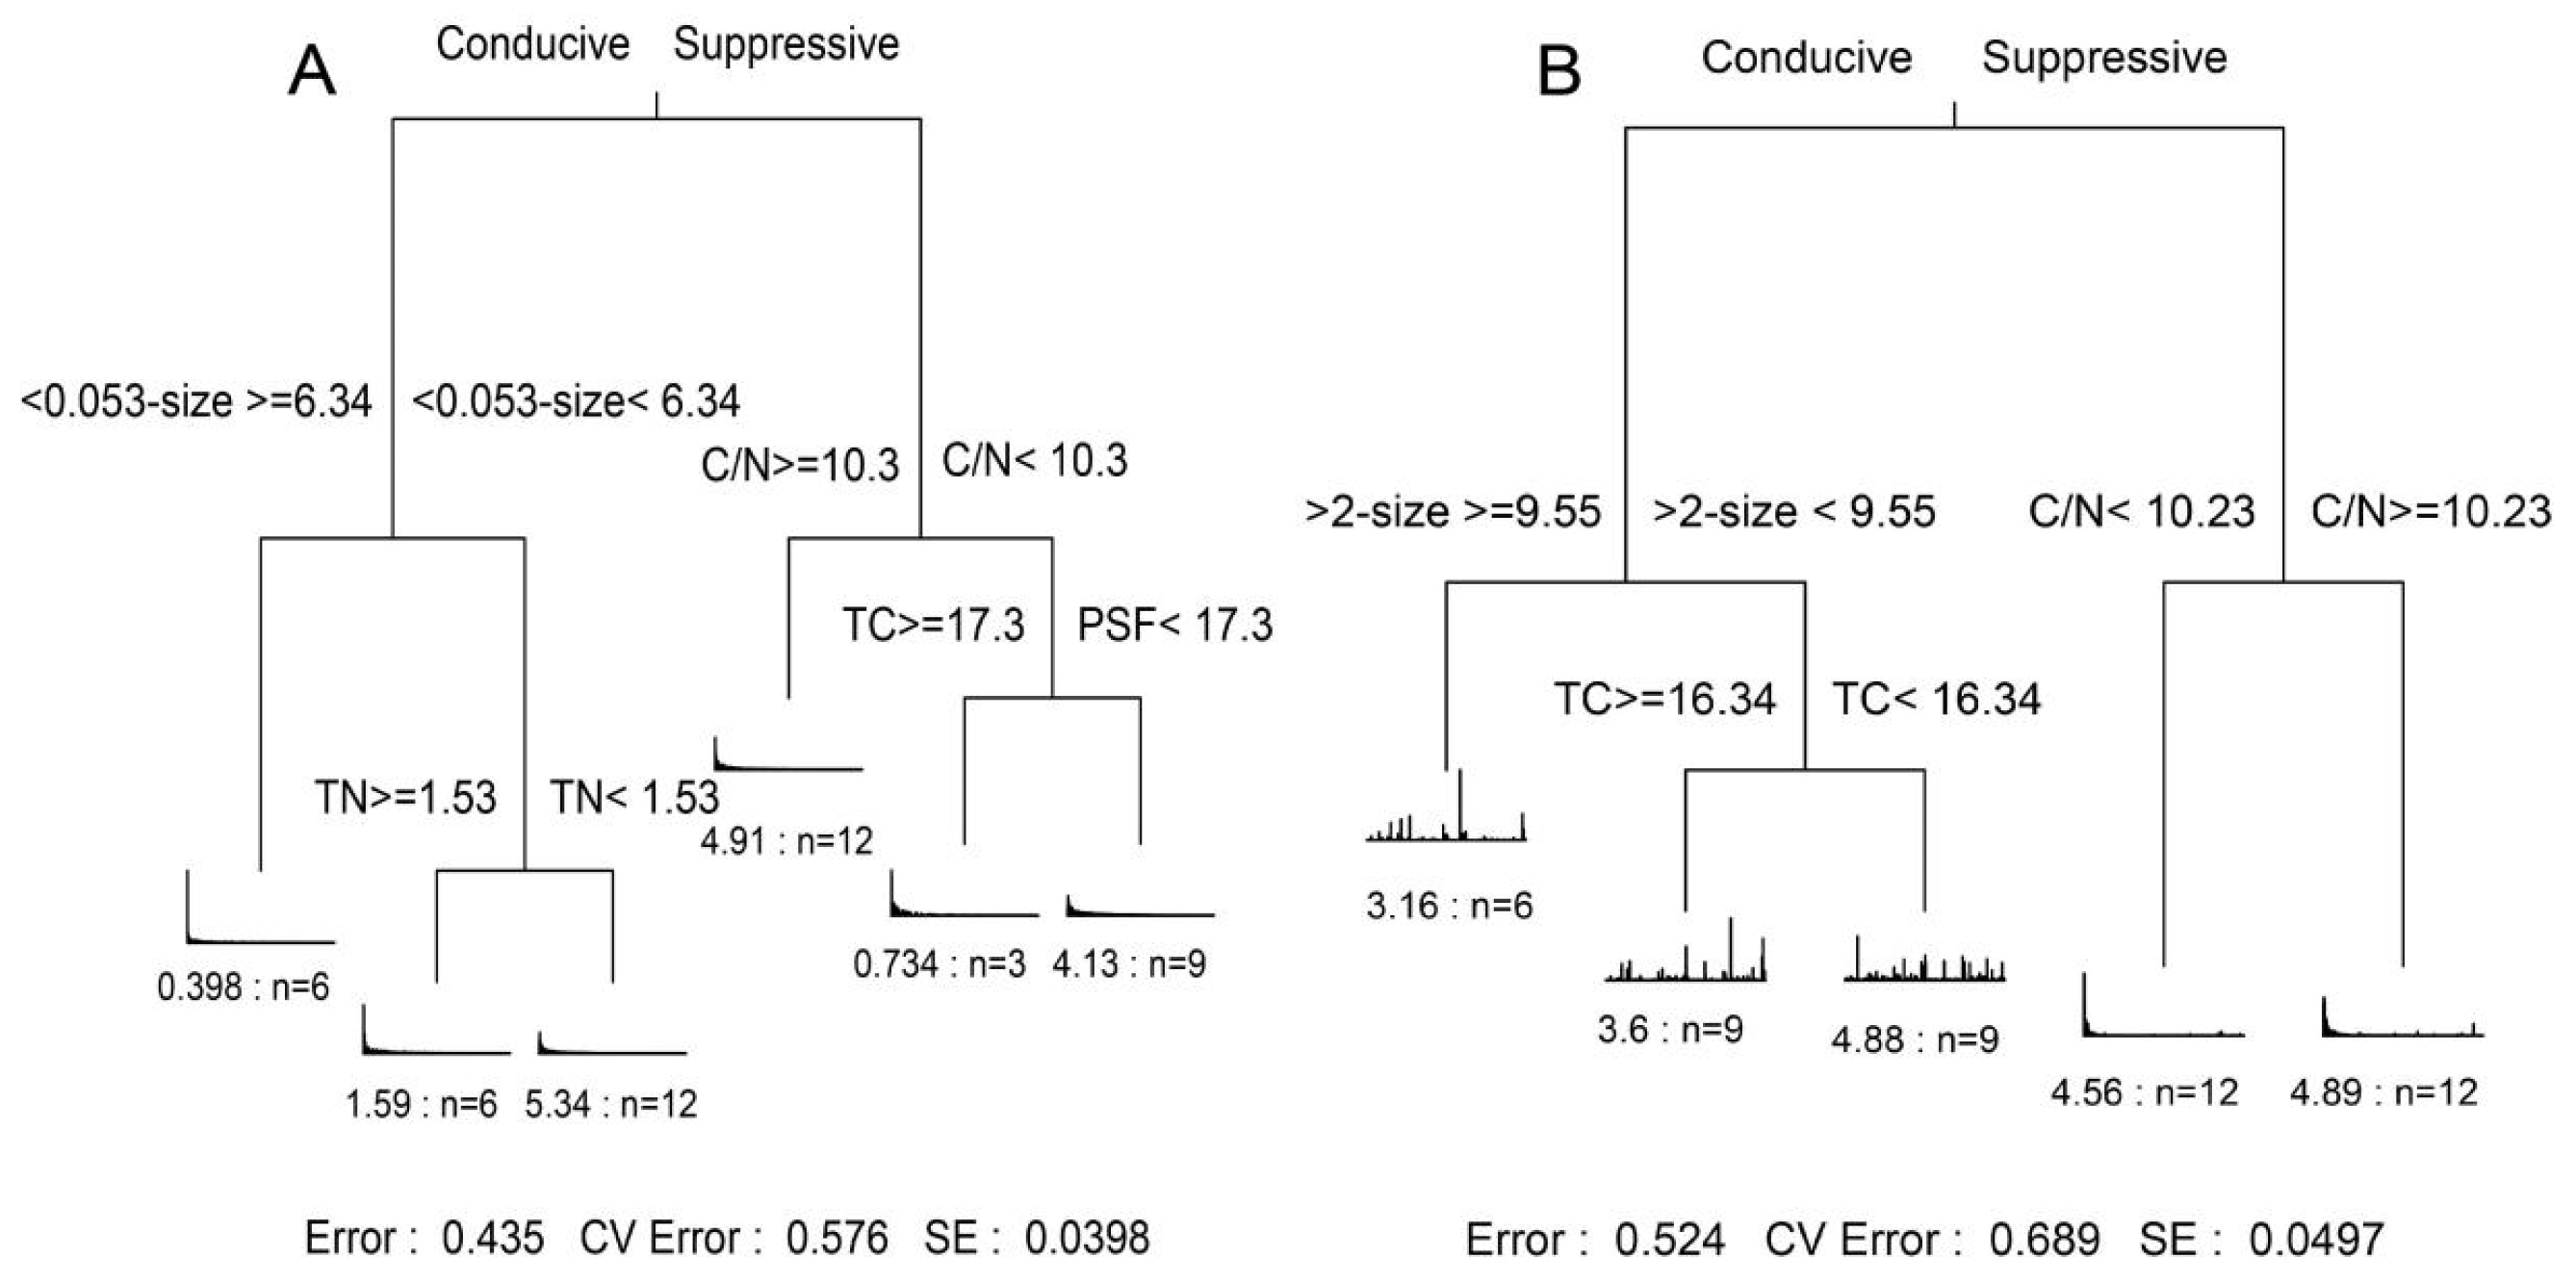
3.5. The Primary Factors Influencing the Microbial Community Structure in the Suppressive and Conducive Soils

The soil attributes, PSF composition and soil conditions (conducive or suppressive) all affected the bacterial and fungal community structures with both significant primary and interactive effects (all p < 0.05) (Figure 3). For example, according to the VPA analysis, of these independent variables, the soil attributes had a higher (35.03%, p < 0.001) impact on the community structure of bacteria (35.03%, p < 0.01) and fungi (25.41%, p < 0.01) compared with the soil conditions (8.89%, bacteria; 11.76%, fungi; p < 0.01) and soil PSF composition (5.05%, bacteria; 6.35%, fungi; p < 0.05). The interactions between the soil attributes and soil conditions significantly explained the shifts in the bacterial (5.09%; p < 0.01) and fungal communities (7.09%; p < 0.01) (Figure 3).
The MRT analysis was conducted to explore the relationships between multiple individual factors and the microbial community structure across all the samples (Figure 4). The soil condition (conducive or suppressive), C/N ratio and the percentage of <0.053 mm-sized fractions separated the bacterial community structure into three major clusters (Figure 4A). Similarly, the soil condition, C/N ratio and the percentage of >2 mm-sized fractions separated the fungal community structure into three major clusters, and these factors markedly affected the community (Figure 4B).

3.6. Deciphering the Direct and Indirect Pathways of Microbial Traits and Their Effects on Enzymatic Patterns in Suppressive and Conducive Soils

Soil microbial traits, including the community structure, population and diversity, were notably driven by soil microhabitats, and they further mediated the enzymatic pattern in response to Fusarium wilt disease. The SEM analysis could explain 55% and 74% of the total variations in the enzyme activities (Figure 5 and Figure 6, Table S3). The soil C content (path coefficient > 0.5) showed the highest total effect on the soil enzyme activities, followed by the community structure (bacteria, path coefficient = −0.42; fungi, path coefficient = −0.53) and the soil PSFs composition (path coefficient > 0.35) (Figure 5 and Figure 6). Both the soil N content and C/N ratio could directly affect the fungal abundance, and then they mediated the microbial community structure and diversity; this effect likely resulted in the ultimate regulation of soil enzyme activities (Figure 6). Notably, the F. oxysporum abundance has a significantly negative effect on the microbial abundance and community structure, which resulted in the ultimate regulation of enzyme activities, and it also directly and negatively mediated the enzyme activities (Figure 5 and Figure 6).

4. Discussion

While it has been a long-held view that Fusarium wilt disease is an important fungal disease of many crops, especially in banana, which experiences a great economic loss [2,44,45], recent studies also proposed the importance of the secreted proteins and the pathogenic mechanism of banana hosts, in addition to the genomics of Fusarium oxysporum [46,47,48]. Genetic engineering was also applied to develop banana varieties with resistance to Fusarium wilt [49]. However, there is still no reliable solution for controlling it [4,5]. In this study, we finely contrasted the microbial communities in suppressive and conducive soils associated with Fusarium wilt disease via soil PSFs differentiation. Suppressive soils harbored a significantly higher fungal abundance and diversity than conducive soils [50,51]. In particular, the variation in the abundance and diversity of fungi was contrasted in different sized fractions. For example, the >0.053 mm-sized fractions in the suppressive soils have similar fungal abundances with respect to those in the conducive soils, while the abundances in the <0.053 mm-sized fractions within the suppressive soils were notably higher than they were for conducive soils (Figure S2). Collectively, these differences could potentially contribute to the suppressive ability against Fusarium wilt [10]. Previous studies have also indicated that the soil PSFs and physiochemical properties are tightly correlated to their suppressive ability a [18]. Moreover, our MRT analysis further indicated that soil conditions are critical for determining the microbial community structure (Figure 4).
The microbial taxonomic composition strongly varied between the disease-suppressive and -conducive soils. The distribution of the composition, however, was different. For example, for bacteria, the relative abundances of Actinobacteria, Firmicutes and Proteobacteria in the 2–0.25 mm-sized fractions of the suppressive soils were all higher than those in the conducive soils (Figure 2). The importance of the phyla was associated with their rapid growth rate and suppression of soil-borne disease through the production of high levels of secondary metabolites [52,53]. Previous studies have also observed higher abundances of Actinobacteria and Firmicutes in Rhizoctonia-suppressive soils [54], which appear to have a key role in soils with specific suppressiveness against Fusarium wilt. At the genus level, the Pseudomonas in soils shows its potential contribution to the suppressive ability. Pseudomonas was reported to be related to the resistance to banana Fusarium wilt [55]. In addition, several Pseudomonas spp. have been widely recognized as biocontrol agents due to their ability to suppress soil-borne disease and to promote plant growth, e.g., Thielaviopsis basicola [14], Pythium pathogens [56], and R. solani [57]. The Streptomyces in the suppressive soils were also higher than those in the conducive soils across all the soil fractions, and are usually considered as the important antagonistic microorganisms in soils [58,59,60].
For the fungal phyla, the relative abundances of Ascomycota in different PSFs of conducive soils were all higher than those in suppressive soils. Many destructive plant pathogens that cause diseases including strawberry root rot, wheat scab and Dutch elm disease are Ascomycetes. Thus, we speculated that suppressive soil formation was related to a lower relative abundance of Ascomycetes. F. oxysporum belongs to the Ascomycetes. Its abundance data show comparative enrichment in conducive soils (Figure S3), which suggests that the quantity of the pathogen in banana soils directly determines the suppressive ability against Fusarium wilt. Among other fungal genera, Trichoderma is a potential biocontrol agent against several phyto-pathogenic fungi, e.g., the relative abundances of Trichoderma in a macro-aggregate (>0.25 mm) of suppressive soil were significantly higher than those in the conducive soils. This fungus can be attached to the host hyphae via coiling and absorbing actions. Therefore, the occurrence of Trichoderma in the banana soils could contribute to the suppressive ability against Fusarium wilt, and it is primarily located in macro-aggregates.
There are two primary pathways for preventing and controlling soil-borne diseases, as follows. First, antagonistic substances or multiple enzymes are produced by antagonistic microorganisms to inhibit the pathogenic microbes or spore germination [13]. Second, microbial communities inhibit pathogenic microorganisms through nutrition and niche competition. The chemical properties and enzyme pattern can influence the suppressiveness of soil. Our SEM analyses indicated that the soil C content showed the highest total effect on soil enzyme activities via direct or indirect mediation in community traits, followed by the microbial community structure and soil PSF composition. Simultaneously, the composition of soil PSFs and other physiochemical properties also mediated the microbial community structure, abundance and diversity, indirectly driving the enzyme activities.
The soil PSF composition in relation to the physical structure of the soil habitats could also prevent and control soil-borne disease through multiple pathways. For instance, physical structures constrain access to resources for certain microbial populations and hence modulate interactions between organisms. They act by mediating the variations in microhabitats or mineral-organic interactions to enhance the competitiveness for nutrition and niches [61,62]. Notably, the F. oxysporum abundance has a significantly negative effect on the microbial abundance and community structure, and this effect probably resulted in the ultimate regulation of enzyme activities and also directly and negatively mediated the enzyme activities. Our results also show that the difference in F. oxysporum abundances in different aggregates between suppressive and conducive soils were not large (Figure S2), while the disease incidence in suppressive soils was lower [10]. This phenomenon may suggest that the manifestation of the disease is impeded by the regulation from the resident microbial communities. Moreover, the suppressive soils showed a higher number of positive co-occurrence relationships than the conducive soil for microbial networks which might suggest more cooperation in the complex microbial community ecosystems.

5. Conclusions

Notable differences were observed in the PSF composition, biological traits and physiochemical parameters between suppressive and conducive soils across various soil fractions. These differences could have provided an efficient and normal response to banana Fusarium wilt. Compared with conducive soils, the suppressive soils have roughly higher enzyme activities, nutrient contents, microbial abundance and diversity. Moreover, the microbial taxonomic composition strongly varied between disease-suppressive and -conducive soils. For instance, there were relative abundance differences in key microbiology communities, such as Actinobacteria, Firmicutes, Bacteroidetes, Proteobacteria and Ascomycota, especially antagonistic microorganisms (i.e., Streptomyces, Pseudomonas, Trichoderma, etc.) across various fractions. The SEM showed that the complex associations among the soil PSFs composition, availability of physiochemical parameters and microbial communities within different soil fractions were mediated by multiple pathways, which further drove the soil enzyme activities, influencing the suppressiveness of soil towards disease. Collectively, these results suggest that microbial communities may be important in the development of soil suppressiveness against banana Fusarium wilt disease.

Supplementary Materials

The following supporting information can be downloaded at: https://www.mdpi.com/article/10.3390/agronomy12020229/s1, Table S1: The relative abundances (% of individual taxonomic group) of the dominant bacterial genera present in various fractions of suppressive and conducive soils (SD and ST); Table S2: The relative abundances (% of individual taxonomic group) of the major fungal genera present in various fractions of suppressive and conducive soils (SD and ST); Table S3: Indices of fit for the structural equation models given in Figure 5; Table S4: Indices of fit for the structural equation models given in Figure 6; Figure S1: The activities of sucrase (A), urease (B), neutral phosphatase (C) and catalase (D) within different soil fractions; Figure S2: The populations of microbial flora (bacteria, fungi and F. oxysporum) in various soil fractions (>2, 2–0.25, 0.25–0.053, and <0.053 mm) of the suppressive and conducive soils; Figure S3: Relative abundance (%) of the fungal phyla present in various fractions of the suppressive and conducive soils; Figure S4: Relative abundance (%) of the bacterial genera present in various soil fractions of SD suppressive (A) and conducive soils (B); Figure S5: Relative abundance (%) of the bacterial genera present in various soil fractions of ST suppressive (A) and conducive soils (B); Figure S6: Relative abundance (%) of the fungal genera present in various soil fractions of SD suppressive soil (A) and conducive soils (B); Figure S7: Relative abundance (%) of the fungal genera present in various soil fractions of ST suppressive soil (A) and conducive soils (B).

Author Contributions

Conceptualization, S.W.; methodology, S.W., Q.W., L.Z., H.J. and B.C.; software, H.Y.; validation, S.W., Q.W., L.Z., H.J. and B.C.; formal analysis, Q.W., L.Z., H.J. and B.C.; investigation, H.Y. and S.W.; resources, S.W.; data curation, S.W.; writing—original draft preparation, S.W., Q.W., L.Z., H.J. and B.C.; writing—review and editing, S.W.; supervision, S.W.; project administration, S.W.; funding acquisition, S.W. and Q.W. All authors have read and agreed to the published version of the manuscript.

Funding

This research received no external funding.

Institutional Review Board Statement

Not applicable.

Informed Consent Statement

Not applicable.

Acknowledgments

This work was financially supported by National Natural Science Foundation of China (41671256), Jiangsu Province Taizhou Science and Technology Support Program of China (SNY20208824), Jiangsu Policy Guidance Program (SZ-SQ2020034), College-Enterprise Cooperation Project (2020kj026), and National Basic Research Program of China (2015CB150504). We would like to thank Gongwen Luo for the help in statistical analysis.

Conflicts of Interest

The authors declared that they have no conflict of interest to this work.

References

  1. Pegg, K.; Moore, N.; Bentley, S. Fusarium wilt of banana in Australia: A review. Aust. J. Agric. Res. 1996, 47, 637–650. [Google Scholar] [CrossRef]
  2. Butler, D. Fungus Threatens Top Banana. Nature 2013, 504, 195–196. [Google Scholar] [CrossRef] [PubMed] [Green Version]
  3. Chen, Y.F.; Chen, W.; Huang, X.; Hu, X.; Zhao, J.T.; Gong, Q.; Li, X.J. Fusarium wilt-resistant lines of Brazil banana (Musa spp., AAA) obtained by EMS-induced mutation in a micro-cross-section cultural system. Plant Pathol. 2013, 62, 112–119. [Google Scholar] [CrossRef]
  4. Alabouvette, C. Fusarium wilt suppressive soils: An example of disease-suppressive soils. Australas. Plant Pathol. 1999, 28, 57–64. [Google Scholar] [CrossRef]
  5. Fravel, D.; Olivain, C.; Alabouvette, C. Fusarium oxysporum and its biocontrol. New Phytol. 2003, 157, 493–502. [Google Scholar] [CrossRef] [PubMed]
  6. Nel, B.; Steinberg, C.; Labuschagne, N.; Viljoen, A. The potential of nonpathogenic Fusarium oxysporum and other biological control organisms for suppressing fusarium wilt of banana. Plant Pathol. 2006, 55, 217–223. [Google Scholar] [CrossRef]
  7. Xiong, W.; Zhao, Q.; Xue, C.; Xun, W.; Zhao, J.; Wu, H.; Li, R.; Shen, Q. Comparison of Fungal Community in Black Pepper-Vanilla and Vanilla Monoculture Systems Associated with Vanilla Fusarium Wilt Disease. Front. Microbiol. 2016, 7, 117. [Google Scholar] [CrossRef]
  8. Shen, Z.; Ruan, Y.; Xue, C.; Zhong, S.; Li, R.; Shen, Q. Soils naturally suppressive to banana Fusarium wilt disease harbor unique bacterial communities. Plant Soil 2015, 393, 21–33. [Google Scholar] [CrossRef]
  9. Xiong, W.; Zhao, Q.; Zhao, J.; Xun, W.; Li, R.; Zhang, R.; Wu, H.; Shen, Q. Different Continuous Cropping Spans Significantly Affect Microbial Community Membership and Structure in a Vanilla-Grown Soil as Revealed by Deep Pyrosequencing. Microb. Ecol. 2014, 70, 209–218. [Google Scholar] [CrossRef]
  10. Xiong, W.; Li, R.; Ren, Y.; Liu, C.; Zhao, Q.; Wu, H.; Jousset, A.; Shen, Q. Distinct roles for soil fungal and bacterial communities associated with the suppression of vanilla Fusarium wilt disease. Soil Biol. Biochem. 2017, 107, 198–207. [Google Scholar] [CrossRef]
  11. Boudreau, M.A. Factors Influencing Antagonism of Chaetomium globosum to Venturia inaequalis: A Case Study in Failed Biocontrol. Phytopathology 1987, 77, 1470–1475. [Google Scholar] [CrossRef]
  12. Kubicek, C.P.; Mach, R.L.; Peterbauer, C.K.; Lorito, M. Trichoderma: From Genes to Biocontrol. J. Plant Pathol. 2001, 83, 11–23. [Google Scholar]
  13. De Boer, M.; Bom, P.; Kindt, F.; Keurentjes, J.J.B.; van der Sluis, I.; van Loon, L.C.; Bakker, P.A.H.M. Control of Fusarium Wilt of Radish by Combining Pseudomonas putida Strains that have Different Disease-Suppressive Mechanisms. Phytopathology 2003, 93, 626–632. [Google Scholar] [CrossRef] [Green Version]
  14. Kyselková, M.; Kopecky, J.; Frapolli, M.; Défago, G.; Ságová-Marečková, M.; Grundmann, G.L.; Moënne-Loccoz, Y. Comparison of rhizobacterial community composition in soil suppressive or conducive to tobacco black root rot disease. ISME J. 2009, 3, 1127–1138. [Google Scholar] [CrossRef] [Green Version]
  15. Huse, S.M.; Dethlefsen, L.; Huber, J.; Welch, D.M.; Relman, D.; Sogin, M.L. Exploring Microbial Diversity and Taxonomy Using SSU rRNA Hypervariable Tag Sequencing. PLoS Genet. 2008, 4, e1000255. [Google Scholar] [CrossRef]
  16. Huang, X.; Liu, L.; Wen, T.; Zhu, R.; Zhang, J.; Cai, Z. Illumina MiSeq investigations on the changes of microbial community in the Fusarium oxysporum f. sp. cubense infected soil during and after reductive soil disinfestation. Microbiol. Res. 2015, 181, 33–42. [Google Scholar] [CrossRef] [PubMed]
  17. Six, J.; Paustian, K.; Elliott, E.T.; Combrink, C. Soil Structure and Organic Matter I. Distribution of Aggregate-Size Classes and Aggregate-Associated Carbon. Soil Sci. Soc. Am. J. 2000, 64, 681–689. [Google Scholar] [CrossRef]
  18. Dominguez, J.; Negrin, M.A.; Rodriguez, C.M. Aggregate water-stability, particle-size and soil solution properties in conducive and suppressive soils to Fusarium wilt of banana from Canary Islands (Spain). Soil Biol. Biochem. 2001, 33, 449–455. [Google Scholar] [CrossRef]
  19. Miller, M.; Dick, R.P. Dynamics of soil C and microbial biomass in whole soil and aggregates in two cropping systems. Appl. Soil Ecol. 1995, 2, 253–261. [Google Scholar] [CrossRef]
  20. Zhang, P.; Zheng, J.; Pan, G.; Zhang, X.; Li, L.; Rolf, T. Changes in microbial community structure and function within particle size fractions of a paddy soil under different long-term fertilization treatments from the Tai Lake region, China. Colloids Surf. B Biointerfaces 2007, 58, 264–270. [Google Scholar] [CrossRef]
  21. Roldán, A.; Salinas-García, J.; Alguacil, M.; Caravaca, F. Changes in soil enzyme activity, fertility, aggregation and C sequestration mediated by conservation tillage practices and water regime in a maize field. Appl. Soil Ecol. 2005, 30, 11–20. [Google Scholar] [CrossRef]
  22. Oades, J. The role of biology in the formation, stabilization and degradation of soil structure. Geoderma 1993, 56, 377–400. [Google Scholar] [CrossRef]
  23. Cheshire, M.V.; Sparling, G.P.; Mundie, C.M. Effect of periodate treatment of soil on carbohydrate constituents and soil aggregation. Eur. J. Soil Sci. 1983, 34, 105–112. [Google Scholar] [CrossRef]
  24. Bastida, F.; Moreno, J.L.; Hernandez, T.; García, C. Microbiological activity in a soil 15 years after its devegetation. Soil Biol. Biochem. 2006, 38, 2503–2507. [Google Scholar] [CrossRef]
  25. Loeppmann, S.; Blagodatskaya, E.; Pausch, J.; Kuzyakov, Y. Substrate quality affects kinetics and catalytic efficiency of exoenzymes in rhizosphere and detritusphere. Soil Biol. Biochem. 2016, 92, 111–118. [Google Scholar] [CrossRef]
  26. Strickland, M.S.; Rousk, J. Considering fungal:bacterial dominance in soils—Methods, controls, and ecosystem implications. Soil Biol. Biochem. 2010, 42, 1385–1395. [Google Scholar] [CrossRef]
  27. Basaran, P.; Ozcan, M.; Denisov, Y.; Freeman, S. Elucidation of Pectinolytic Enzyme Activities of a Non-Pathogenic Watermelon Pathogen Mutant, Fusarium oxysporum f.sp Niveum M87. Australas. Plant Pathol. 2007, 36, 135–141. [Google Scholar] [CrossRef]
  28. Giannakis, C.; Bucheli, C.S.; Skene, K.G.M.; Robinson, S.P.; Scott, N.S. Chitinase and β-1,3-glucanase in grapevine leaves: A possible defence against powdery mildew infection. Aust. J. Grape Wine Res. 1998, 4, 14–22. [Google Scholar] [CrossRef]
  29. Huang, Y.; Li, C.; Wei, Y.; Yi, G. Effects of Fusarium oxysporum f. sp. Cubense Race 4 on Microorganisms and Enzyme Activities in the Rhizosphere Soil of Banana. J. Hunan Agric. Univ. 2012, 38, 173–176. [Google Scholar] [CrossRef]
  30. Yao, S.H.; Jia, L.J.; Zhang, X.W.; Zhang, D.; Xu, L. Biological Function Analysis of a Pectate Lyase Pela in Fusarium Graminerum. Plant Physiol. J. 2014, 50, 243–252. [Google Scholar]
  31. Elliott, E.T. Aggregate Structure and Carbon, Nitrogen, and Phosphorus in Native and Cultivated Soils. Soil Sci. Soc. Am. J. 1986, 50, 627–633. [Google Scholar] [CrossRef]
  32. Claesson, M.J.; O’Sullivan, O.; Wang, Q.; Nikkilä, J.; Marchesi, J.R.; Smidt, H.; De Vos, W.M.; Paul Ross, R.; O’Toole, P.W. Comparative Analysis of Pyrosequencing and a Phylogenetic Microarray for Exploring Microbial Community Structures in the Human Distal Intestine. PLoS ONE 2009, 4, e6669. [Google Scholar] [CrossRef] [Green Version]
  33. Gardes, M.; Bruns, T.D. ITS primers with enhanced specificity for basidiomycetes—Application to the identification of mycorrhizae and rusts. Mol. Ecol. 1993, 2, 113–118. [Google Scholar] [CrossRef]
  34. White, T.J.; Bruns, T.; Lee SJ, W.T.; Taylor, J. Amplification and Direct Sequencing of Fungal Ribosomal Rna Genes for Phylogenetics. Pcr Protoc. A Guide Methods Appl. 1990, 18, 315–322. [Google Scholar]
  35. Lievens, B.; Brouwer, M.; Vanachter, A.C.R.C.; Levesque, C.A.; Cammue, B.P.A.; Thomma, B.P.H.J. Quantitative assessment of phytopathogenic fungi in various substrates using a DNA macroarray. Environ. Microbiol. 2005, 7, 1698–1710. [Google Scholar] [CrossRef] [PubMed]
  36. Muyzer, G.; de Waal, E.C.; Uitterlinden, A.G. Profiling of complex microbial populations by denaturing gradient gel electrophoresis analysis of polymerase chain reaction-amplified genes coding for 16S rRNA. Appl. Environ. Microbiol. 1993, 59, 695–700. [Google Scholar] [CrossRef] [Green Version]
  37. May, L.A.; Smiley, B.; Schmidt, M.G. Comparative denaturing gradient gel electrophoresis analysis of fungal communities associated with whole plant corn silage. Can. J. Microbiol. 2001, 47, 829–841. [Google Scholar] [CrossRef]
  38. López-Mondéjar, R.; Antón, A.; Raidl, S.; Ros, M.; Pascual, J. Quantification of the biocontrol agent Trichodermaharzianum with real-time TaqMan PCR and its potential extrapolation to the hyphal biomass. Bioresour. Technol. 2010, 101, 2888–2891. [Google Scholar] [CrossRef] [PubMed]
  39. Schloss, P.D.; Westcott, S.L.; Ryabin, T.; Hall, J.R.; Hartmann, M.; Hollister, E.B.; Lesniewski, R.A.; Oakley, B.B.; Parks, D.H.; Robinson, C.J.; et al. Introducing mothur: Open-Source, Platform-Independent, Community-Supported Software for Describing and Comparing Microbial Communities. Appl. Environ. Microbiol. 2009, 75, 7537–7541. [Google Scholar] [CrossRef] [PubMed] [Green Version]
  40. Caporaso, J.G.; Kuczynski, J.; Stombaugh, J.; Bittinger, K.; Bushman, F.D.; Costello, E.K.; Fierer, N.; Peña, A.G.; Goodrich, J.K.; Gordon, J.I.; et al. QIIME allows analysis of high-throughput community sequencing data. Nat. Methods 2010, 7, 335–336. [Google Scholar] [CrossRef] [Green Version]
  41. Edwards, J.; Johnson, C.; Santos-Medellin, C.; Lurie, E.; Podishetty, N.K.; Bhatnagar, S.; Eisen, J.A.; Sundaresan, V. Structure, variation, and assembly of the root-associated microbiomes of rice. Proc. Natl. Acad. Sci. USA 2015, 112, E911–E920. [Google Scholar] [CrossRef] [Green Version]
  42. Grace, J.B. Structural Equation Modeling and Natural Systems; Cambridge University Press: Cambridge, UK, 2006. [Google Scholar] [CrossRef]
  43. Schermelleh-Engel, K.; Moosbrugger, H.; Müller, H. Evaluating the Fit of Structural Equation Models: Tests of Significance and Descriptive Goodness-of-Fit Measures. Methods Psychol. Res. Online 2003, 8, 23–74. [Google Scholar]
  44. Xu, L.; Huang, B.; Wu, Y.; Huang, Y.; Dong, T. The Cost-Benefit Analysis for Bananas Diver-sity Production in China Foc. Zones. Am. J. Plant Sci. 2011, 2, 561–568. [Google Scholar] [CrossRef] [Green Version]
  45. Wang, B.; Li, R.; Ruan, Y.; Ou, Y.; Zhao, Y.; Shen, Q. Pineapple–banana rotation reduced the amount of Fusarium oxysporum more than maize–banana rotation mainly through modulating fungal communities. Soil Biol. Biochem. 2015, 86, 77–86. [Google Scholar] [CrossRef]
  46. He, Y.; Zhou, X.; Li, J.; Li, H.; Li, Y.; Nie, Y. In Vitro Secretome Analysis Suggests Differential Pathogenic Mechanisms between Fusarium oxysporum f. sp. cubense Race 1 and Race 4. Biomolecules 2021, 11, 1353. [Google Scholar] [CrossRef] [PubMed]
  47. Kema, G.H.J.; Drenth, A.; Dita, M.; Jansen, K.; Vellema, S.; Stoorvogel, J.J. Editorial: Fusarium Wilt of Banana, a Recurring Threat to Global Banana Production. Front. Plant Sci. 2021, 11, 2177. [Google Scholar] [CrossRef] [PubMed]
  48. Thangavelu, R.; Edwin Raj, E.; Muthukathan, G.; Murugan, L.; Uma, S. Draft Genome Resource of a Novel Virulent Fusarium oxysporum f. sp. cubense Race 1 Strain (VCG 0124) Infecting Cavendish (AAA) Group of Banana in India. Plant Dis. 2021, 105, 2708–2710. [Google Scholar] [CrossRef]
  49. Wang, X.; Yu, R.; Li, J. Using Genetic Engineering Techniques to Develop Banana Cultivars with Fusarium Wilt Resistance and Ideal Plant Architecture. Front. Plant Sci. 2021, 11, 2202. [Google Scholar] [CrossRef]
  50. Mazzola, M. Assessment and Management of Soil Microbial Community Structure for Disease Suppression. Annu. Rev. Phytopathol. 2004, 42, 35–59. [Google Scholar] [CrossRef]
  51. Manici, L.; Caputo, F. Fungal community diversity and soil health in intensive potato cropping systems of the east Po valley, northern Italy. Ann. Appl. Biol. 2009, 155, 245–258. [Google Scholar] [CrossRef]
  52. Kim, Y.C.; Leveau, J.; Gardener, B.B.M.; Pierson, E.A.; Pierson, L.S.; Ryu, C.-M. The Multifactorial Basis for Plant Health Promotion by Plant-Associated Bacteria. Appl. Environ. Microbiol. 2011, 77, 1548–1555. [Google Scholar] [CrossRef] [Green Version]
  53. Palaniyandi, S.A.; Yang, S.H.; Zhang, L.; Suh, J.-W. Effects of actinobacteria on plant disease suppression and growth promotion. Appl. Microbiol. Biotechnol. 2013, 97, 9621–9636. [Google Scholar] [CrossRef] [PubMed]
  54. Mendes, R.; Kruijt, M.; de Bruijn, I.; Dekkers, E.; Van Der Voort, M.; Schneider, J.H.; Piceno, Y.M.; DeSantis, T.Z.; Andersen, G.L.; Bakker, P.A.; et al. Deciphering the Rhizosphere Microbiome for Disease-Suppressive Bacteria. Science 2011, 332, 1097–1100. [Google Scholar] [CrossRef] [PubMed]
  55. Kavino, M.; Harish, S.; Kumar, N.; Saravanakumar, D.; Samiyappan, R. Effect of chitinolytic PGPR on growth, yield and physiological attributes of banana (Musa spp.) under field conditions. Appl. Soil Ecol. 2010, 45, 71–77. [Google Scholar] [CrossRef]
  56. Buysens, S.; Heungens, K.; Poppe, J.; Hofte, M. Involvement of Pyochelin and Pyoverdin in Suppression of Pythium-Induced Damping-Off of Tomato by Pseudomonas Aeruginosa 7nsk2. Appl. Environ. Microbiol. 1996, 62, 865–871. [Google Scholar] [CrossRef] [PubMed] [Green Version]
  57. Berta, G.; Sampo, S.; Gamalero, E.; Massa, N.; Lemanceau, P. Suppression of Rhizoctonia root-rot of tomato by Glomus mossae BEG12 and Pseudomonas fluorescens A6RI is associated with their effect on the pathogen growth and on the root morphogenesis. Eur. J. Plant Pathol. 2005, 111, 279–288. [Google Scholar] [CrossRef]
  58. Wiggins, B.E.; Kinkel, L.L. Green manures and crop sequences influence alfalfa root rot and pathogen inhibitory activity among soil-borne streptomycetes. Plant Soil 2005, 268, 271–283. [Google Scholar] [CrossRef]
  59. Faheem, M.; Raza, W.; Zhong, W.; Nan, Z.; Shen, Q.; Xu, Y. Evaluation of the biocontrol potential of Streptomyces goshikiensis Ycxu against Fusarium oxysporum f. sp. Niveum. Biol. Control 2015, 81, 101–110. [Google Scholar] [CrossRef]
  60. Shen, T.; Wang, C.; Yang, H.; Deng, Z.; Wang, S.; Shen, B.; Shen, Q. Identification, solid-state fermentation and biocontrol effects of Streptomyces hygroscopicus B04 on strawberry root rot. Appl. Soil Ecol. 2016, 103, 36–43. [Google Scholar] [CrossRef]
  61. Yu, H.Y.; Ding, W.X.; Luo, J.F.; Geng, R.L.; Cai, Z.C. Long-term application of organic manure and mineral fertilizers on aggregation and aggregate-associated carbon in a sandy loam soil. Soil Tillage Res. 2012, 124, 170–177. [Google Scholar] [CrossRef]
  62. Zhang, Q.; Zhou, W.; Liang, G.; Sun, J.; Wang, X.; He, P. Distribution of soil nutrients, extracellular enzyme activities and microbial communities across particle-size fractions in a long-term fertilizer experiment. Appl. Soil Ecol. 2015, 94, 59–71. [Google Scholar] [CrossRef]
Figure 1. Unconstrained PCoA using the weighted UniFrac distance metric indicates the differences in the bacterial (A) and fungal (B) communities across various fractions of the suppressive and conducive soils. Samples from different soils and particle-size fractions are marked with different colors. Symbols for soils and different-sized fractions are described in Table 1. ST-S, silt loam-suppressive; ST-C, silt loam-conducive; SD-S, sandy loam-suppressive; and SD-C, sandy loam-conducive. Each sample includes three replications.
Agronomy 12 00229 g001
Figure 2. Relative abundance (%) of bacterial phyla present in various fractions of the suppressive and conducive soils. The phyla in various fractions with relative abundances larger than 0.03% are listed in the figure (n = 3). “Others” indicates extremely low-abundance phyla. SD, sandy loam and ST, silt loam.
Agronomy 12 00229 g002
Figure 3. VPA map of the effects of the soil attributes, composition of soil particle-size fraction (PSFs), soil conditions (conducive or suppressive), and the interactions of these factors on the community structure of bacteria (A) and fungi (B). The soil attributes include the total carbon, total nitrogen, C/N, and the activities of urease, sucrase, catalase and neutral phosphatase. In the VPA map, “**” indicates a significance of p < 0.01; “*” indicates a significance of p < 0.05, and the percentage of variation explained by interactions between two or three of the factors is indicated as gray squares and circles on the sides.
Agronomy 12 00229 g003
Figure 4. Multivariate regression tree (MRT) analysis of the relationship between the community structure of the bacteria (A) and fungi (B) and soil attributes across the various soil fractions. <0.053-size, the percentage of <0.053 mm-sized soil fraction; >2-size, the percentage of >2 mm-sized soil fraction; TC, total carbon; TN, total nitrogen; and C/N, carbon and nitrogen ratio. The bar plots show the mean relative abundance of OTUs at each terminal node, and the distribution patterns of abundance represent the dynamics of the response to the soil attributes among each split. The numbers under the bar plots indicate the number of samples within each group.
Agronomy 12 00229 g004
Figure 5. Structural equation modeling (SEM) shows the direct and indirect effects of the bacterial diversity, abundances and community structure on enzyme activities in the soils, in panel (A). Panel (B) shows the standardized total effects of each individual driver. Continuous and dashed arrows indicate positive (p < 0.05) and negative (p < 0.05) relationships, respectively. The blue, green and gray arrows represent the paths of the physiochemical factors, bacterial diversity, abundance and community structure, and the F. oxysporum abundance that affects the enzyme activities, respectively. Numbers following the included variables show the explained percentage of its variance by its predictors. The numbers on the arrows are the standardized path coefficients. The models fit the data well. Model fits are given in Table S4. TC, soil total carbon; TN, soil total nitrogen; C/N, C, N ratio; PSFs, the composition of soil particle-size fractions; Bacterial ST, bacterial community structure.
Agronomy 12 00229 g005
Figure 6. Structural equation modeling (SEM) showed the direct and indirect effects of the fungal diversity, abundance and community structure on the enzyme activities in the soils in panel (A). Panel (B) shows the standardized total effects of each individual driver. Continuous and dashed arrows indicate positive (p < 0.05) and negative (p < 0.05) relationships, respectively. The blue, green and gray arrows represent the paths of the physiochemical factors, fungal diversity, abundance and community structure, respectively. The numbers following the included variables show the explained percentage of its variance by its predictors. The numbers on the arrows are standardized path coefficients. The models fit the data well. Model fits are given in Table S5. TC, soil total carbon; TN, soil total nitrogen; C/N, C, N ratio; PSFs, the composition of soil particle-size fractions; and Fungal ST, fungal community structure.
Agronomy 12 00229 g006
Table 1. The characteristics of different soil fractions a.
Soils bParticle Size (mm)Fraction Amount (%)TC c (g/kg)TN (g/kg)C/N
ST-S>218.28 ± 4.65 b15.87 ± 0.06 b1.50 ± 0.36 b10.96 ± 0.42 a
0.25–272.53 ± 5.93 a17.73 ± 1.17 a1.83 ± 0.21 a9.71 ± 0.49 c
0.052–0.255.50 ± 1.82 c18.63 ± 1.52 a1.90 ± 0.36 a9.96 ± 0.20 c
<0.0535.63 ± 0.83 c18.60 ± 0.20 a1.87 ± 0.35 a10.22 ± 0.09 b
ST-C>29.71 ± 3.31 b14.87 ± 0.31 c1.37 ± 0.15 c10.96 ± 0.15 a
0.25–272.39 ± 5.35 a15.97 ± 0.55 b1.50 ± 0.10 b10.67 ± 0.35 a
0.052–0.254.99 ± 2.62 c16.70 ± 0.89 b1.52 ± 0.09 b11.17 ± 0.22 a
<0.05312.91 ± 1.07 b18.70 ± 1.59 a1.83 ± 0.15 a10.21 ± 0.16 b
SD-S>26.11 ± 3.68 b16.97 ± 0.71 a1.70 ± 0.36 a10.37 ± 0.27 b
0.25–278.66 ± 5.53 a16.17 ± 1.12 a1.57 ± 0.15 b10.39 ± 0.32 b
0.052–0.258.68 ± 1.11 b17.47 ± 1.27 a1.63 ± 0.35 b11.04 ± 2.67 a
<0.0536.55 ± 2.32 b17.73 ± 3.00 a1.73 ± 0.32 a10.25 ± 0.30 b
SD-C>22.57 ± 0.61 c11.77 ± 1.72 c1.43 ± 0.49 b8.55 ± 0.47 c
0.25–277.74 ± 2.67 a15.90 ± 1.57 b1.40 ± 0.26 b11.50 ± 0.36 a
0.052–0.2511.04 ± 1.84 b15.47 ± 0.81 b1.43 ± 0.23 b10.91 ± 0.09 b
<0.0538.65 ± 1.93 b17.60 ± 0.62 a1.57 ± 0.12 a11.28 ± 0.17 a
a Values show the means (n = 3) ± the standard error of the mean. Values in all of the treatments followed by a different lowercase letter indicate a significant difference according to Duncan’s LSD test (p < 0.05). b ST-S, silt loam-suppressive; ST-C, silt loam-conducive; SD-S, sandy loam-suppressive; SD-C, sandy loam-conducive. c TC, total carbon; TN, total nitrogen; C/N, carbon and nitrogen ratio.
Table 2. The Shannon indexes of bacterial and fungal communities in different soil fractions a.
Particle Size (mm)Bacteria Shannon DiversityFungi Shannon Diversity
ConduciveSuppressiveConduciveSuppressive
SD b>26.23 ± 0.28 a6.27 ± 0.41 a3.73 ± 0.53 a4.00 ± 0.68 a
2–0.256.16 ± 0.11 a6.24 ± 0.34 a3.08 ± 0.85 b4.15 ± 0.25 a
0.25–0.0536.23 ± 0.37 a6.58 ± 0.17 a3.49 ± 0.51 a4.01 ± 0.45 a
<0.0533.27 ± 0.32 b3.70 ± 0.54 b3.20 ± 0.44 a2.13 ± 0.67 b
ST>26.34 ± 0.19 a6.30 ± 0.22 b2.93 ± 0.24 a3.15 ± 0.19 a
2–0.256.60 ± 0.05 a6.65 ± 0.13 a2.90 ± 0.43 a3.10 ± 0.33 a
0.25–0.0535.98 ± 0.20 a6.78 ± 0.11 a2.72 ± 0.37 a2.76 ± 0.99 a
<0.0533.96 ± 0.98 b4.58 ± 0.22 c3.25 ± 0.64 a3.45 ± 0.37 a
a Values show the means (n = 3) ± the standard error of the mean. Values in all of the treatments followed by a different lowercase letter indicate a significant difference according to Duncan’s LSD test (p < 0.05). b SD, sandy loam; ST, silt loam.
Publisher’s Note: MDPI stays neutral with regard to jurisdictional claims in published maps and institutional affiliations.

