Article

Influence of N, K, and Seaweed Extract Fertilization on Biomass, Photosynthetic Pigments, and Essential Oil of Thymus vulgaris: Optimization Study by Response Surface Methodology

by
Shaida Muetasam Jafr
1,
Abdol Rahman Rahimi
2,
Masoud Hashemi
3,* and
Asad Rokhzadi
2,4,*
1
Department of Horticulture and Agronomy Science, Science and Research Branch, Islamic Azad University, Tehran 1477893855, Iran
2
Department of Agronomy and Plant Breeding, Sanandaj Branch, Islamic Azad University, Sanandaj 6616935391, Iran
3
Stockbridge School of Agriculture, University of Massachusetts Amherst, Amherst, MA 01003, USA
4
Research Center for Agriculture, Animal Husbandry, and Medicinal Plants, Sanandaj Branch, Islamic Azad University, Sanandaj 6616935391, Iran
*
Authors to whom correspondence should be addressed.
Agronomy 2022, 12(12), 3222; https://doi.org/10.3390/agronomy12123222
Submission received: 16 November 2022 / Revised: 14 December 2022 / Accepted: 16 December 2022 / Published: 19 December 2022

Abstract

:
Nutrient management has a decisive impact on the biomass and essential oil yield of medicinal plants. This study aimed to determine the optimal levels of nitrogen, potassium, and seaweed extract fertilizers to maximize the yield and quality of thyme using the response surface methodology (RSM). The experiment was laid out as a Box-Behnken design with three replications and three experimental factors, including nitrogen (urea) (0, 200, and 400 kg ha−1), and foliar application of potassium (Flourish Sulfopotash) (0, 6, and 12 kg ha−1) and seaweed extract (0, 3, and 6 L ha−1). The generated models were statistically significant for all measured traits except for γ-terpinene and p-cymene. While the influence of N on the amount of photosynthetic pigments followed a quadratic trend, the response of total chlorophyll and carotenoids to increasing potassium was linear. The response of biomass yield to N and seaweed was quadratic and linear, respectively. Potassium application had no significant influence on biomass. Essential oil yield reached its peak value (12 kg ha−1) when N and seaweed were applied at their intermediate levels and with the maximum application rate of potassium. Thymol was identified as the highest essential oil component (46.1%), followed by γ-terpinene (19.2%), p-cymene (14.1%), and carvacrol (5.6%). The optimization results suggested that the application of 162 kg ha−1 urea, 12 kg ha−1 Flourish Sulfopotash, and 4 L ha−1 seaweed extract was sufficient to produce the maximum dry matter (1247 kg ha−1), and more than 11 kg ha−1 of essential oil, with a concentration of 1%. Through optimization, the amounts of thymol and carvacrol were estimated to be as much as 44.2% and 6.2%, respectively. The results of the study suggested that resource optimization through RSM can be used as an efficient method to manage the consumption of fertilizers in thyme production.

1. Introduction

In recent years, soil health has received substantial attention and nutrient management has shifted dramatically to the natural soil fertility and use of organic sources of nutrients as an alternative to synthetic fertilizers [1]. Medicinal and herbal plants, including thyme, are traditionally known for being tolerant to marginal soils and low nutrient requirements. However, the optimal management of fertilizers is essential for achieving the maximum economic yield of medicinal plants. Synthetic nitrogen fertilizers are the most widely used chemical fertilizers in agriculture [2]. While it is necessary to supply sufficient nitrogen to crop plants to produce optimal yields, improper nitrogen management is a serious challenge to the sustainability of farming and a major threat to the environment. The influence of fertilizers on quantitative and qualitative traits of medicinal plants is well-documented. The findings of a two-year study by Emami Bistgani et al. [1] using different sources of fertilizers suggested that the highest biomass and biochemical properties of thyme could be obtained from the application of combined organic and inorganic sources of nutrients. Similarly, fertilization of thyme with a combination of mineral NPK, spent mushroom substrate (SMS), and farmyard manure resulted in the production of the highest biomass. However, the antioxidant properties of thyme were highest when SMS fertilization was used [3]. Studies on other medicinal and herbal plants also indicated that biomass yield and essential oils content and yield were improved by the addition of fertilizers to the crop [4,5,6].
Phosphorus and potassium are the most important macronutrients for plants after nitrogen [7]. The influence of potassium on the yield, essential oils, and major components of various medicinal and aromatic plants, such as marigolds [8], lavender [9], and coriander [10], has been reported.
The use of environment-friendly inputs of natural and organic origin resources can stimulate plant growth by improving the efficient use of synthetic fertilizers [1,11]. Seaweed extracts are among the organic products that are widely used as a biostimulant in crop production due to their growth-stimulating and other beneficial effects on plants [12,13]. For example, the application of Kelpak seaweed extracts to plants grown under phosphorus and potassium deficiency resulted in a significant improvement in the growth of okra seedlings [14]. In another experiment, the application of Ascophyllum nodosum seaweed extract alleviated the negative influence of drought stress on spinach by improving relative water content and leaf area, thus increasing its overall yield [15]. Reports indicated that the foliar application of seaweed, compared with soil application, is more effective in the improvement of plant growth and yield [16,17].
Thyme (Thymus vulgaris L.) is one of the important medicinal plants of the Lamiaceae family and is native to the Mediterranean regions of Southern Europe. It is distributed worldwide and currently is cultivated for use in the food and pharmaceutical industries due to its unique pharmaceutical components, including terpenoids, phenolics, and flavonoids [18,19,20]. Thymol, γ-terpinene, p-cymene, and carvacrol have been identified as important components of thyme essential oil [20]. These compounds have significant antibacterial, antifungal, antioxidant, anti-tumor, and anti-inflammatory characteristics [18]. In recent years, the cultivation of thyme has become popular in Iran; however, its production relies on use of synthetic fertilizers.
Due to human health and environmental concerns, the use of agrochemicals, including fertilizers, must be fine-tuned. Despite the critical role of nutrients in optimizing the growth and yield of medicinal plants and their associated essential oils, there is a gap in information about the simultaneous optimization of various nutrient resources for thyme cultivation.
The current study aimed to determine the optimal levels of nitrogen, potassium, and seaweed extract sources to maximize thyme dry matter, essential oil yield, and its major essential oil components using response surface methodology.

2. Materials and Methods

2.1. Experimental Conditions and Management

The present study was conducted in the spring and summer of 2021 at the research farm of Sanandaj Azad University (35°10′ N, 46°59′ E, and 1386 m above sea level) with an average temperature of 13.4 °C and a long-term annual rainfall of 471 mm. The mean air temperature and rainfall during the growing season of 2021 and the norm for the growing period, and the properties of the soil in the experimental site are shown in Table 1 and Table 2, respectively. The effects of nitrogen (urea), potassium (Flourish Sulfopotash, K2O 50%), and seaweed extract (Ascokelp brand, containing 5% seaweed extract, 2% free amino acids, 13% organic matter, 0.2% nitrogen, 5% K2O, and 1% P2O5) on various parameters of thyme (Thymus vulgaris L.) were investigated. Fertilizer treatment consisted of urea in three levels of 0, 200, and 400 kg ha−1, Flourish Sulfopotash in three rates of 0, 6, and 12 kg ha−1, and seaweed extract in three levels of 0, 3, and 6 L ha−1. Thyme seeds (obtained from Zarringiah Company, Urmia, Iran) were sown in the greenhouse, and after 45 days, the seedlings were transplanted into the experimental plots on 9 May. The experimental plots consisted of four planting rows, 4 m in length with an inter-row spacing of 0.7 m and 0.2 m between the plants within the rows. The experiment consisted of three replications. The nitrogen fertilizer was split and applied at two equal rates, at the stem elongation stage and then three weeks later. The potassium fertilizer was used as a foliar spray during the stem elongation stage, and seaweed extract was also foliar sprayed three times at two-week intervals from the stem elongation stage onwards. The experimental plots were irrigated throughout the experiment through a drip tape system. The amount of consumed irrigation water was recorded, using a shut-off valve to bring the soil moisture content to the field capacity. The weeds were controlled manually during the growing season of thyme when needed.

2.2. Measurements

2.2.1. Photosynthetic Pigments

Leaf samples were harvested at the full flowering stage from each experimental plot. A total of 0.5 g of fresh leaves was placed in 10 mL of 80% acetone and kept in the dark for 24 h in a refrigerator at a temperature of 4 °C. Then, the samples were centrifuged and the absorbance of the supernatant solution of each sample was recorded by a spectrophotometer at the wavelengths of 470, 663.2, and 646.8 nm. Total chlorophyll and carotenoids were calculated using the following equations [21]:
Chl   a + b   mg   g 1   FW = 7.15   A 663.2 + 18.71   A 646.8 . v / 1000 w
Car   mg   g 1   FW = 1000   A 470 1.82   Chl   a 85.02   Chl   b . v / 198 1000 w
where Chl a + b and Car denote the concentrations of total chlorophyll and carotenoids, respectively. A663.2, A646.8, and A470 are the absorbance values at 663.2, 646.8, and 470 nm, and v and w represent the volume of acetone (mL) and the weight of the fresh leaf sample (g), respectively.

2.2.2. Aerial Biomass

The aerial parts of plants in an area of 2.4 m2 from the two middle rows of each experimental plot were harvested by hand. Harvested plants were dried in a forced-air oven to constant weight, and after drying, the dry weight yield per unit area was calculated.

2.2.3. Essential Oil

To extract the essential oil, 50 g of dried leaves from the harvested plants from each plot were separated, powdered, and subjected to hydro-distillation in a Clevenger-type apparatus for 3 h. The concentration of essential oil was expressed as g per 100 g leaf dry weight, and the essential oil yield was presented as kg ha−1.

2.2.4. Identifying the Essential Oil Components

Analysis of the essential oil samples was conducted by gas chromatography with flame-ionization detection (GC-FID) and gas chromatography coupled with a mass spectrophotometer (GC-MS). An Agilent 7890B GC-FID (Agilent Technologies, Santa Clara, CA, USA) with HP-5MS capillary column (30 m × 0.25 mm, 0.25 µm film thickness) was used. The volume of the injected sample was 0.1 µL and the temperatures of the injector and detector were set at 280 °C and 290 °C, respectively. The samples were injected in a split mode. The carrier gas was helium with a pressure of 34 psi and a flow rate of 1 mL min−1. The initial temperature of the column was kept at 50 °C for 1 min, then raised to 260 °C at a rate of 10 °C per min and kept at this temperature for 8 min. The applied GC-MS device was an Agilent type equipped with a capillary column of HP-5MS (30 m × 0.25 mm, 0.25 µm film thickness). The ionization energy was 70 eV and the investigated mass range was 50 to 550 amu, and the temperature of the ionization source was set at 230 °C. The temperature conditions of the column and carrier gas settings were the same as mentioned for the GC. The essential oil components were identified by comparing their mass spectra with information from databases including NIST and Wiley, as well as through the retention indices (RI) and fracture patterns reported for them. In the present study, a variety of compounds were detected in the thyme essential oil using GC-MS, of which the four compounds, including thymol, γ-terpinene, p-cymene, and carvacrol were identified as major constituents. The relative percentages of essential oil components were determined by calculating the surface area under the GC peaks.

2.3. Statistical Analysis

The data analysis was performed using the response surface methodology (RSM) technique in the Box-Behnken design. The number of experimental runs in the Box-Behnken design was determined as N = 2k(k − 1) + cp, where k and cp indicate the number of experimental factors and center points, respectively [22]. The levels of independent variables, i.e., nitrogen, potassium, and seaweed extract were coded as −1, 0, and +1, equivalent to low, medium, and high levels of each factor, respectively. The actual and coded values of the factor levels are shown in Table 3. The response variables, including the amounts of photosynthetic pigments, shoot dry weight of the plant, the percentage and yield of essential oil, and the main components of essential oil versus the independent variables, i.e., fertilizer factors, were fitted in the form of a full quadratic polynomial model as follows:
y ^ = b 0 + b 1 x 1 + b 2 x 2 + b 3 x 3 + b 11 x 1 2 + b 22 x 2 2 + b 33 x 3 2 + b 12 x 1 x 2 + b 13 x 1 x 3 + b 23 x 2 x 3
where ŷ denotes the predicted response; x1, x2, and x3 represent the coded values of nitrogen, potassium, and seaweed extract fertilizers, respectively; b0 is the intercept; b1, b2, and b3 represent the linear coefficients; b11, b22, and b33 are the quadratic; and b12, b13, and b23 are the interaction coefficients.
The efficiency of the regression models was determined after analysis of variance, according to the significance of the model (p ≤ 0.05) and the non-significance of the “lack of fit” index. In addition, the adequacy of the models was evaluated by calculating the criteria of coefficient of determination (R2), adequate precision, and coefficient of variation (CV).
After selecting variables with a significant response, and based on the desired objectives, the necessary settings were implemented in the software. Optimization analysis using desirability functions was performed to determine the optimal values of the fertilization factors to achieve the experimental objectives. The modeling, optimization, and generation of the plots were carried out using the Design Expert 12 software (Stat-Ease, Inc., Minneapolis, MN, USA).

3. Results

3.1. Evaluation of the Models

The results from analysis of variance indicated that the generated models were statistically significant (p < 0.05) for all tested traits except for γ-terpinene and p-cymene. In addition, if the “lack of fit” term was not significant (p > 0.05), it confirms the efficiency of the model (Table 4 and Table 5). The other criteria used to further explain the performance of the models were the coefficient of determination (R2) and the adequate precision (Table 4 and Table 5). High values of R2 indicate the model’s ability to explain the variations in response variables. The adequate precision index demonstrates the signal-to-noise ratio and is acceptable only if the index is higher than 4. The high values of R2 (>0.90) and the adequate precision (>4) for the attributes of total chlorophyll and carotenoids content, biomass dry weight, essential oil content and yield, thymol, and carvacrol content indicated the adequacy of the models for these traits (Table 4 and Table 5). The low index values for γ-terpinene and p-cymene indicated the inadequacy of the regression models for these two components (Table 5).

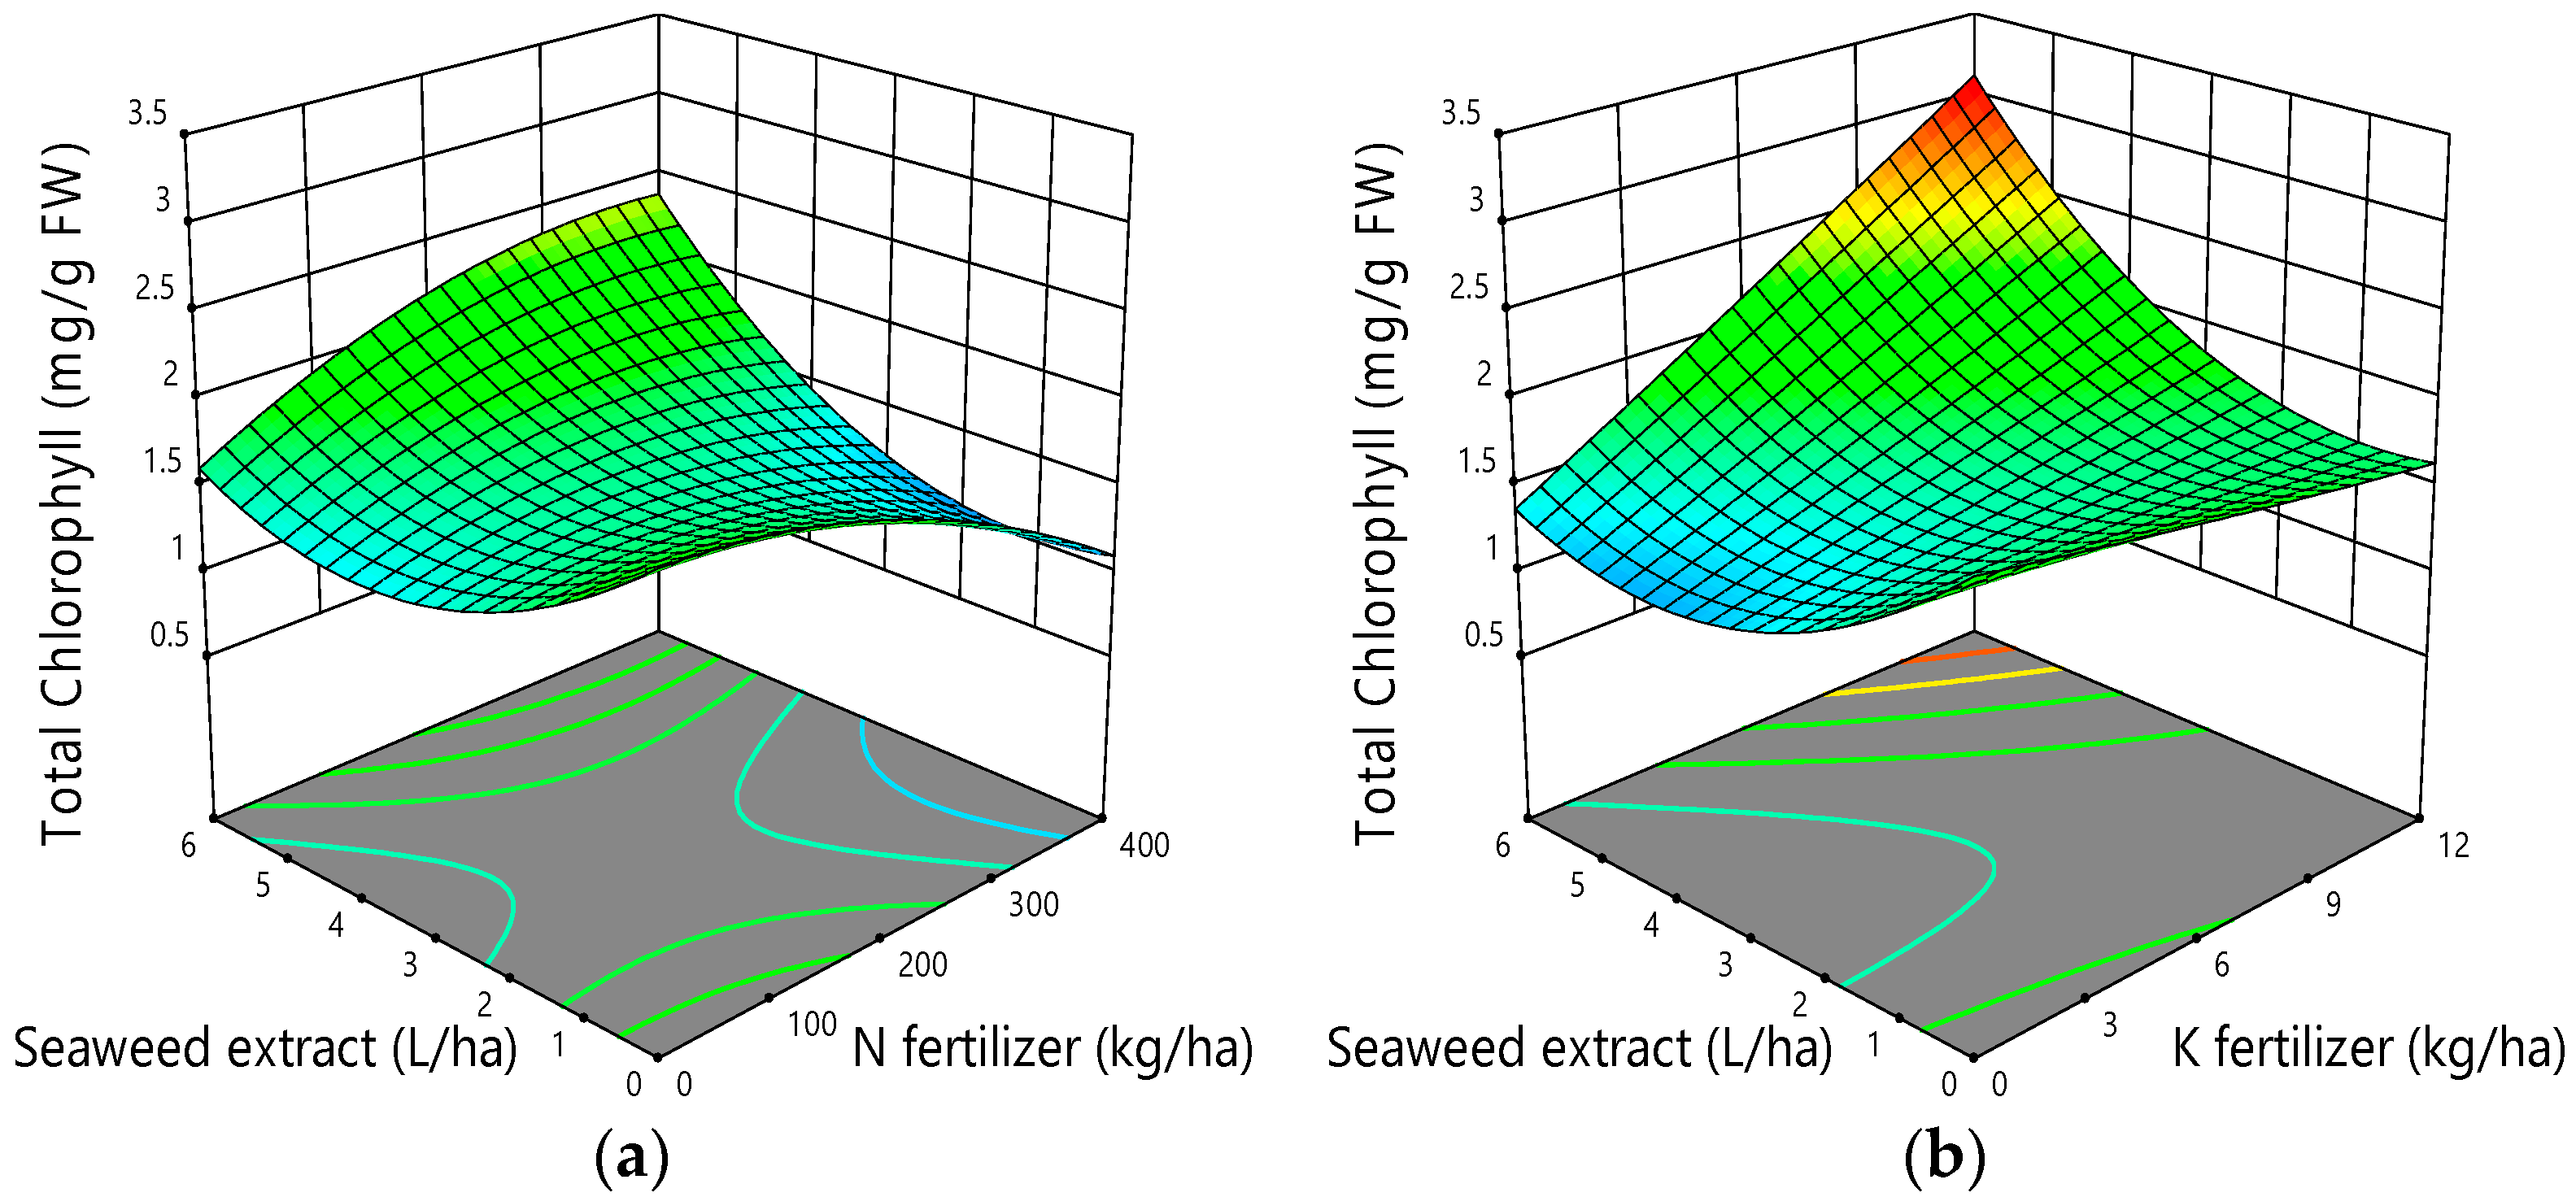
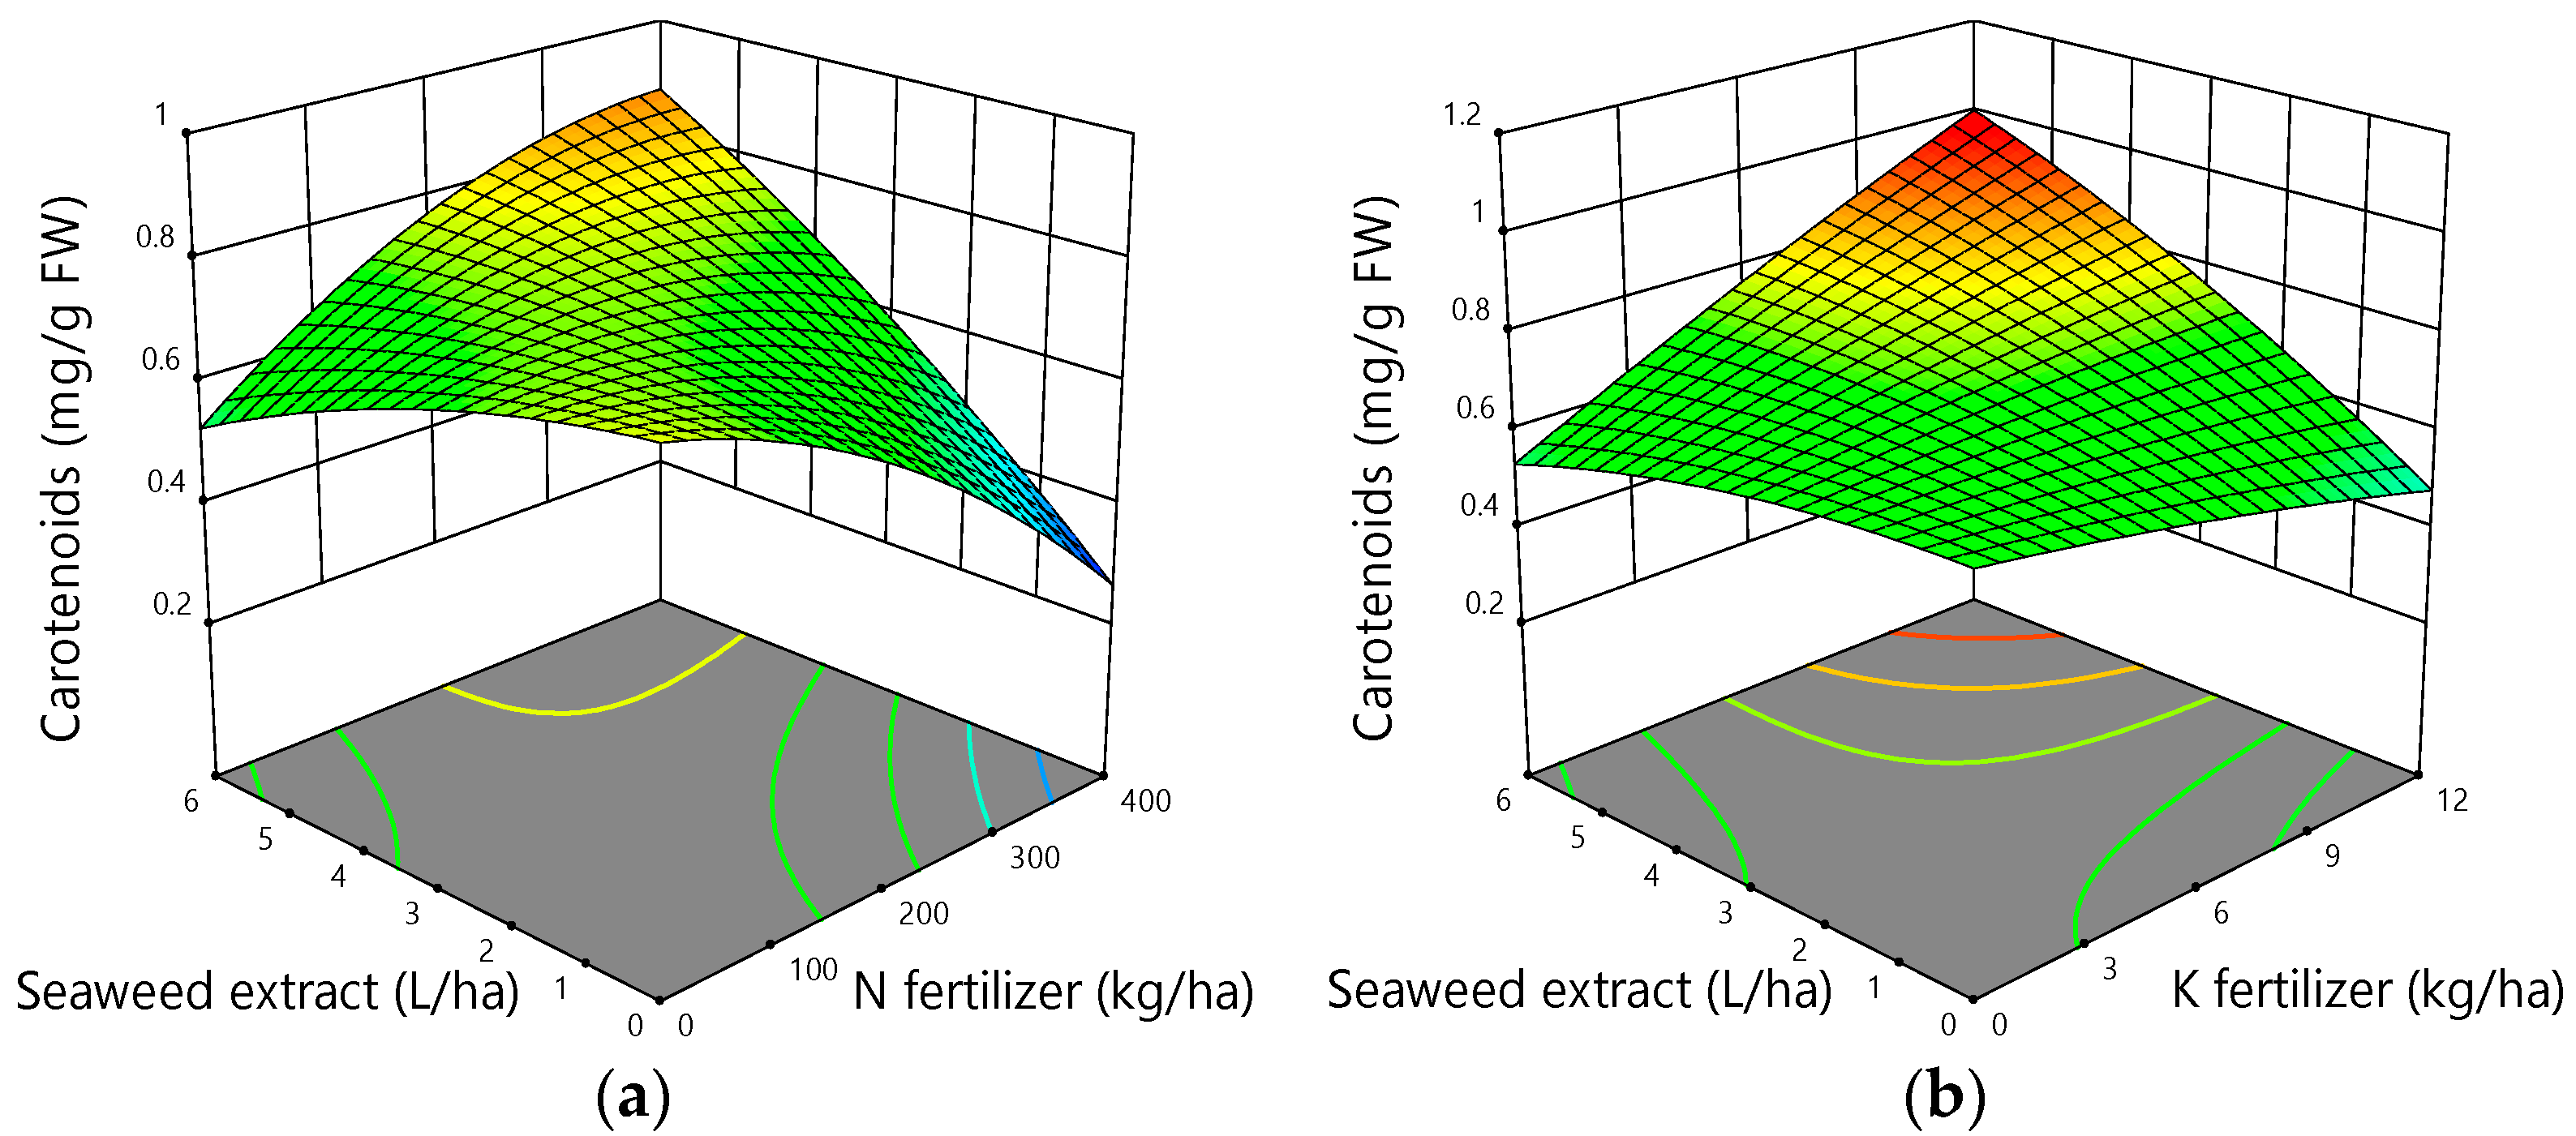
3.2. Photosynthetic Pigments

The influence of nitrogen on photosynthetic pigments followed a quadratic trend (Table 4). The response of total chlorophyl and carotenoids content to increasing potassium level was linear (Table 4). The interactions of nitrogen × seaweed extract and potassium × seaweed extract were also significant (Table 4). The response surface plot of total chlorophyll as affected by nitrogen fertilizer and seaweed extract indicated that the use of the highest level of seaweed extract (6 L ha−1) boosted the chlorophyll content response to the increasing nitrogen application rate. The highest amount of total chlorophyll was measured when 300 to 400 kg urea ha−1 and 6 L seaweed extract ha−1 were applied (Figure 1a).
The 3-D plot of potassium × seaweed extract interaction on total chlorophyll content suggested that the application of potassium without using seaweed extract had no positive effect on chlorophyll content, whereas increasing the rate of Flourish Sulfopotash from 0 to 12 kg ha−1 and application of the highest level of seaweed extract improved the chlorophyll content with a steep slope, taking it to its peak value (Figure 1b).
The response of leaf carotenoids to nitrogen and seaweed extract showed that the highest content of carotenoids was obtained with application of the highest levels of nitrogen and seaweed extract (Figure 2a). Similarly, the interaction effect of potassium and seaweed extract on carotenoids content indicated that when the highest rates of Flourish Sulfopotash and seaweed extract were used, the amount of leaf carotenoids reached its peak value (Figure 2b).

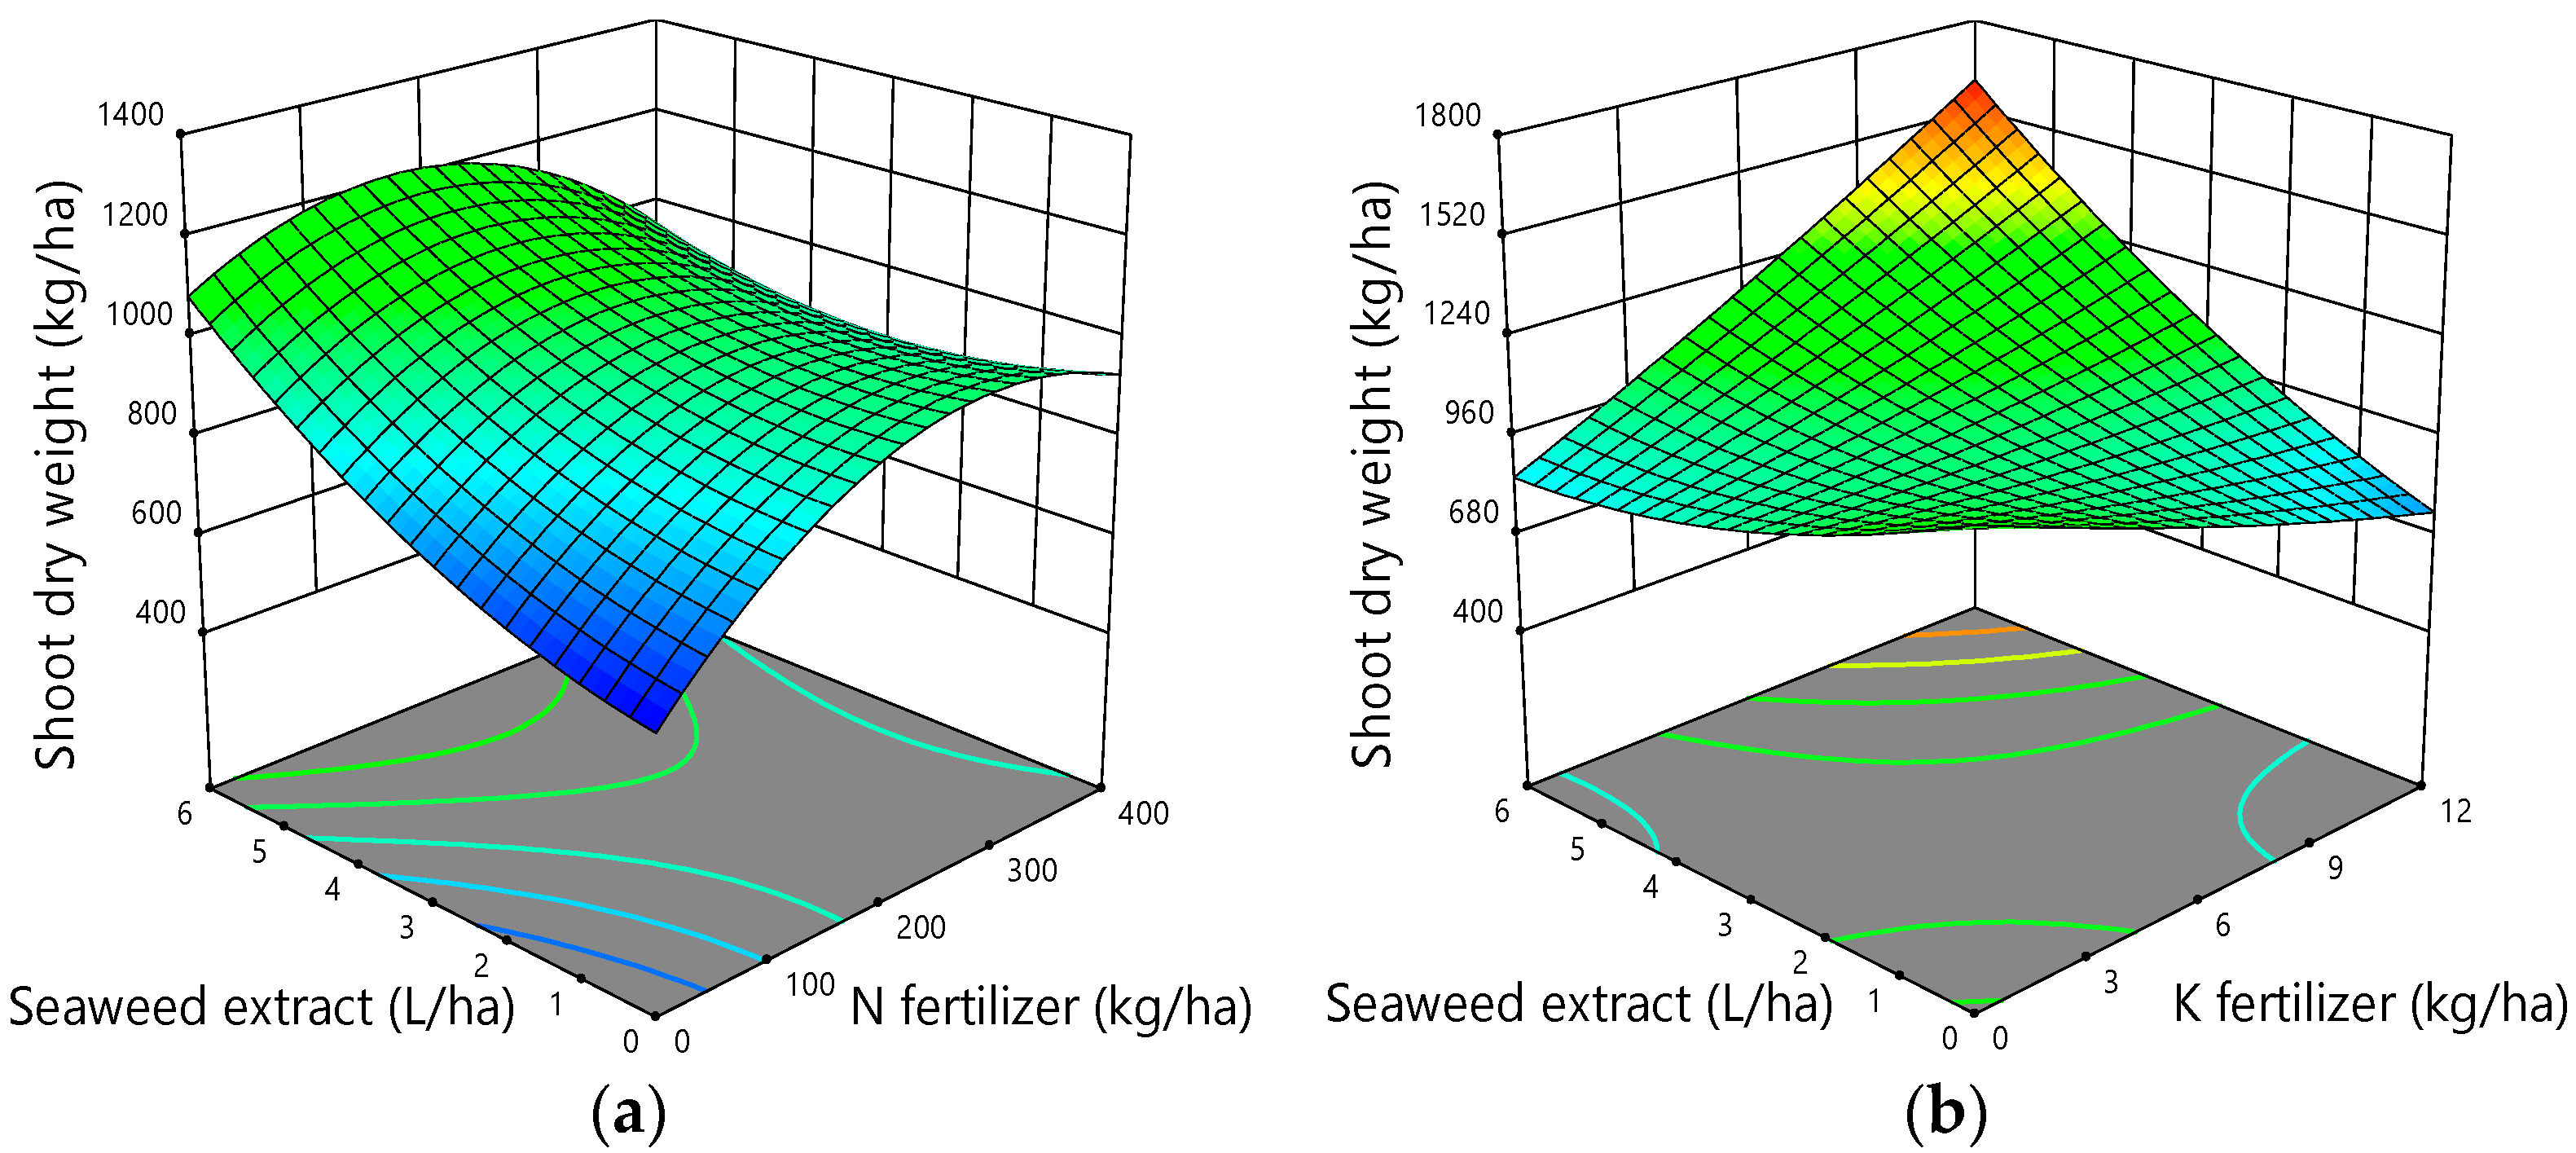
3.3. Shoot Dry Weight

Model analysis indicated that the response of shoot dry weight to nitrogen and seaweed application was quadratic and linear, respectively (Table 4). Flourish Sulfopotash fertilizer (potassium) had no significant effect on biomass (Table 4). Among all possible interactions of the nutrient sources, only the interactive effect of potassium and seaweed on shoot dry weight was significant. The plot of the interaction effect of nitrogen and seaweed extract on shoot dry weight followed a parabolic response and maximized when 200 kg ha−1 urea and 6 L ha−1 seaweed extract were used (Figure 3a).
The response surface plot of shoot dry weight versus potassium fertilizer and seaweed extract indicated that the highest amount of dry matter can be attainained by applying the highest levels of both potassium (12 kg ha−1) and seaweed extract (6 L ha−1) (Figure 3b).

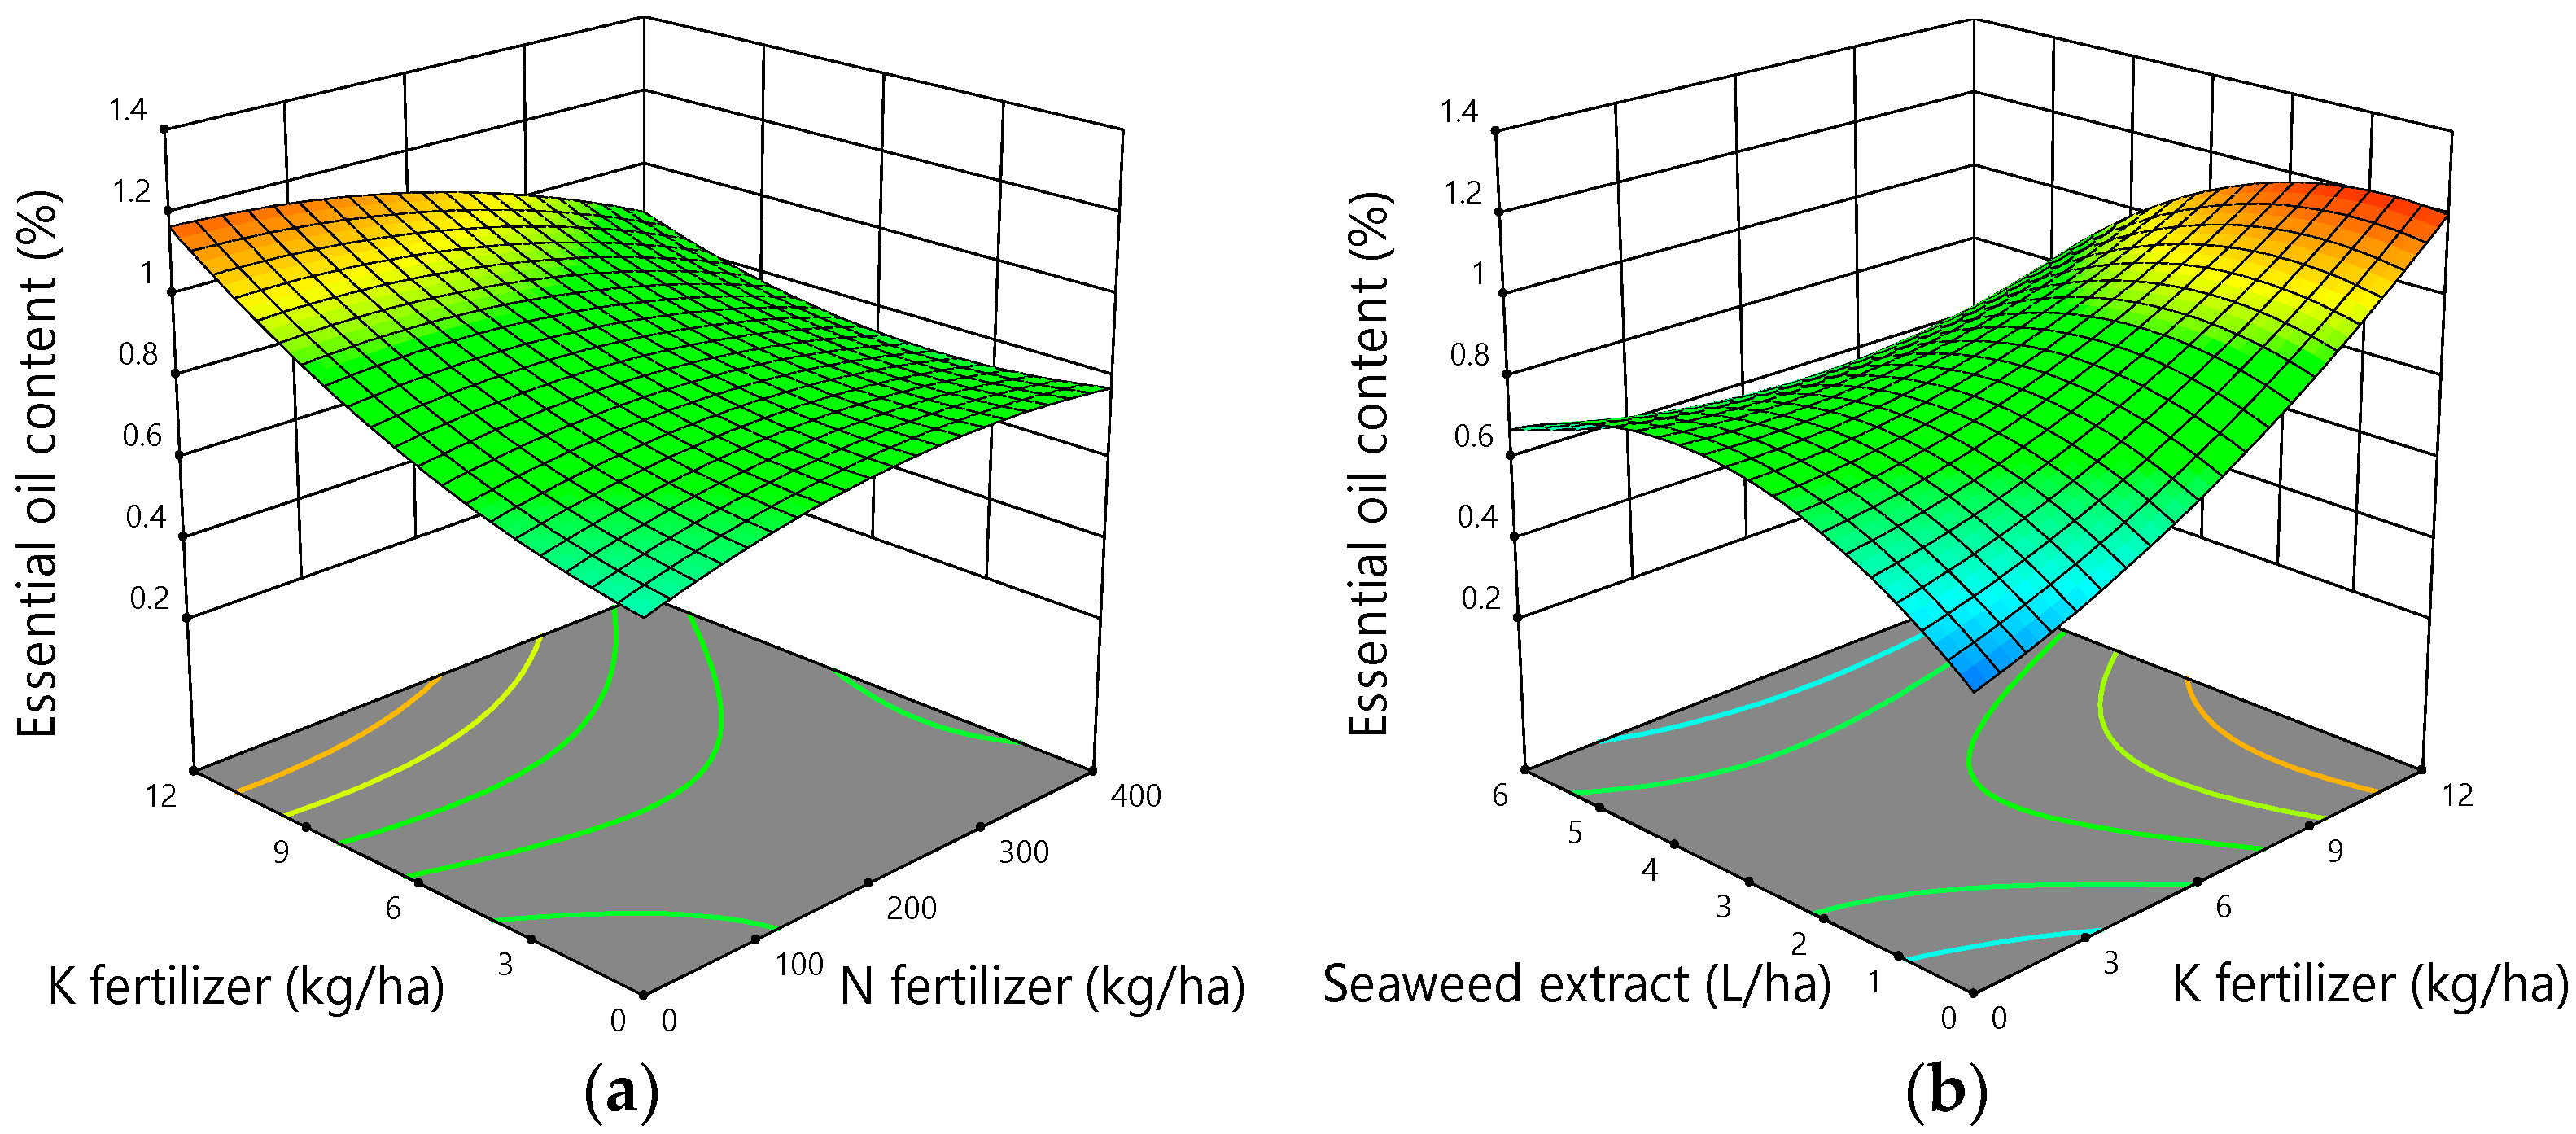
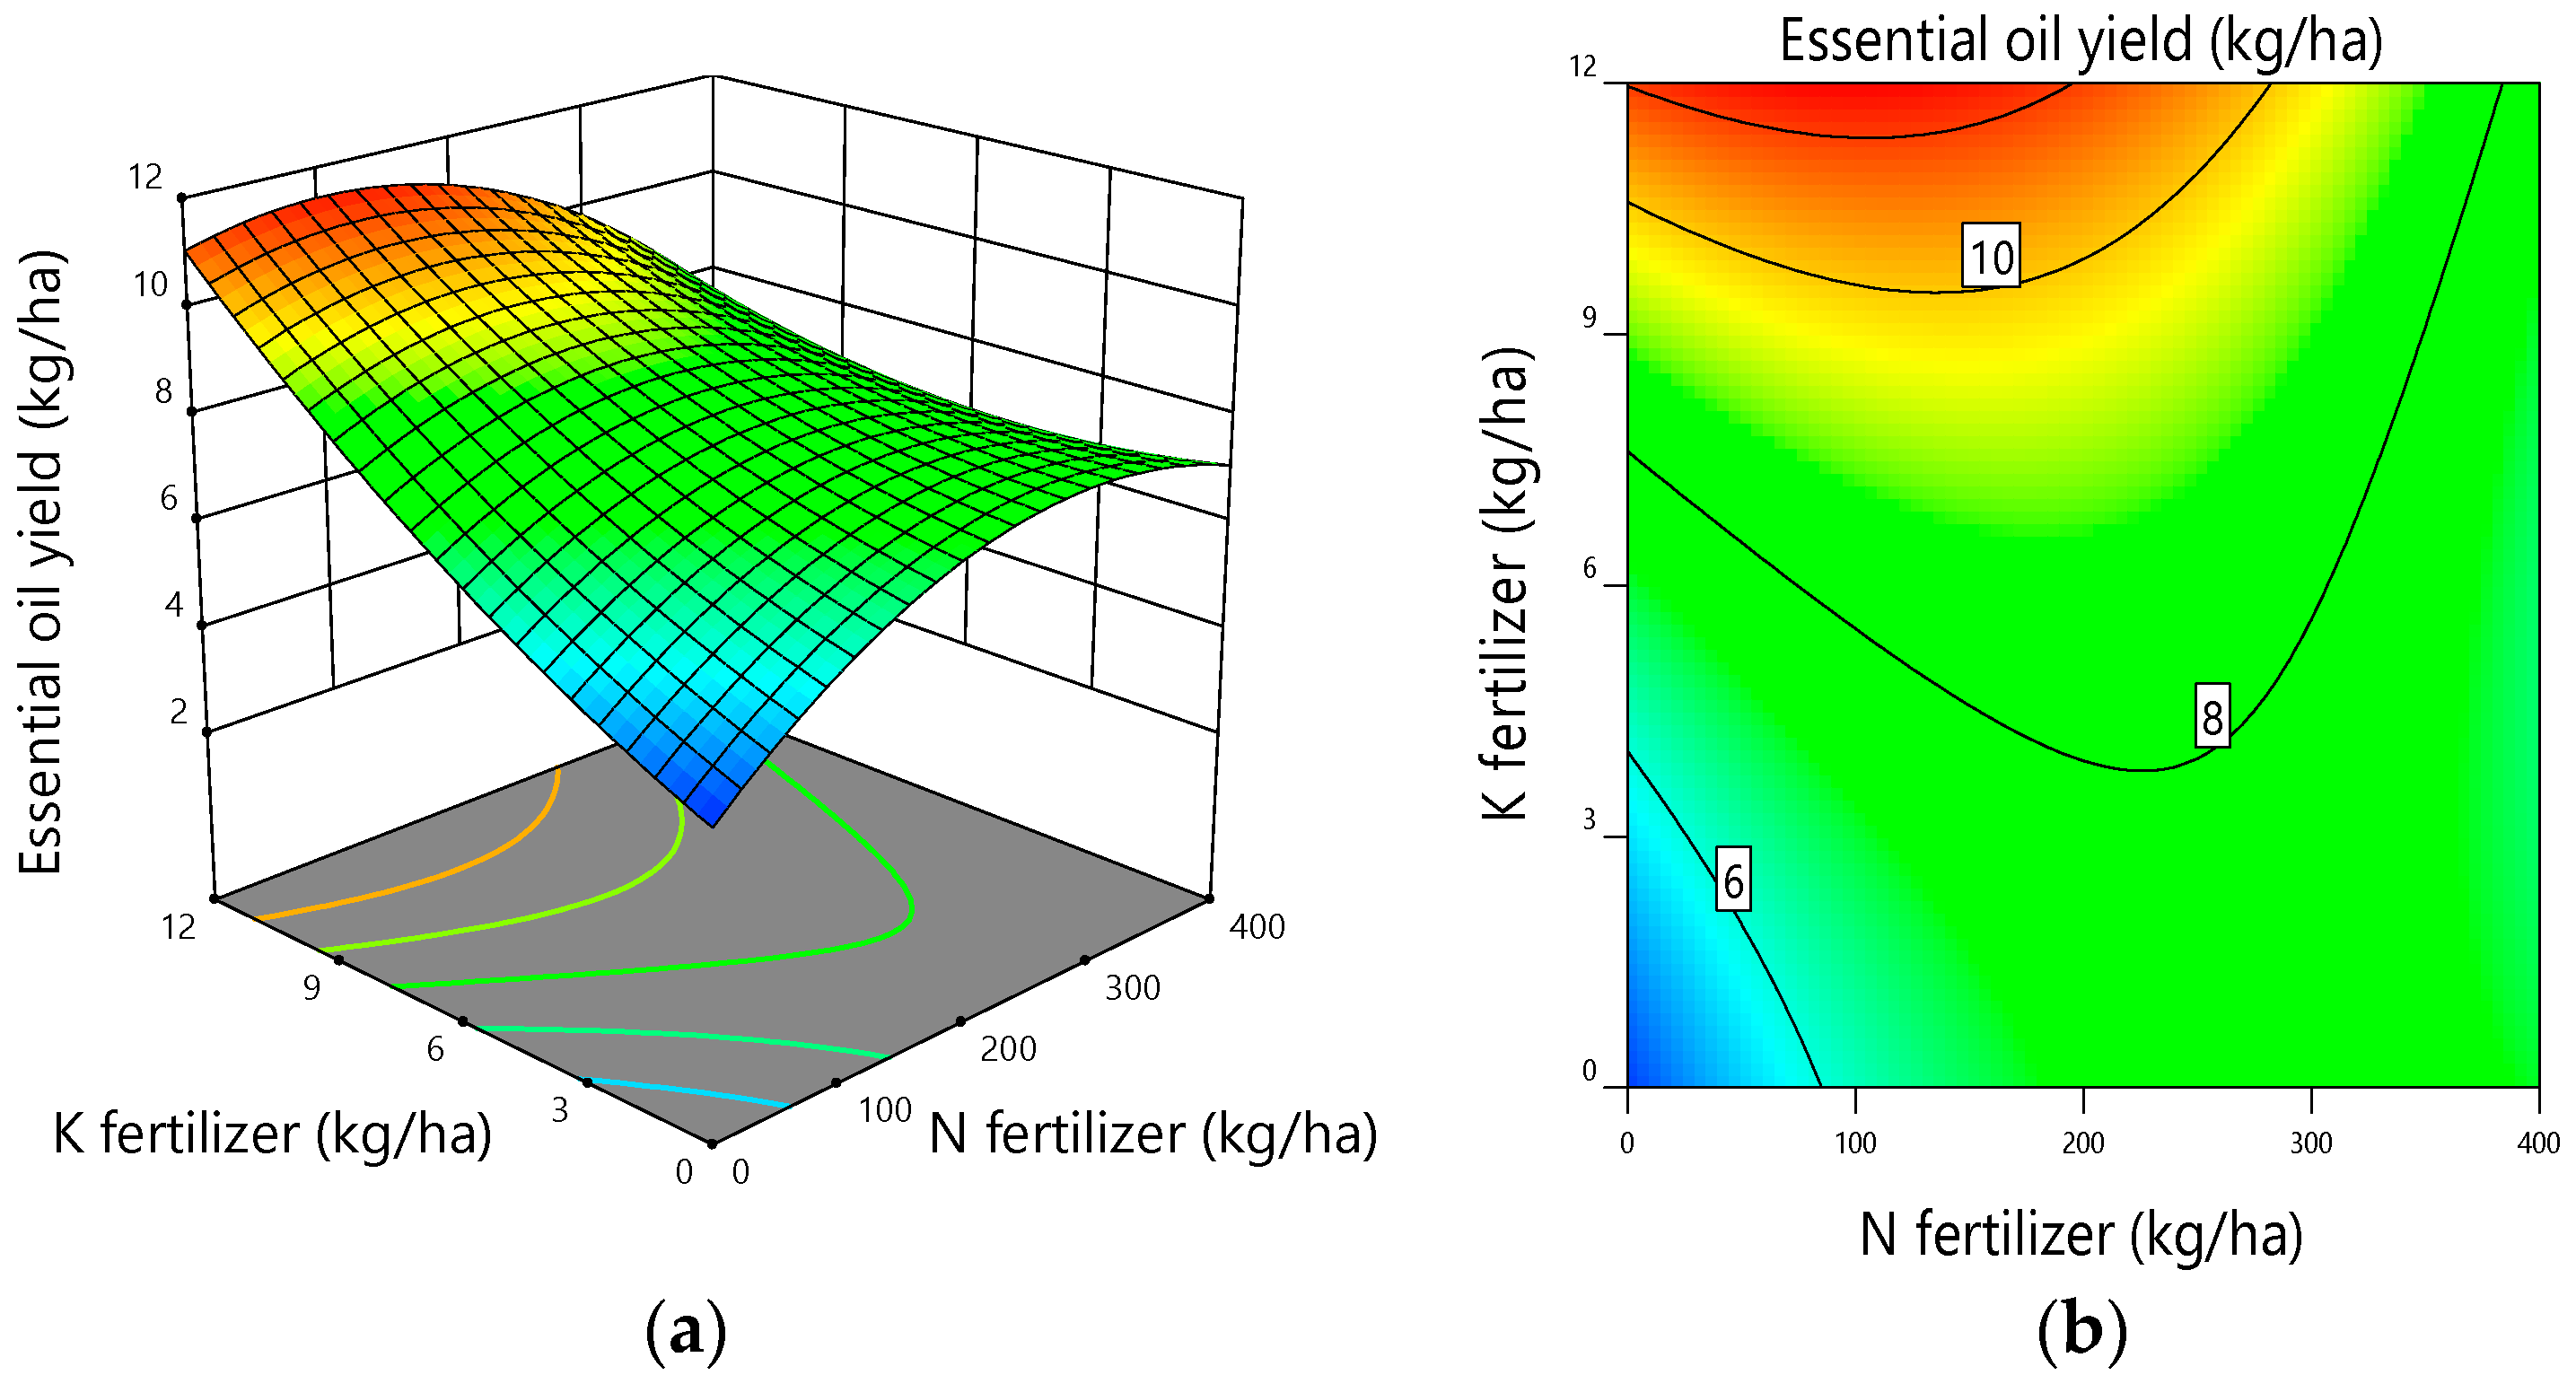
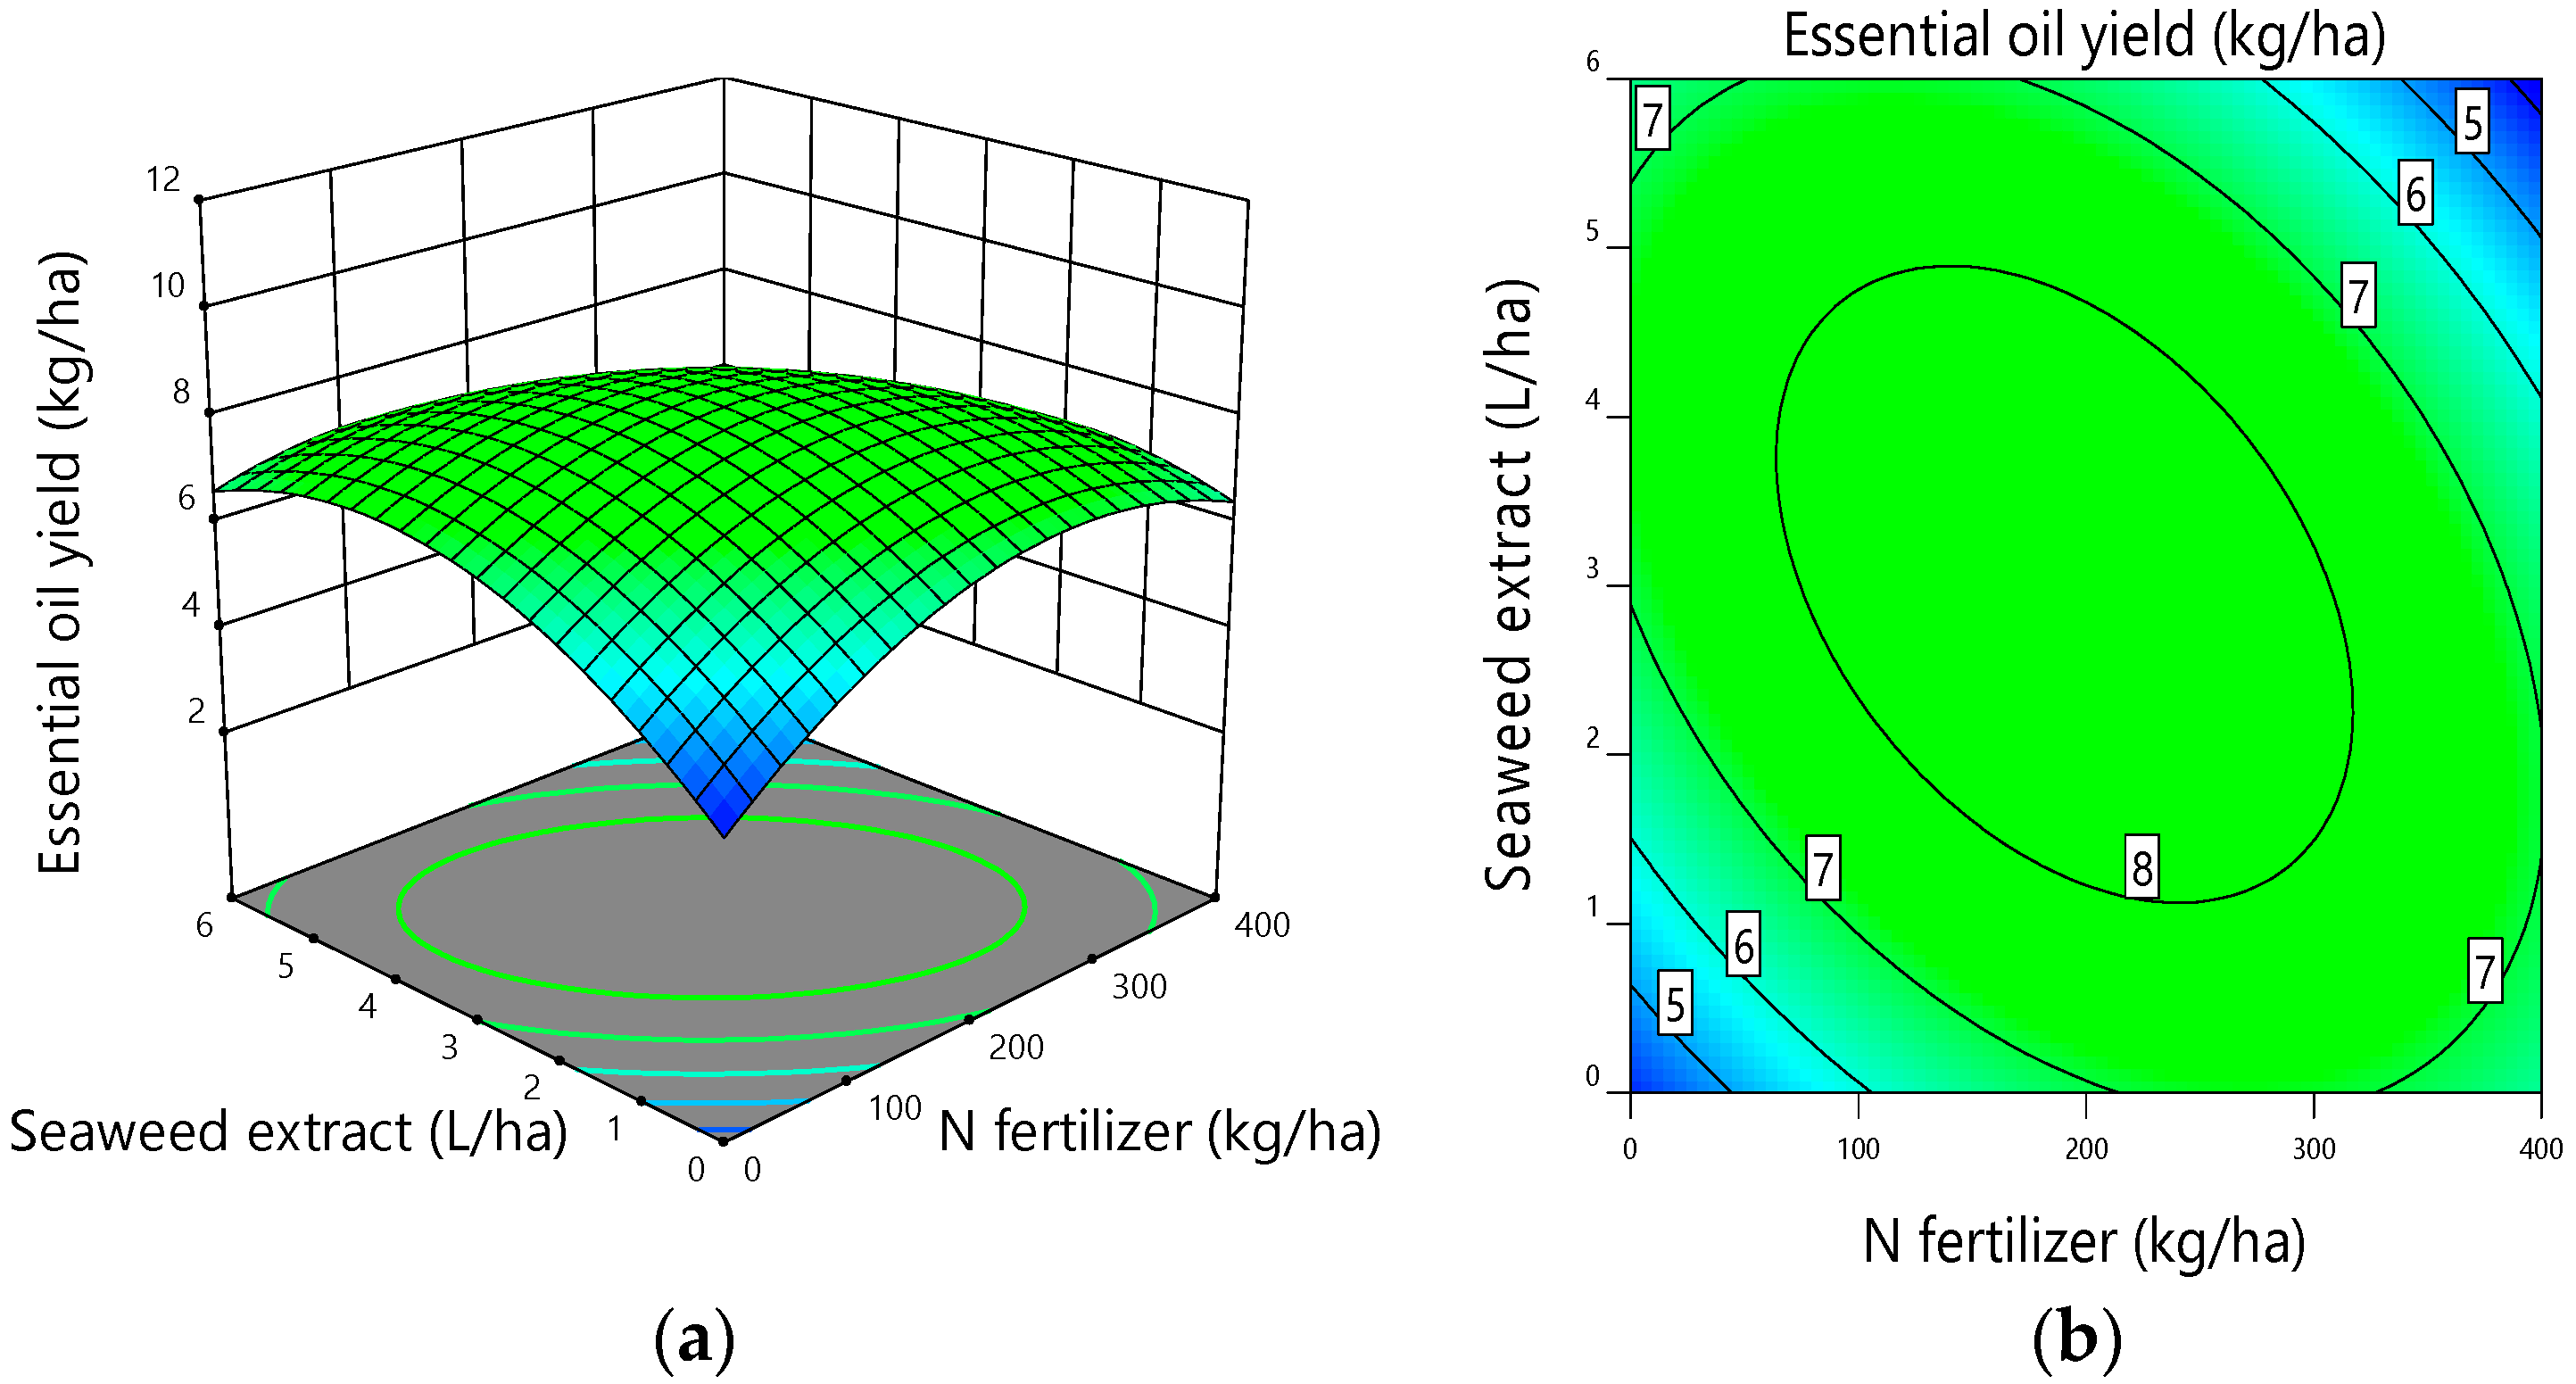
3.4. Essential Oil Content and Essential Oil Yield

The response of essential oil content and essential oil yield to various fertilizer applications varied considerably. While the essential oil (EO) content of thyme was not significantly affected by N application, the response of EO yield to N fertilizer rate was quadratic (Table 5). Essential oil content and yield were both linearly increased by foliar application of potassium fertilizer. In addition, a quadratic trend was detected in EO content and yield versus seaweed foliar application.
The surface plot of thyme EO content versus nitrogen and potassium showed that the maximum amount of EO (1.2%) was obtained when 100 kg ha−1 of urea and 12 kg ha−1 of Flourish Sulfopotash were applied (Figure 4a). The surface plot of the interaction effect of potassium and seaweed extract (Figure 4b) also revealed that the EO content reached its peak value of 1.2% with application of the maximum level of potassium and about 1 to 2 L ha−1 of seaweed extract.
The response surface and contour plot of EO yield versus nitrogen and potassium indicated that the response of EO yield to the increasing nitrogen and potassium application rates was parabolic and linear, respectively (Figure 5). As Figure 5 demonstrates, the maximum EO yield was obtained by application of 12 kg ha−1 of potassium and using only 100–200 kg ha−1 of urea, while keeping the seaweed extract at its average level of 3 L ha−1.
The response surface and contour plot of EO yield as affected by interaction of nitrogen and seaweed extract (Figure 6) clearly followed a quadratic trend and reached its peak value when intermediate rates of N and seaweed extract were used.

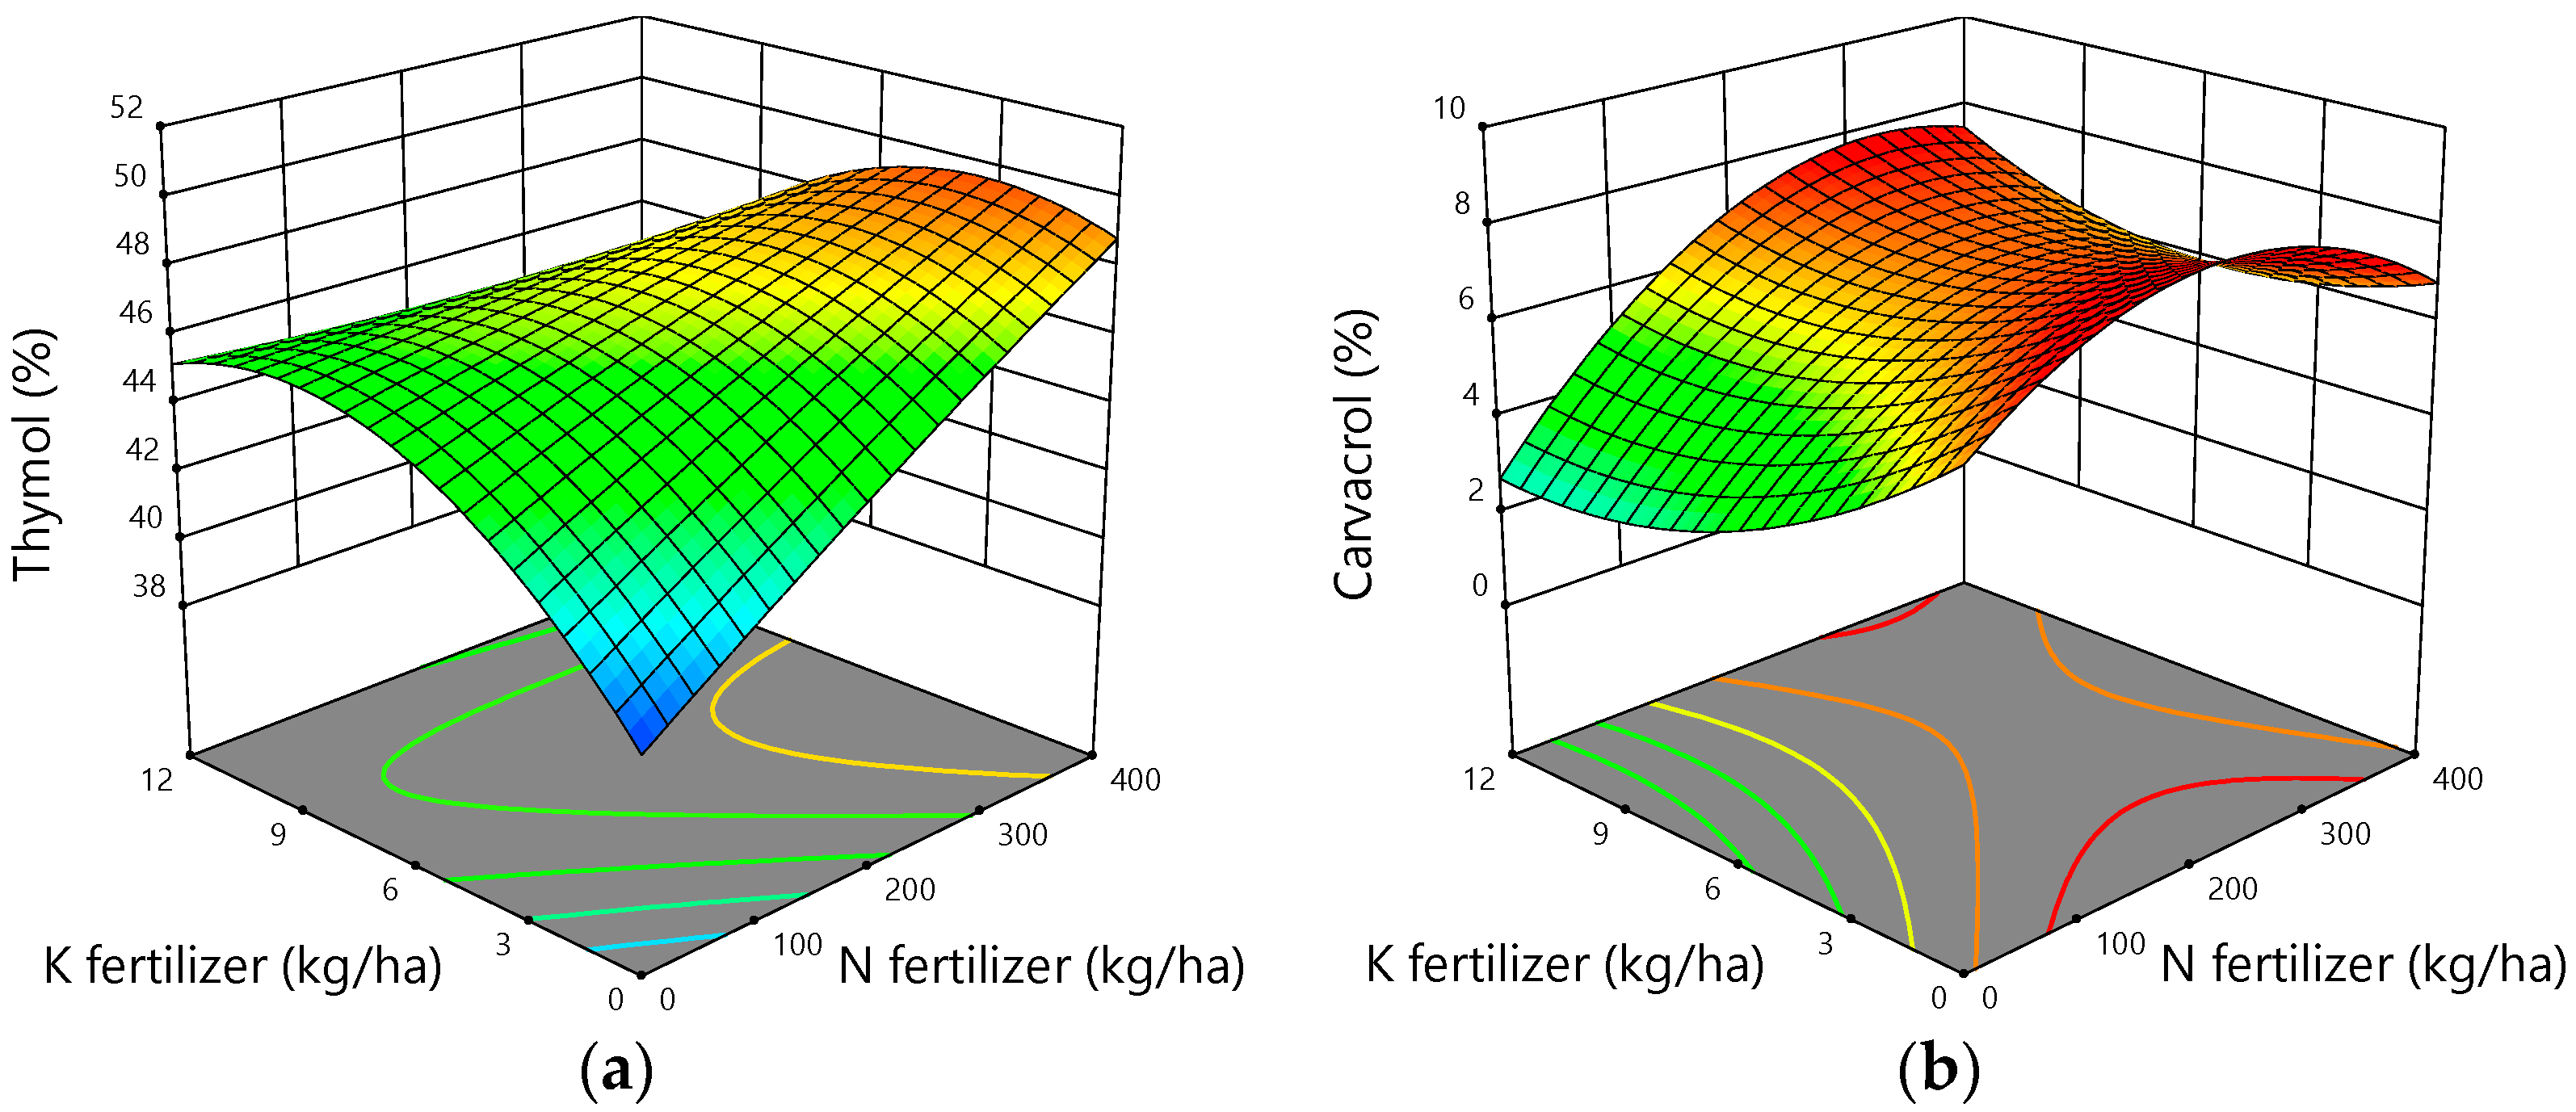
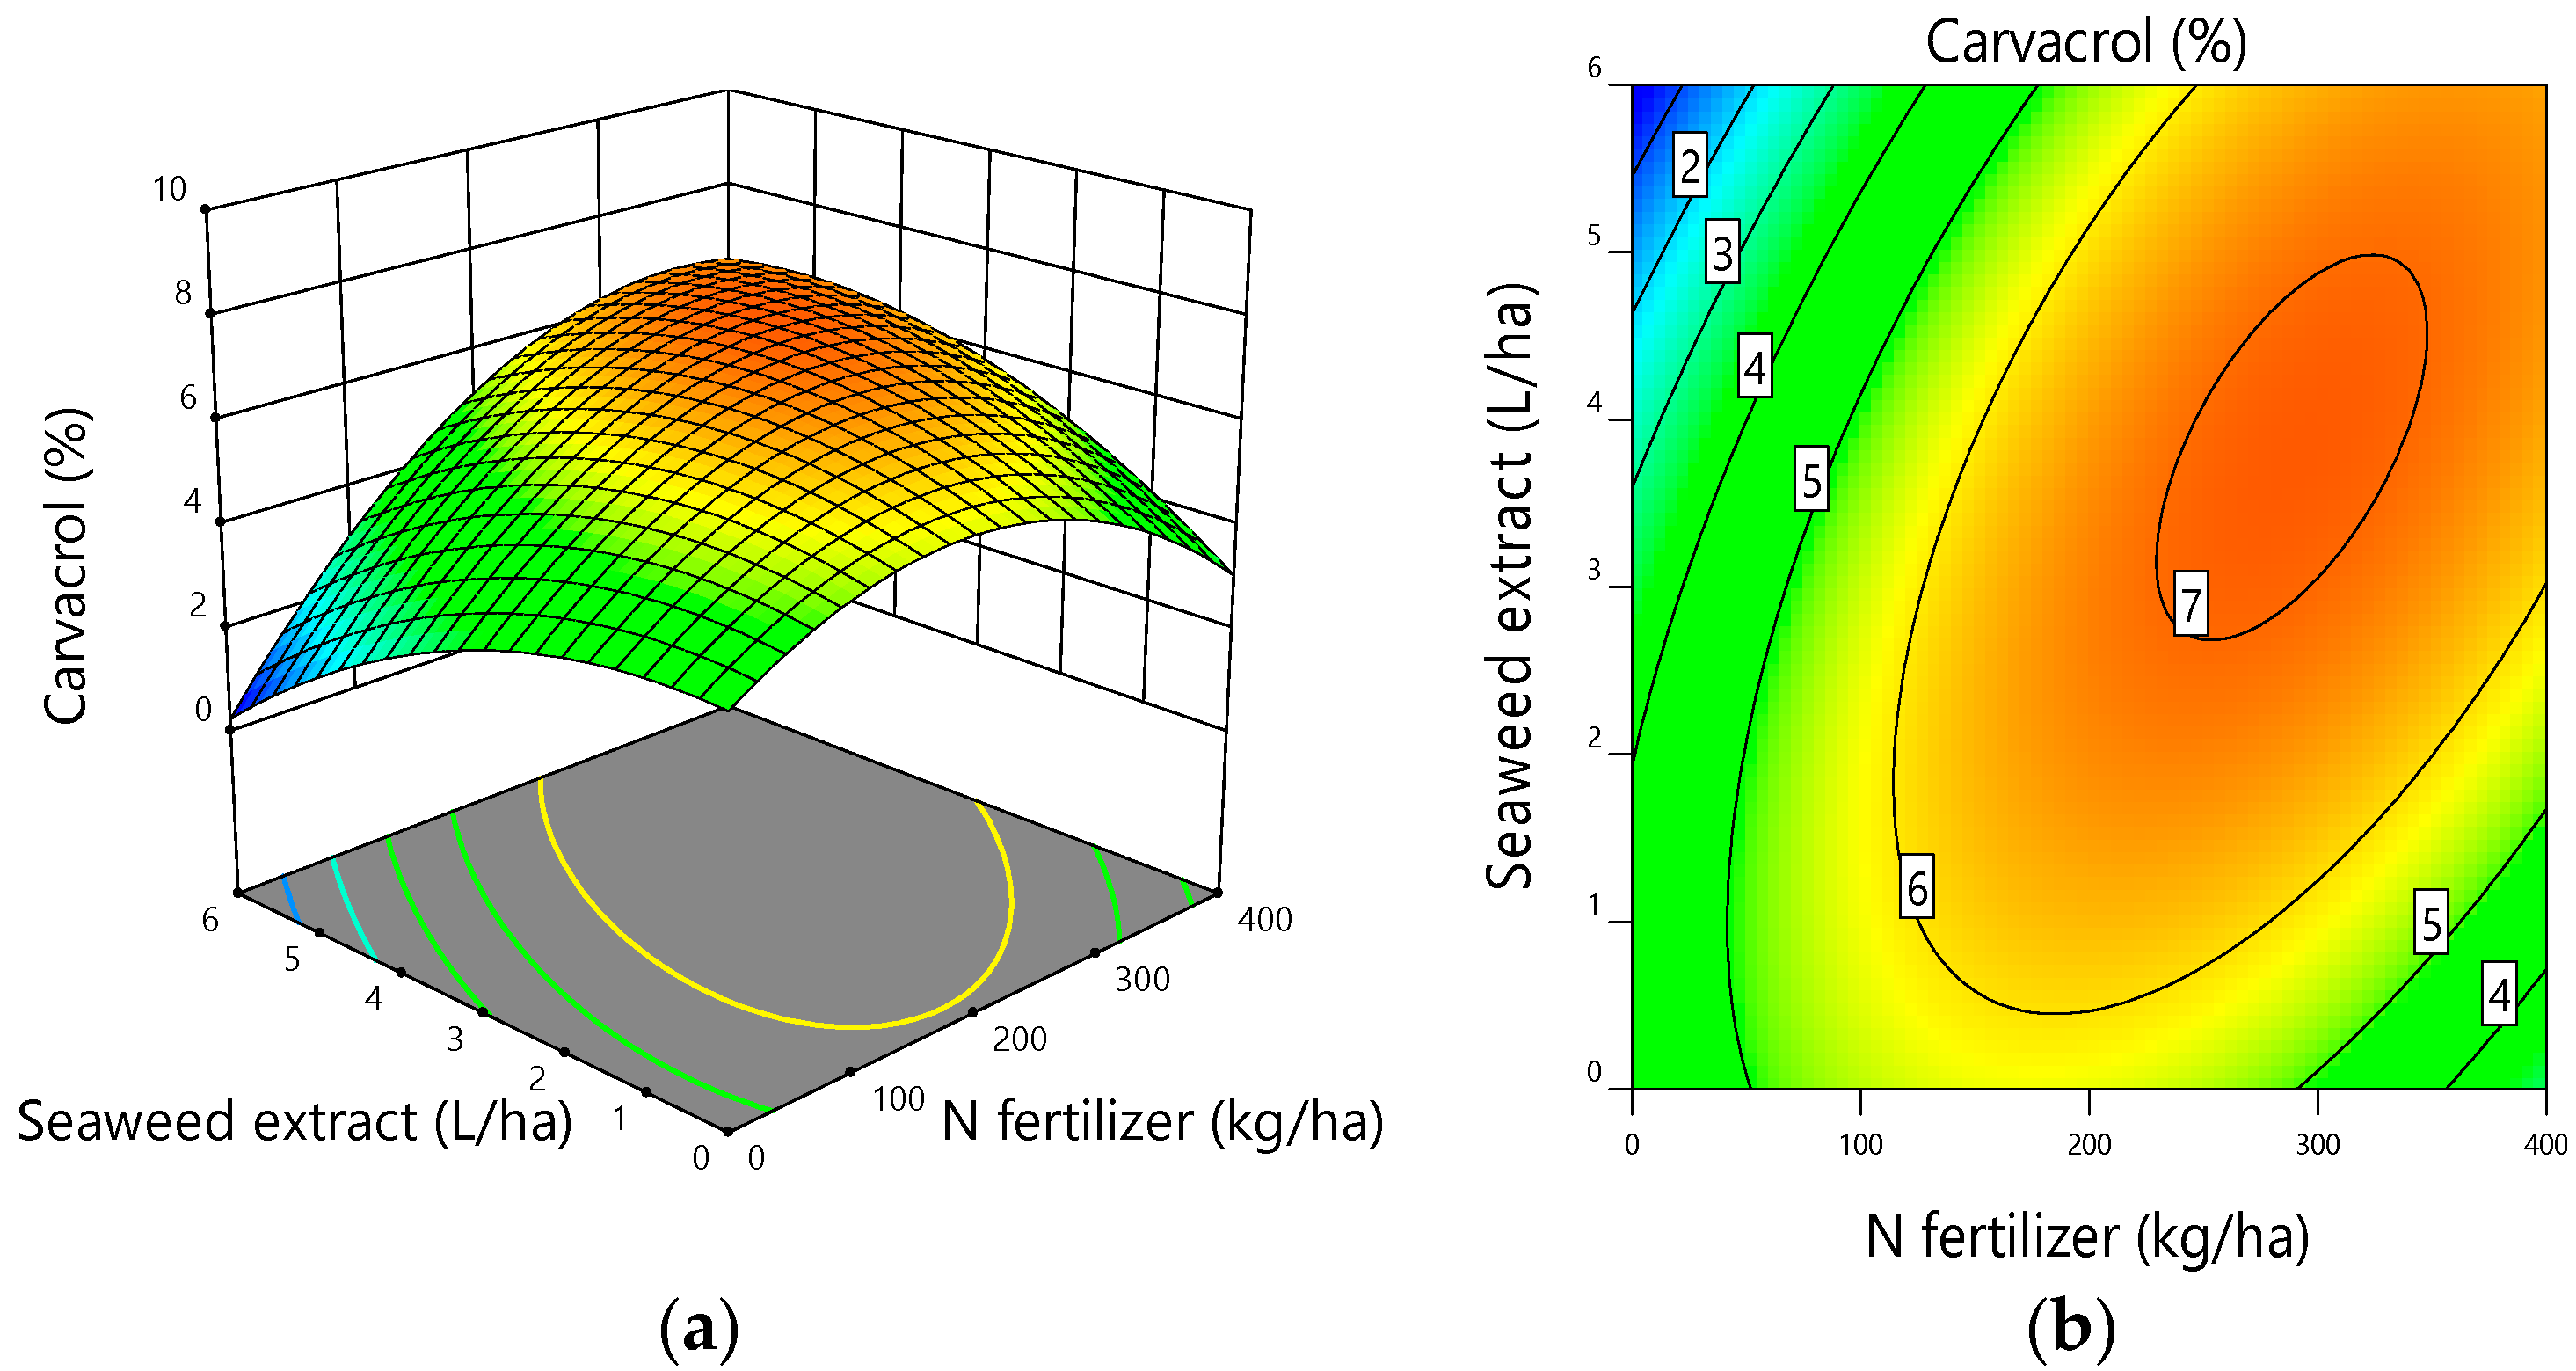
3.5. Essential Oil Components

Using the GC-MS method, a variety of compounds were identified in the thyme essential oil, of which the four compounds, including thymol, γ-terpinene, p-cymene, and carvacrol were identified as major components. The values of major components of essential oils and their retention index (RI) are presented in Table 6. With all treatments averaged, thymol had the highest percentage in essential oil (46.13%), followed by γ-terpinene (19.16%), p-cymene (14.10%), and carvacrol (5.60%) (Table 6). However, different rates of fertilizers were needed to reach the highest amount of the individual essential oil components. For example, while the maximum amount of thymol was extracted by application of 400 kg urea ha−1 with 6 kg FSP ha−1, and no seaweed extract (Table 6), the highest percentage of γ-terpinene (22.77%) as the second major essential oil compound was extracted from samples taken from no N, no K, and an intermediate level of seaweed (3 L ha−1) (Table 6).
Thymol content responded linearly and quadratic to N and K fertilizers, respectively, as shown in Figure 7a.
Response plots of carvacrol, as an important component of the essential oil of thyme, to the fertilizers are illustrated in Figure 7b and Figure 8a,b. The response of carvacrol to N fertilizer and seaweed application rates followed a quadratic trend and reached its peak value when 200–300 kg ha−1 of urea and 3–4 L ha−1 of seaweed were used (Figure 8a,b). Carvacrol content response to the increasing application rate of potassium followed a downward second-order mode (Figure 7b).
The γ-terpinene, the second highest component in the thyme essential oil, followed a negative linear trend (Table 5); however, the response model was not statistically significant. The remarkable result was that the reaction of γ-terpinene to the increased application rate of nitrogen was opposite to that of thymol.

3.6. Optimization

Optimization of fertilizer resources rates was carried out where several response variables were simultaneously considered and the desirability function was used. As mentioned earlier, one of the objectives of the current study was to maximize the quantitative and qualitative parameters of thyme, with an emphasis on improving the content and total yield of thyme essential oil. The selection of plant responses for the optimization operation was performed based on the significance of their models. Accordingly, the two parameters of γ-terpinene and p-cymene values were not selected since their models were not statistically significant. The optimization outputs are presented in Table 7. The results of optimization suggested that under the conditions of the current experiment and the defined objectives, the application of 162 kg ha−1 of urea, 12 kg ha−1 of Flourish Sulfopotash, and 4 L ha−1 of seaweed extract resulted in the production of 1247 kg ha−1 of biomass dry matter and 11 kg ha−1 of essential oil (with a concentration of 1%) of thyme. Furthermore, through optimization, the amount of thymol and carvacrol were estimated to be as much as 44.2% and 6.2%, respectively (Table 7).

4. Discussion

The positive influence of N application on elevating the chlorophyll and carotenoid concentration in various medicinal and herbal plants has been reported [23,24]. The reports often indicated that the response of photosynthetic pigments to the increased N application rate was positive and maximized when the highest rates of N were applied. Photosynthetic pigments play a key role in plant growth and productivity. In the current study, changes in both chlorophyll and carotenoid content of thyme followed a quadratic response. In other words, there is a limit to which thyme can respond positively to the increasing N fertilizer application rate. Nitrogen supply often accelerates photosynthetic carbon assimilation and has minimal or no influence on respiration [25]. Therefore, higher net assimilation can be achieved through the application of more N fertilizer. In the current study, the dry matter of the aerial part demonstrated a quadratic response. Therefore, the results clearly indicate that factors other than photosynthetic pigments may have caused limitations in the biomass production of thyme.
The enhancement effect of potassium on the photosynthetic pigments in the present study can be attributed to the important roles potassium plays in many physiological processes, including enzymatic activation [26]. An earlier report indicated that the application of potassium fertilizer reduced the destruction of cell membranes and chlorophyll, and thus played an important role in maintaining the molecular structure of the chlorophyll [26]. Results from the current study are in agreement with other reports regarding the beneficial effects of potassium application on photosynthetic pigments [27,28,29,30]. The total chlorophyll and carotenoids increased linearly with an increased foliar K application rate.
Due to the richness in free amino acids and organic and mineral substances of seaweed, application of seaweed extract can influence the synthesis of photosynthetic pigments [31,32]. The increase in leaf chlorophyll content could be a result of decline in chlorophyll degradation rate, which may be due to the presence of betaines in the composition of seaweed extract [12]. While the response of carotenoids to the increased seaweed application rate was linear, the total chlorophyll response followed a quadratic trend.
The results of the current experiment indicated that the influence of N on photosynthetic pigments was independent of K, however, both N and K demonstrated a positive interaction with seaweed. The interactive effect of potassium and seaweed extract on photosynthetic pigments suggested that when one of these two fertilizers was not used, the effect of the other nutrient source was minimal. Simultaneous application of both fertilizers resulted in a synergic influence on increasing photosynthetic pigments concentrations. The highest contents of chlorophyll and carotenoids were measured when both potassium and seaweed extract were applied at their highest levels, which again indicates the presence of a synergistic influence between the two fertilizers in enhancing the synthesis of the photosynthetic pigments in thyme leaves. Emami Bistgani et al. [1] suggested that a mixture of organic and synthetic fertilizers was an effective strategy for improving the photosynthetic pigments and other constituents in thyme.
The response of shoot dry matter of thyme to the nitrogen application rate confirmed the earlier report that the effect of nitrogen fertilizer on the fresh and dry weight of thyme was quadratic, indicating that plant weight responds to N up to a certain level and then becomes non-responsive to additional N application.
Similar to photosynthetic pigments, the simultaneous use of the highest levels of potassium and seaweed extract resulted in the production of the maximum shoot dry weight per unit area. Potassium improves root growth and facilitates water and nutrient absorption [33]. Additionally, potassium serves as a cofactor for a variety of enzymes that are involved in respiration and photosynthesis, and improves stomatal conductance [34,35,36].
The application of seaweed extract as a biostimulant can stimulate plant growth through various mechanisms. Earlier reports indicated that seaweed released nutrients and improved their absorption, and thus beneficially affected plant metabolism [32,37,38,39]. The results of the current experiment indicated that thyme responded positively to seaweed enrichment. Photosynthetic pigments and shoot dry weight increased linearly with increasing seaweed application rate. The effect of seaweed on biomass yield was boosted when it was applied along with an increased foliar potassium application rate.
The use of nitrogen fertilizer had no significant effect on the percentage of essential oil (EO). Therefore, the quadratic response of essential oil yield due to the increased N application rate was primarily due to an increase in thyme shoot dry weight. Results of the current study as well as other reports [4,40,41] lead to the conclusion that the effect of N fertilizer on the essential oil of many medicinal plants, including thyme, is minimal. However, some reports indicated that the addition of N fertilizer may improve essential oil in certain plants such as ginger [42], basil [5], and sage [43]. The contradictory reports about the influence of nitrogen fertilizer on EO could be attributed to the plant species, the soil organic level and availability of soil nitrogen to plants. Unlike N, both potassium and seaweed improved essential oil content, possibly due to their enhancement effect on photosynthetic pigments, which in turn ultimately increased the biosynthesis of secondary metabolites and essential oils [28,44]. The stimulatory effect of potassium on increasing the percentage of thyme EO and its main constituents, including thymol and p-cymene, was reported [35].
The effect of seaweed extract on the EO concentration was quadratic, meaning that an overdose of seaweed may have a negative influence on the percentage of EO in thyme leaves. The decrease in the percentage of EO when using the highest level of seaweed extract could be attributed to the increase in plant growth which resulted in a decrease in the amount of EO per unit weight of the plant. In other words, with the consumption of maximum amounts of seaweed extracts, vegetative growth continued faster than the rate of EO synthesis and accumulation per unit weight.
The extract of seaweeds such as Ascophyllum nodosum contains various polysaccharides, nutrients, hormones, betaines, and sterols [12]. Reports indicated that the presence of carbohydrates in the composition of seaweed extract is associated with the synthesis of plant secondary metabolites, including essential oils [45]. The beneficial effects of seaweed extract on the enhancement of the EO content in thyme [46] and other medicinal plants have been reported [47,48]. For example, treating rosemary with seaweed extract significantly increased the essential oil concentration [48]. Similarly, the EO content in mint and basil was enhanced by using Ascophyllum nodosum extract [45].
Thymol, γ-terpinene, p-cymene, and carvacrol were identified as the major components of thyme essential oil, which is consistent with earlier reports [49,50,51,52,53]. Thymol (2-isopropyl-5-methylphenol) and carvacrol (5-isopropyl-2-methylphenol) are two isomeric monoterpenoid phenols that are biosynthesized through the aromatization of γ-terpinene to p-cymene followed by the hydroxylation of p-cymene (Figure 9). The change in the amount of essential oil compounds can be influenced by various factors, such as plant genotype, climatic conditions, growth factors, and harvest time [54].
In the present experiment, the constituents of thyme essential oil responded differently to application of the organic and synthetic fertilizers. The synthetic nitrogen increased thymol linearly and reduced γ-terpinene, whereas the carvacrol’s response to nitrogen was quadratic, and reduced when the highest rate of nitrogen was applied. The opposite responses of thymol and γ-terpinene to nitrogen fertilizer in this study can be attributed to the thymol biosynthetic pathway. Nitrogen may be effective in accelerating the enzyme activities that are involved in the conversion of γ-terpinene and, as a result, increased thymol accumulation. Increasing the application rate of nitrogen fertilizer in the Egyptian oregano plant increased the percentage of thymol and carvacrol and decreased γ-terpinene and p-cymene. Therefore, nitrogen seems to stimulate the biosynthesis of thymol and carvacrol at the expense of γ-terpinene and p-cymene, since the latter two substances are precursors of thymol and carvacrol. The activation of enzyme systems, therefore, is involved in oxygenation through nitrogen fertilization [55].
The initial increase in carvacrol by increasing nitrogen application from zero to about 300 kg could be due to the acceleration of the aforementioned biosynthetic pathway. Additionally, the application of high amounts of nitrogen can alter the biosynthesis pathway to produce more thymol at the expense of carvacrol. This is due to the fact that the biosynthetic pathway ultimately reaches two parallel pathways for the production of thymol and carvacrol. Thus, an increase in one metabolite may result in a decrease in the other (Figure 9).
Application of potassium caused opposite changes in the amount of thymol and carvacrol, where the change in thymol content was in the form of a concave-down parabolic, while carvacrol changed in a concave-up trend (Figure 7). Similarly, Kilic et al. [35] reported that thymol content in thyme leaves reached its maximum rate with moderate doses of potassium fertilization. Reports suggested that the availability of nutrients and edaphic conditions can determine the amount of essential oil components by affecting their biosynthetic pathways [56]. Different responses of thymol and carvacrol to potassium fertilization in the present study may be related to the parallel and competitive pathways of their biosynthesis. The response of large thyme (Thymus pulegioides) to nutrients application indicated that the increase of sulfur in the soil was associated with an increase in the percentage of carvacrol and linalool, and a decrease in p-cymene. In addition, an increase in soil manganese level reduced the carvacrol content [57].
The enhancement effect of the seaweed extract on the amount of carvacrol in this experiment could be related to the richness of the seaweed extract in amino acids, polysaccharides, and hormonal substances, which may improve photosynthesis and increase photo-assimilates [12,58]. However, the carvacrol concentration versus the seaweed extract followed a parabolic trend, meaning that the seaweed rate higher than 4 L ha−1 had a negative effect on the concentration of carvacrol. The decrease in carvacrol under the maximum levels of seaweed can be explained through the positive linear effect of seaweed extract on the shoot dry weight, leading to a decrease in carvacrol concentration per unit weight of biomass.
Reverse changes in the amount of thymol and carvacrol have been observed under the influence of various factors, including fertilizers and irrigation levels. In a study by Karamanos and Sotiropoulou [59] on marjoram, nitrogen fertilization had differential effects on carvacrol and thymol concentrations. Bahreininejad et al. [60,61] and Ghasemi Pirbalouti et al. [62] examined the response of thyme species to drought stress and concluded that moderate and severe drought stress increased thymol while decreasing carvacrol.
Optimization through the response surface methodology estimated optimum N at 162 kg urea ha−1, which is considerably lower than the current recommended rate. In addition, the optimal amounts of Flourish Sulfopotash and seaweed were recommended to be 12 kg ha−1 and 4 L ha−1, respectively. Optimization of fertilizer resources in other crops [43] suggested that the optimal amount of nitrogen fertilizer to achieve maximum biomass and essential oil yield can be lowered. For example, Mehrparvar et al. [63] concluded that the current recommendations for nitrogen application rate need to be revised as the optimization methods indicated that plants do not respond positively to the application of nitrogen fertilization beyond an optimized rate.
The RSM optimization in our experiment suggested that, in regard to thyme, reducing the consumption of synthetic nitrogen fertilizer and using natural-origin nutrient sources, including seaweed extract, is a more financially sound and environmentally friendly alternative. Despite the appropriate use of the modeling technique and nutrient optimization in this experiment, since the study was conducted only in one cropping season, the findings should be considered somewhat preliminary, and it is recommended that the experiment be repeated and also conducted in other locations.

5. Conclusions

The purpose of optimizing fertilizer resources in this study was to explore the possibility of reducing fertilizer application rates while maximizing the biomass of thyme and reducing the risk of environmental pollution. Proposed modeling with the response surface methodology (RSM) as an optimization technique indicated that the rate of all three nutrient fertilizers, especially synthetic nitrogen, can be reduced well below the current recommended rates without compromising the thyme’s biomass and essential oil yield.

Author Contributions

Conceptualization, A.R. and A.R.R.; methodology, S.M.J., A.R.R. and A.R.; software, A.R.; validation, M.H. and A.R.; formal analysis, A.R.; investigation, S.M.J.; resources, A.R.R.; data curation, M.H. and A.R.; writing—original draft preparation, S.M.J. and A.R.; writing—review and editing, M.H. and A.R.; visualization, M.H., A.R.R. and A.R.; supervision, A.R.R. and A.R.; project administration, S.M.J., A.R.R. and A.R. All authors have read and agreed to the published version of the manuscript.

Funding

This research received no external funding.

Data Availability Statement

Not applicable.

Acknowledgments

The authors would like to thank Sirwan Mohammadiazar, Department of Chemistry, Sanandaj Branch, Azad University, Iran, for his support in GC-MS analysis.

Conflicts of Interest

The authors declare no conflict of interest.

References

  1. Emami Bistgani, Z.; Hashemi, M.; Hamid, R. Fertilizer source and chitosan effect on productivity, nutrient accumulation, and phenolic compounds of Thymus daenensis Celak. Agron. J. 2021, 113, 5499–5515. [Google Scholar] [CrossRef]
  2. Kopittke, P.M.; Menzies, N.W.; Wang, P.; McKenna, B.A.; Lombi, E. Soil and the intensification of agriculture for global food security. Environ. Int. 2019, 132, 105078. [Google Scholar] [CrossRef]
  3. Kwiatkowski, C.A.; Harasim, E. The effect of fertilization with spent mushroom substrate and traditional methods of fertilization of common thyme (Thymus vulgaris L.) on yield quality and antioxidant properties of herbal material. Agronomy 2021, 11, 329. [Google Scholar] [CrossRef]
  4. Chrysargyris, A.; Panayiotou, C.; Tzortzakis, N. Nitrogen and phosphorus levels affected plant growth, essential oil composition and antioxidant status of lavender plant (Lavandula angustifolia Mill.). Ind. Crops Prod. 2016, 83, 577–586. [Google Scholar] [CrossRef]
  5. Vilanova, C.M.; Coelho, K.P.; Luz, T.R.S.A.; Silveira, D.P.B.; Coutinho, D.F.; de Moura, E.G. Effect of different water application rates and nitrogen fertilisation on growth and essential oil of clove basil (Ocimum gratissimum L.). Ind. Crops Prod. 2018, 125, 186–197. [Google Scholar] [CrossRef]
  6. Skubij, N.; Dzida, K. Essential oil composition of summer savory (Satureja hortensis L.) cv. Saturn depending on nitrogen nutrition and plant development phases in raw material cultivated for industrial use. Ind. Crops Prod. 2019, 135, 260–270. [Google Scholar] [CrossRef]
  7. Haro, R.; Benito, B. The role of soil fungi in K+ plant nutrition. Int. J. Mol. Sci. 2019, 20, 3169. [Google Scholar] [CrossRef] [Green Version]
  8. Khalid, K.A. Effect of potassium uptake on the composition of essential oil content in Calendula officinalis L. flowers. Emir. J. Food Agric. 2013, 25, 189–195. [Google Scholar] [CrossRef]
  9. Chrysargyris, A.; Drouza, C.; Tzortzakis, N. Optimization of potassium fertilization/nutrition for growth, physiological development, essential oil composition and antioxidant activity of Lavandula angustifolia Mill. J. Soil Sci. Plant Nutr. 2017, 17, 291–306. [Google Scholar] [CrossRef] [Green Version]
  10. Freitas, M.S.M.; Gonçalves, Y.D.S.; Lima, T.C.; Santos, P.C.D.; Peçanha, D.A.; Vieira, M.E.; Carvalho, A.J.C.D.; Vieira, I.J.C. Potassium sources and doses in coriander fruit production and essential oil content. Hortic. Bras. 2020, 38, 268–273. [Google Scholar] [CrossRef]
  11. Ertani, A.; Sambo, P.; Nicoletto, C.; Santagata, S.; Schiavon, M.; Nardi, S. The use of organic biostimulants in hot pepper plants to help low input sustainable agriculture. Chem. Biol. Technol. Agric. 2015, 2, 1–10. [Google Scholar] [CrossRef] [Green Version]
  12. Khan, W.; Rayirath, U.P.; Subramanian, S.; Jithesh, M.N.; Rayorath, P.; Hodges, D.M.; Critchley, A.T.; Craigie, J.S.; Norrie, J.; Prithiviraj, B. Seaweed extracts as biostimulants of plant growth and development. J. Plant Growth Regul. 2009, 28, 386–399. [Google Scholar] [CrossRef]
  13. Ali, O.; Ramsubhag, A.; Jayaraman, J. Biostimulant properties of seaweed extracts in plants: Implications towards sustainable crop production. Plants 2021, 10, 531. [Google Scholar] [CrossRef] [PubMed]
  14. Papenfus, H.B.; Kulkarni, M.G.; Stirk, W.A.; Finnie, J.F.; Van Staden, J. Effect of a commercial seaweed extract (Kelpak®) and polyamines on nutrient-deprived (N, P and K) okra seedlings. Sci. Hortic. 2013, 151, 142–146. [Google Scholar] [CrossRef]
  15. Xu, C.; Leskovar, D.I. Effects of A. nodosum seaweed extracts on spinach growth, physiology and nutrition value under drought stress. Sci. Hortic. 2015, 183, 39–47. [Google Scholar] [CrossRef]
  16. Frioni, T.; VanderWeide, J.; Palliotti, A.; Tombesi, S.; Poni, S.; Sabbatini, P. Foliar vs. soil application of Ascophyllum nodosum extracts to improve grapevine water stress tolerance. Sci. Hortic. 2021, 277, 109807. [Google Scholar] [CrossRef]
  17. Tursun, A.O. Effect of foliar application of seaweed (organic fertilizer) on yield, essential oil and chemical composition of coriander. PLoS ONE 2022, 17, e0269067. [Google Scholar] [CrossRef]
  18. Patil, S.M.; Ramu, R.; Shirahatti, P.S.; Shivamallu, C.; Amachawadi, R.G. A systematic review on ethnopharmacology, phytochemistry and pharmacological aspects of Thymus vulgaris Linn. Heliyon 2021, 7, e07054. [Google Scholar] [CrossRef]
  19. Popa, C.L.; Lupitu, A.; Mot, M.D.; Copolovici, L.; Moisa, C.; Copolovici, D.M. Chemical and biochemical characterization of essential oils and their corresponding hydrolats from six species of the Lamiaceae family. Plants 2021, 10, 2489. [Google Scholar] [CrossRef]
  20. Hammoudi Halat, D.; Krayem, M.; Khaled, S.; Younes, S. A focused insight into thyme: Biological, chemical, and therapeutic properties of an indigenous Mediterranean herb. Nutrients 2022, 14, 2104. [Google Scholar] [CrossRef]
  21. Lichtenthaler, H.K. Chlorophylls and carotenoids: Pigments of photosynthetic biomembranes. Methods Enzymol. 1987, 148, 350–382. [Google Scholar] [CrossRef]
  22. Bezerra, M.A.; Santelli, R.E.; Oliveira, E.P.; Villar, L.S.; Escaleira, L.A. Response surface methodology (RSM) as a tool for optimization in analytical chemistry. Talanta 2008, 76, 965–977. [Google Scholar] [CrossRef] [PubMed]
  23. Chenard, C.H.; Kopsell, D.A.; Kopsell, D.E. Nitrogen concentration affects nutrient and carotenoid accumulation in parsley. J. Plant Nutr. 2005, 28, 285–297. [Google Scholar] [CrossRef]
  24. Peng, J.; Feng, Y.; Wang, X.; Li, J.; Xu, G.; Phonenasay, S.; Luo, Q.; Han, Z.; Lu, W. Effects of nitrogen application rate on the photosynthetic pigment, leaf fluorescence characteristics, and yield of indica hybrid rice and their interrelations. Sci. Rep. 2021, 11, 7485. [Google Scholar] [CrossRef] [PubMed]
  25. Taiz, L.; Zeiger, E. Plant Physiology, 5th ed.; Sinauer Associates Inc.: Sunderland, MA, USA, 2010. [Google Scholar]
  26. Hasanuzzaman, M.; Bhuyan, M.B.; Nahar, K.; Hossain, M.S.; Mahmud, J.A.; Hossen, M.S.; Masud, A.A.C.; Fujita, M. Potassium: A vital regulator of plant responses and tolerance to abiotic stresses. Agronomy 2018, 8, 31. [Google Scholar] [CrossRef] [Green Version]
  27. Xu, Y.W.; Zou, Y.T.; Husaini, A.M.; Zeng, J.W.; Guan, L.L.; Liu, Q.; Wu, W. Optimization of potassium for proper growth and physiological response of Houttuynia cordata Thunb. Environ. Exp. Bot. 2011, 71, 292–297. [Google Scholar] [CrossRef]
  28. El Gendy, A.G.; El Gohary, A.E.; Omer, E.A.; Hendawy, S.F.; Hussein, M.S.; Petrova, V.; Stancheva, I. Effect of nitrogen and potassium fertilizer on herbage and oil yield of chervil plant (Anthriscus cerefolium L.). Ind. Crops Prod. 2015, 69, 167–174. [Google Scholar] [CrossRef]
  29. Du, Q.; Zhao, X.-H.; Xia, L.; Jiang, C.-J.; Wang, X.-G.; Han, Y.; Wang, J.; Yu, H.-Q. Effects of potassium deficiency on photosynthesis, chloroplast ultrastructure, ROS, and antioxidant activities in maize (Zea mays L.). J. Integr. Agric. 2019, 18, 395–406. [Google Scholar] [CrossRef] [Green Version]
  30. Rani, P.; Saini, I.; Singh, N.; Kaushik, P.; Wijaya, L.; Al-Barty, A.; Darwish, H.; Noureldeen, A. Effect of potassium fertilizer on the growth, physiological parameters, and water status of Brassica juncea cultivars under different irrigation regimes. PLoS ONE 2021, 16, e0257023. [Google Scholar] [CrossRef]
  31. Manaf, H.H. Beneficial effects of exogenous selenium, glycine betaine and seaweed extract on salt stressed cowpea plant. Ann. Agric. Sci. 2016, 61, 41–48. [Google Scholar] [CrossRef]
  32. Hussain, H.I.; Kasinadhuni, N.; Arioli, T. The effect of seaweed extract on tomato plant growth, productivity and soil. J. Appl. Phycol. 2021, 33, 1305–1314. [Google Scholar] [CrossRef]
  33. Hussein, M.M.; El-Faham, S.Y.; Alva, A.K. Pepper plants growth, yield, photosynthetic pigments, and total phenols as affected by foliar application of potassium under different salinity irrigation water. Agric. Sci. 2012, 3, 241–248. [Google Scholar] [CrossRef] [Green Version]
  34. Oosterhuis, D.M.; Loka, D.A.; Kawakami, E.M.; Pettigrew, W.T. The physiology of potassium in crop production. Adv. Agron. 2014, 126, 203–233. [Google Scholar] [CrossRef]
  35. Kılıç, C.C.; Anaç, D.; Eryüce, N.; Kılıç, Ö.G. Effect of potassium and phosphorus fertilization on green herb yield and some quality traits of Thymus vulgaris L. Afr. J. Agric. Res. 2012, 7, 6427–6431. [Google Scholar] [CrossRef] [Green Version]
  36. Esetlili, B.Ç.; Öztürk, B.; Çobanoğlu, Ö.; Anaç, D. Sweet basil (Ocimum basilicum L.) and potassium fertilization. J. Plant Nutr. 2016, 39, 35–44. [Google Scholar] [CrossRef]
  37. Battacharyya, D.; Babgohari, M.Z.; Rathor, P.; Prithiviraj, B. Seaweed extracts as biostimulants in horticulture. Sci. Hortic. 2015, 196, 39–48. [Google Scholar] [CrossRef]
  38. Rouphael, Y.; De Micco, V.; Arena, C.; Raimondi, G.; Colla, G.; De Pascale, S. Effect of Ecklonia maxima seaweed extract on yield, mineral composition, gas exchange, and leaf anatomy of zucchini squash grown under saline conditions. J. Appl. Phycol. 2017, 29, 459–470. [Google Scholar] [CrossRef]
  39. Shukla, P.S.; Prithiviraj, B. Ascophyllum nodosum biostimulant improves the growth of Zea mays grown under phosphorus impoverished conditions. Front. Plant Sci. 2021, 11, 601843. [Google Scholar] [CrossRef]
  40. Baranauskienė, R.; Venskutonis, P.R.; Viškelis, P.; Dambrauskienė, E. Influence of nitrogen fertilizers on the yield and composition of thyme (Thymus vulgaris). J. Agric. Food Chem. 2003, 51, 7751–7758. [Google Scholar] [CrossRef]
  41. Arabaci, O.; Bayram, E. The effect of nitrogen fertilization and different plant densities on some agronomic and technologic characteristic of Ocimum basilicum L. (Basil). J. Agron. 2004, 3, 255–262. [Google Scholar] [CrossRef]
  42. Singh, M.; Khan, M.M.A.; Naeem, M. Effect of nitrogen on growth, nutrient assimilation, essential oil content, yield and quality attributes in Zingiber officinale Rosc. J. Saudi Soc. Agric. Sci. 2016, 15, 171–178. [Google Scholar] [CrossRef] [Green Version]
  43. Karimi, B.; Rokhzadi, A.; Rahimi, A.R. RSM modeling of nitrogen use efficiency, biomass and essential oil of Salvia officinalis L. as affected by fertilization and plant density. J. Plant Nutr. 2021, 44, 1067–1084. [Google Scholar] [CrossRef]
  44. Nurzyńska-Wierdak, R.; Borowski, B.; Dzida, K.; Zawiślak, G.; Kowalski, R. Essential oil composition of sweet basil cultivars as affected by nitrogen and potassium fertilization. Turk. J. Agric. For. 2013, 37, 427–436. [Google Scholar] [CrossRef]
  45. Elansary, H.O.; Yessoufou, K.; Shokralla, S.; Mahmoud, E.A.; Skalicka-Woźniak, K. Enhancing mint and basil oil composition and antibacterial activity using seaweed extracts. Ind. Crops Prod. 2016, 92, 50–56. [Google Scholar] [CrossRef]
  46. Waly, A.A.; El-Fattah, A.; Hassan, M.A.E.; El-Ghadban, E.M.; Abd Alla, A.S. Enhancing growth, productivity and essential oil percentage of Thymus vulgaris L. plant using seaweeds extract, chitosan and potassium silicate in sandy soil. Sci. J. Flowers Ornam. Plants 2020, 7, 549–562. [Google Scholar] [CrossRef]
  47. Ghatas, Y.; Ali, M.; Elsadek, M.; Mohamed, Y. Enhancing growth, productivity and artemisinin content of Artemisia annua L. plant using seaweed extract and micronutrients. Ind. Crops Prod. 2021, 161, 113202. [Google Scholar] [CrossRef]
  48. Tawfeeq, A.; Culham, A.; Davis, F.; Reeves, M. Does fertilizer type and method of application cause significant differences in essential oil yield and composition in rosemary (Rosmarinus officinalis L.)? Ind. Crops Prod. 2016, 88, 17–22. [Google Scholar] [CrossRef]
  49. Nhu-Trang, T.T.; Casabianca, H.; Grenier-Loustalot, M.F. Deuterium/hydrogen ratio analysis of thymol, carvacrol, γ-terpinene and p-cymene in thyme, savory and oregano essential oils by gas chromatography–pyrolysis–isotope ratio mass spectrometry. J. Chromatogr. A 2006, 1132, 219–227. [Google Scholar] [CrossRef]
  50. Ghasemi Pirbalouti, A.; Hashemi, M.; Ghahfarokhi, F.T. Essential oil and chemical compositions of wild and cultivated Thymus daenensis Celak and Thymus vulgaris L. Ind. Crops Prod. 2013, 48, 43–48. [Google Scholar] [CrossRef]
  51. Emami Bistgani, Z.; Siadat, S.A.; Bakhshandeh, A.; Ghasemi Pirbalouti, A.; Hashemi, M. Morpho-physiological and phytochemical traits of (Thymus daenensis Celak.) in response to deficit irrigation and chitosan application. Acta Physiol. Plant. 2017, 39, 1–13. [Google Scholar] [CrossRef]
  52. Askary, M.; Behdani, M.A.; Parsa, S.; Mahmoodi, S.; Jamialahmadi, M. Water stress and manure application affect the quantity and quality of essential oil of Thymus daenensis and Thymus vulgaris. Ind. Crops Prod. 2018, 111, 336–344. [Google Scholar] [CrossRef]
  53. Pavela, R.; Žabka, M.; Vrchotová, N.; Tříska, J. Effect of foliar nutrition on the essential oil yield of Thyme (Thymus vulgaris L.). Ind. Crops Prod. 2018, 112, 762–765. [Google Scholar] [CrossRef]
  54. Preedy, V.R. Essential Oils in Food Preservation, Flavor and Safety; Academic Press: Cambridge, MA, USA, 2015. [Google Scholar]
  55. Omer, E.A. Response of wild Egyptian oregano to nitrogen fertilization in a sandy soil. J. Plant Nutr. 1999, 22, 103–114. [Google Scholar] [CrossRef]
  56. El-Alam, I.; Zgheib, R.; Iriti, M.; El Beyrouthy, M.; Hattouny, P.; Verdin, A.; Fontaine, J.; Chahine, R.; Lounès-Hadj Sahraoui, A.; Makhlouf, H. Origanum syriacum essential oil chemical polymorphism according to soil type. Foods 2019, 8, 90. [Google Scholar] [CrossRef] [Green Version]
  57. Vaičiulytė, V.; Ložienė, K.; Taraškevičius, R.; Butkienė, R. Variation of essential oil composition of Thymus pulegioides in relation to soil chemistry. Ind. Crops Prod. 2017, 95, 422–433. [Google Scholar] [CrossRef]
  58. Pereira, L.; Morrison, L.; Shukla, P.S.; Critchley, A.T. A concise review of the brown macroalga Ascophyllum nodosum (Linnaeus) Le Jolis. J. Appl. Phycol. 2020, 32, 3561–3584. [Google Scholar] [CrossRef]
  59. Karamanos, A.J.; Sotiropoulou, D.E. Field studies of nitrogen application on Greek oregano (Origanum vulgare ssp. hirtum (Link) Ietswaart) essential oil during two cultivation seasons. Ind. Crops Prod. 2013, 46, 246–252. [Google Scholar] [CrossRef]
  60. Bahreininejad, B.; Razmjoo, J.; Mirza, M. Influence of water stress on morpho-physiological and phytochemical traits in Thymus daenensis. Int. J. Plant Prod. 2013, 7, 151–166. [Google Scholar] [CrossRef]
  61. Bahreininejad, B.; Razmjoo, J.; Mirza, M. Effect of water stress on productivity and essential oil content and composition of Thymus carmanicus. J. Essent. Oil Bear. Plants 2014, 17, 717–725. [Google Scholar] [CrossRef]
  62. Ghasemi Pirbalouti, A.; Rahmani Samani, M.; Hashemi, M.; Zeinali, H. Salicylic acid affects growth, essential oil and chemical compositions of thyme (Thymus daenensis Celak.) under reduced irrigation. Plant Growth Regul. 2014, 72, 289–301. [Google Scholar] [CrossRef]
  63. Mehrparvar, M.; Rokhzadi, A.; Mohammadi, K. Reduced n application rate in sunflower production through supplying P and K need and dense-planting: A modeling and optimization approach by RSM. J. Soil Sci. Plant Nutr. 2021, 21, 1353–1367. [Google Scholar] [CrossRef]
Figure 1. Response surface plots showing the effects of N fertilizer and seaweed extract (a), and K fertilizer and seaweed extract (b) on the total chlorophyll content of thyme. K fertilizer in (a), and N fertilizer in (b) was kept constant at 6 and 200 kg ha−1, respectively.
Agronomy 12 03222 g001
Figure 2. Response surface plots showing the effects of N fertilizer and seaweed extract (a), and K fertilizer and seaweed extract (b) on the carotenoids content of thyme. K fertilizer in (a), and N fertilizer in (b) was kept constant at 6 and 200 kg ha−1, respectively.
Agronomy 12 03222 g002
Figure 3. Response surface plots showing the interactive effects of N fertilizer and seaweed extract (a), and K fertilizer and seaweed extract (b) on the shoot dry weight of thyme. K fertilizer in (a), and N fertilizer in (b) was kept constant at 6 kg ha−1 and 200 kg ha−1, respectively.
Agronomy 12 03222 g003
Figure 4. Response surface plots showing the interactive effects of N and K fertilizers (a), and K fertilizer and seaweed extract (b) on the essential oil content of thyme. Seaweed extract in (a), and N fertilizer in (b) was kept constant at 3 L ha−1 and 200 kg ha−1, respectively.
Agronomy 12 03222 g004
Figure 5. Response surface (a), and contour plot (b) showing the interactive effects of N and K fertilizers on the essential oil yield of thyme. Seaweed extract was kept constant at 3 L ha−1.
Agronomy 12 03222 g005
Figure 6. Response surface (a), and contour plot (b) showing the interactive effects of N fertilizer and seaweed extract on the essential oil yield of thyme. K fertilizer was kept constant at 6 kg ha−1.
Agronomy 12 03222 g006
Figure 7. Response surface plots showing the effects of N and K fertilizers on the content of thymol (a), and carvacrol (b). The seaweed extract was kept constant at 3 L ha−1.
Agronomy 12 03222 g007
Figure 8. Response surface (a), and contour plot (b) showing the effect of N fertilizer and seaweed extract on the carvacrol content. The K fertilizer was kept constant at 6 kg ha−1.
Agronomy 12 03222 g008
Figure 9. Biosynthetic pathway of thymol and carvacrol from γ-terpinene and p-cymene (adapted from Nhu-Trang [49].
Agronomy 12 03222 g009
Table 1. Mean air temperature and rainfall during the growing season of 2021 and long-term period.
MonthsMean Air Temperature (°C) Rainfall (mm)
2021Long-Term Period2021Long-Term Norm
May20.916.6 3.639.6
June26.622.3 02.8
July28.727.0 00.7
August27.126.5 7.10.6
September22.521.1 00.7
Table 2. Soil characteristics of the experimental site.
CharacteristicValue
Clay (%)34.9
Silt (%)31.8
Sand (%)33.3
OC (%)0.92
TNV (%)12
pH7.5
EC (dS m−1)0.603
Ntotal (%)0.09
P (mg kg−1)16.1
K (mg kg−1)298
NO3-N (mg kg−1)24.0
NH4-N (mg kg−1)17.5
OC: organic carbon, TNV: total neutralizing value, EC: electrical conductivity, N: nitrogen, P: phosphorus, K: potassium.
Table 3. Coded and actual levels of the experimental factors.
Coded LevelsActual Levels
Nitrogen
(kg urea ha−1)
Potassium
(kg FSP ha−1)
Seaweed Extract
(L ha−1)
−1000
020063
+1400126
FSP: Flourish Sulfopotash.
Table 4. Analysis of variance, regression coefficients, and adequacy criteria of the fitted models for total chlorophyll, carotenoids, and shoot dry weight.
SourcedfTotal Chlorophyll Carotenoids Shoot Dry Weight
Regression Coefficientp-ValueRegression Coefficientp-ValueRegression Coefficientp-Value
Model9 0.0027 0.0019 0.0257
Intercept 1.55 0.7304 1003.00
Linear
N1−0.06340.3245 −0.03910.0715 48.790.2944
K10.32700.0024 0.06490.0128 76.780.1247
SW (seaweed)10.19240.0212 0.09200.0030 126.760.0287
Quadratic
N21−0.23250.0418 −0.07960.0253 −189.520.0272
K210.01850.8376 −0.01420.5989 23.190.7209
SW210.48910.0023 −0.03950.1783 81.240.2426
Interaction
N * K10.04650.5958 −0.02930.2813 −79.590.2347
N * SW10.44860.0028 0.21500.0003 −112.930.1135
K * SW10.54640.0012 0.16940.0009 309.590.0033
Lack of fit3 0.1136 0.5409 0.8410
Pure error2
R2 0.9699 0.9742 0.9223
Adequate precision 16.59 18.63 10.54
CV (%) 9.70 7.35 12.31
Bold p-values indicate statistical significance (p ˂ 0.05).
Table 5. Analysis of variance, regression coefficients, and adequacy criteria of the fitted models for essential oil content and yield, thymol, γ-terpinene, p-cymene, and carvacrol.
SourcedfEssential Oil Content Essential Oil Yield Thymol γ-Terpinene p-Cymene Carvacrol
Regression Coefficientp-ValueRegression Coefficientp-ValueRegression Coefficientp-ValueRegression Coefficientp-Value Regression Coefficientp-Value Regression Coefficientp-Value
Model9 0.0017 0.0079 0.0387 0.2990 0.9026 0.0089
Intercept 0.8600 8.56 47.32 18.91 14.04 6.73
Linear
N1−0.04500.0877 −0.15220.6162 1.880.0148 −1.480.0472 −0.49750.5257 1.270.0051
K10.15000.0009 1.820.0014 0.07250.8938 0.44630.4653 −0.02120.9779 −0.77370.0349
SW (Seaweed)1−0.11250.0032 −0.05240.8612 −0.69370.2368 0.32500.5900 0.42630.5845 −0.15120.5245
Quadratic
N21−0.06750.0833 −1.660.0107 −0.21960.7842 0.70290.4365 1.110.3504 −2.020.0066
K210.08250.0461 0.61910.1999 −2.860.0131 0.11790.8928 −0.37170.7434 1.190.0280
SW21−0.20250.0013 −1.690.0101 0.86040.3089 −0.34960.6916 −0.62170.5878 −1.200.0273
Interaction
N * K1−0.10000.0208 −1.570.0113 −2.800.0122 1.010.2608 0.53250.6279 1.110.0197
N * SW1−0.06000.1023 −1.330.0215 0.23250.7630 −0.82000.3517 −0.85750.4439 1.850.0047
K * SW1−0.20000.0012 0.28480.5113 −1.170.1685 1.500.1192 0.05500.9596 −0.55250.2065
Lack of fit3 0.6797 0.4948 0.2941 0.7804 0.5595 0.7890
Pure error2
R2 0.9753 0.9530 0.9070 0.7495 0.4052 0.9889
Adequate
Precision
16.92 11.22 9.08 3.90 2.23 17.95
CV (%) 7.91 11.35 3.17 8.34 14.63 8.69
Bold p-values indicate statistical significance (p ˂ 0.05).
Table 6. The main compounds of thyme essential oil as affected by the experimental factors.
Levels of the Factors Compounds (%)
Nitrogen
(kg urea ha−1)
Potassium
(kg FSP ha−1)
Seaweed Extract
(L ha−1)
Thymolγ-Terpinenep-CymeneCarvacrol
003 38.5322.7716.866.68
060 47.0619.1814.434.07
066 44.9521.6815.630.32
0123 46.3120.2613.682.66
20000 45.6518.8210.987.09
20006 46.8716.2613.097.64
20063 48.1317.3813.927.20
20063 46.1321.1916.22-
20063 47.6918.1511.996.26
200120 46.1118.0912.906.90
200126 42.6321.5315.23-
40003 47.7617.1714.816.93
40060 50.5018.4815.143.00
40066 49.3217.7012.916.65
400123 44.3418.7113.767.35
Mean 46.1319.1614.105.60
RI 1301107010341307
FSP: Flourish Sulfopotash, RI: retention index.
Table 7. The optimized levels of independent variables and the predicted values of thyme responses.
Variables Values
Independent variables (optimized levels)Nitrogen (kg urea ha−1)162
Potassium (kg FSP ha−1)12
Seaweed extract (L ha−1)3.9
Response variables (predicted values)Total chlorophyll (mg g−1 FW)2.127
Carotenodis (mg g−1 FW)0.854
Shoot dry weight (kg ha−1)1247
Essential oil content (%)1.0
Essential oil yield (kg ha−1)11.3
Thymol (%)44.2
Carvacrol (%)6.2
Desirability 0.725
FSP: Flourish Sulfopotash.
Publisher’s Note: MDPI stays neutral with regard to jurisdictional claims in published maps and institutional affiliations.

