Article

Imidacloprid Disturbs the Nitrogen Metabolism and Triggers an Overall Stress Response in Maize Seedlings

1
Institute of Nanfan & Seed Industry, Guangdong Academy of Sciences, Guangzhou 510316, China
2
Collaborative Innovation Center for Efficient and Green Production of Agriculture in Mountainous Areas of Zhejiang Province, College of Horticulture Science, Zhejiang Agriculture and Forestry University, Hangzhou 311300, China
*
Authors to whom correspondence should be addressed.
Agronomy 2022, 12(12), 3161; https://doi.org/10.3390/agronomy12123161
Submission received: 4 November 2022 / Revised: 9 December 2022 / Accepted: 10 December 2022 / Published: 13 December 2022
(This article belongs to the Special Issue Breeding Innovations in Crop for Resilient Cropping Systems)

Abstract

:
Imidacloprid (IMI) protects crops from pests; however, its potential toxicity to plants and underlying mechanisms are still poorly understood. We investigated the effects of IMI on maize seedlings under different nitrogen sufficiency conditions. Our measurement of the maize seedlings’ growth traits and physiological indicators found that a 5 ppm IMI treatment stunted the maize’s growth and enhanced membrane lipid peroxidation under a nitrogen-supplied condition, but that it promoted an increase in biomass and alleviated chlorosis in maize shoots under nitrogen deficiency. These results suggest that IMI causes serious toxicity in maize seedlings under nitrogen-sufficient conditions. The content of IMI indicated that the leaf was the main site of IMI accumulation in maize, and that NO3 was beneficial for the transportation of IMI from the roots to the leaves. The three groups of seedlings, which received 0 (−N), 4 (N) or 10 mmol L−1 NO3 (NN), were either treated or not treated with 5 ppm IMI. The six sets of transcriptome profiles from the shoots and roots were compared using Illumina sequencing. Transcriptome analysis revealed that IMI treatment led to changes in the expression of the genes involved in multiple biological processes, including nitrate transporter, nitrogen assimilation, nitrogen-regulatory factors, detoxification-related genes and several antioxidant-related genes in maize roots. The above results and the data for the nitrate content, glutamine synthetase activities and nitrate reductase activities showed that IMI disturbed nitrogen absorption and metabolism in maize seedlings. Glutathione S-transferase genes, C-type ATP-binding cassette (ABC) transporter 4, anthocyanins and lignin may play an important role in the detoxification of IMI in maize. These findings have helped us to elaborate the underlying detoxification mechanisms of IMI in plants, which is highly important in the cultivation of anti-pesticide crop varieties.

1. Introduction

Crops are easily injured by manifold pests, such as aphids, leaf hoppers, thrips, white fly and termites. Neonicotinoids are widely used in controlling the pests that infest many crops—such as maize, rice, sugarcane, vegetables and cotton [1,2,3,4]—because they are highly effective against a variety of insects [5]. As agonists, neonicotinoids can selectively bind with the nicotinic acetylcholine receptors (nAChRs) of a pest’s postsynaptic membrane and cause abnormal nerve signal transduction, which eventually leads to the death of the insect [6,7]. An investigation into global insecticide sales has shown that the sale share of neonicotinoids exceeds approximately 25% [8].
IMI was the first commercial neonicotinoid developed in 1991 and it is widely used in soil application, seed treatment and foliar spraying to control pests [9,10]. The research on IMI utilization showed that only approximately 5% of the active components are absorbed by crops, whereas 90% enters the atmosphere, runoff or farmland [11]. The residual IMI in the environment is ingested by non-target insects, plants, birds and fish and becomes a negative factor in ecology and food safety [12,13,14]. The most common results of IMI toxicity are the decline in the pollen and nectar-feeding insect population and an increase in the frequency of colony collapse disorder in the honey bee population [15]. Although IMI has low toxicity to mammals, long-term exposure can still cause health hazards. Experiments on IMI’s toxicity to animals have shown that it triggered morphological and DNA damage in animal’s reproductive organs [16,17,18]. In addition, according to in vitro studies, it also has genotoxic and cytotoxic effects on human peripheral blood lymphocytes [19,20]. Some regions have limited the detectable concentration of IMI in surface water to reduce the environmental and food safety risk [21,22,23]. Although a low dose of IMI reportedly has little effect or even positive effects on plants [24], the significant use of IMI results in high amounts of IMI residues and in IMI decomposition products remaining in the environment. Reassessing the effects of IMI on plant growth and physiology is highly significant in food safety and crop breeding for pesticide resistance.
Maize is widely cultivated as food for humans, fodder for livestock and material for industrial use. Its yield is closely related to the stability of world food and economic development. IMI is pervasively used to control insect pests, such as planthoppers, thrips and aphids, which commonly infest maize crops at the seedling stage [25,26]. In this study, we investigated maize seedlings’ growth and physiological changes after being treated with IMI under different nitrogen supply conditions. We also analyzed the transport characteristics of IMI under different nitrogen conditions. Moreover, transcriptome analyses were carried out to improve the determination of the overall effects of IMI on maize in terms of transcription status. Our study highlights the underlying detoxification mechanisms of IMI on plants and provides candidate genes for IMI resistance breeding.

2. Materials and Methods

2.1. Plant Materials, Growth Conditions and Treatments

The cultivated variety of maize used in this study was purchased from Guangdong Academy of Agricultural Sciences (Jin Yin Su). Seeds were surface sterilized with 3% H2O2 and soaked for 24 h at room temperature. Next, they were transferred to plates with wet vermiculite to germinate. After 3 days of germination, the seedlings were placed in modified Hoagland nutrient solution (−N, N, NN, A and AA), containing different nitrogen forms and concentrations. −N was the nitrogen-deficient solution, which contained 0.25 mmol L−1 KH2PO4; 0.75 mmol L−1 K2SO4; 0.65 mmol L−1 MgSO4·7H2O; 1.0 μmol L−1 H3BO3; 1.0 μmol L−1 MnCl2·4H2O; 0.1 μmol L−1 ZnSO4·7H2O; 0.1 μmol L−1 CuSO4·5H2O; 0.05 μmol L−1 Na2MoO4·7H2O; 200 μmol L−1 Fe-EDTA; and 0.1 μmol L−1 KCl. The other four nutrient solutions were obtained by adding different nitrogen sources to -N, as follows: we added 2.0 mmol L−1 Ca(NO3)2 for N, added 2.0 mmol L−1 Ca(NO3)2 and 6.0 mmol L−1 NaNO3 for NN, added 4.0 mmol L−1 NH4Cl and 2.0 mmol L−1 CaCl2 for A and added 10.0 mmol L−1 NH4Cl and 2.0 mmol L−1 CaCl2 for AA. The nutrient solution was refreshed every 2 days. Seedlings were grown in an artificial environment, as follows: 25 °C/18 °C day/night temperatures, 16 h/8 h day/night photoperiod and 60–80% relative humidity. After 7 days, the seedlings were treated with 0, 1, 2.5 and 5 ppm IMI, which was applied to the different nutrient solutions. After 2 weeks, the lengths of the main roots and shoots of seedlings were measured. The fresh samples were weighed to determine the content of chlorophyll and thiobarbituric acid-reactive substances (TBARS). Samples were washed three times using dichloroethane and ultrapure water for IMI determination. For RNA sequencing and quantitative real-time PCR (qRT-PCR) analysis, the seedlings in the −N, N and NN groups were treated or not treated with 5 ppm IMI, for 24 h (for roots) or 48 h (for shoots), and the shoots and roots were collected and stored at −80 °C, respectively.

2.2. Measurement of Chlorophyll and the Degree of Membrane Lipid Peroxidation

The chlorophyll content of leaves was characterized using the SPAD value, which was measured by using a 502 plus meter [27]. SPAD values of the expanded uppermost leaves were determined. SPAD readings were taken at two thirds of the distance from the leaf base to the apex. The membrane lipid peroxidation was measured by testing the amount of thiobarbituric acid-reactive substances (TBARS), in accordance with the method of Li et al. (2022) [28]. In total, 0.5 g of fresh maize seedlings were ground into homogenate on ice, and 5 mL trichloroacetic acid (0.1%, v/v) was added to extract malonaldehydes. The mixture was centrifuged at 10,000× g for 15 min. Next, 500 μL of the above supernatant was added to 1.5 mL trichloroacetic acid (20%, v/v), containing 0.5% thiobarbituric acid (v/v) and fully mixed. After incubation at 95 °C for 30 min, the mixture was centrifuged at 10,000× g for 15 min. The content of TBARS was tested by reading the absorption at A532.

2.3. Determination of Imidacloprid Content

To investigate the distribution patterns of IMI in maize and the effect of nitrogen on IMI accumulation, the content of IMI in maize roots, stems and leaves was analyzed by HPLC. IMI was extracted from shoots and roots of maize by using a modified QuEChERS method [29]. The fresh roots and leaves (1.0 g) were ground into powder and extracted by 2 mL acetonitrile for 30 min. Next, 0.2 g MgSO4 and 0.3 g NaCl were added into the extraction medium and swirled for 1 min. The mixture was centrifuged at 7000× g for 10 min. Next, 0.15 g MgSO4 and 0.02 g GCB were added to 1.5 mL supernatant and swirled for 1 min. Afterwards, the supernatant was centrifuged at 5000× g for 5 min and then filtered through a 0.22 hydrophobic membrane, and the effluent was obtained to determine the IMI content. The Agilent 1260 Infinity UPLC system (Agilent Technologies, Santa Clara, CA, USA), equipped with an Agilent Zorbax TC-C18 column, was used for the separation of the IMI. IMI was detected using a fluorescence detector. The wavelength was set at 270 nm. Quantification was performed via authentic IMI standards (Sigma-Aldrich, Shanghai, China).

2.4. RNA Sequencing

Three biological replicates were set for each treatment. The total RNA of 36 samples was extracted according to the method of Zhang et al. (2020) [30]. RNA sequencing was performed at Biomarker Biotechnology Corporation (Beijing, China), using the Illumina system, HiSeq2500 (Illumina Inc., San Diego, CA, USA), in accordance with the standard procedure. The high-quality reads (clean data) were used for alignment analysis, and these reads were mapped to the maize reference genome of B73 (https:www.maizegdb.org/genome/assembly/Zm-B73-REFERENCE-NAM-5.0 (accessed on 3 November 2022)), by HISAT2 [31].

2.5. Differentially Expressed Gene (DEG) Analysis and Annotation

The number of mapped reads and transcript lengths of samples were normalized by the fragments per kilobase of transcript per million fragments mapped (FPKM) method [32]. The differentially expressed genes (DEGs) among the groups were identified by DESeq2 software [33]. The fold change and P-value were used as screening conditions. The genes were selected as DEGs when their p-value was <0.01 and their fold change was >2 in shoots, or when their p-value was <0.01 and their fold change was >3 in roots. Kyoto Encyclopedia of Genes and Genomes (KEGG) was used to show the location of DEGs in different pathways, using KOBAS software when the p value was <0.05, under pathway conditions [34]. A Venn diagram of DEGs was generated using the GeneVenn application [35].

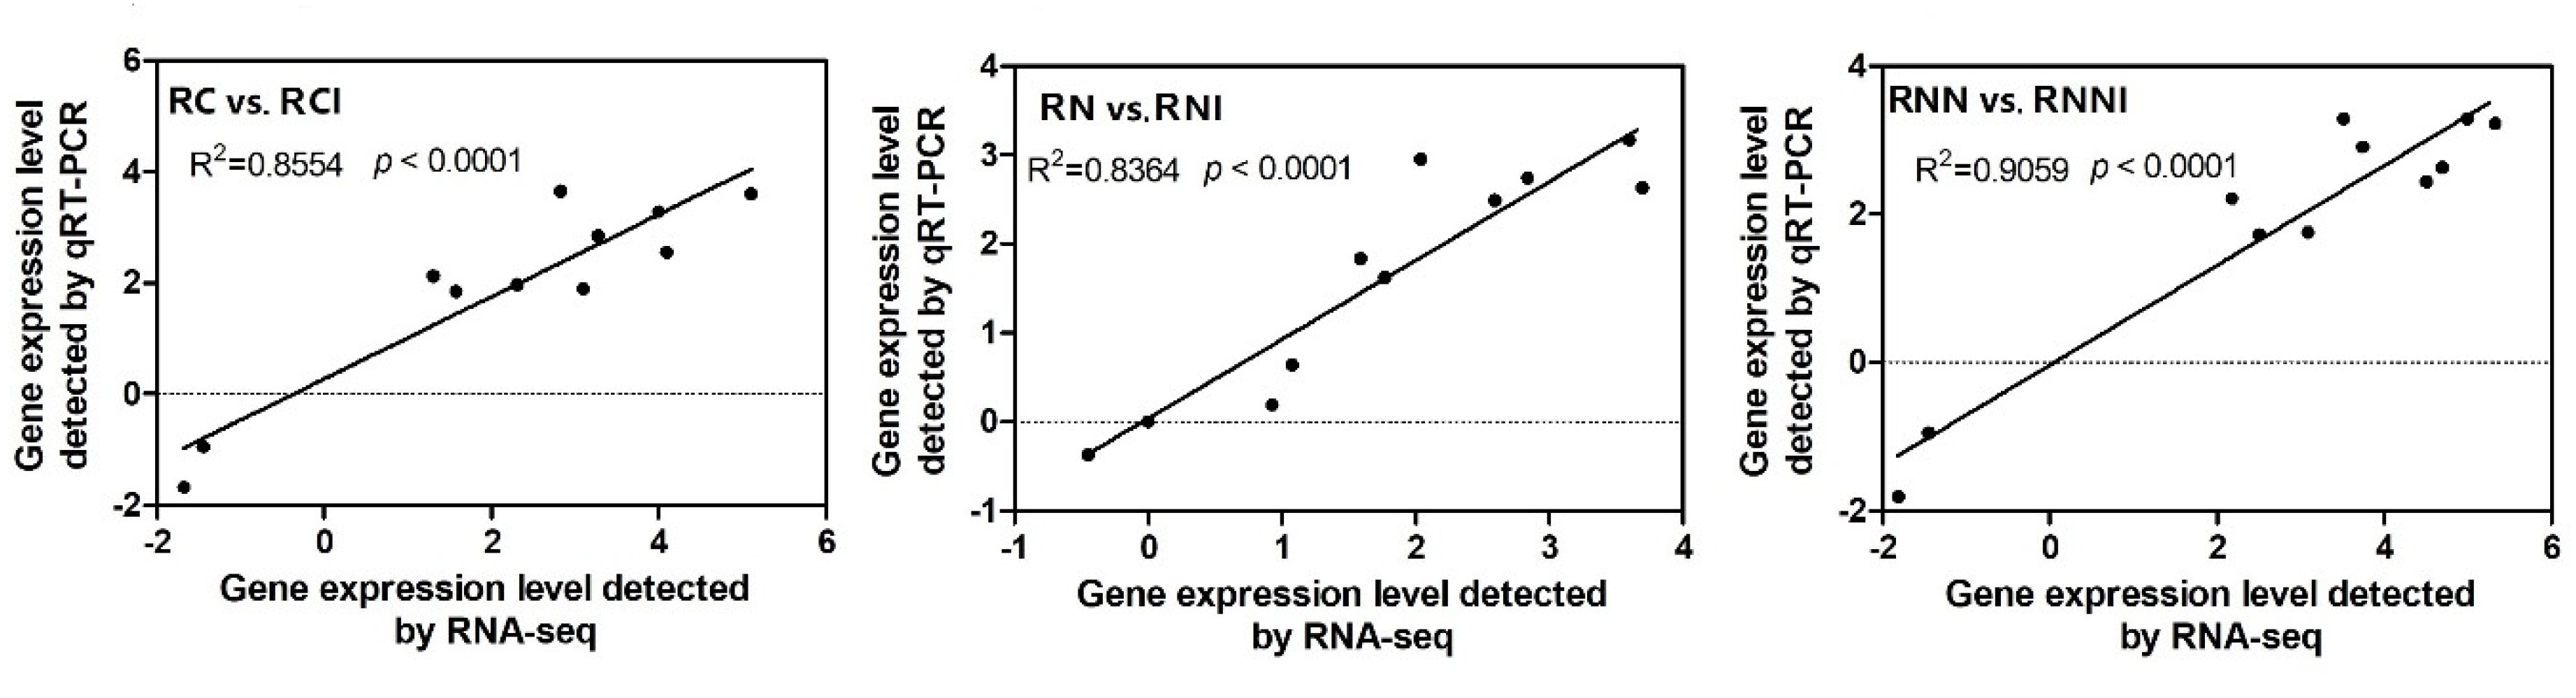
2.6. Quantitative Real-Time PCR Analysis

The total RNA of all samples was extracted as described above. RNA (1 μg) was used for cDNA synthesis by a PrimeScript RT reagent kit (Takara, Beijing, China). qRT-PCR was performed with TB Green ® Premix Ex Taq™ (Takara, Beijing, China), by a Roche LightCycler96 Real time PCR System. The primers for qRT-PCR are presented in Supplementary Table S1. Zmactin1 of maize was used as the internal control. The relative expression levels of the genes were calculated by 2−∆∆CT method [36].

2.7. Nitrate Reductase, Glutamate Synthases’ Activity and Nitrate Content Assay

The extraction and determination of nitrate in the maize seedlings were performed according to the method of Zhou and Wang [37]. A total of 0.1 g fresh samples were powdered with liquid nitrogen using a mortar and pestle. Next, 1 mL deionized water was added into the powders and then boiled at 100 °C, for 20 min. Next, the mixtures were centrifuged at 13,200× g for 10 min. Next, 0.1 mL supernatant (0.1 mL deionized water as a control) was mixed with 400 μL of salicylic acid-sulphuric acid, and the reaction was incubated for 20 min at 25 °C. Next, 9.5 mL 8% (w/v) NaOH solution was added into the above mixture. The A410 value of each sample was then measured, and the content of nitrate was calculated according to the standard curve made by NO3. Nitrate reductase (NR) and glutamine synthases’ (GS) activity of plants were tested using a nitrate reductase and glutamate synthases kit (BC0080 and BC0910, Solarbio, Beijing, China) [38,39]. A total of 0.1 g of fresh maize seedlings were used to extract NR and GS, respectively. The process of NR and GS determination followed the operating instructions provided by the manufacturer.

2.8. Statistical Analysis

The data were analyzed by a one-way analysis of variance, which was followed by multiple comparisons with the least significant difference (LSD) test (p < 0.05) using SPSS software (version 17.0; SPSS Inc., Chicago, IL, USA).

3. Results

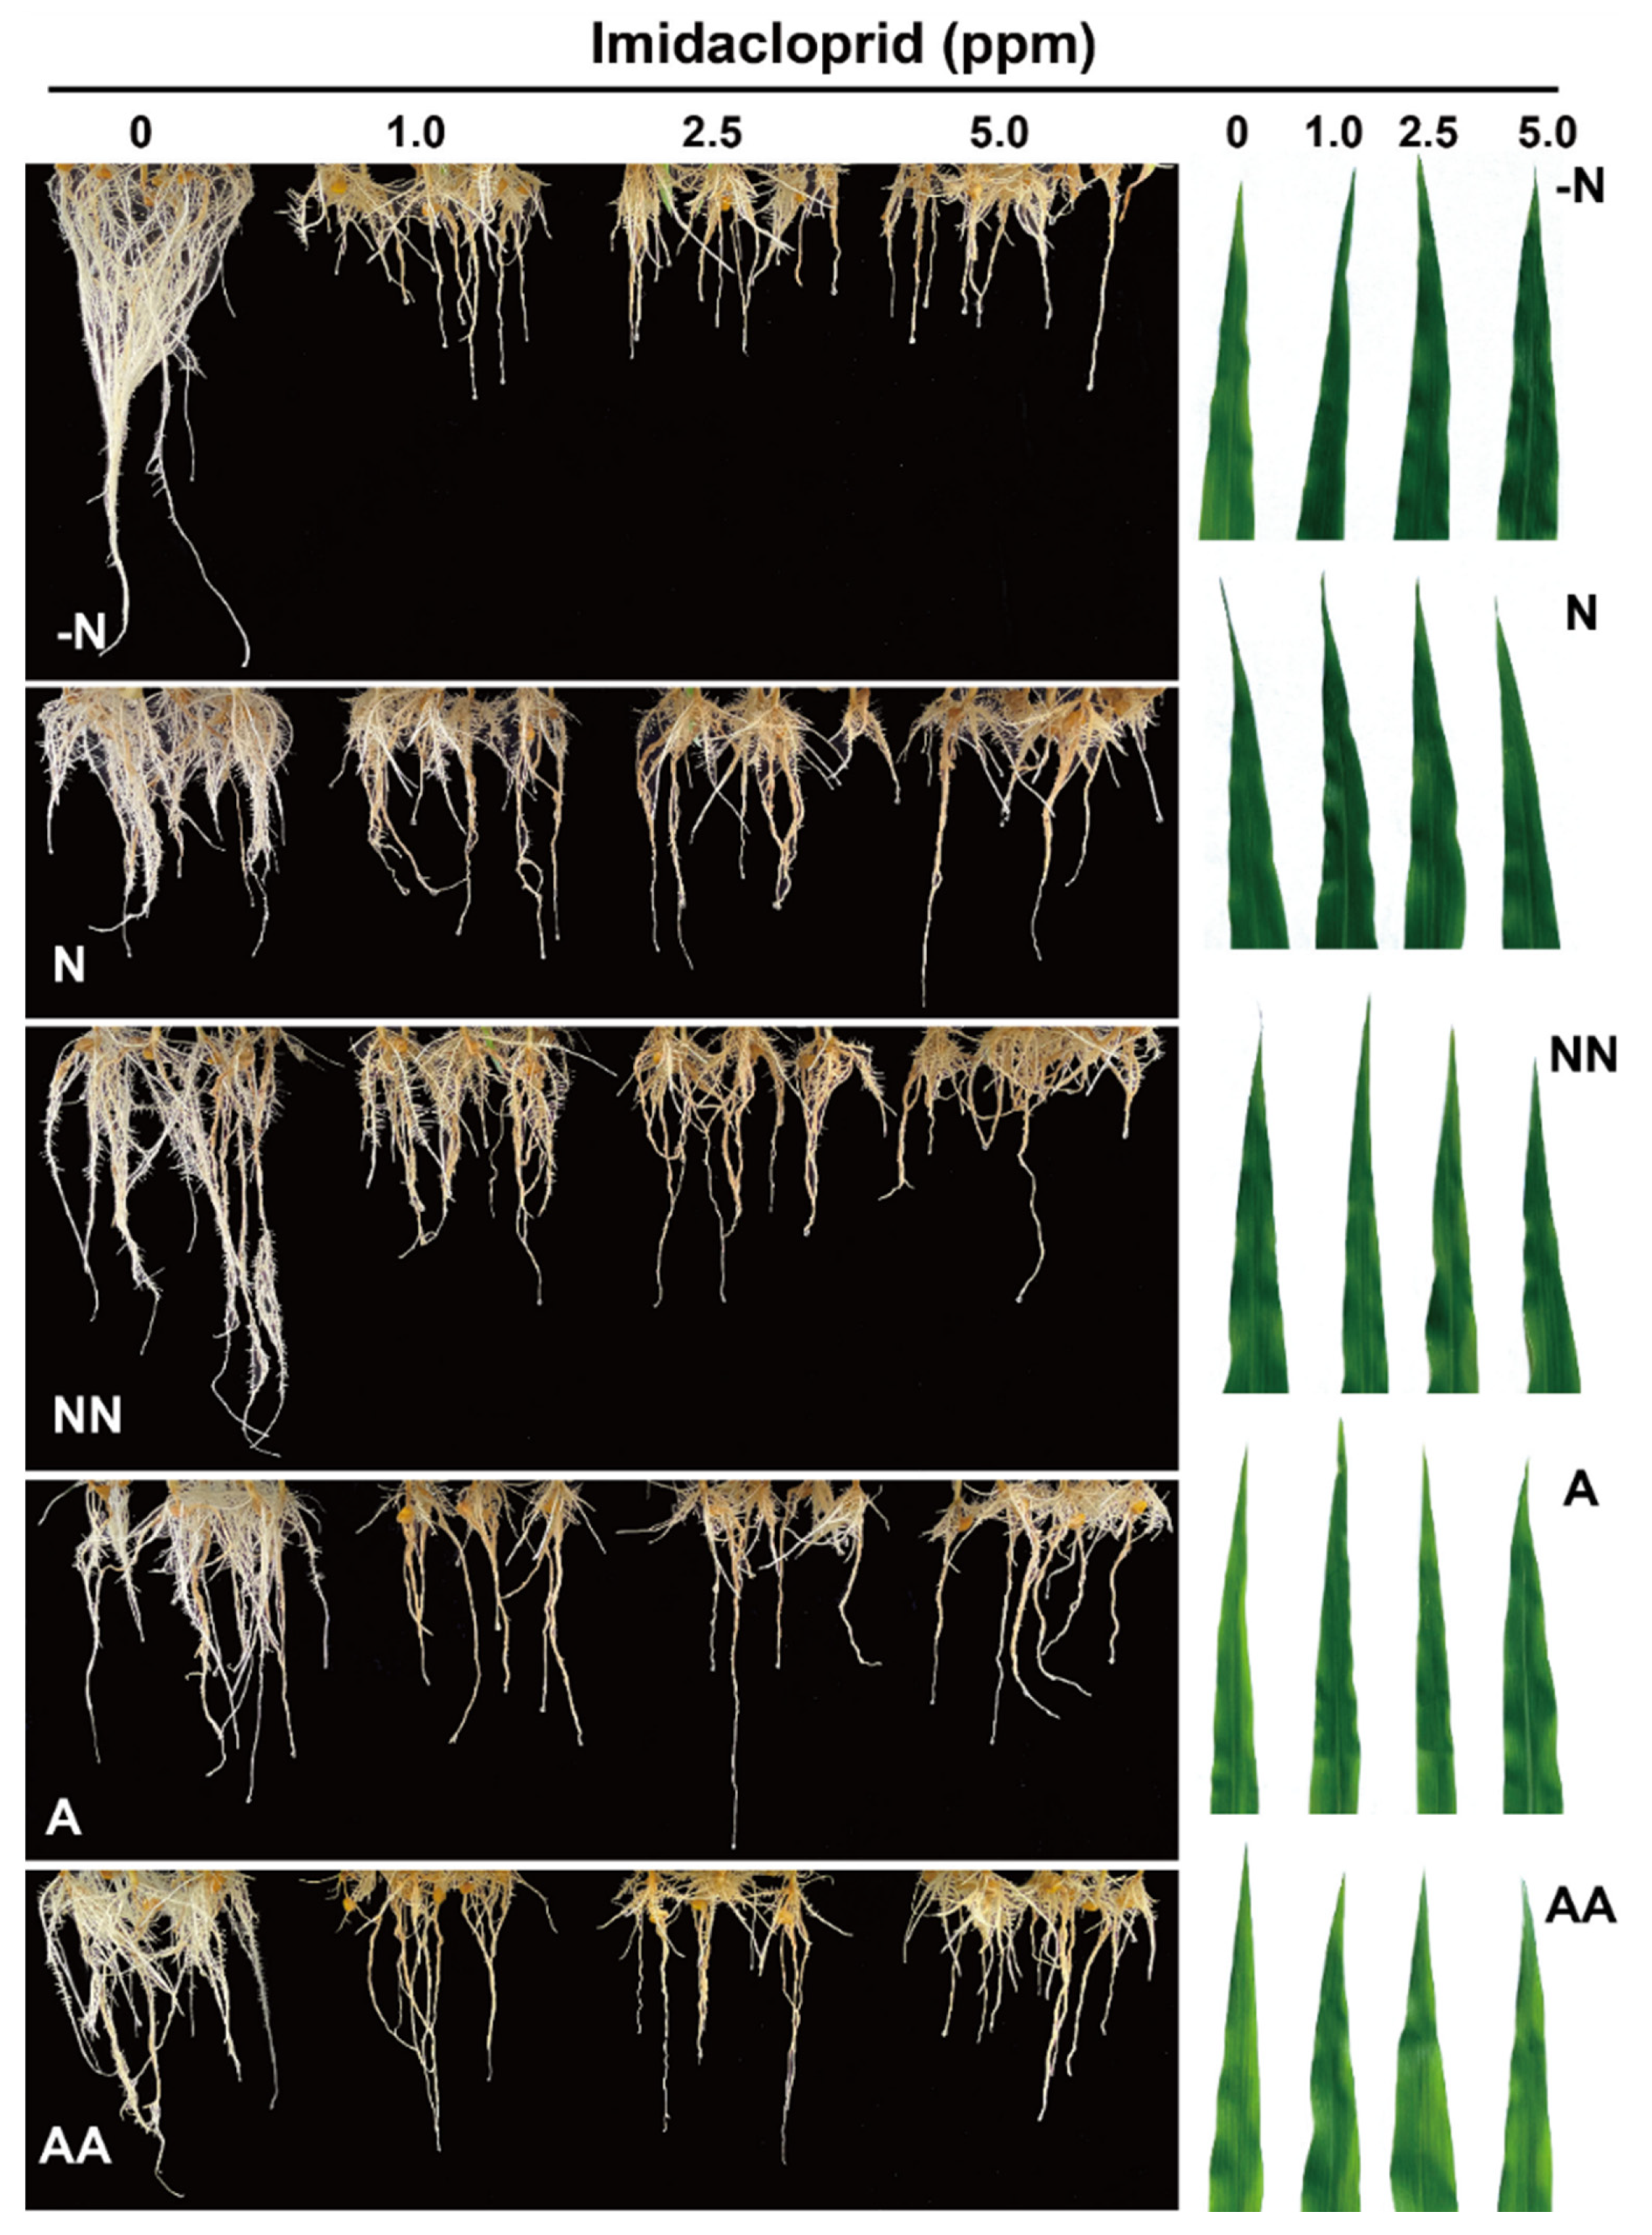
3.1. Phenotypic Analysis of Maize under Imidacloprid Treatment

Plants have different preferences for nitrogen types. The effects of different nitrogen types and IMI treatment on maize growth were observed in this study. As shown in Table 1, the weight and length data for the shoots and roots of the plants show that the growth of the plants in the N and NN groups was significantly better than the growth of those in the A and AA groups, in the absence of IMI treatment. The leaves’ SPAD values for the plants in the N and NN groups were significantly higher than that of those in the A, AA and −N groups (Figure 1 and Table 1). NO3 was more conducive to the growth of maize. Compared with the control groups, a significant decrease in the shoot dry weight (DW) and length was observed after IMI treatment in plants of the N, NN, A and AA groups, and this decrease was closely related to the addition of IMI (Table 1). A similar decrease was detected in the root weight and main root length (Table 2). Moreover, the roots became obviously brown after IMI treatment for 14 d, and the degree of browning positively correlated with the IMI concentration used on the plants (Figure 1). In addition, the value of the TBARS showed that IMI could cause membrane lipid peroxidation in maize roots, and the degree of the membrane lipid peroxidation increased as the IMI concentration was increased (Table 2). Unlike in the roots, the effect of IMI treatment on the membrane lipid peroxidation in the shoots was closely related to the status of the nitrogen supply. The TBARS value of the leaves significantly decreased in the plants of the −N group; however, it increased in the plants of the N, NN and A groups under 1, 2.5 and 5 ppm IMI treatment, compared with the respective control. The SPAD values of the maize leaves evidently increased in the −N group when the plants were exposed to 1, 2.5 and 5 ppm IMI treatment; however, no obvious change was observed in the other groups (Figure 1 and Table 1).

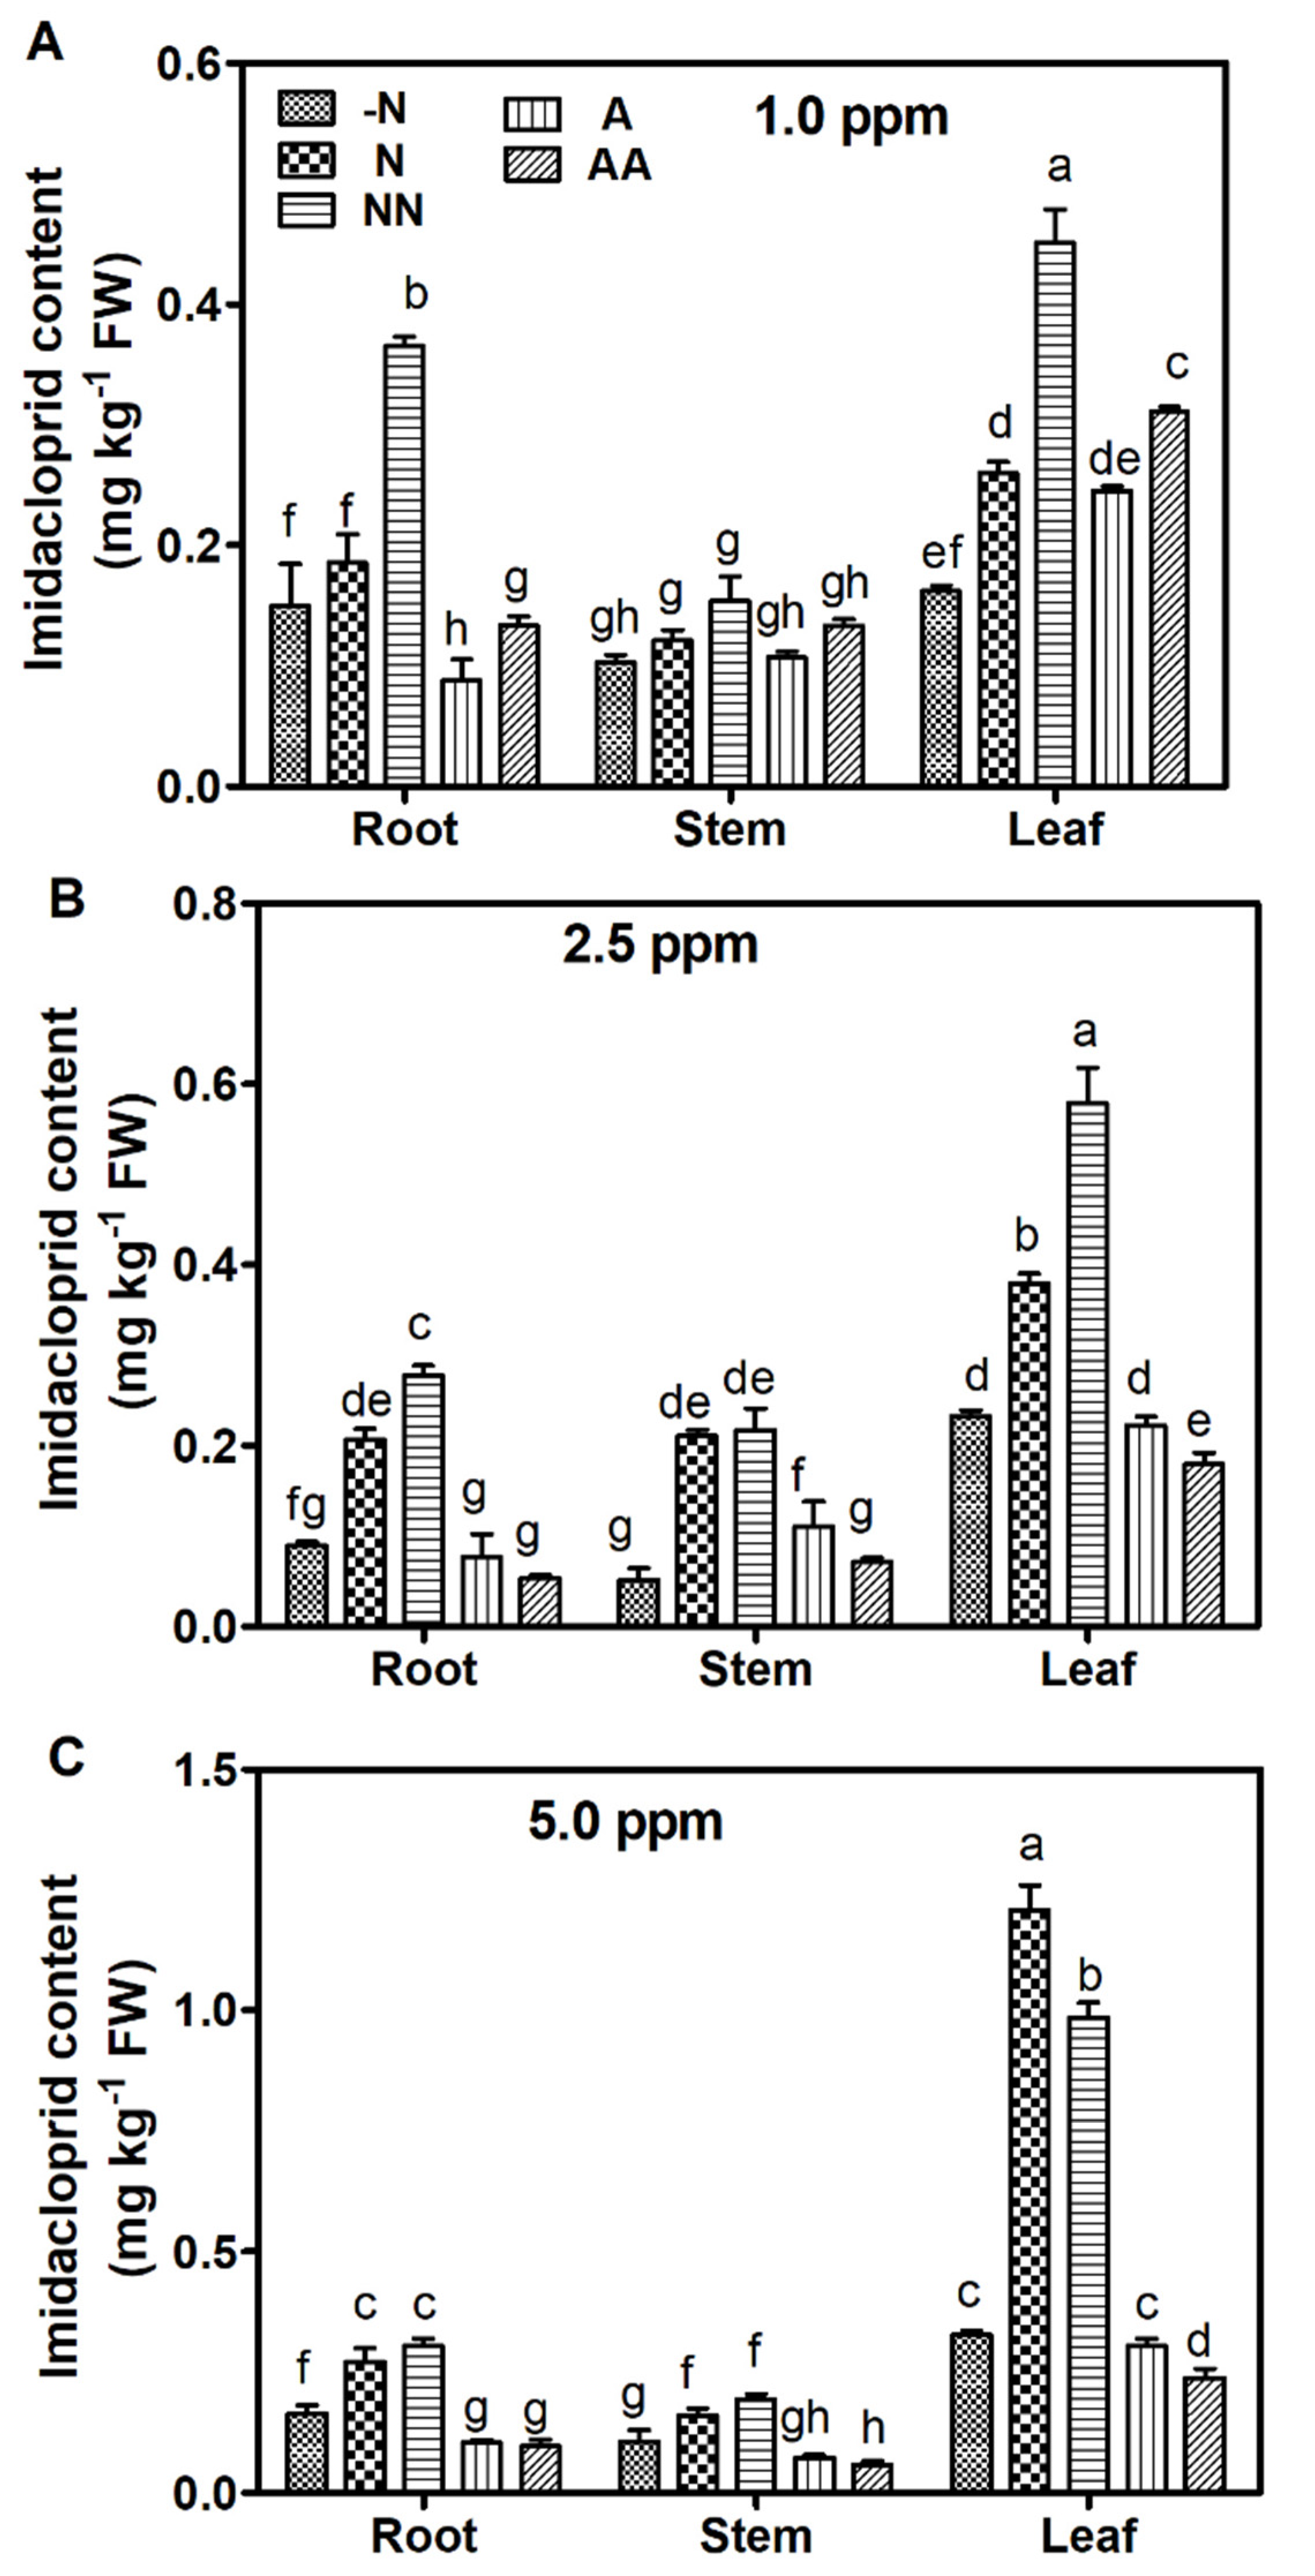
3.2. Uptake and Accumulation of Imidacloprid in Maize

In this study, the leaf was the main site of IMI accumulation, followed by the root. However, the stem had the lowest IMI accumulation (Figure 2). The nitrogen type affected the IMI content in the maize. The content of IMI in the plants of the N and NN groups was significantly higher than it was in those of the A, HA and −N groups, and this case was observed in all tissues under the 2.5 and 5 ppm IMI treatments. In particular, the IMI contents of the leaves in the plants of the N and NN groups were 1.20 and 0.98 mg−1 kg, under 5 ppm IMI treatment, but only 0.33, 0.31 and 0.24 mg−1 kg in the −N, A and HA groups, respectively (Figure 2C).

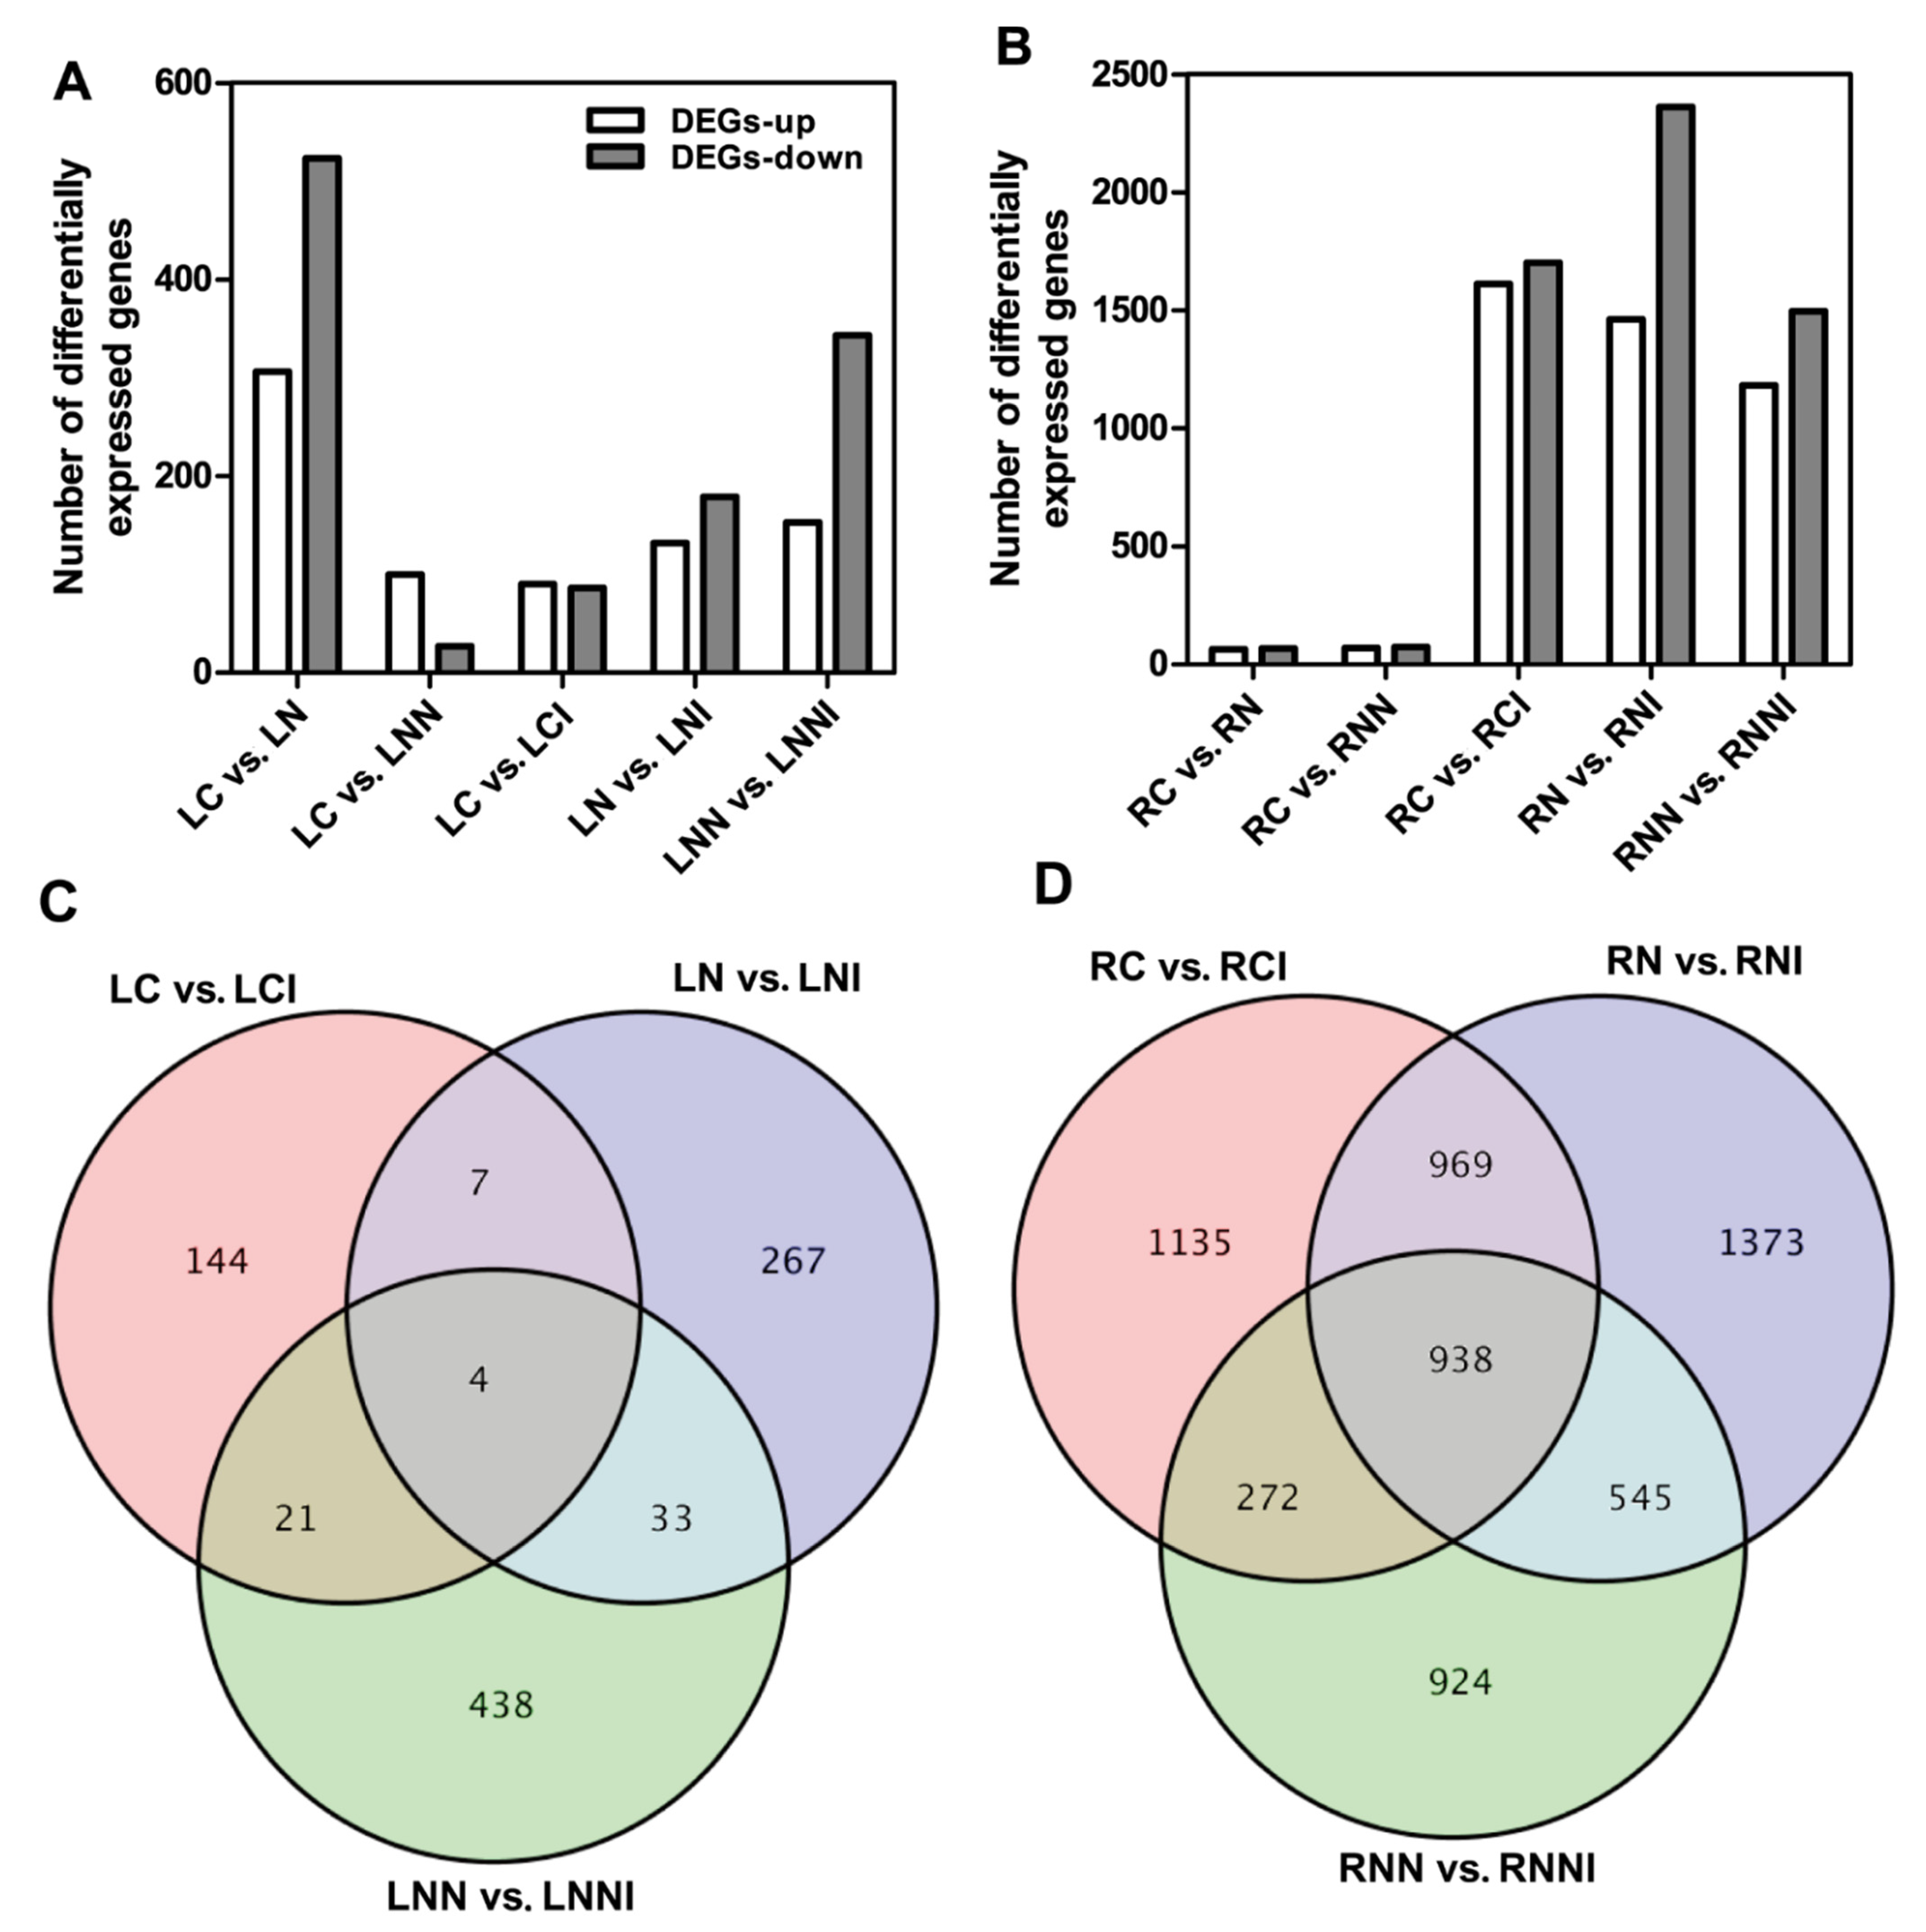
3.3. Identification of DEGs in Maize after Imidacloprid Treatment

The IMI was taken up rapidly by the plants’ roots during the first 24 h. After approximately 48 h, the IMI had reached a stable level in the plants’ leaves [40]. To identify the genes involved in IMI stress, the maize seedlings that were supplemented with 0, 4 or 10 mmol L−1 NO3 were treated with or without 5 ppm IMI for 48 h to obtain leaf samples, and for 24 h to obtain root samples. We set different evaluation criteria for the leaves (fold change > 2, and an adjusted p-value of <0.01) and roots (fold change > 3, and an adjusted p value of <0.01) to obtain accurate DEGs between the control and the IMI−treated samples. In the leaves, the number of DEGs in L−N group vs. L−N+IMI group (LN vs. LNI); LN group vs. LN+IMI group (LC vs. LCI); and LNN group vs. LNN+IMI group (LNN vs. LNNI) were 311, 176 and 496, re-spectively. In the roots, the number of DEGs in R−N group vs. R−N+IMI group (RN vs. RNI); RN group vs. RN+IMI group (RC vs. RCI); and RNN group vs. RNN+IMI group (RNN vs. RNNI) were 3825, 3314 and 2679, respectively (Figure 3). As a reference, we also counted the number of maize transcripts under different nitrogen levels. Compared to the gene expression in the plants that were supplied with 4 mmol L−1 NO3, the expressions of 829 genes in the leaves changed under nitrogen-deficient conditions, and the expressions of 127 genes in the leaves changed under 10 mmol L−1 NO3 conditions. In the roots, the number of DEGs were 132 and 142 under nitrogen-deficient conditions and under 10 mmol L−1 NO3 conditions, respectively (Figure 3). To verify the reliability of the RNA-Seq, we selected 12 genes for analysis by qRT-PCR. As shown in Figure 4, there was good correlation between the RNA-Seq and the qRT-PCR for each treatment group.

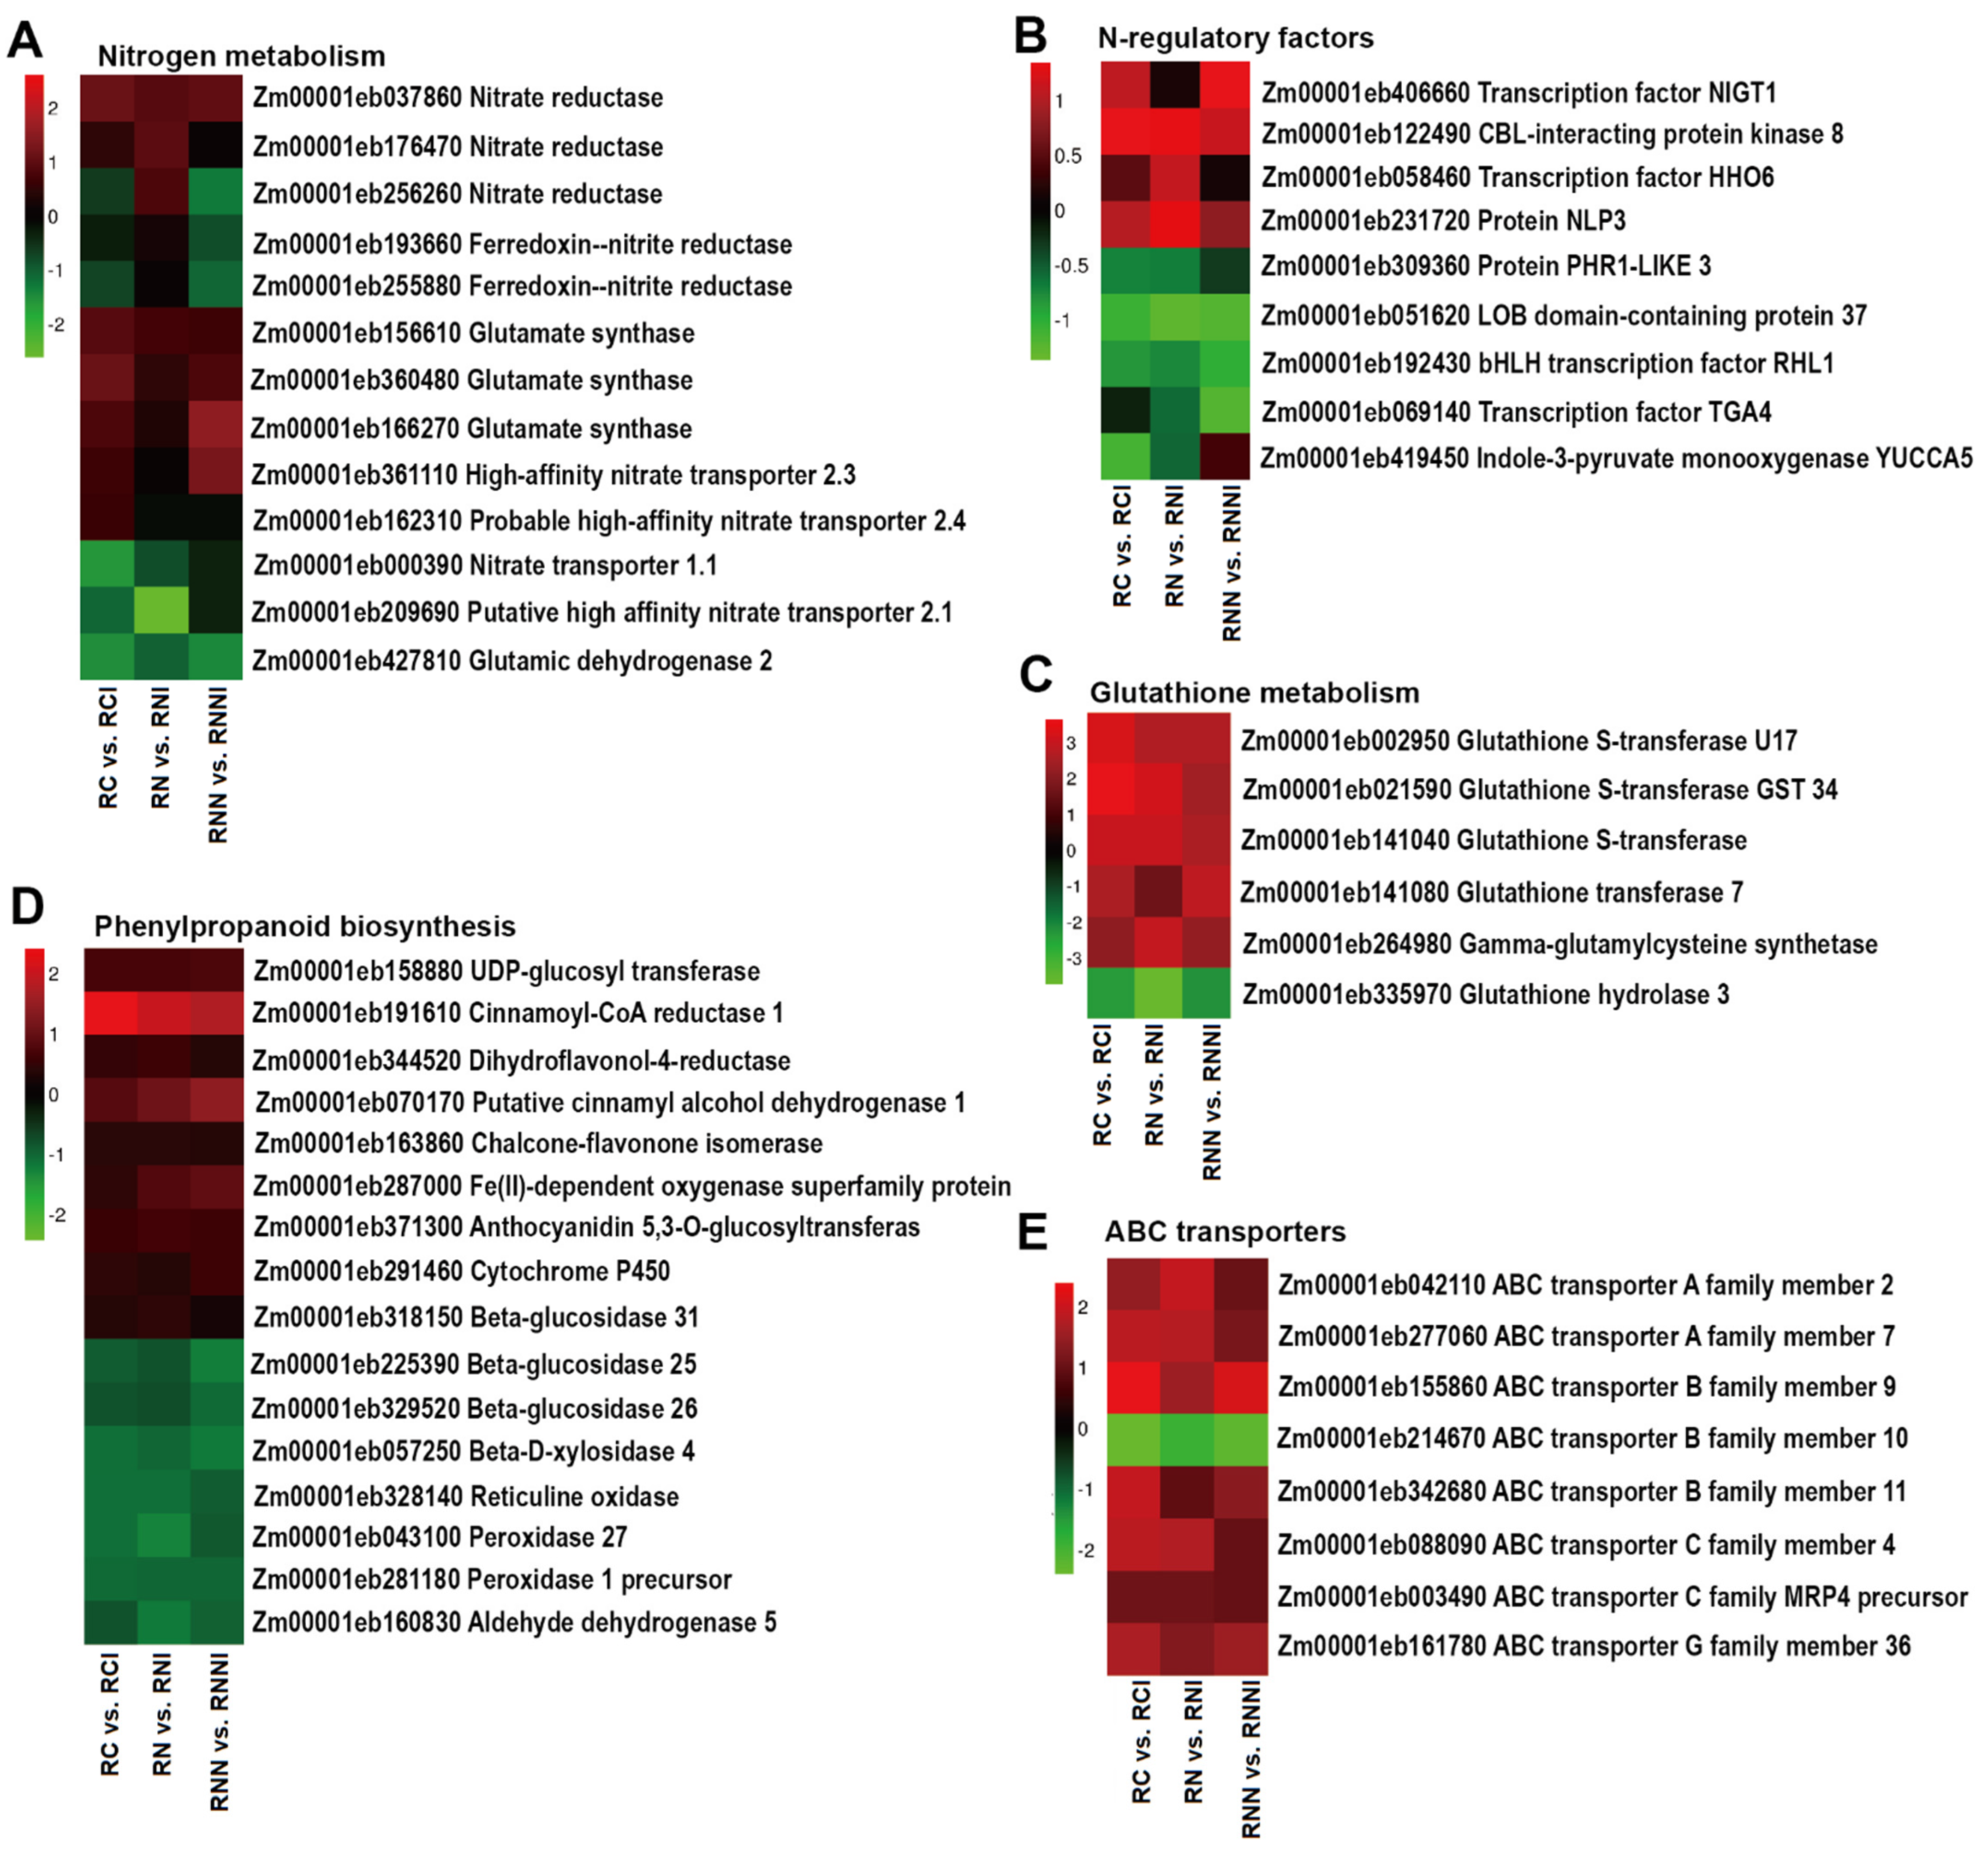
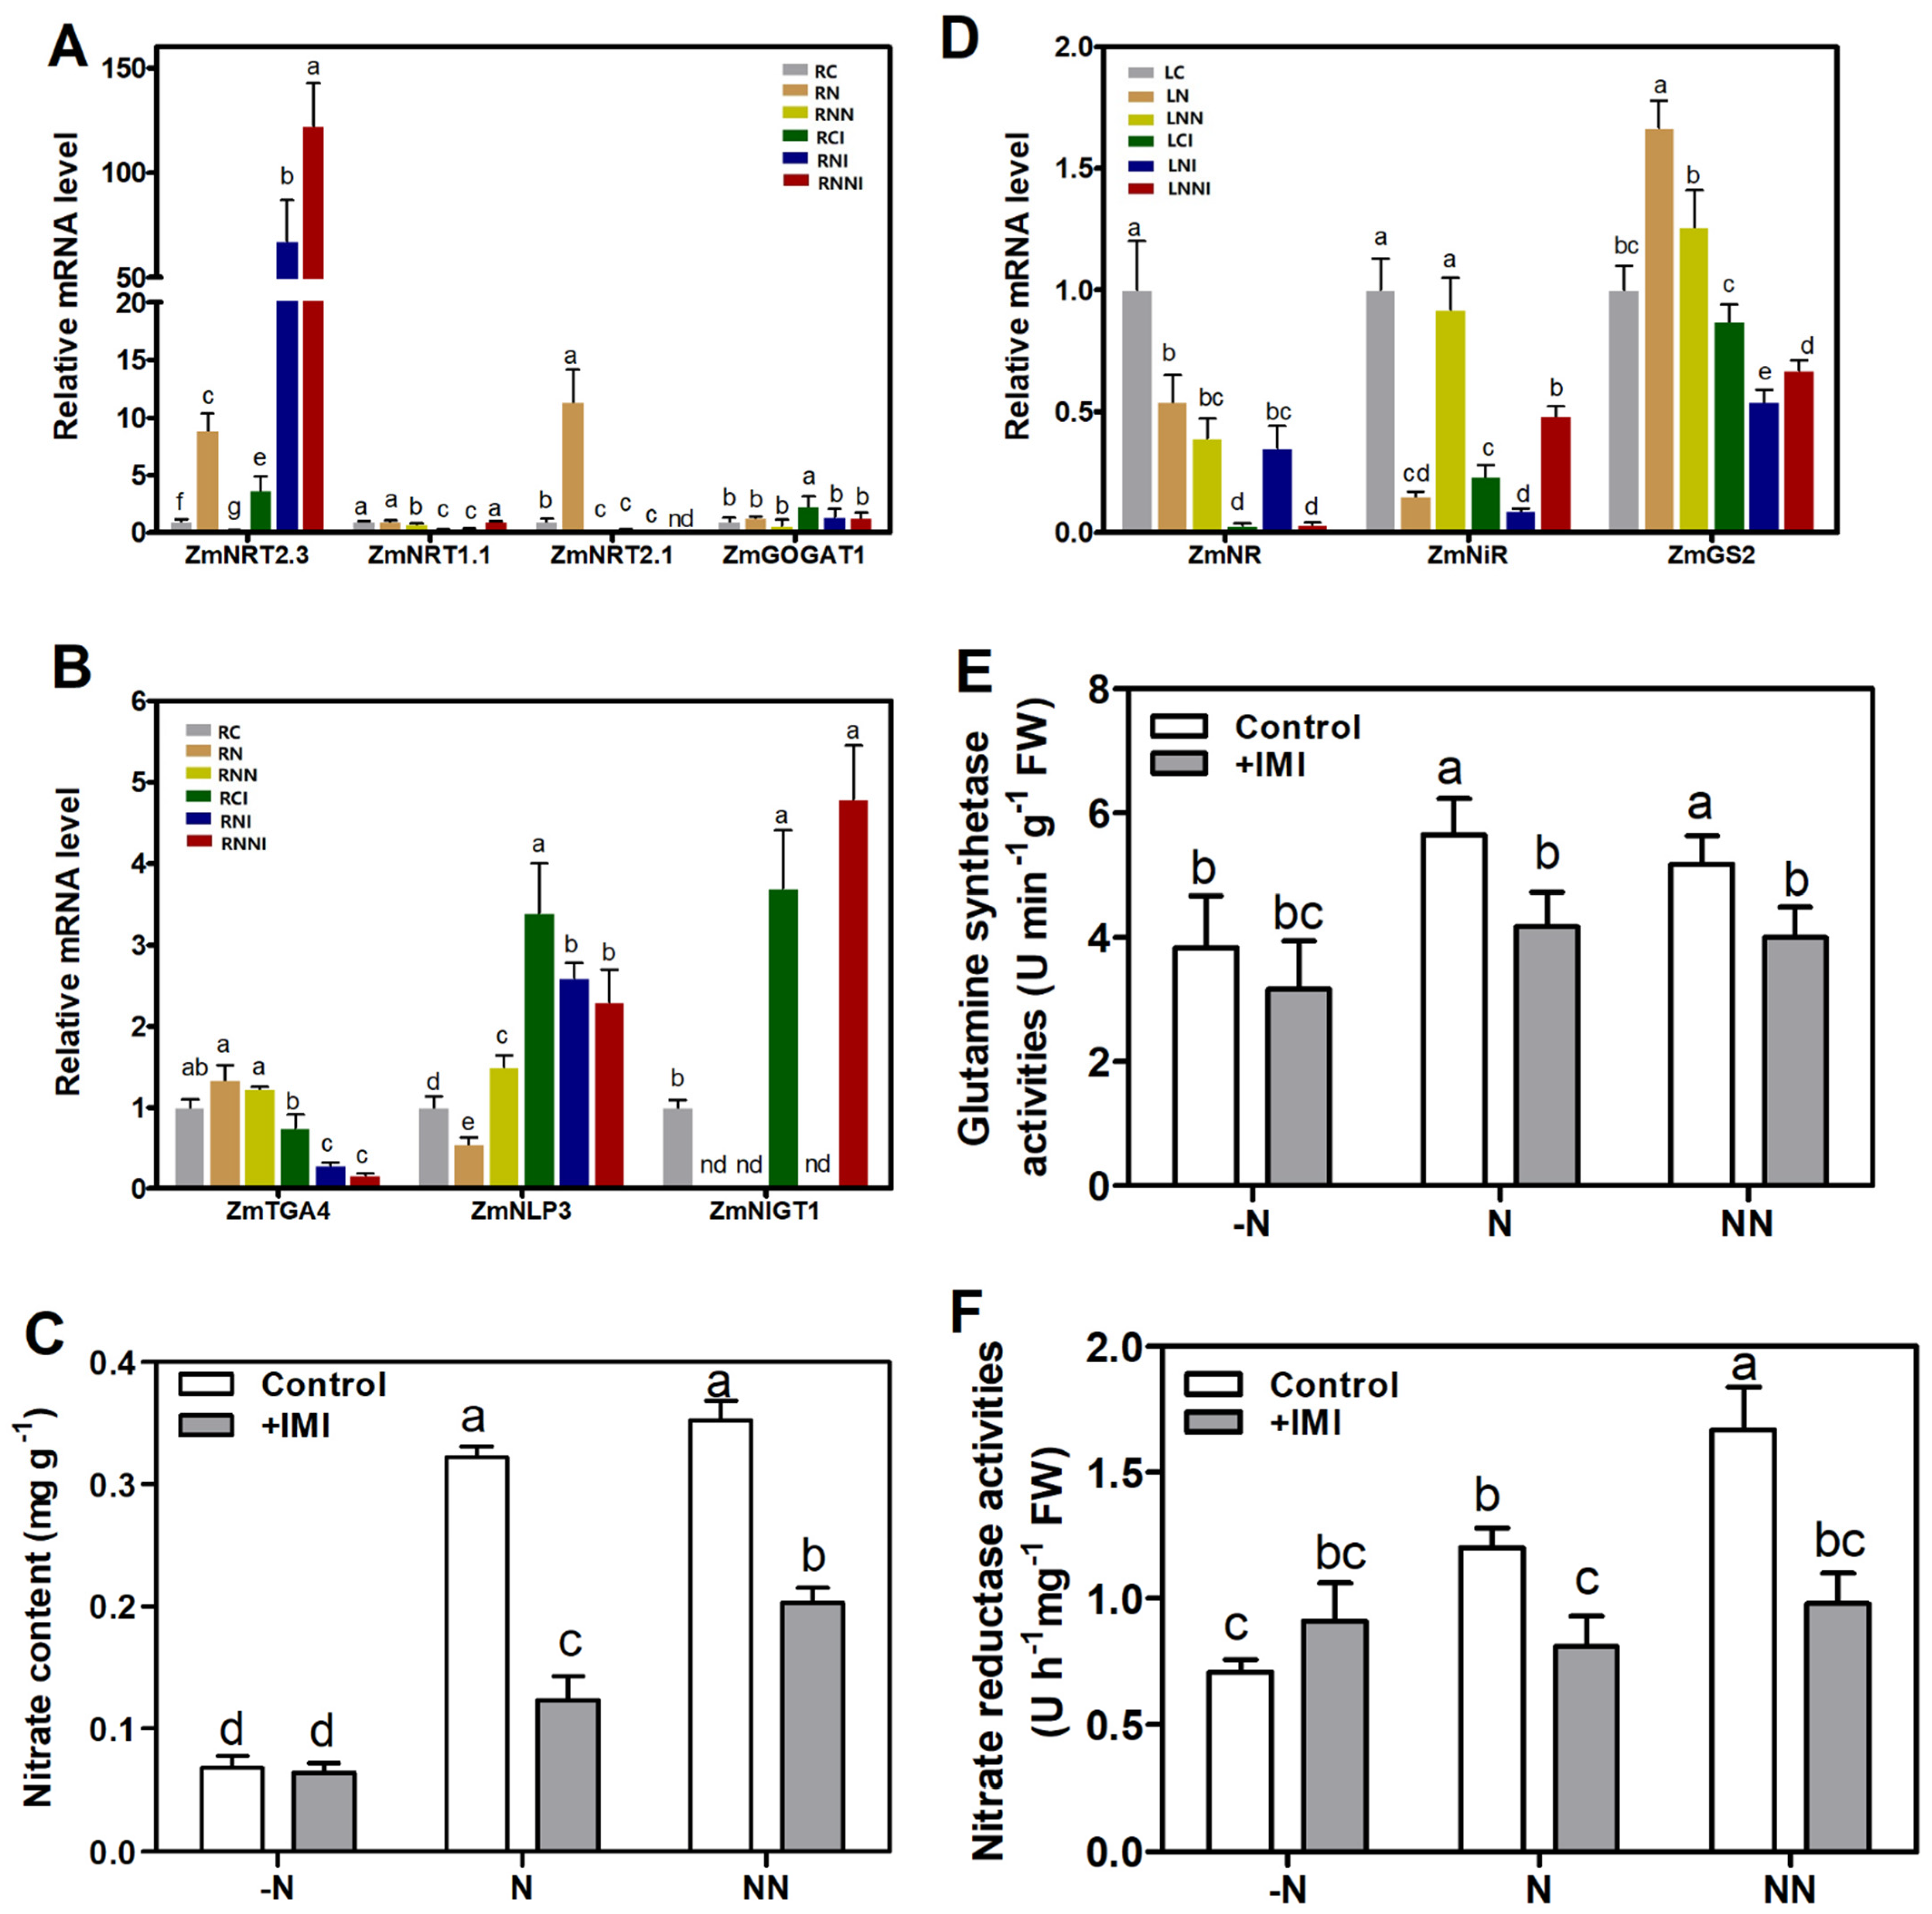
3.4. Imidacloprid Inhibited Nitrate Absorption in the Roots and Reduced Nitrogen Assimilation in the Shoots

Under IMI treatment, the plants exhibited various degrees of growth restriction under all the nitrogen conditions. Many primary nitrogen metabolism genes, including those for nitrate reduction and ammonia assimilation, were down-regulated in the LCI, LNI, and LNNI groups. In terms of the nitrate reduction genes, the expressions of three nitrate reductases and one nitrite reductase were down-regulated by 1.68, 1.16, 0.69 and 0.95 times in the LCI group, respectively, and down-regulated by 1.81, 1.94, 0.87 and 1.46 times in the LNNI group, respectively. Similarly, the expression of the nitrate reduction genes was significantly inhibited during nitrogen starvation (Figure 5 and Supplementary File S1). The IMI treatment and nitrogen deficiency produced a similar effect on the expressions of the nitrogen reduction genes in the leaves of the plants. For the ammonia assimilation genes, GS2 and GS5 were down-regulated under IMI treatment and reached a significant difference in the LNI and LNNI groups (Figure 5).
Roots are the major sites for substance and energy exchanges between plants and the environment. As a non-essential substance for plant growth and development, IMI led to marked changes in the expression of the genes involved in the nitrogen metabolism pathway in the plant roots. The high-affinity nitrate transporter gene, ZmNRT2.3, was notably upregulated in the RCI and RNNI group. ZmNRT2.4 was also upregulated after the IMI treatment, and it reached a significant difference in the RCI group. Another putative, high-affinity nitrate transporter 2.1 gene, ZmNRT2.1, was apparently down-regulated in the RCI and RNI groups, and no detectable change was found in the RNNI group (Figure 6A). Two of the three nitrate reductases were up-regulated significantly in the RCI and RNI group. The remaining nitrate reductase was down-regulated in the RCI and RNNI groups and up-regulated in the RNI group (Figure 6A). The IMI treatment led to a decrease in the expressions of two ferredoxin-nitrite reductase genes in the RNNI group; however, no change, or a less obvious increase, was found in the RNI and RCI groups. Three glutamate synthases were differentially expressed in the roots in response to the IMI treatment in all of the groups. Moreover, the transcription of four regulatory factors that are related to nitrogen metabolism in plants changed in the IMI-treated groups (Figure 6B).
Similar to RNA-sequencing data, the expression of the nitrate transporter ZmNRT2.3 was significantly induced; however, according to the qRT-PCR test involving the roots (Figure 7A), the expressions of ZmNRT2.1 and ZmNRT1.1 were repressed after IMI treatment. Moreover, the regulators of the nitrate-regulated genes, ZmNLP3 and ZmNIGT1, were significantly induced in the IMI-treated groups; however, the expression of ZmTGA4 was reduced after IMI treatment (Figure 7B). The results of the nitrate content analysis showed that IMI treatment significantly reduced the total nitrate content in the maize under NO3supplied conditions (Figure 7C). In shoots, the qRT-PCR analysis showed that IMI repressed the expressions of the genes related to nitrogen metabolism. Compared with their respective control groups, the expressions of NR and NiR displayed a significant decrease in the LCI and LNNI groups, but no obvious change was found in the LNI group. GS2 expression was similar in the LCI and LC groups, but it was significantly decreased in the LNI and LNNI groups, compared with their respective control treatments (Figure 7D). The analyses of the NR and GS activities showed that IMI reduced NR and GS activities in the LNI and LNNI groups (Figure 7E,F).

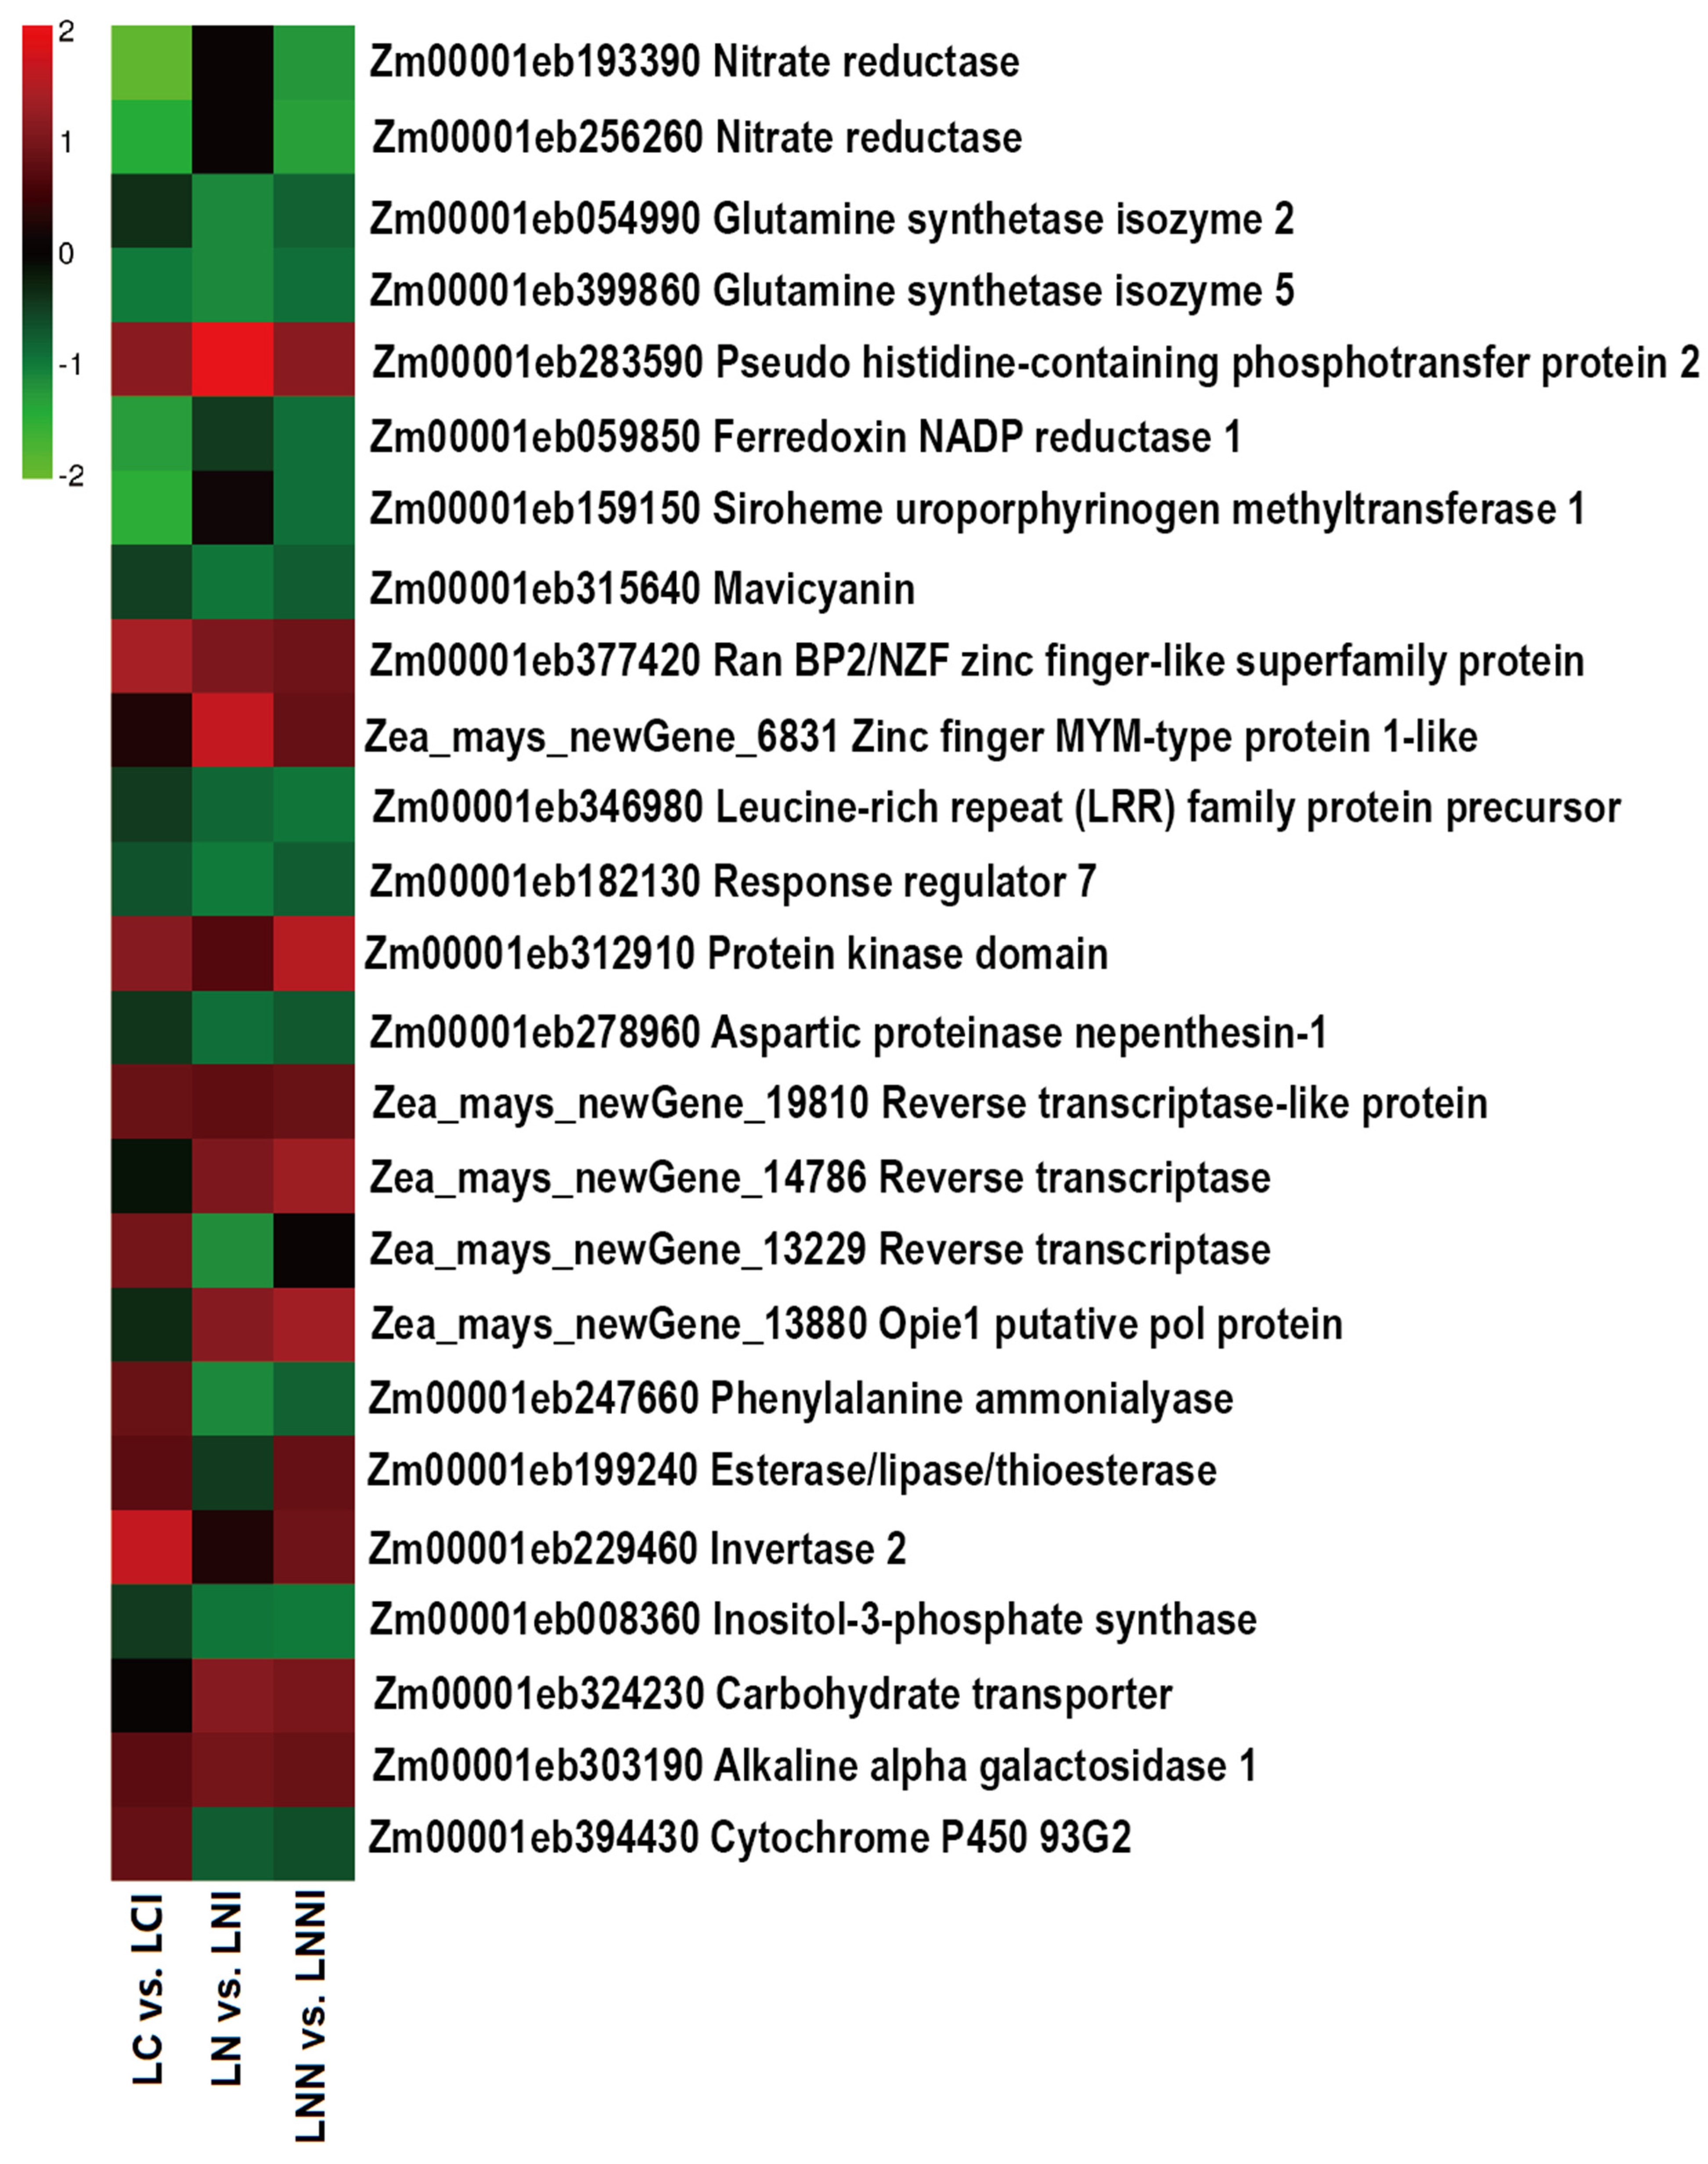
3.5. Imidacloprid Up-Regulated Stress-Related Gene Expression

In the glutathione metabolism pathway, the up-regulation of the five glutathione S-transferase (GST) genes was observed following the plants’ treatment with IMI, compared to the corresponding control groups. Moreover, the rate-limiting enzyme for GSH synthesis, γ-glutamylcysteine synthetase 1 (Zmγ-GCS1) was up-regulated in all IMI treatment groups (Figure 6C). Moreover, for ABC transporters, eight DEGs were observed in all of the IMI treatment groups. Of these genes, seven were significantly up-regulated. Among the up-regulated genes, ABCA2 and ABCA7 participated in lipid transport and metabolism, and the remaining genes—ABCB9, ABCB11, ABCC4, MRP4 and ABCG36—were involved in secondary metabolite biosynthesis, transport and catabolism. The expression of ABCB10, which showed activity in intracellular trafficking, secretion and vesicular transport, was down-regulated by IMI treatment. We determined that the genes involved in phenylpropanoid biosynthesis response to IMI treatment (Figure 6E). As shown in Figure 6D, the genes involved in flavonoid biosynthesis—such as chalcone-flavanone isomerase, 2-oxoglutarate (2OG) and Fe (II)-dependent oxygenase, anthocyanidin 5,3-O-glucosyltransferase and cytochrome P450—were up-regulated in all of the groups. Moreover, the qRT-PCR analysis showed that IMI treatment up-regulated the expressions of Zmγ-GCS1, ZmGST, ZmGST34, ZmGST7, ZmABCB9, ZmABCC3 and Zmpre-MRP4. The above results were consistent with the RNA-Seq data (Figure 8). IMI treatment also changed the expressions of the genes related to stress response and heterologous detoxification.

4. Discussion

4.1. The Effect of IMI Treatment on Maize Growth Varied with the Different Nitrogen Forms

Many studies have shown that IMI treatment has no effect or has a positive effect on plant growth [24,40]. However, in the present study, a high concentration of IMI in the environment was found to inhibit the growth of maize, according to the results of the growth parameters and of the membrane lipid peroxidation under varied nitrogen supply conditions (Figure 1A and Table 2). The possible reason for the different effects of IMI treatment on plant growth may be due to the treatment methods used and the capacity of plants to absorb IMI [41]. The data for the bioconcentration factors suggested that plants can utilize IMI better at lower doses when dispersed in aqueous solution. However, the damage caused by unabsorbed IMI or by the degradation products in the medium on plant roots cannot be ignored. Nitrate is the main N source of plants and is an important regulatory factor for crop growth and development. The transcriptome analysis conducted in this study proposed that the crosstalk and feedback between N and the hormonal signal affected the root development-related networks [42]. Furthermore, in the present study, IMI treatment repressed the expression of the nitrate transporter genes and reduced the nitrate content in the maize (Figure 7), which suggests that the reduced intake of nitrate caused by IMI may be an important reason for IMI’s inhibition of plant growth. In addition, the expression profiles of the genes related to auxin and gibberellin signaling and/or synthesis were significantly changed by the use of IMI treatment (Supplementary Figures S1 and S2). The change in plants’ hormones caused by IMI treatment may be one of the most important reasons for the inhibition of the IMI-treated maize’s growth.
The SPAD value of the leaves increased in all of the IMI treatment groups, and a significant increase was found under nitrogen-deficient conditions, which indicates that IMI alleviated the chlorosis phenotype in the N-deficiency plants. However, we did not find a significant alteration in the genes linked to porphyrin and chlorophyll metabolism after IMI treatment. The metabolites of IMI that were detected in the plants included 5-hydroxy-, olefine-, dihydroxy-, urea-, and 6-CNA-metabolite [41]. We speculated that the nitrogenous metabolites of the IMI would provide nitrogen to the plants to alleviate the chlorosis phenotype, and this influence was easier to observe when the plants were cultured under nitrogen-deficient conditions.

4.2. NO3 Promoted the Transport of IMI from Root to Shoot in Maize

The absorption of pesticides by plant roots is a complex process, and the physico-chemical properties of pesticides—such as molecular weight, water solubility, hydrophobicity and molecular structure—can affect the roots’ uptake and enrichment of pesticides [43,44]. In addition, the root protein content, the transpiration and the substance transport channels are likely to be related to the absorption and transport of IMI in plants [24,40,45,46]. This study was the first to report the promoting effect of NO3 on IMI accumulation in plants. The study by Naku et al. showed that the biomass and transpiration rate of Phaseolus vulgaris supplied with nitrate were higher than that of ammonium [47]. Metabolic and proteomic of maize responses to different nitrate/ammonium revealed that the abundance of aquaporin, root hydraulic conductivity and the growth and development of the roots were induced by NO3 accumulation [48,49]. In the present study, changes in the aquaporin genes were observed in the maize roots that were exposed to IMI (Supplementary File S1). We have speculated that the transpiration difference in the maize roots, which was caused by the differences in morphogenesis and water transport, may have contributed to the difference in IMI accumulation among the NO3 and NH4+ groups. This result can be used as a reference for selecting the appropriate nitrogen source for maize planting when using IMI for pest control.

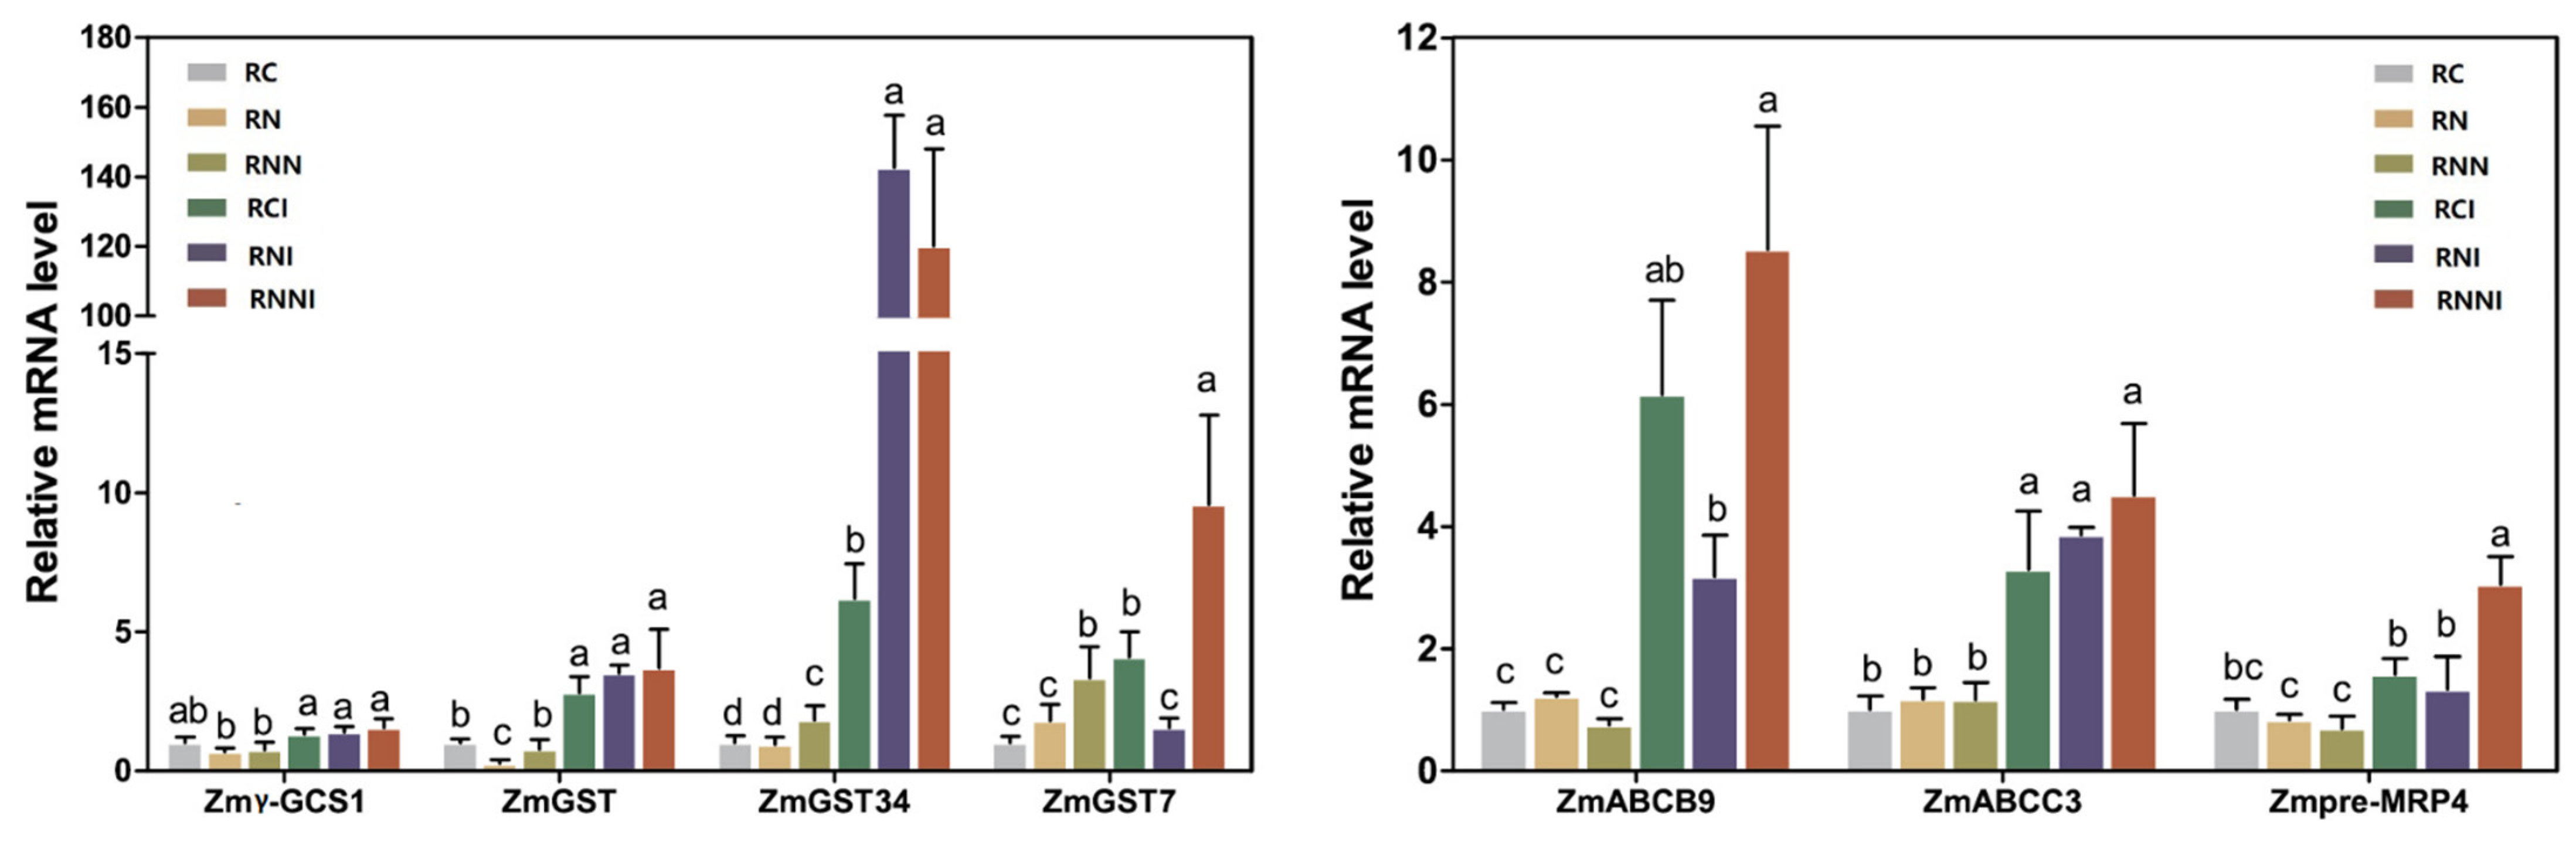
4.3. IMI Disturbed the Absorption and Assimilation of Nitrogen in Maize Roots

Two NRT1 transporters (NRT1.1 and NRT1.2) and five NRT2 transporters (NRT2.1, NRT2.2, NRT2.3, NRT2.4 and NRT2.5) are components of roots’ nitrate uptake. NRT1.1 is a dual-affinity nitrate transporter, and it is necessary for plants to sense nitrogen signaling [50]. Among NRT2 family proteins, NRT2.1 is the main contributor to total high-affinity transport system activity in plants [51]. The transcriptions of NRT1.1 and NRT2.1 are modulated by high external nitrate, light and sugar levels and are repressed by a high N status, including the high N level of a whole plant and/or high nitrate levels from external sources [52,53,54,55]. Several studies have revealed the role of transcription factors, TGA1 and TGA4, in regulating the expressions of NRT2.2 and NRT2.1 in Arabidopsis, and the role of GARP-type transcriptional repressor 1.2 (NIGT1.2) in regulating the expression of NRT1.1 in maize. Furthermore, studies have also revealed the role of ZmNLP3.1 in modulating the expressions of NRT2.1, NIA1 and NiR1 in Arabidopsis [56,57,58,59]. In addition, the analysis of influential transcription factors in nitrogen regulatory networks in previous studies has shown that TGA4 regulates 13% of the N-responsive genes in plant roots [60]. In our study, IMI treatment repressed the expression of the two main nitrate transporters (ZmNRT1.1 and ZmNRT2.1) in maize roots (Figure 6A and Figure 7A), and the nitrate content of the whole seedling was decreased in the IMI-treated plants (Figure 7C), which suggests that IMI disturbed the absorption of nitrate. The explanation of IMI’s down-regulation of ZmNRT1.1 and ZmNRT2.1 is two-fold. Firstly, IMI treatment disturbed the expression of transcription factors in the nitrogen signaling pathway. IMI up-regulated NIG1, which is a negative regulator of NRT1.1, and down-regulated TGA4, which is a positive regulator of NRT2.1 in maize (Figure 6B and Figure 7B). Secondly, the roots’ IMI uptake gave the whole plant an abnormal total N-level status, which exerted negative feedback on ZmNRT1.1 and ZmNRT2.1. A previous study on IMI’s degradation and distribution showed that many nitrogenous compounds are involved in IMI degradation, and that these compounds can be used by plants [61]. Moreover, according to the results of a metabolomics analysis in garlic plants [62], IMI treatment was found to increase their glutamate, aspartate and glutamine content. IMI is an unfavorable factor for plants’ nitrate absorption and nitrogen homeostasis.
Previous studies have found that the reduction in NO2, which is catalyzed by nitrate reductase (NR), is the first step of NO3 assimilation in plant cells. Next, nitrite reductase (NiR) catalyzes the reduction of the NO2 to NH4+. Furthermore, NH4+ is transformed to glutamine (Gln) under the action of glutamate synthase (GOGAT) and glutamine synthetase (GS). The expressions of NR, NiR, GS and GOGAT in wheat seedlings are repressed under nitrogen starvation conditions. NiR is induced by KNO3, and GS is induced by NH4+ [63]. Moreover, the transcription of NR is positively regulated by nitrate, light and cytokinin, and is negatively regulated by Gln, drought, low temperatures and abscisic acid (ABA) [64]. Other transcription factors, including LBD37/38/39, PHR1, HRS1, HHO1 and SPL9, may serve as negative feedback regulators of the nitrate-responsive genes [50]. In the present study, the addition of IMI induced the transcription of ZmNR and ZmGOGAT. The NR1 expression level in all of the IMI treatment groups was increased by approximately three times, and the GOGAT expression level increased by approximately two times in the roots (Figure 6A and Figure 7A). However, the expressions of ZmNR1 and ZmGS2 were repressed in the maize shoots (Figure 5 and Figure 7D). The different expression patterns of ZmNR1 in the roots and the leaves may have been due to the different expression levels of the negative regulators in the nitrate signaling pathway. LBD 37 and PHR1′s expressions were down-regulated in the roots; however, no change was found in the shoots when the plants were exposed to 5 ppm IMI treatment. Another explanation for this is that IMI prevented the transport of NO3 from the plant’s roots to their shoots, which led to NO3 retention in the roots. This abnormal distribution of NO3 induced the differential expression of the ZmNR1 gene in the maize plants’ roots and shoots.

4.4. IMI Triggered Changes in the Expression of Stress Response Genes in Maize

Glutathione (GSH) metabolism is essential for plants in maintaining their cellular redox homeostasis, especially under stress. As an antioxidant, GSH participates in the reduction in the H2O2, which is regenerated in the AsA–GSH cycle to protect the chloroplasts and/or other organelles from the oxidative damage that is induced by abiotic and biotic stresses [64]. The detoxification of GSH for toxic substances is realized through GSTs. GSTs protect plants’ cells from an oxidative burst by catalyzing the conjugation of GSH with xenobiotic and toxic endogenous compounds [65]. The role of GST genes in the detoxification of IMI is that GST metabolizes the secondary products, which are generated by the phase I detoxification enzymes (cytochrome P450) to improve the IMI resistance of Nilaparvata lugens [66]. In a study on cucumber plants, GST was involved in the detoxification of IMI, and melatonin was found to accelerate the degradation of IMI by improving GST activity and the transcription level of GST1, 2 and 3 [67]. Similar to the above results, the present study found that the expressions of six GST genes were obviously induced in the maize roots of all of the groups exposed to IMI. In addition, the rate-limiting enzyme of GSH synthesis, γ-GCS, was also significantly induced after IMI treatment (Figure 6C and Figure 7). These results indicate that GSTs are candidates for IMI detoxification in maize. Another study has suggested that several members of the ABCC/MRP family are involved in the transport of toxic substances out of the cytosol. AtMRP1, a glutathione S-conjugate pump, plays a role in the transport of 2,4-dinitrophenyl-GS, metolachlor-GS and anthocyanins-GS complex to the vesicles of yeast [68]. A study on herbicide detoxification also proposed that the efficient vacuolar transport capacity of barley mesophyll cells for metolachlor-GS was due to the high expression of the transporters in the vacuolar membrane [69]. In our study, the expressions of ZmABCC4 and ZmMPR4 precursors also increased under IMI treatment (Figure 6E and Figure 7F), thereby suggesting that ZmABCC4 may be involved in IMI detoxification in maize roots. The function of ABCC4 in methyl parathion detoxification was also reported in a study on zebrafish liver cells [70]. According to the above results, we speculated that the detoxification mechanism of IMI in maize is related to GSH metabolism and includes two aspects as follows: Firstly, the increase in GSH synthesis can reduce the oxidative damage caused by IMI, and it can also improve the conjugation of GSH to IMI or IMI degradation that is catalyzed by GSTs. Secondly, increasing the transcription of ZmABCC4 enhances the rate of transport for the GS-conjugate out of the cytoplasm. However, these inferences need to be confirmed by further experiments.
As a central step in the secondary metabolism of plants, the phenylpropanoid pathway produces a large group of secondary metabolites, which are involved in plants’ resistance to diseases and environmental stresses [71]. Flavonoids (including anthocyanins) and lignin protect plants against abiotic stresses, such as drought, low temperature, high salinity, metal toxicity and pest and pathogen attacks [72,73,74]. Studies on the mechanism of flavonoids’ enhancement of plants’ stress resistance have shown that flavonoids improve the ability of scavenging reactive oxygen species (ROS) to protect plants from oxidative damage [75,76]. The present study has shown four genes that are related to flavonoid synthesis, and two genes (cinnamoyl-CoA reductase 1 and putative cinnamyl alcohol dehydrogenase 1) that have been implicated in the synthesis of lignin in maize roots, which exhibited appreciable up-regulation after IMI treatment under all nitrogen supply conditions (Figure 6D). We have speculated that flavonoids and lignin may play a role in maize’s resistance to the adverse factors induced by IMI; however, further research is needed to prove this. In higher plants, peroxidase proteins have numerous and diverse functions. The Class III peroxidases of plants’ phenylpropanoid pathways take electrons to various acceptor molecules, such as phenolic compounds, lignin precursors, flavonoids, auxin or secondary metabolites, by catalyzing the reduction in H2O2 [77]. These molecules are involved in a broad range of physiological processes, such as cell wall metabolism, auxin catabolism and cell growth [78,79]. At least 40 Class III peroxidase genes in maize roots were notably inhibited by IMI under both nitrogen deficient and normal NO3 supply conditions and only one or three were induced (Supplementary File S1). This suggests that IMI inhibited the expressions of peroxidase genes and the related metabolic processes. However, only nine peroxidase genes were down-regulated, and eight were down-regulated by IMI under 10 mmol L−1 NO3 supply conditions. These results suggest that the degree of the changes in the peroxidase genes under IMI exposure was related to the level of the nitrogen supply. It is possible that the synthesis of the secondary metabolites was closely related to the plants’ nitrogen pool, and the seedlings that were supplied with 10 mmol L−1 NO3 had higher nitrogen reserves, which helped them to cope with the IMI-triggered disorder in their nitrogen absorption and metabolism.

5. Conclusions

This study investigated the effect of nitrogen forms on the IMI absorption and distribution in maize and analyzed the response of maize to IMI treatment. NO3 was beneficial for the transportation of IMI from the plants’ roots to their leaves. IMI was found to cause serious toxicity in maize seedlings under nitrogen-sufficient conditions; it induced oxidative stress and disturbed the nitrate absorption and nitrogen metabolism of the maize. Furthermore, it was found that ZmGSTs, ZmABCC4, anthocyanin and lignin may play an important role in the detoxification of IMI in maize. This study has provided a perspective that can help us to understand IMI’s toxicity to plants and has offered a reference for the possible candidate genes, which could be used in cultivating anti-IMI crop varieties.

Supplementary Materials

The following supporting information can be downloaded at: https://www.mdpi.com/article/10.3390/agronomy12123161/s1, Figure S1. Expression profiling of genes related to MAPK signaling pathway. Figure S2. Expression profiling of genes related to hormone signal transduction. Table S1. Primers used in this study. File S1. The expression and annotation of all DEGs in shoots.

Author Contributions

Investigation, X.Z., L.C. and H.F.; Data curation, X.Z. and S.G.; Writing—review and editing, Y.L. and S.G.; Writing—original draft, X.Z. and Q.W.; funding acquisition, X.Z., Y.L. and S.G. All authors have read and agreed to the published version of the manuscript.

Funding

This research was funded by GDAS’ Project of Science and Technology Development (2020GDASYL-20200103059, 2022GDASZH-2022010202), National Natural Science Foundation of China (32001477) and the Zhejiang students‘ technology and innovation program (XinMiao program grant no. 2022R412B042).

Data Availability Statement

Not applicable.

Acknowledgments

The authors are grateful to Qin He for her technical guidance in high-performance liquid chromatography.

Conflicts of Interest

The authors declare no conflict of interest.

References

  1. Schaafsma, A.; Limay-Rios, V.; Xue, Y.; Smith, J.; Baute, T. Field-scale examination of neonicotinoid insecticide persistence in soil as a result of seed treatment use in commercial maize (corn) fields in southwestern Ontario. Environ. Toxicol. Chem. 2016, 35, 295–302. [Google Scholar] [CrossRef] [PubMed]
  2. Lanka, S.K.; Senthil-Nathan, S.; Blouin, D.J.; Stout, M.J. Impact of Thiamethoxam seed treatment on growth and yield of rice, Oryza sativa. J. Econ. Entomol. 2017, 110, 479–486. [Google Scholar] [CrossRef] [PubMed]
  3. Ramasubramanian, T.; Paramasivam, M. Dissipation Kinetics and environmental risk assessment of thiamethoxam in the sandy clay loam soil of tropical sugarcane crop ecosystem. Bull. Environ. Contam. Toxicol. 2020, 105, 474–480. [Google Scholar] [CrossRef]
  4. Matsuda, K.; Ihara, M.; Sattelle, D.B. Neonicotinoid Insecticides: Molecular Targets, Resistance, and Toxicity. Annu. Rev. Pharmacol. Toxicol. 2020, 60, 241–255. [Google Scholar] [CrossRef] [PubMed]
  5. Bass, C.; Field, L.M. Neonicotinoids. Curr. Biol. 2018, 28, R772–R773. [Google Scholar] [CrossRef] [Green Version]
  6. Chen, Y.; Nie, E.; Huang, L.; Lu, Y.; Gao, X.; Akhtar, K.; Ye, Q.; Wang, H. Translocation and metabolism of imidacloprid in cabbage: Application of (14)C-labelling and LC-QTOF-MS. Chemosphere 2021, 263, 127928. [Google Scholar] [CrossRef] [PubMed]
  7. Anderson, J.C.; Dubetz, C.; Palace, V.P. Neonicotinoids in the Canadian aquatic environment: A literature review on current use products with a focus on fate, exposure, and biological effects. Sci. Total. Environ. 2015, 505, 409–422. [Google Scholar] [CrossRef]
  8. Bass, C.; Denholm, I.; Williamson, M.S.; Nauen, R. The global status of insect resistance to neonicotinoid insecticides. Pestic. Biochem. Physiol. 2015, 121, 78–87. [Google Scholar] [CrossRef] [Green Version]
  9. Easton, A.H.; Goulson, D. The neonicotinoid insecticide imidacloprid repels pollinating flies and beetles at field-realistic concentrations. PLoS ONE 2013, 8, e54819. [Google Scholar] [CrossRef] [Green Version]
  10. Leiva, J.A.; Nkedi-Kizza, P.; Borejsza-Wysocki, W.S.; Bauder, V.S.; Morgan, K.T. Imidacloprid extraction from citrus leaves and analysis by Liquid Chromatography-Mass Spectrometry (HPLC-MS/MS). Bull. Environ. Contam. Tox. 2016, 96, 671–677. [Google Scholar] [CrossRef]
  11. Han, W.; Tian, Y.; Shen, X. Human exposure to neonicotinoid insecticides and the evaluation of their potential toxicity: An overview. Chemosphere 2018, 192, 59–65. [Google Scholar] [CrossRef] [PubMed]
  12. Zhang, P.; Ren, C.; Sun, H.; Min, L. Sorption, desorption and degradation of neonicotinoids in four agricultural soils and their effects on soil microorganisms. Sci. Total. Environ. 2018, 615, 59–69. [Google Scholar] [CrossRef] [PubMed]
  13. Giorio, C.; Safer, A.; Sánchez-Bayo, F.; Tapparo, A.; Lentola, A.; Girolami, V.; van Lexmond, M.B.; Bonmatin, J.M. An update of the worldwide integrated assessment (WIA) on systemic insecticides. Part 1: New molecules, metabolism, fate, and transport. Environ. Sci. Pollut. Res. 2021, 28, 11716–11748. [Google Scholar] [CrossRef] [PubMed] [Green Version]
  14. Menon, M.; Mohanraj, R.; Sujata, W. Monitoring of neonicotinoid pesticides in water-soil systems along the agro-landscapes of the cauvery delta region, south India. Bull. Environ. Contam. Tox. 2021, 106, 1065–1070. [Google Scholar] [CrossRef]
  15. Tong, Z.; Duan, J.; Wu, Y.; Liu, Q.; He, Q.; Shi, Y. A survey of multiple pesticide residues in pollen and beebread collected in China. Sci. Total. Environ. 2018, 640–641, 1578–1586. [Google Scholar] [CrossRef]
  16. Mikolić, A.; Karačonji, I.B. Imidacloprid as reproductive toxicant and endocrine disruptor: Investigations in laboratory animals. Arh. Hig. Rada Toksikol. 2018, 69, 103–108. [Google Scholar] [CrossRef] [Green Version]
  17. Zhao, G.P.; Wang, X.Y.; Li, J.W.; Wang, R.; Ren, F.Z.; Pang, G.F.; Li, Y.X. Imidacloprid increases intestinal permeability by disrupting tight junctions. Ecotoxicol. Environ. Saf. 2021, 222, 112476. [Google Scholar] [CrossRef]
  18. Katić, A.; Kašuba, V.; Kopjar, N.; Lovaković, B.T.; Čermak, A.M.M.; Mendaš, G.; Micek, V.; Milić, M.; Pavičić, I.; Pizent, A.; et al. Effects of low-level imidacloprid oral exposure on cholinesterase activity, oxidative stress responses, and primary DNA damage in the blood and brain of male Wistar rats. Chem. Biol. Interact. 2021, 338, 109287. [Google Scholar] [CrossRef]
  19. Loser, D.; Grillberger, K.; Hinojosa, M.G.; Blum, J.; Haufe, Y.; Danker, T.; Johansson, Y.; Möller, C.; Nicke, A.; Bennekou, S.H.; et al. Acute effects of the imidacloprid metabolite desnitro-imidacloprid on human nACh receptors relevant for neuronal signaling. Arch. Toxicol. 2021, 95, 3695–3716. [Google Scholar] [CrossRef]
  20. Abdel-Halim, K.Y.; Osman, S.R. Cytotoxicity and oxidative stress responses of imidacloprid and glyphosate in human prostate epithelial WPM-Y.1 cell line. J. Toxicol. 2020, 2020, 4364650. [Google Scholar] [CrossRef]
  21. USEPA. OPP Pesticide toxicity database. 2014. Available online: http://www.epa.gov/oppefed1/ecorisk_ders/aquatic_life_benchmark.htm (accessed on 25 January 2017).
  22. CCME. Canadian water quality guidelines for the protection of aquatic life: Imidacloprid. In Scientific Supporting Document; Canadian Council of Ministers of the Environment: Winnipeg, MS, Canada, 2007. [Google Scholar]
  23. RIVM. Water Quality Standards for Imidacloprid: Proposal for an Update according to the Water Framework Directive; Dutch National Institute for Public Health and the Environment: Bilthoven, The Netherlands, 2014.
  24. Li, Y.; Long, L.; Ge, J.; Li, H.; Zhang, M.; Wan, Q.; Yu, X. Effect of imidacloprid uptake from contaminated soils on vegetable growth. J. Agr. Food Chem. 2019, 67, 7232–7242. [Google Scholar] [CrossRef] [PubMed]
  25. Tai, H.; Zhang, F.; Xiao, C.; Tang, R.; Liu, Z.; Bai, S.; Wang, Z. Toxicity of chemical pesticides commonly used in maize to Trichogramma ostriniae (Hymenoptera: Trichogrammatidae), an egg parasitoid of Asian corn borer. Ecotoxicol. Environ. Saf. 2022, 241, 113802. [Google Scholar] [CrossRef] [PubMed]
  26. Ding, J.; Li, H.; Zhang, Z.; Lin, J.; Liu, F.; Mu, W. Thiamethoxam, clothianidin, and imidacloprid seed treatments effectively control thrips on corn under field conditions. J. Insect. Sci. 2018, 18, 19. [Google Scholar] [CrossRef] [Green Version]
  27. Yuan, Z.; Cao, Q.; Zhang, K.; Ata-Ul-Karim, S.T.; Tian, Y.; Zhu, Y.; Cao, W.; Liu, X. Optimal leaf positions for SPAD meter measurement in rice. Front. Plant Sci. 2016, 7, 719. [Google Scholar] [CrossRef] [PubMed] [Green Version]
  28. Li, B.W.; Gao, S.; Yang, Z.M.; Song, J.B. The F-box E3 ubiquitin ligase AtSDR is involved in salt and drought stress responses in Arabidopsis. Gene 2022, 809, 146011. [Google Scholar] [CrossRef] [PubMed]
  29. Collimore, W.A.; Bent, G.A. A newly modified QuEChERS method for the analysis of organochlorine and organophosphate pesticide residues in fruits and vegetables. Environ. Monit. Assess. 2020, 192, 128. [Google Scholar] [CrossRef] [PubMed]
  30. Zhang, X.; Li, X.; Tang, L.; Peng, Y.; Qian, M.; Guo, Y.; Rui, H.; Zhang, F.; Hu, Z.; Chen, Y.; et al. The root iron transporter 1 governs cadmium uptake in Vicia sativa roots. J. Hazard. Mater. 2020, 398, 122873. [Google Scholar] [CrossRef] [PubMed]
  31. Kim, D.; Langmead, B.; Salzberg, S.L. HISAT: A fast spliced aligner with low memory requirements. Nat. Methods 2015, 12, 357–360. [Google Scholar] [CrossRef] [Green Version]
  32. Florea, L.; Song, L.; Salzberg, S.L. Thousands of exon skipping events differentiate among splicing patterns in sixteen human tissues. F1000Research 2 2013, 2, 188. [Google Scholar] [CrossRef] [Green Version]
  33. Love, M.I.; Huber, W.; Anders, S. Moderated estimation of fold change and dispersion for RNA-seq data with DESeq2. Genome. Biolo. 2014, 15, 550. [Google Scholar] [CrossRef]
  34. Kanehisa, M.; Sato, Y. KEGG mapper for inferring cellular functions from protein sequences. Protein. Sci. 2020, 29, 28–35. [Google Scholar] [CrossRef] [PubMed] [Green Version]
  35. Pirooznia, M.; Yang, J.Y.; Yang, M.Q.; Deng, Y.J.B.G. A comparative study of different machine learning methods on microarray gene expression data. BMC. Genom. 2008, 9, 1–13. [Google Scholar] [CrossRef] [PubMed] [Green Version]
  36. Gao, S.; Yang, L.; Zeng, H.Q.; Zhou, Z.S.; Yang, Z.M.; Li, H.; Sun, D.; Xie, F.; Zhang, B. A cotton miRNA is involved in regulation of plant response to salt stress. Sci. Rep. 2016, 6, 19736. [Google Scholar] [CrossRef] [PubMed] [Green Version]
  37. Zhao, L.; Wang, Y. Nitrate assay for plant tissues. Bio. Protoc. 2017, 7, e2029. [Google Scholar] [CrossRef] [Green Version]
  38. Zhang, S.; Zhu, L.; Shen, C.; Ji, Z.; Zhang, H.; Zhang, T.; Li, Y.; Yu, J.; Yang, N.; He, Y.; et al. Natural allelic variation in a modulator of auxin homeostasis improves grain yield and nitrogen use efficiency in rice. Plant Cell. 2021, 33, 566–580. [Google Scholar] [CrossRef] [PubMed]
  39. Wang, Y.; Wang, S.; Sun, L.; Sun, Z.; Li, D. Screening of a Chlorella-bacteria consortium and research on piggery wastewater purification. Algal. Res. 2020, 47, 101840. [Google Scholar] [CrossRef]
  40. Ju, C.; Li, X.; He, S.; Shi, L.; Yu, S.; Wang, F.; Xu, S.; Cao, D.; Fang, H.; Yu, Y. Root uptake of imidacloprid and propiconazole is affected by root composition and soil characteristics. J. Agr. Food Chem. 2020, 68, 15381–15389. [Google Scholar] [CrossRef] [PubMed]
  41. Sur, R.; Stork, A. Uptake, translocation and metabolism of imidacloprid in plants. Bull. Insectol. 2003, 56, 35–40. [Google Scholar]
  42. Ristova, D.; Carré, C.; Pervent, M.; Medici, A.; Kim, G.J.; Scalia, D.; Ruffel, S.; Birnbaum, K.D.; Lacombe, B.; Busch, W.; et al. Combinatorial interaction network of transcriptomic and phenotypic responses to nitrogen and hormones in the Arabidopsis thaliana root. Sci. Signal. 2016, 9, 451. [Google Scholar] [CrossRef]
  43. Kobayashi, Y.; Uchida, T.; Yoshida, K. Prediction of soil asorption coefficient in pesticides using physicochemical properties and molecular descriptors by machine learning models. Environ. Toxicol. Chem. 2020, 39, 1451–1459. [Google Scholar] [CrossRef]
  44. Dettenmaier, E.M.; Doucette, W.J.; Bugbee, B. Chemical hydrophobicity and uptake by plant roots. Environ. Sci. Technol. 2009, 43, 324–329. [Google Scholar] [CrossRef]
  45. Collins, C.D.; Martin, I.; Doucette, W. Plant Uptake of Xenobiotics. In Organic Xenobiotics and Plants; Springer: Dordrecht, The Netherlands, 2011. [Google Scholar]
  46. Wan, W.; Huang, H.; Lv, J.; Han, R.; Zhang, S. Uptake, translocation, and biotransformation of organophosphorus esters in wheat (Triticum aestivum L.). Environ. Sci. Technol. 2017, 51, 13649–13658. [Google Scholar] [CrossRef] [PubMed]
  47. Naku, M.; Kambizi, L.; Matimati, I. Functional roles of ammonium (NH4+) and nitrate (NO3-) in regulation of day- and night-time transpiration in Phaseolus vulgaris. Funct. Plant Biol. 2019, 46, 806–815. [Google Scholar] [CrossRef] [PubMed]
  48. Maurel, C.; Verdoucq, L.; Luu, D.T.; Santoni, V. Plant aquaporins: Membrane channels with multiple integrated functions. Annu. Rev. Plant Biol. 2008, 59, 595–624. [Google Scholar] [CrossRef] [PubMed] [Green Version]
  49. Prinsi, B.; Espen, L. Time-course of metabolic and proteomic responses to different nitrate/ammonium availabilities in roots and leaves of maize. Int. J. Mol. Sci. 2018, 19, 2202. [Google Scholar] [CrossRef] [Green Version]
  50. Vidal, E.A.; Alvarez, J.M.; Araus, V.; Riveras, E.; Brooks, M.D.; Krouk, G.; Ruffel, S.; Lejay, L.; Crawford, N.M.; Coruzzi, G.M.; et al. Nitrate in 2020: Thirty years from transport to signaling networks. Plant Cell. 2020, 32, 2094–2119. [Google Scholar] [CrossRef]
  51. Guan, M.; Chen, M.; Cao, Z. NRT2.1, a major contributor to cadmium uptake controlled by high-affinity nitrate transporters. Ecotoxicol. Environ. Saf. 2021, 218, 112269. [Google Scholar] [CrossRef]
  52. Lejay, L.; Wirth, J.; Pervent, M.; Cross, J.M.; Tillard, P.; Gojon, A. Oxidative pentose phosphate pathway-dependent sugar sensing as a mechanism for regulation of root ion transporters by photosynthesis. Plant Physiol. 2008, 146, 2036–2053. [Google Scholar] [CrossRef] [Green Version]
  53. de Jong, F.; Thodey, K.; Lejay, L.V.; Bevan, M.W. Glucose elevates NITRATE TRANSPORTER2.1 protein levels and nitrate transport activity independently of its HEXOKINASE1-mediated stimulation of NITRATE TRANSPORTER2.1 expression. Plant Physiol. 2014, 164, 308–320. [Google Scholar] [CrossRef] [Green Version]
  54. Lejay, L.; Tillard, P.; Lepetit, M.; Olive, F.; Filleur, S.; Daniel-Vedele, F.; Gojon, A. Molecular and functional regulation of two NO3- uptake systems by N- and C-status of Arabidopsis plants. Plant J. 1999, 18, 509–519. [Google Scholar] [CrossRef]
  55. Zhuo, D.; Okamoto, M.; Vidmar, J.J.; Glass, A.D. Regulation of a putative high-affinity nitrate transporter (Nrt2;1At) in roots of Arabidopsis thaliana. Plant J. 1999, 17, 563–568. [Google Scholar] [CrossRef]
  56. Alvarez, J.M.; Riveras, E.; Vidal, E.A.; Gras, D.E.; Contreras-López, O.; Tamayo, K.P.; Aceituno, F.; Gómez, I.; Ruffel, S.; Lejay, L.; et al. Systems approach identifies TGA1 and TGA4 transcription factors as important regulatory components of the nitrate response of Arabidopsis thaliana roots. Plant J. 2014, 80, 12618. [Google Scholar] [CrossRef] [PubMed]
  57. Wang, Z.; Zhang, L.; Sun, C.; Gu, R.; Mi, G.; Yuan, L. Phylogenetic, expression and functional characterizations of the maize NLP transcription factor family reveal a role in nitrate assimilation and signaling. Physiol. Plant. 2018, 163, 269–281. [Google Scholar] [CrossRef] [PubMed] [Green Version]
  58. Wang, X.; Wang, H.F.; Chen, Y.; Sun, M.M.; Wang, Y.; Chen, Y.F. The transcription factor NIGT1.2 modulates both phosphate uptake and nitrate influx during phosphate starvation in Arabidopsis and Maize. Plant Cell 2020, 32, 3519–3534. [Google Scholar] [CrossRef]
  59. Konishi, M.; Okitsu, T.; Yanagisawa, S. Nitrate-responsive NIN-like protein transcription factors perform unique and redundant roles in Arabidopsis. J. Exp. Bot. 2021, 72, 5735–5750. [Google Scholar] [CrossRef] [PubMed]
  60. Brooks, M.D.; Cirrone, J.; Pasquino, A.V.; Alvarez, J.M.; Swift, J.; Mittal, S.; Juang, C.-L.; Varala, K.; Gutiérrez, R.A.; Krouk, G.; et al. Network Walking charts transcriptional dynamics of nitrogen signaling by integrating validated and predicted genome-wide interactions. Nat. Commun. 2019, 10, 1569. [Google Scholar] [CrossRef] [PubMed] [Green Version]
  61. Seifrtova, M.; Halesova, T.; Sulcova, K.; Riddellova, K.; Erban, T. Distributions of imidacloprid, imidacloprid-olefin and imidacloprid-urea in green plant tissues and roots of rapeseed (Brassica napus) from artificially contaminated potting soil. Pest Manag. Sci. 2017, 73, 1010–1016. [Google Scholar] [CrossRef]
  62. Zhang, X.; Chen, L.; Leng, R.; Zhang, J.; Zhou, Y.; Zhang, Y.; Yang, S.; He, K.; Huang, B. Mechanism study of the beneficial effect of sodium selenite on metabolic disorders in imidacloprid-treated garlic plants. Ecotox. Environ. Safe. 2020, 200, 110736. [Google Scholar] [CrossRef]
  63. Balotf, S.; Kavoosi, G.; Kholdebarin, B. Nitrate reductase, nitrite reductase, glutamine synthetase, and glutamate synthase expression and activity in response to different nitrogen sources in nitrogen-starved wheat seedlings. Biotechnol. Appl. Biochem. 2016, 63, 220–229. [Google Scholar] [CrossRef]
  64. Yao, M.; Ge, W.; Zhou, Q.; Zhou, X.; Luo, M.; Zhao, Y.; Wei, B.; Ji, S. Exogenous glutathione alleviates chilling injury in postharvest bell pepper by modulating the ascorbate-glutathione (AsA-GSH) cycle. Food Chem. 2021, 352, 129458. [Google Scholar] [CrossRef]
  65. Kumar, S.; Trivedi, P.K. Glutathione S-Transferases: Role in combating abiotic stresses including arsenic detoxification in plants. Front. Plant. Sci. 2018, 9, 751. [Google Scholar] [CrossRef] [PubMed]
  66. Yang, B.; Lin, X.; Yu, N.; Gao, H.; Zhang, Y.; Liu, W.; Liu, Z. Contribution of glutathione S-transferases to Iimidacloprid resistance in Nilaparvata lugens. J. Agr. Food Chem. 2020, 68, 15403–15408. [Google Scholar] [CrossRef] [PubMed]
  67. Liu, N.; Li, J.; Lv, J.; Yu, J.; Xie, J.; Wu, Y.; Tang, Z. Melatonin alleviates imidacloprid phytotoxicity to cucumber (Cucumis sativus L.) through modulating redox homeostasis in plants and promoting its metabolism by enhancing glutathione dependent detoxification. Ecotox. Environ. Safe. 2021, 217, 112248. [Google Scholar] [CrossRef]
  68. Lu, Y.P.; Li, Z.S.; Rea, P.A. AtMRP1 gene of Arabidopsis encodes a glutathione S-conjugate pump: Isolation and functional definition of a plant ATP-binding cassette transporter gene. Proc. Natl. Acad. Sci. USA 1997, 94, 8243–8248. [Google Scholar] [CrossRef] [Green Version]
  69. Gaillard, C.; Dufaud, A.; Tommasini, R.; Kreuz, K.; Amrhein, N.; Martinoia, E. A herbicide antidote (safener) induces the activity of both the herbicide detoxifying enzyme and of a vacuolar transporter for the detoxified herbicide. FEBS Lett. 1994, 352, 219–221. [Google Scholar] [CrossRef] [PubMed] [Green Version]
  70. Nornberg, B.F.; Batista, C.R.; Almeida, D.V.; Trindade, G.S.; Marins, L.F. ABCB1 and ABCC4 efflux transporters are involved in methyl parathion detoxification in ZFL cells. Toxicol. Vitr. 2015, 29, 204–210. [Google Scholar] [CrossRef] [PubMed]
  71. Xu, C.; Wei, L.; Huang, S.; Yang, C.; Wang, Y.; Yuan, H.; Xu, Q.; Zhang, W.; Wang, M.; Zeng, X.; et al. Drought resistance in qingke involves a reprogramming of the phenylpropanoid pathway and UDP-glucosyltransferase regulation of abiotic stress tolerance targeting flavonoid biosynthesis. J. Agric. Food Chem. 2021, 69, 992–4005. [Google Scholar] [CrossRef]
  72. Moura, J.C.; Bonine, C.A.; de Oliveira Fernandes Viana, J.; Dornelas, M.C.; Mazzafera, P. Abiotic and biotic stresses and changes in the lignin content and composition in plants. J. Integr. Plant Biol. 2010, 52, 360–376. [Google Scholar] [CrossRef]
  73. Davies, K.M.; Albert, N.W.; Zhou, Y.; Schwinn, K.E. Functions of flavonoid and betalain pigments in abiotic stress tolerance in plants. Annu. Plant Rev. 2018, 1, 604. [Google Scholar] [CrossRef]
  74. Naing, A.H.; Kim, C.K. Abiotic stress-induced anthocyanins in plants: Their role in tolerance to abiotic stresses. Physiol. Plant. 2021, 172, 1711–1723. [Google Scholar] [CrossRef]
  75. Yang, Z.; Bai, C.; Wang, P.; Fu, W.; Wang, L.; Song, Z.; Xi, X.; Wu, H.; Zhang, G.; Wu, J. Sandbur drought tolerance reflects phenotypic plasticity based on the accumulation of sugars, lipids, and flavonoid intermediates and the scavenging of reactive oxygen species in the root. Int. J. Mol. Sci. 2021, 22, 12615. [Google Scholar] [CrossRef] [PubMed]
  76. Landi, M.; Tattini, M.; Gould, K.S. Multiple functional roles of anthocyanins in plant-environment interactions. Environ. Exp. Bot. 2015, 119, 4–17. [Google Scholar] [CrossRef]
  77. Cosio, C.; Dunand, C. Specific functions of individual class III peroxidase genes. J. Exp. Bot. 2009, 60, 391–408. [Google Scholar] [CrossRef]
  78. de Oliveira, F.K.; Santos, L.O.; Buffon, J.G. Mechanism of action, sources, and application of peroxidases. Food Res. Int. 2021, 143, 110266. [Google Scholar] [CrossRef] [PubMed]
  79. Kidwai, M.; Ahmad, I.Z.; Chakrabarty, D. Class III peroxidase: An indispensable enzyme for biotic/abiotic stress tolerance and a potent candidate for crop improvement. Plant Cell. Rep. 2020, 39, 1381–1393. [Google Scholar] [CrossRef]
Figure 1. Phenotype of maize under IMI treatment. Phenotype of maize seedlings cultured in modified Hoagland nutrient solution (−N: no nitrogen supply, N: 4 mmol L−1 NO3, NN: 10 mmol L−1 NO3, A: 4 mmol L−1 NH4+ and AA: 10 mmol L−1 NH4+) containing 0, 1, 2.5 or 5 ppm IMI for 14 days.
Agronomy 12 03161 g001
Figure 2. The content of IMI in maize tissues. The seedlings were grown in modified Hoagland nutrient solution (−N: no nitrogen supply, N: 4 mmol L−1 NO3, NN: 10 mmol L−1 NO3, A: 4 mmol L−1 NH4+ and AA: 10 mmol L−1 NH4+), containing 1 (A), 2.5 (B) or 5 ppm (C) IMI, for 14 days. The different letters indicate the differences in p-value < 0.05 by LSD test.
Agronomy 12 03161 g002
Figure 3. Distribution of differentially expressed genes (DEGs) identified by RNA-Seq analysis from a comparison of maize seedlings supplemented with no nitrogen, 4 mmol L−1 NO3 or 10 mmol L−1 NO3, and treated with 5 ppm IMI for 48 h (shoots, (A)), or 24 h (roots, (B)), with respect to the control (no IMI treatment).The Venn diagram of the number of differentially expressed unigenes in each comparison group (C,D).
Agronomy 12 03161 g003
Figure 4. Correlation analysis of DEGs between qRT-PCR analysis method and RNA-Seq experiments.
Agronomy 12 03161 g004
Figure 5. Expression profiling of DEGs in leaves of maize subjected to different nitrogen supplies and treated with 5 ppm IMI. Green to red means a down-regulated level to an up-regulated level (logFC).
Agronomy 12 03161 g005
Figure 6. Putative DEGs involved in nitrogen metabolism (A), nitrogen-regulatory factor (B), glutathione metabolism (C), phenylpropanoid biosynthesis (D) and ABC transporter (E) in roots. Green to red means a down-regulated level to an up-regulated level (logFC).
Agronomy 12 03161 g006
Figure 7. Imidacloprid affects nitrogen absorption and metabolism in maize. The relative mRNA levels of several genes related to nitrogen absorption and metabolism under 5 ppm IMI treatment, for 24 h, in roots (A,B), or for 48 h in shoots (D). Steady-state mRNA levels in roots were normalized against Zmactin1 gene and were expressed relative to those of the control plants, which were given a value of 1 (not shown). The content of nitrates in maize seedlings (C). The activity of NR and GS in shoots (E,F). Bar values are means ± SD of three biological replicates, each corresponding to different RNA extractions from tissues of three plants independently grown. Lower case letters indicate significant differences among treatments.
Agronomy 12 03161 g007
Figure 8. The expression of genes related to stress response. The relative mRNA levels of several genes related to stress responses under 5 ppm IMI treatment, for 24 h, in roots. Lower case letters indicate significant differences among treatments.
Agronomy 12 03161 g008
Table 1. Effect of IMI on shoot dry weight (DW), shoot length, SPAD value and thiobarbituric acid-reactive substance (TBARS) in maize subjected to different nitrogen treatments when exposed to different IMI levels for 14 days (−N: no nitrogen supply, N: 4 mmol L−1 NO3, NN: 10 mmol L−1 NO3, A: 4 mmol L−1 NH4+ and AA: 10 mmol L−1 NH4+).
IMI
(ppm)
Groups
-NNNNAAA
Shoots DW (mg)015.1 ± 3.0g35.1 ± 5.2b42.6 ± 3.2a35.6 ± 3.7bc32.5 ± 6.7bcd
1.017.2 ± 3.1fg29.4 ± 3.3cde32.5 ± 5.3bcd28.5 ± 5.9cde23.5 ± 3.3def
2.517.1 ± 2.2fg32.2 ± 3.2bcd34.3 ± 2.1bcd26.7 ± 3.6def22.6 ± 5.3ef
5.016.7 ± 2.4fg27.5 ± 1.8cde28.5 ± 6.1cde25.6 ± 3.8def23.8 ± 2.2def
Shoots length (cm)013.7 ± 0.3fgh18.3 ± 1.0b19.8 ± 1.0a16.1 ± 0.5cd15.7 ± 1.6cde
1.014.0 ± 0.3efg14.7 ± 0.7def16.8 ± 1.2c13.3 ± 0.5fgh14.6 ± 0.7def
2.513.8 ± 0.63fgh13.8 ± 0.4fgh15.0 ± 0.5def13.1 ± 0.3fgh13.5 ± 0.4fgh
5.014.1 ± 0.4fgh12.9 ± 0.3ghi13.0 ± 0.5ghi11.6 ± 0.4i12.2 ± 0.8hi
SPAD012.2 ± 0.4f20.8 ± 1.5bc20.6 ± 0.5bc18.5 ± 2.1cd17.4 ± 0.7cde
1.018.8 ± 1.0bcd19.8 ± 1.0bcd22.2 ± 1.1ab20.5 ± 0.4bc20.5 ± 1.5bc
2.517.6 ± 1.2cde23.0 ± 1.5a21.7 ± 2.2abc20.9 ± 0.8abc19.1 ± 2.2bcd
5.018.5 ± 0.7bcd21.11 ± 2.2abc23.2 ± 1.0a21.5 ± 3.0abc19.3 ± 1.0ab
TBARS (nmol g−1 FW)069.2 ± 4.0a5.6 ± 1.8h7.7 ± 0.7h31.7 ± 1.5e37.0 ± 0.8de
1.038.7 ± 2.1de14.8 ± 0.4g18.8 ± 1.7fg37.4 ± 2.9de21.8 ± 1.1f
2.537.1 ± 4.1de21.5 ± 2.4f23.1 ± 2.8f39.9 ± 1.3d32.2 ± 2.1e
5.038.5 ± 4.0de36.5 ± 2.5de39.0 ± 2.4de59.0 ± 4.2b53.7 ± 6.0c
Lower case letters indicate significant differences among treatments.
Table 2. Effect of IMI on root length, dry weight (DW) and thiobarbituric acid-reactive substance (TBARS) in maize subjected to different nitrogen treatments when exposed to different IMI levels for 14 days (−N: no nitrogen supply, N: 4 mmol L−1 NO3, NN: 10 mmol L−1 NO3, A: 4 mmol L−1 NH4+ and AA: 10 mmol L−1 NH4+).
IMI
(ppm)
Groups
-NNNNAHA
Roots DW (mg)08.7 ± 0.5a8.2 ± 1.3a7.8 ± 0.6a7.7 ± 0.7a8.7 ± 0.3a
1.05.4 ± 0.7bcd6.4 ± 0.9b5.0 ± 0.7bcd5.3 ± 0.9bcd6.1 ± 0.7bcd
2.55.1 ± 0.8bcd4.6 ± 0.5bcd5.4 ± 0.7bcd5.2 ± 0.9bcd4.8 ± 0.9bcd
5.03.9 ± 0.5d4.2 ± 0.5cd4.3 ± 0.8bcd3.5 ± 0.6d3.9 ± 0.5d
Main roots length (cm)032.1 ± 1.5ab21.4 ± 1.9bc23.5 ± 3.1b20.4 ± 1.3cd19.9 ± 0.5cd
1.013.8 ± 1.5hij17.5 ± 0.7ef18.2 ± 0.8de17.8 ± 2.8ef17.1 ± 1.4ef
2.511.9 ± 0.1ij16.2 ± 0.9efg18.1 ± 1.1de16.9 ± 1.6ef15.3 ± 1.7fg
5.011.3 ± 0.5j15.8 ± 0.9fg15.5 ± 0.8fg14.7 ± 1.1gh13.5 ± 1.3hij
TBARS (nmol g−1 FW)04.24 ± 0.6f5.2 ± 0. 8f5.0 ± 1.0f11.3 ± 1.7e14.4 ± 1.8cde
1.013.0 ± 1.3cde 12.9 ± 1.1cde12.9 ± 2.1cde14.1 ± 2.9cde16.1 ± 2.1cd
2.517.8 ± 2.18c19.9 ± 2.1bc18.8 ± 3.1bc23.9 ± 3.1b24.0 ± 3.1b
5.028.87 ± 2.88ab25.6 ± 4.2b24.5 ± 4.1b28.8 ± 4.1ab30.8 ± 2.1a
Lower case letters indicate significant differences among treatments.
Publisher’s Note: MDPI stays neutral with regard to jurisdictional claims in published maps and institutional affiliations.

