Article

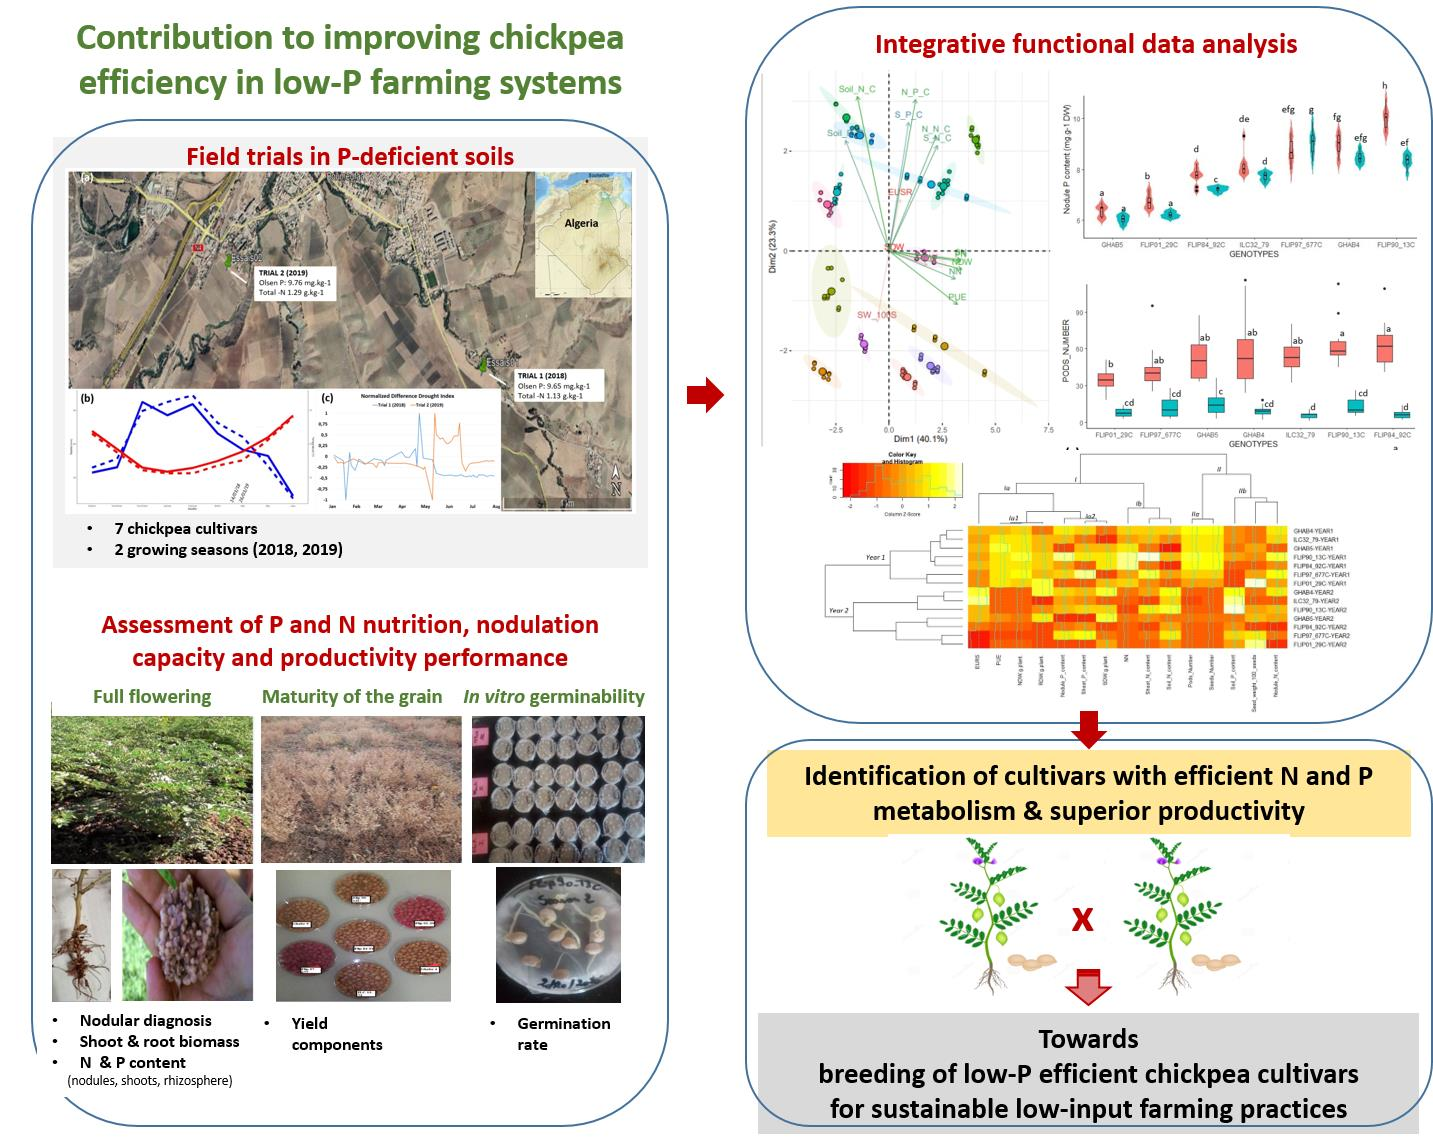
Contribution to Improving the Chickpea (Cicer arietinum L.) Efficiency in Low-Phosphorus Farming Systems: Assessment of the Relationships between the P and N Nutrition, Nodulation Capacity and Productivity Performance in P-Deficient Field Conditions

by
Souad Insaf Djouider
1,2,
Laurent Gentzbittel
1,3,
Raghavendra Jana
3,
Martina Rickauer
1,
Cécile Ben
1,3,* and
Mohamed Lazali
2,*
1
Laboratoire Ecologie Fonctionnelle et Environnement, Université de Toulouse, CNRS, 31062 Toulouse, France
2
Laboratoire de recherche Eau, Roche et Plantes, Université Djilali Bounaama de Khemis Miliana, Route Theniet El Had, Soufay 44225, Khemis Miliana, Algeria
3
Skolkovo Institute of Science and Technology, Moscow 121205, Russia
*
Authors to whom correspondence should be addressed.
Agronomy 2022, 12(12), 3150; https://doi.org/10.3390/agronomy12123150
Submission received: 31 October 2022 / Revised: 29 November 2022 / Accepted: 8 December 2022 / Published: 12 December 2022
(This article belongs to the Special Issue Improving Nutrient Use Efficiency: From Lab to the Field)

Abstract

:
Chickpea (Cicer arietinum L.), the third largest produced pulse worldwide, is primarily grown on marginal soils often characterized by a phosphorus (P)-deficiency that severely hampers yields. The objectives of the study are to investigate the relationships between the P-acquisition, P-use efficiency (PUE) and the agronomical performances towards the developing varieties tolerant to the P-deficiency. We evaluate the impact of the P-deficiency on the growth, yield, germination and nodulation performances of seven chickpea cultivars grown in fields with a low-P soil availability, during two seasons. The adaptive mechanisms to maintain the efficiency of the physiological processes, such as the nitrogen (N)-fixing nodule function, germinability, and possibly photosynthesis, are revealed. In contrast, the large genotypic variation in the yield components, in the P and N acquisition, and in the PUE is observed, supporting the role of the nodules in the P uptake in P-deficient soils. The P-acquisition and utilization efficiencies are genetically decoupled, suggesting designing distinct breeding strategies to promote one or both PUE components. As an outcome, we identify a set of chickpea cultivars adapted to a region with a soil P scarcity, that exhibit efficient N and P metabolism and a superior productivity. This germplasm can be used in breeding programs for low-P input efficient chickpeas. This contributes to the implementation of eco-friendly farming practices while making the most of marginal soils.

Graphical Abstract

1. Introduction

Phosphorus (P) is an essential element for plant metabolism, growth, and productivity. P is involved in several key plant functions, including the synthesis and stability of DNA and RNA, energy transfer and storage by ATP (adenosine triphosphate), photosynthesis, sugar and starch transformation, and the nutrient movement within the plant. It thus plays a significant role in crop productivity. Similarly, because P is a fundamental component of membrane phospholipids, adequate P nutrition is required for the cell structural and functional integrities [1,2].
In response to a P-deficiency, plants exhibit a series of morphological, physiological, biochemical, and molecular adjustments to enhance their capacity to acquire P [3,4]. Well-known strategies for plants’ adaptations to a P-deficiency include changes in the root biomass allocation, root morphology, carboxylate exudation and mycorrhizal symbiosis [4,5,6]. An increase in the root hair length that enhances the root-soil contact and absorptive area for the P absorption was also described [7]. Plant P use efficiency (PUE) is defined by a plant’s capacity to produce a yield and biomass per unit of P available to it [8]. A high PUE can be achieved by (i) improving the P-acquisition from the rhizosphere and/or (ii) enhancing the utilization of the acquired P towards producing a biomass by the optimal partitioning of cellular P and distributing P effectively between tissues [9,10]. The most sustainable and productive agricultural systems will be those with a high PUE, where P exports from the soil, by the plants, are balanced by the carefully monitored P inputs. This is a component of a low input farming strategy (LIFS) aiming to reduce both nitrogen (N) and P artificial inputs. Therefore, improving major crops for the P acquisition and use efficiency is a significant concern for plant biologists and breeders [7,11].
Legume crops, which show the unique capacity to establish the root symbiosis with rhizobia bacteria to fix atmospheric nitrogen, have a particularly high P demand, due to its role in the energy transfer reactions in nodules, during the N2 fixation. The reduction of each mole of N2 by the rhizobia requires 16 moles of adenosine triphosphate (ATP) [12,13], that are provided by the plant. It is estimated that up to 20% of the total plant P is assigned to the nodules, to sustain the symbiotic activity. Under the P-limited conditions, the nodules represent a strong sink for the P incorporation to the detriment of other plant organs. The nodule P content can reach up to three fold higher, as evidenced in various legume species [13]. The nodulation (including the nodule development), as well as the N acquisition and metabolism, are inhibited by the low-P supply [6]. Legume crops are widely cultivated in semi-arid and tropical parts of the world, where a P-deficiency poses severe threats to the crop productivity [14,15]. Consequently, the limitation of the symbiotic nitrogen fixation, due to the P-deficiency, restricts the development of a sustainable agriculture that goes along with the reduced use of chemical fertilizers, particularly in Mediterranean soils [11]. The adaptive response of the nodule metabolism to the P-deficiency, is thus crucial to improving the symbiotic efficiency under P-deficient conditions. Improving the efficiency of the P use for the legume nodulation, is a challenge in the face of a growing global population and a forecasted scarcity of natural phosphate reserves [16].
The chickpea (Cicer arietinum L.) is the third most important pulse (i.e., dried legume seed) after the common bean and soybean [17]. The chickpea can fix 60–80% of its nitrogen requirement [18], amounting to 60–176 kg N ha−1 [19]. Therefore, it is considered as a high N-fixer [20]. This beneficial biological N2-fixation makes the chickpea a crop component particularly appealing to support the LIFS. However, since it is primarily grown as a rainfed crop after the rainy season on marginal soils with poor physical characteristics and fertility, the chickpea productivity is often low due to the deficiency of mineral nutrients [21]. A P-deficiency, which causes 29–45% yield losses, was pointed out as one of the most detrimental abiotic stresses to this vital food pulse crop [22].
The objectives of this study, which was conducted under natural low-P field conditions, were to investigate the genetic variability in the uptake and utilization efficiency of P. We focused our analysis on seven chosen chickpea cultivars already improved via selective breeding, marketed, and widely cultivated in the Algerian Ain Defla agricultural region. Our main goals were to contribute to (i) a better comprehension of the quantitative relationship between the PUE, the nodulation capacities, and the productivity and germination performances, accounting for the pedoclimatic environment and (ii) to the identification of low-P tolerant and efficient chickpea cultivars, allowing the implementation of eco-friendly sustainable farming practices in marginal soils.

2. Materials and Methods

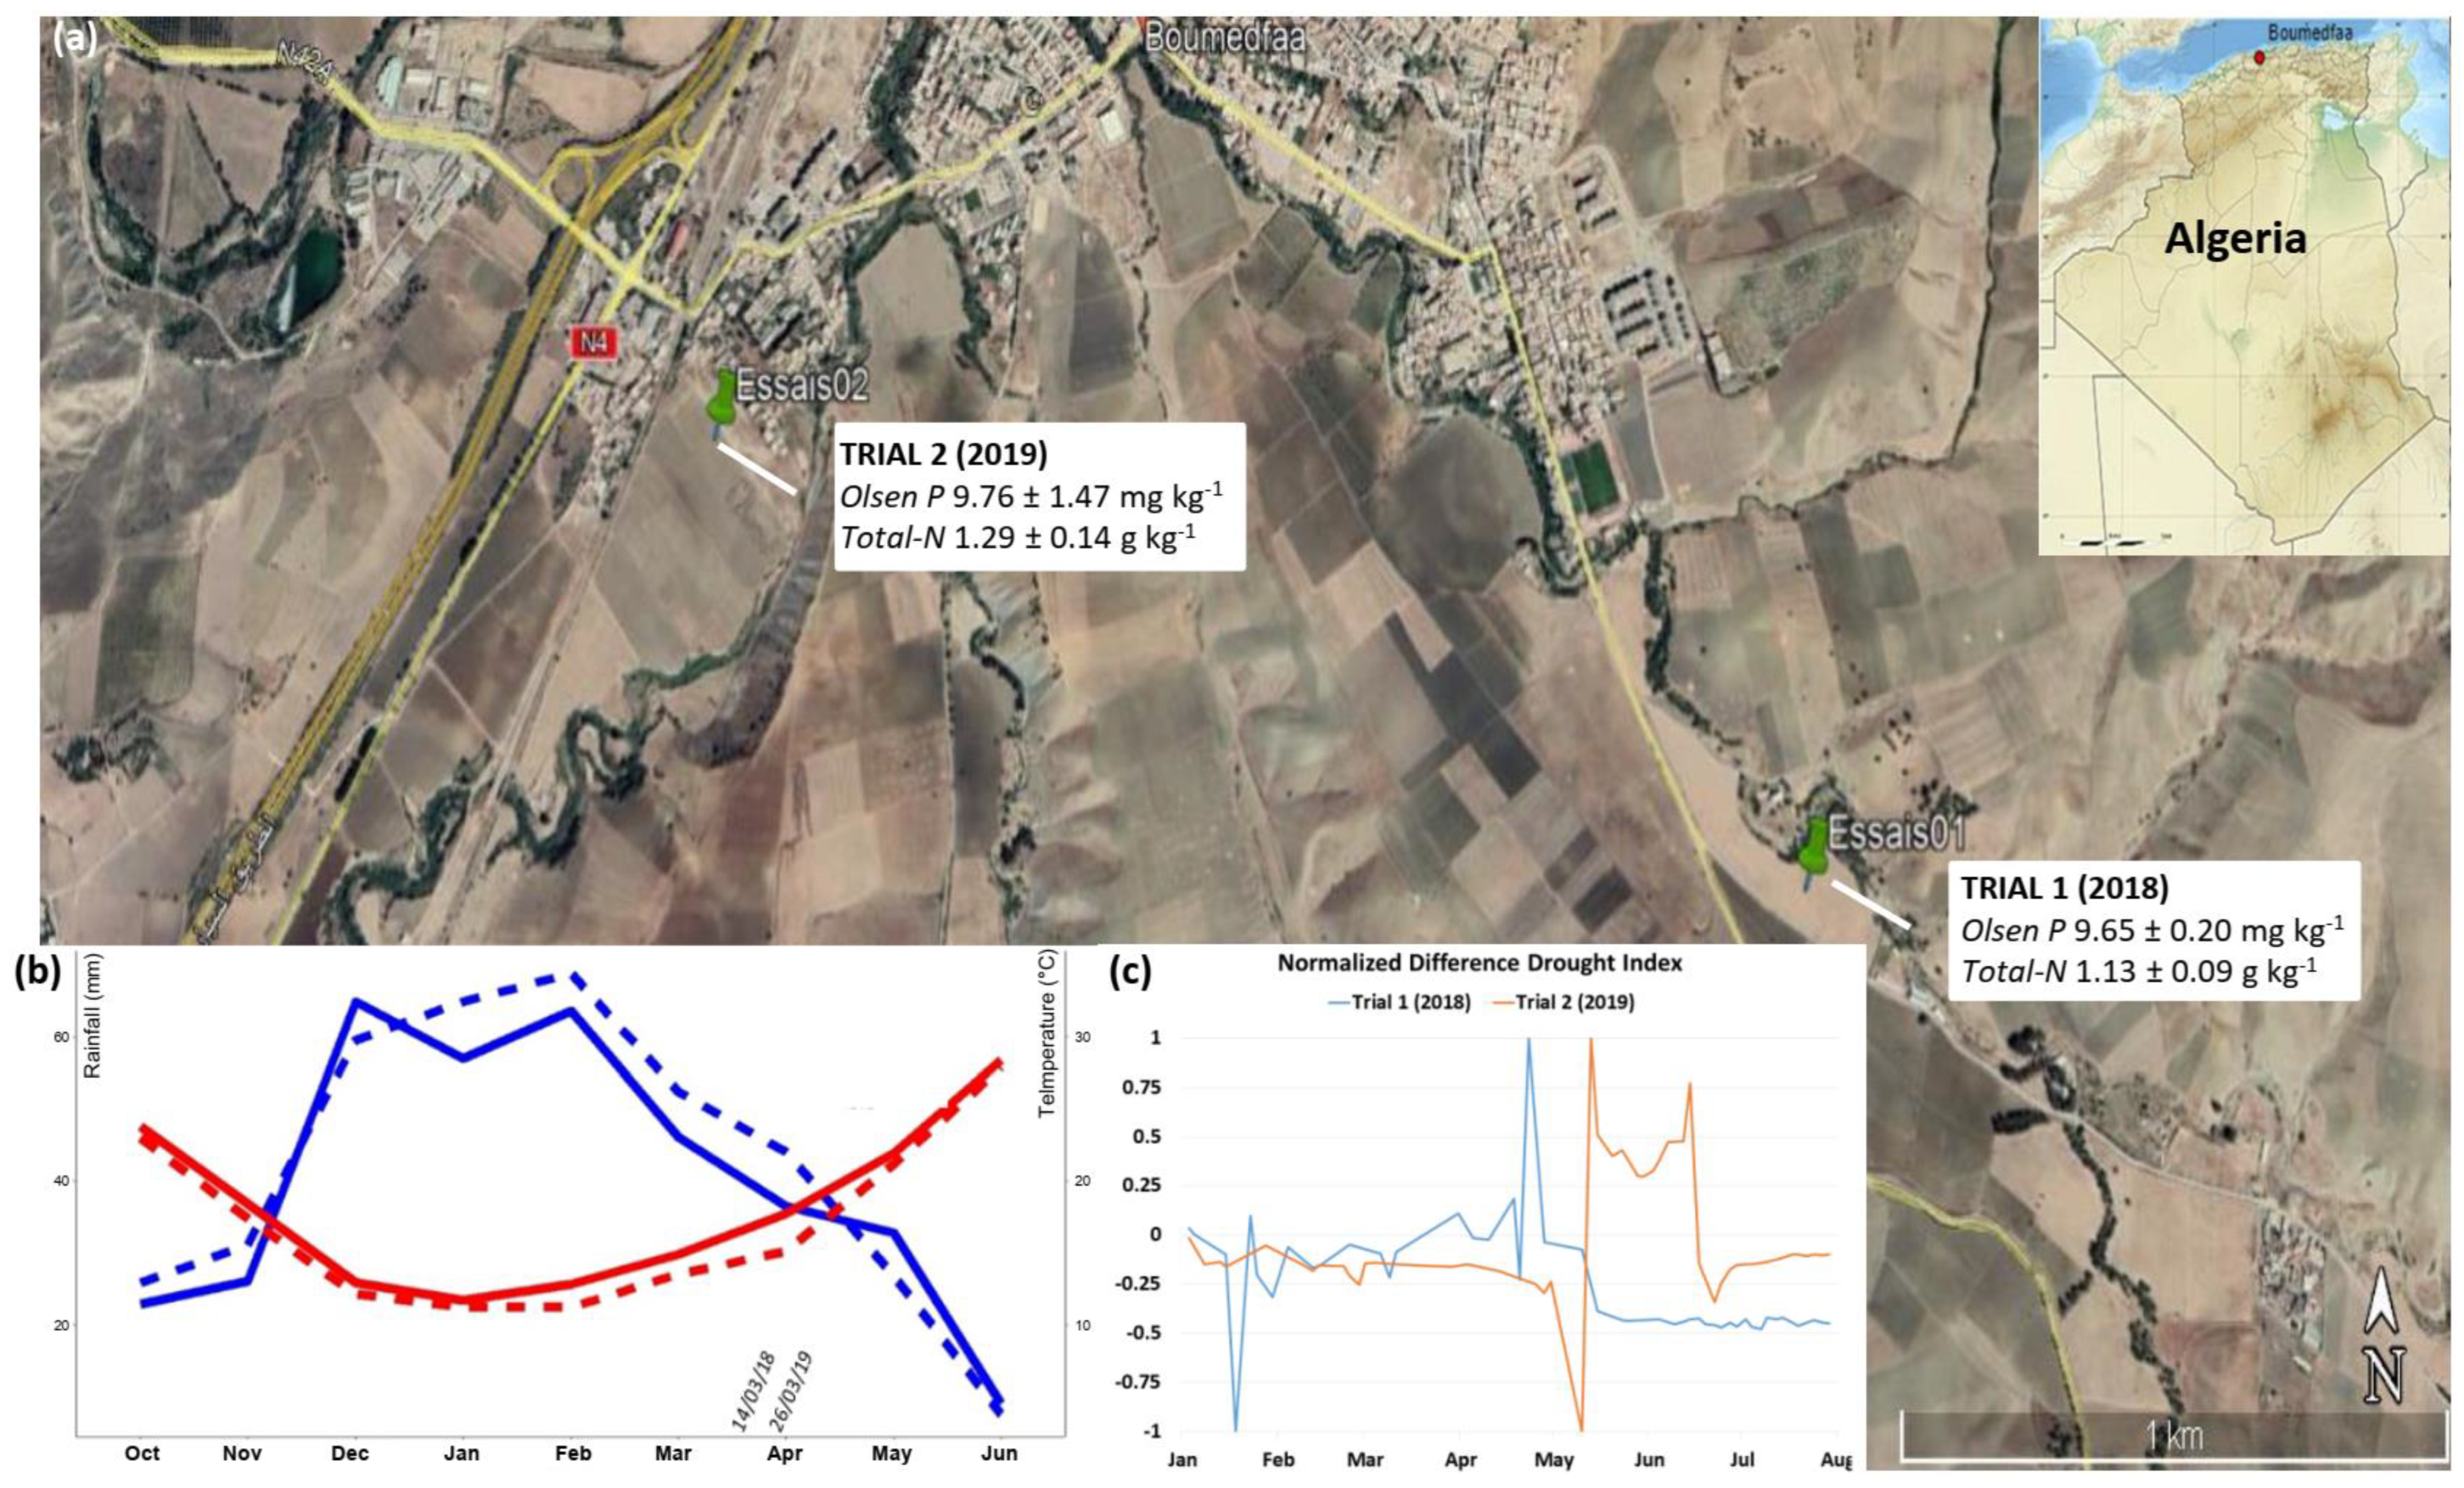
2.1. Description of the Field Experimental Sites

The field study was carried out over two growing seasons, 2018 and 2019, in Boumadfaa, in the agro-ecosystem of Haut Chellif in the Ain Defla region in Northwestern Algeria (Figure 1a). This area was selected for its large chickpea production in rotation with cereal growing. The two experimental sites are characterized as clay loam soil. This agricultural region is well-documented for the low-P availability of the soils [23]. At each growing season, nine random soil samples were collected at the sowing date, according to a standard zigzag sampling at 0–30 cm with an auger and conserved at 4 °C before analysis. The soil samples were crushed and sieved through a 2 mm sieve, to obtain the fine soil fraction before identifying the soil physical and chemical properties (Table S1). The rainfall (mm) and maximum and minimum air temperatures (°C) were recorded daily during the experiments of the two growing seasons (Figure 1b) and the normalized difference drought index (NDDI) [24,25] was calculated (Figure 1c, Appendix A).

2.2. Plant Material and Experimental Design

The study was conducted with seven elite chickpea genotypes which are currently the most cultivated by farmers in the Ain Defla agroecosystems (Table S2). The seeds were obtained from the Technical Institute for Field Crops (ITGC). The seeds were sown manually in March at a density of 30 seeds per m2, with a spacing of 20 cm between plants and 25 cm between rows, in a randomized complete block design (RCBD) with three blocks, each block further divided into seven plots, each plot randomly used for one of the seven cultivars. The plots were 9 m2 (3 m × 3 m) and each plot was located 1 m from the adjacent plots. The trials were rainfed (i.e., no irrigation), without rhizobial inoculation nor fertilizer treatment. These farming practices, carried out under the ecological conditions prevailing in Boumadfaa in Algeria, correspond to the classic cultural management of the chickpea varieties in this production region.

2.3. Assessment of the Growth, Nodulation, and Yield Performances

A first set of biological samples was taken 60 days after sowing, which coincided with the full flowering stage, i.e., the main phenological stage in which legumes fix the maximum amount of N through the biological N2 fixation [26,27]. For each season, six plants per genotype per block were randomly harvested from the middle rows, by excavating 20 cm in depth, carefully digging around the root system, as usually described [28]. Each plant was divided into shoots, roots, and nodules. The surrounding soil was carefully removed from roots and the nodule samples. All of the samples (i.e., shoots, roots, and nodules) were oven-dried for 48 h at 65 °C before being weighed.
Linear regression models were computed between the nodule and the shoot dry weights. The slopes of these models were retained as estimators of the efficiency in the use of the rhizobial symbiosis (EURS) for the shoot biomass production with the atmospheric N2 fixed by the nodules [14,29]. The intercepts of the models correspond to the shoot biomass production without nodules i.e., with soil nitrogen only.
A second set of biological samples was taken at harvest (early July) when the crops were mature. The crop yield was determined by harvesting all of the plants within 1 m2 blocks with six replicates in each plot, excluding the outer rows. The optimum harvesting stage is between 9 and 11% grain moisture, which corresponds to the physiological maturity of the grain. The components of the grain yield were assessed i.e., the pod and seed number and 100 seed weight in grams.

2.4. In Vitro Seed Germination Assays

Seed germinability was assessed from seeds harvested during the two successive field trials in 2018 and 2019. For each chickpea genotype and each growing season, the germination rate of ninety seeds was evaluated through an in vitro test carried out in Petri dishes with sterile water-imbibed tissue paper, with three biological repeats of 30 seeds each. The seeds were disinfected with a 0.96% sodium hypochlorite solution for 6 min, and then washed four times with sterile distilled water. They were then set to germinate at a constant temperature of 25 °C in darkness. The seed germination was monitored for five days of culture, with the daily counting of the number of seeds with a protruding root.

2.5. Quantification of the Nitrogen and Phosphorus Content in the Nodules, Shoots, and Rhizosphere

The total N and organic matter contents were quantified using the Kjeldahl [30] and Walkley–Black [31] methods in the plants (incl. nodules and shoots) and the rhizospheres of the seven chickpea genotypes.
The available P of the rhizospheric soil was measured using the Olsen method [32]. The P concentration in the plants (nodules and shoots) was determined by the malachite green method after digestion with nitric and perchloric acids, by measuring the absorbance at a 630 nm wavelength with a spectrophotometer [33]. The P use efficiency (PUE) for the nitrogen fixation was defined as the ratio of the nodule biomass: the nodule P content was determined according to [9]. For these analyzes, the six replicates of the soil or plant samples taken for each chickpea genotype at the full flowering stage, in each block, were pooled. Each pooled sample was measured three times for each element (N and P).

2.6. Statistical Analyses

All data collected from the field trials were subjected to a two-way ANOVA with the interaction between the chickpea genotypes and the growing seasons, and the block nested within the growing seasons as fixed effects, according to the following model:
Yigk = µtrait + genotypei × yearg + blockk (yearg) + ɛigk
The data transformations were applied when required to homogenize the variances and to normalize the residuals of the ANOVA. The analysis was performed using the aov function of the R 4.1.0 statistical software [34]. Multiple mean comparisons were performed using the Tukey pairwise comparisons tests at p-value ≤ 0.05 using the HSD.test function of the multcomp R package.
Data from the in vitro seed germination assays were analyzed using a generalized linear mixed model fitted by the maximum likelihood and using a binomial (logit) family. The model implemented, is as follows:
(Nb_germinated_seeds, Nb_No_germinated_seeds) ~ genotype × year + (1|block)
where genotype, year and their interaction are considered as fixed effects and the blocks effect nested within the three independent biological repeats, as a random effect. The analysis was performed using the glmer function of the lme4 R package.
The relationship between the shoot dry weight (SDW) and the nodule dry weight (NDW) was tested by a linear regression analysis with the ggscatter function of the ggpubr R package to estimate the EURS.
The principal component analysis (PCA) and heatmap were obtained using the fviz_pca_biplot function of the factoextra package and the heatmap.2 function of the gplots package of the R software, respectively.

3. Results

3.1. P-Deficiency Affects Certain Functional Growth and Nodulation Traits Differentially between Cultivars

The response to the P-deficiency was evaluated in the seven chickpea cultivars most cultivated in the Algerian Ain Defla agroecosystems, during two successive growing seasons (2018 and 2019), in a common garden characterized by a low-P soil availability (Figure 1a, Table S1). Boumadfaa’s climate is semi-arid Mediterranean, characterized by wet winters and hot dry summers. The region was prone to irregular rainfall, with an annual mean ranging between 350 and 400 mm during the period from 2018 to 2019. The highest rainfall was in the period between November and February. June was the driest month (mean rainfall of about 9 mm in 2018 and 7 mm in 2019) (Figure 1b). Overall, as revealed by the normalized difference drought index (NDDI), there was a longer drought period in 2019, especially at the end of the crop cycle, from flowering in mid-May to harvest in early July (Figure 1c). The soil analyzes carried out at the sowing date revealed low levels of available P (Olsen P < 10 mg kg−1) and medium levels of available N (1 g kg−1 < total N < 1.5 g kg−1) at similar levels in both gardens (Table S1).
The comparative analysis of the cultivar performances can give indications on the different strategies for the adaptation to this environmental constraint. Significant statistical interactions between the chickpea genotypes and the growing seasons were reported for the root dry weight (RDW), nodule dry weight (NDW), and nodule number (NN) (Table 1). This indicates that the phenotypic plasticity for the response to the P-deficiency stress within chickpea cultivars exists.
Some cultivars showed quite stable performances, whatever the growing environment, e.g., GHAB5 and FLIP90_13C for RDW (Figure 2c) or ILC32_79 for NN (Figure 2b). Moreover, other cultivars were strongly affected in their agronomical performances by the environmental conditions, e.g., FLIP01_29C for RDW (Figure 2c) or FLIP90_13C and FLIP84_92C for NN (Figure 2b).
The performances in 2019 were significantly lower than in 2018, for most of the studied traits, except for the SDW. This was particularly noticeable for the traits related to the nodulation performance as the NDW and NN (Figure 2a,b). Interestingly, while a large genotypic variation was found in the NN, no statistical difference in the NDW was observed between the different genotypes for each individual year. This might indicate an adaptive mechanism leading to the maintenance of an optimal NDW to support the nodule physiological efficiency at the expense of the number of nodules formed. This putative plant adaptive process to maintain the critical level of the physiological efficiency in a strongly constrained growth environment, was also evidenced for the SDW. For this trait, no significant difference between the genotypes or growing seasons was detected (Figure 2d), evidencing that this functional trait is not plastic. As a result, regardless of the growing conditions and the nodulation performance in terms of the NDW and NN, the chickpea cultivars sustained the growth of the aerial part.
Altogether, these results reveal that adaptive mechanisms exist to maintain the required physiological efficiency of the plant in situations of a P-deficiency.

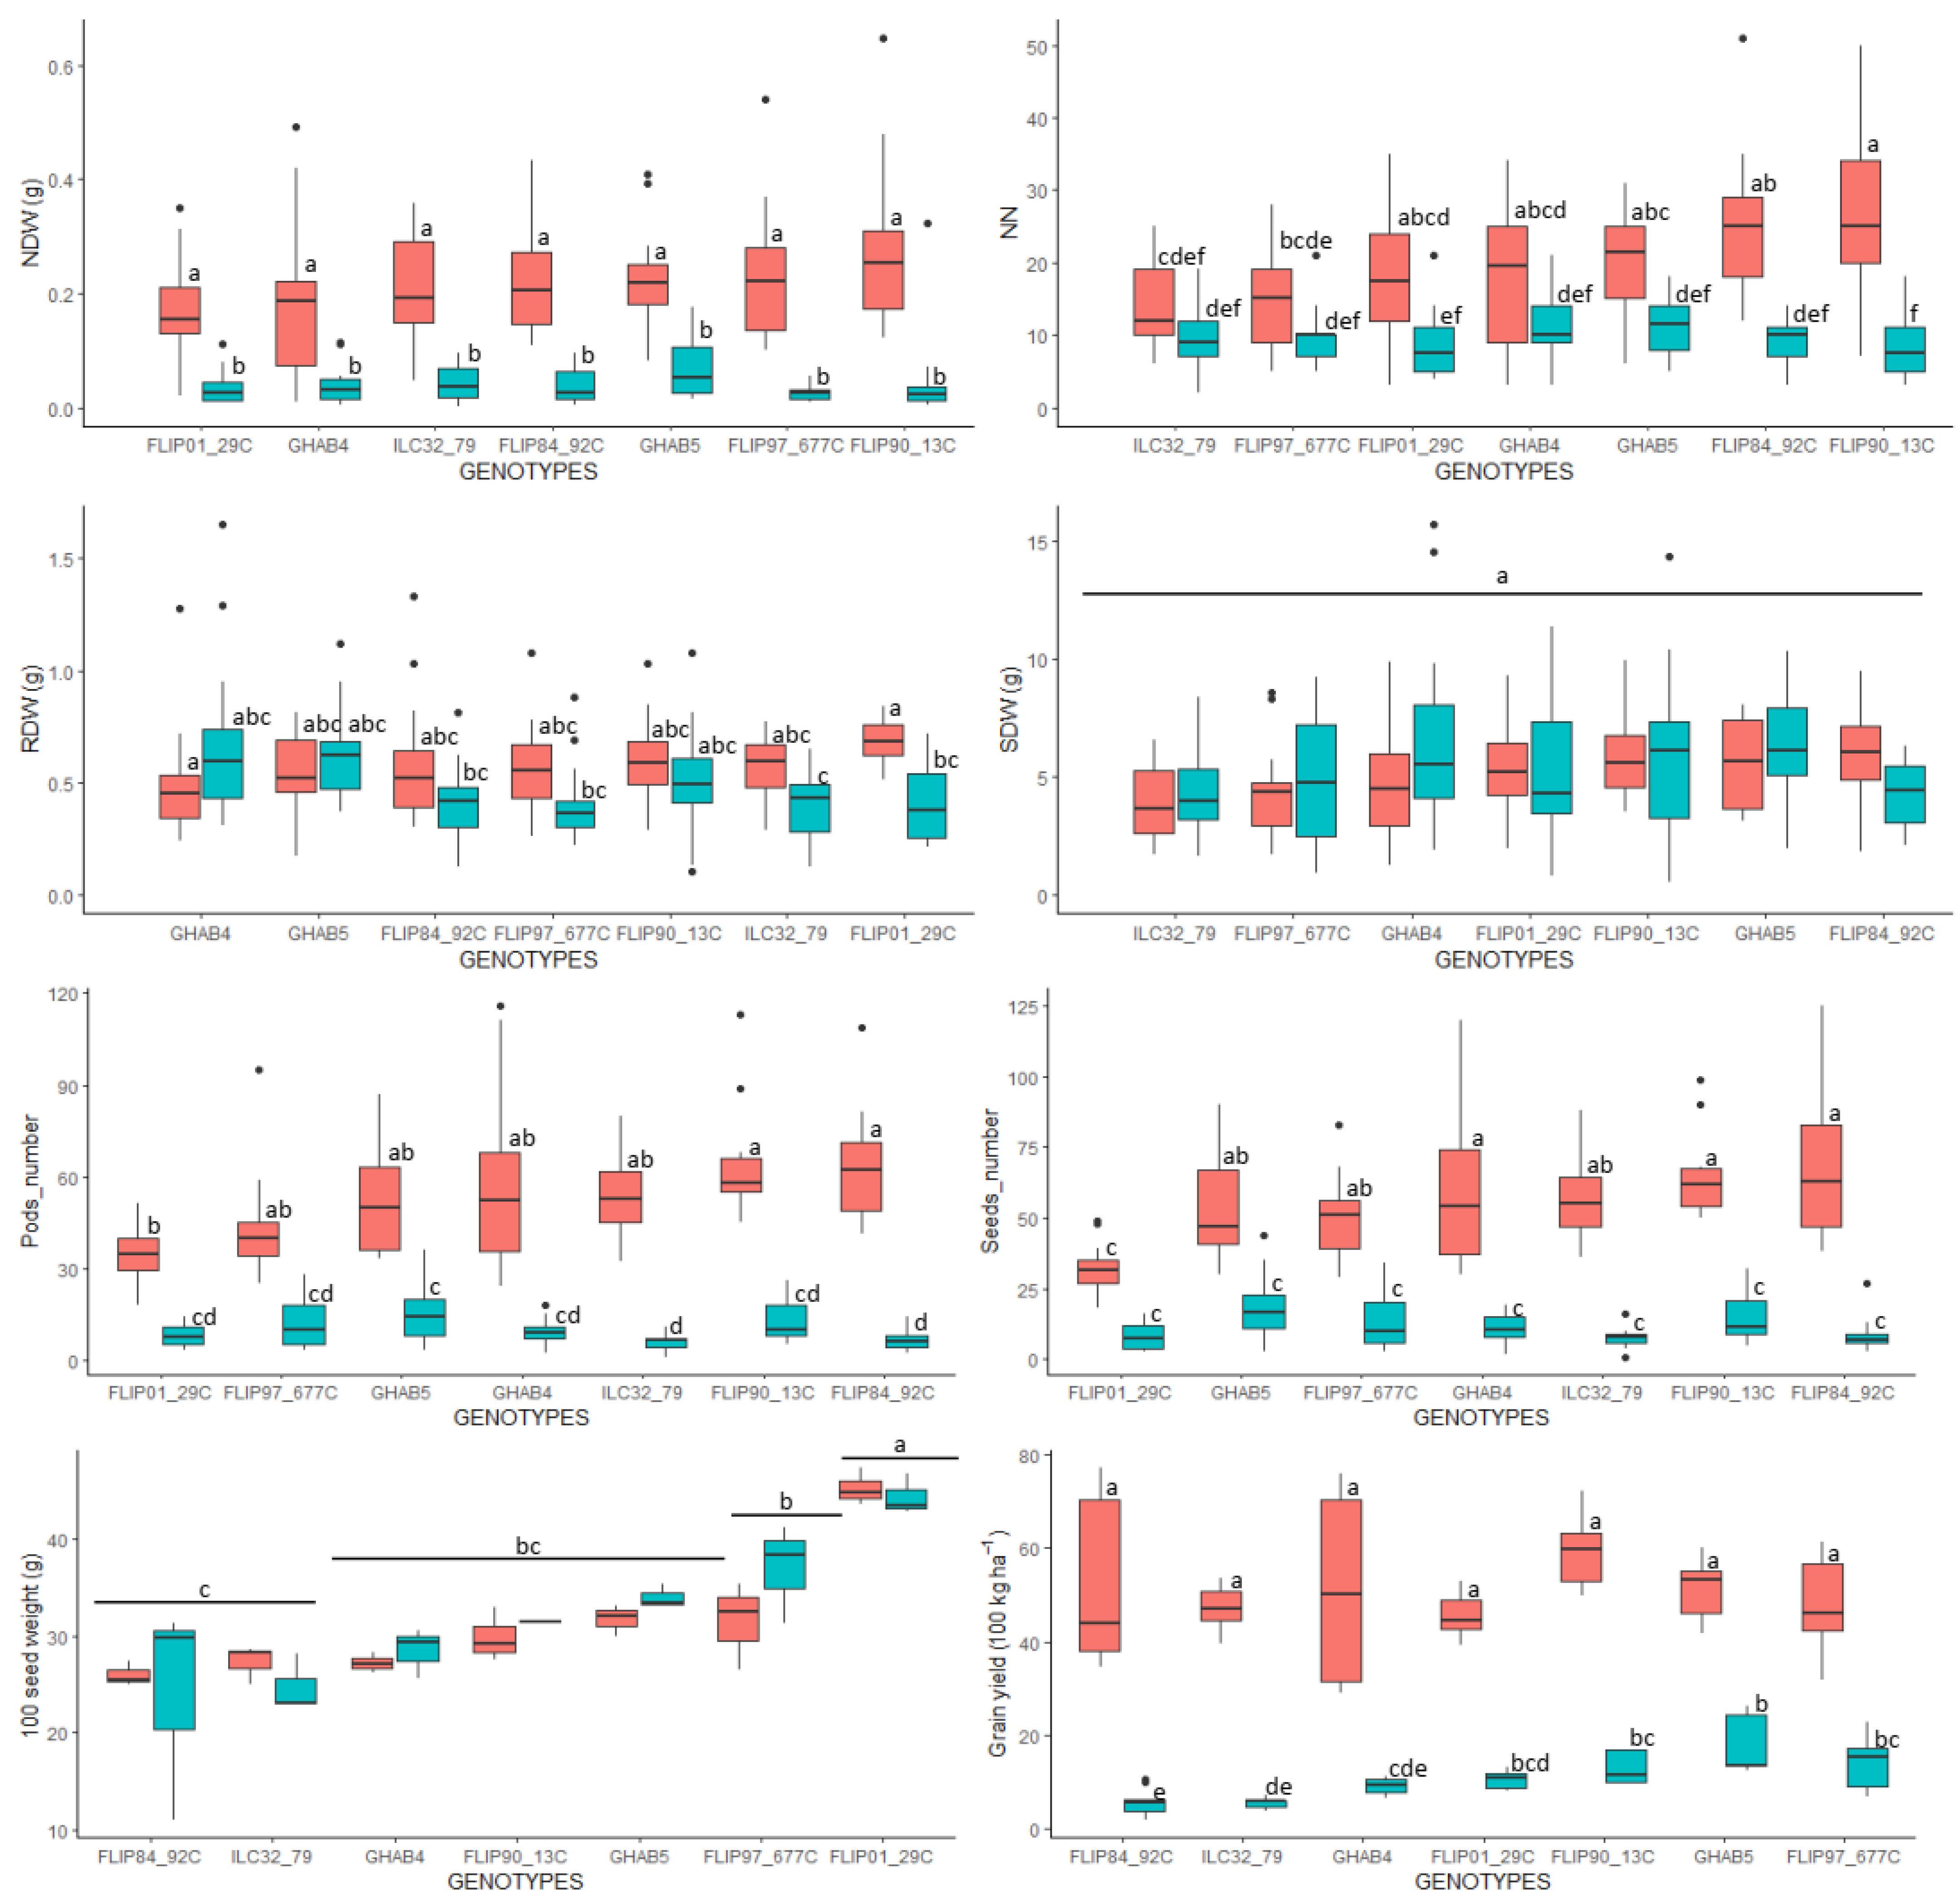
3.2. P-Deficiency Differently Alters the Yield Components but Does Not Impact the Seed Germinability

As shown in Figure 2, the yield components (i.e., pod and seed numbers; 100 seed weight) and grain yield varied across the chickpea cultivars and between the two growing seasons. Significant statistical interactions between the chickpea genotypes and years were reported for the number of pods and seeds and for the grain yield, but not for the 100 seed weight parameter (Table 2).
Interestingly, the three cultivars with the lowest number of pods and seeds, namely FLIP01_29C, FLIP97_677C, and GHAB5, showed the highest 100 seed weight values (Figure 2e–g). In the end, cultivars FLIP97_677C and GHAB5 exhibited the highest grain yield values, especially during the second year (Figure 2h). The cultivar FLIP94_92C was the most sensitive to environmental changes between the two growing seasons. This cultivar, which showed the highest values for the number of pods and seeds in 2018, saw its yield component performances collapse in 2019, resulting in the lowest grain yield value among all cultivars (Figure 2e,f,h).
Similar to the parameters related to the nodulation traits, the significantly higher performances were recorded in 2018 than in 2019 for all traits (p < 0.001), except the 100 seed weight (Table 2 and Figure 2). However, significant differences between the genotypes were observed (p < 0.001), with the 100 seed weight being the highest for FLIP01_29C (45 g 100-seeds−1) and the lowest for ILC32_79 and FLIP84_92C (26 g 100-seeds−1 and 25 g 100-seeds−1, respectively) (Figure 2g). Thus, we note from this analysis that if the grain yield of the cultivars was strongly impacted by unfavorable growing conditions, the weight of the seeds was maintained, regardless of the growing environment. This suggests that the cultivars triggered physiological adaptations to ensure the proper filling of reserves in the grains.
To test if proper filling of reserves in the grains can maximize the germination potential to improve the population survival, we performed an in vitro seed germination assay. The seed germinability was assessed from the seeds collected during the two successive field trials in 2018 and 2019 (Table S3). The germination rates ranged from 93% for FLIP97_677C seeds harvested in 2018, to 99% and 100% for all other samples. No statistically significant difference in the number of germinated seeds was detected, according to the chickpea genotypes and cropping seasons (likelihood ratio test: 4.2415, Chi-square test probability: 0.644). This result validates the hypothesis that, under low-P availability field conditions, all chickpea cultivars develop biological adaptations to maintain the seed germinability and viable offspring production.

3.3. P-Deficiency Can Hinder the Proper Establishment of the Symbiosis in a Cultivar-Dependent Manner

The two common gardens were set up in field plots characterized by a low P availability and a medium N availability in the soil (Table S1). Since no rhizobium inoculation or fertilizer treatment was applied, the chickpea growth and grain yield were entirely dependent on the effective symbiosis with atmospheric N2-fixing rhizobia. These are the typical agro-ecological conditions of the growing region. The nodulation was active, as evidenced by the red color of the nodules, due to the characteristic presence of leghemoglobin in the functional nodules and the N accumulation in plants (Figure S1).
The values of the shoot biomass were plotted against their corresponding nodule biomass, to assess the symbiosis performance. The slopes of the regressions are considered as an estimate of the efficiency in the use of the rhizobial symbiosis (EURS) for the shoot biomass production [11]. The EURS of the tested cultivars varied with the growing season (Table 3).
Cultivars GHAB4 and FLIP84_92C in 2018 and ILC32_79 in 2019, exhibited a good EURS (Table S4). The highest EURS was detected for the ILC32-79 cultivar during the 2019 season (37 g DSW g–1 NDW), despite its low number of nodules (NN) and the nodule dry weight (NDW) (Figure 2a,b). This suggests that this cultivar is able to maximize the N2-dependent aerial growth/nodule mass ratio, despite unfavorable growing conditions. Finally, cultivars such as FLIP01_29C and FLIP97_677C did not show a significant EURS. We hypothesize that the rhizobia strains naturally present in the soils of the experimental sites may not be suitable for these cultivars, because the field plots do not show high levels of nitrogen, which could inhibit the symbiotic N fixation (Table S1).
Nitrogen acquisition was evaluated by measuring the N content of the plants (in the nodules and shoots) and in the soil at the flowering stage. As expected for the legumes, a very high correlation was observed in the N content of the nodules and the shoots while slightly lower correlations were found between these two parameters and the N content of the rhizospheric soil (Figure 3).
Significant statistical interactions between the chickpea genotypes and growing seasons were observed for the plant and soil nitrogen content (Table 3). Generally, much higher nodule and shoot N contents were measured in 2018 than in 2019, while conversely, the soil N content was higher in 2019 than in 2018 (Figure 4). Cultivars GHAB4 and GHAB5 showed quite similar N content values in the nodules and shoots over the two years (Figure 4a,b), indicating that these two cultivars can maintain their ability to fix the atmospheric N2 in the changing environments. Moreover, in 2018, cultivar FLIP90_13C consistently exhibited the highest N concentrations in the nodules (47.1 mg N kg –1 NDW) and shoots (22.8 mg kg –1 SDW) and a high concentration of N in the soil (25.45 mg kg –1) (Figure 4). The N acquisition performance of FLIP90_13C dropped sharply during the 2019 campaign, but its nodule, shoot, and soil N contents were still among the highest values. Thus, this cultivar is a good candidate to initiate a breeding program aimed at improving the acquisition of N, although its ability to acquire N is sensitive to the environment.
Results on the EURS and N acquisition suggest that stressful growing conditions, due to a P-deficiency in the soils, hinder the proper establishment of the symbiosis in a genotype-dependent manner. In addition, not all seven cultivars may be well-adapted to native soil rhizobia populations.

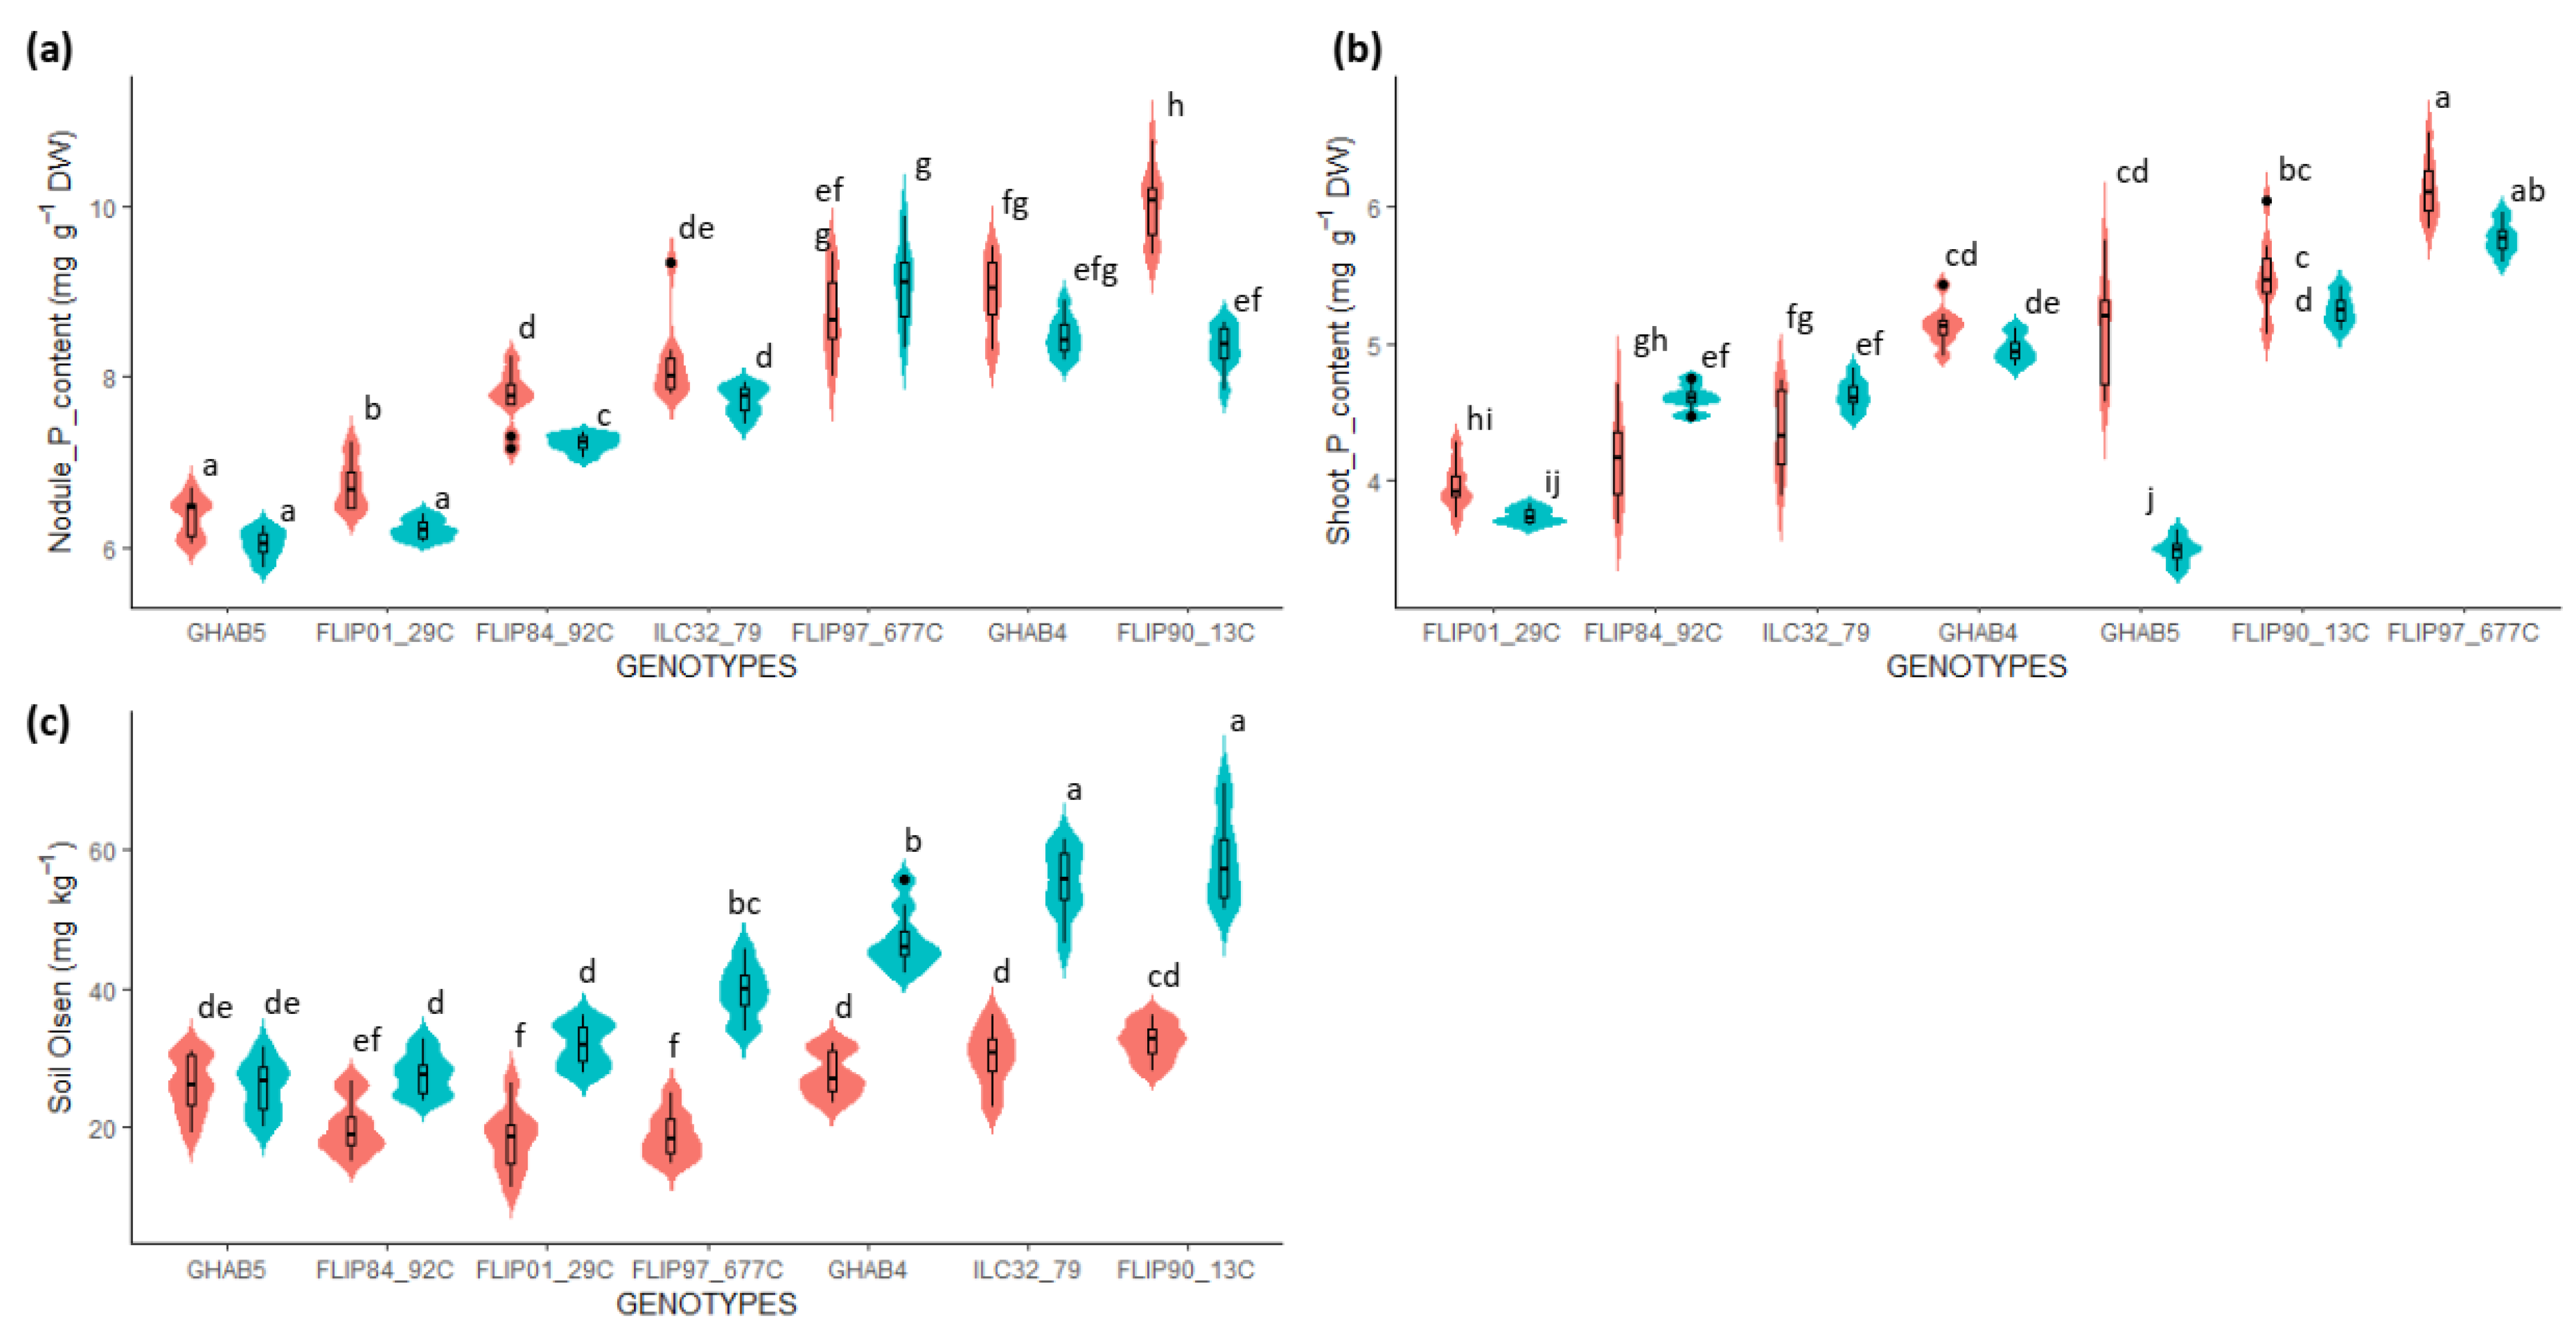
3.4. Phosphorus Acquisition and the Use Efficiency for the Nodule Formation Are Genetically Uncoupled

The P acquisition was assessed by measuring the P content of the plants (in the nodules and shoots) and the bioavailable P extracted in the soil at the flowering stage. As for the N contents, a strong correlation was observed in the P contents of the nodules and the shoots while a weaker correlation was observed between these two parameters and the P content of the soil (Figure 3).
Statistically significant interactions between the chickpea genotypes and growing seasons were observed for all three parameters (p < 0.001, Table 4), indicating that not all seven cultivars showed similar responses to the environmental changes, with respect to the P acquisition.
Cultivars, such as GHAB4, FLIP97_677C, and ILC32_79, have shown a fairly stable performance over the two years for the acquisition of P from the plant (both in the nodules and shoots, Figure 5a,b). Other varieties, such as FLIP90_13C, showed strong alterations in their P content in the nodules and shoots, during the second year. However, despite the significant interaction of G×E, the values of the P content of the plants were generally significantly lower in the second year, while the values of the bioavailable P extracted in the soil were higher (Figure 5). High values of the soil bioavailable P content were not always associated with a higher P content of the nodules and shoots. Overall, these results are similar, although less marked, to what was previously described for the N acquisition parameters.
Although its nodule acquisition of P decreased during the 2019 season, the P contents in the nodules, shoot, and rhizospheric soil of FLIP90_13C, were still among the highest values (Figure 3 and Figure 5). Despite the large differences in the concentrations of the bioavailable P in the soil over the two years, FLIP97_677C and GHAB4 have consistently shown excellent and stable abilities to acquire P in the nodules and shoots (Figure 5). Finally, FLIP01_29C and FLIP84_92C are not well suited to growing under low-P conditions. They both exhibited a low ability to acquire P in the nodules and shoots (Figure 5). They were also the less productive, in terms of the pod and seed numbers in such P-deficient soils (Figure 2).
The ratio of the nodule biomass to the nodule P content allows to estimate the efficiency of the plants in using P for nodulation. The PUE is an important criteria because it is highly correlated to the performances in the yield components (i.e., pod and seed numbers, Figure 3). The PUE for the nodulation varied significantly across the two growing seasons, among the chickpea genotypes, but no G×E interaction was detected (Table 5a). The GHAB4 genotype had the lowest PUE for the nodulation value, while GHAB5 showed the highest value (12.4 to 23.1 mg nodule dry weight mg–1 nodule P content, respectively) (Table 5b). All other cultivars showed statistically similar intermediate PUE values.
Our results showed that the P acquisition and the PUE for the nodule formation are genetically uncoupled (Figure 3). Interestingly, while cultivar GHAB5 significantly showed the lowest ability to acquire P in the nodules (Figure 5a), its good PUE for the nodulation indicates effective physiological abilities to convert the low-P content of the nodules in the growth of the nodules. As such, it may be a good parental line in a breeding program, to specifically improve this latter trait for a good agronomic performance in low-input farming systems.

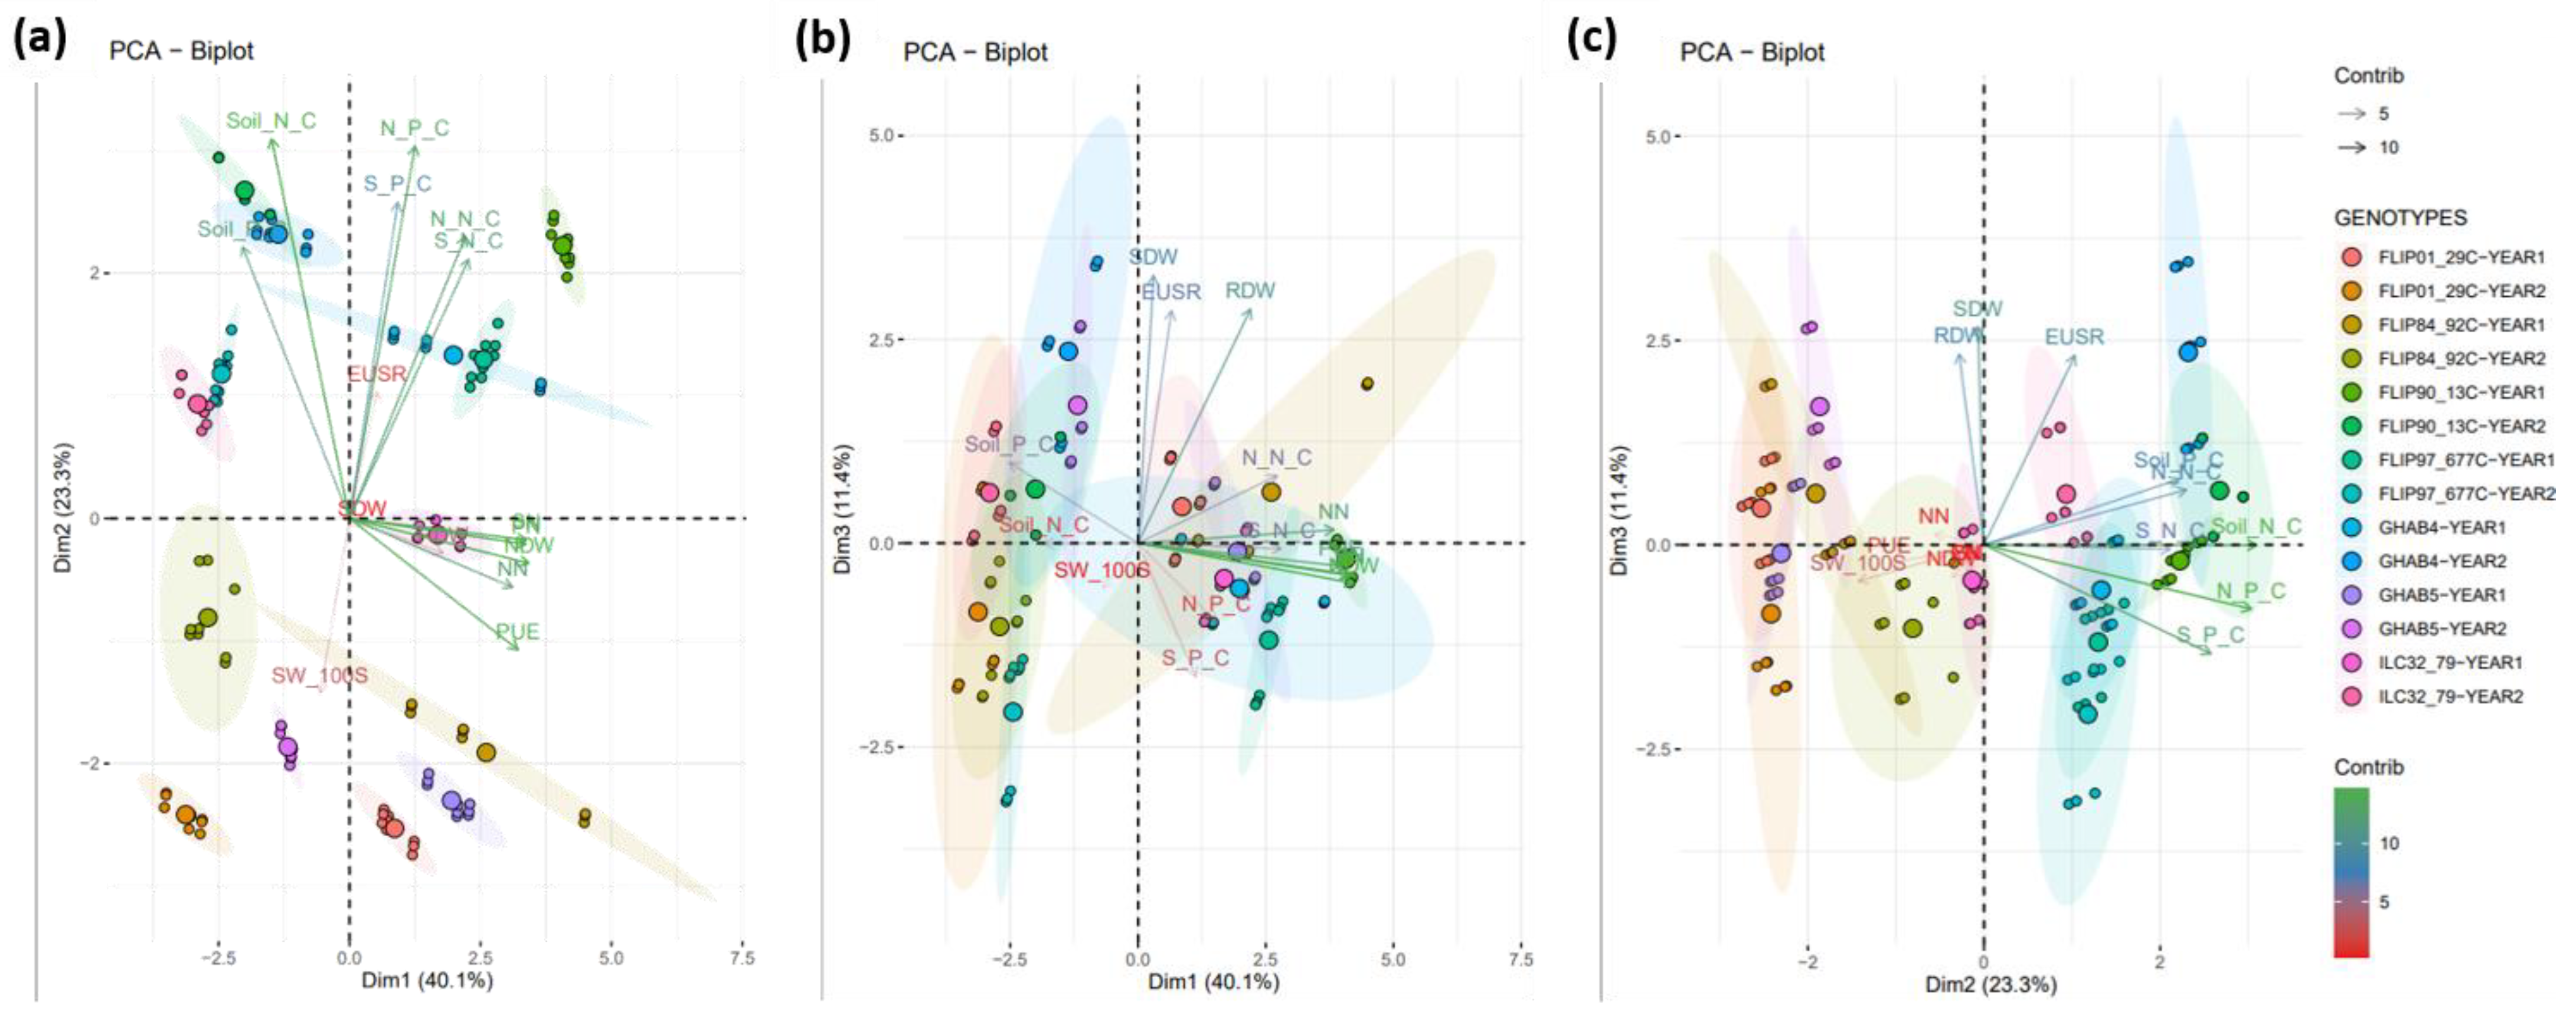
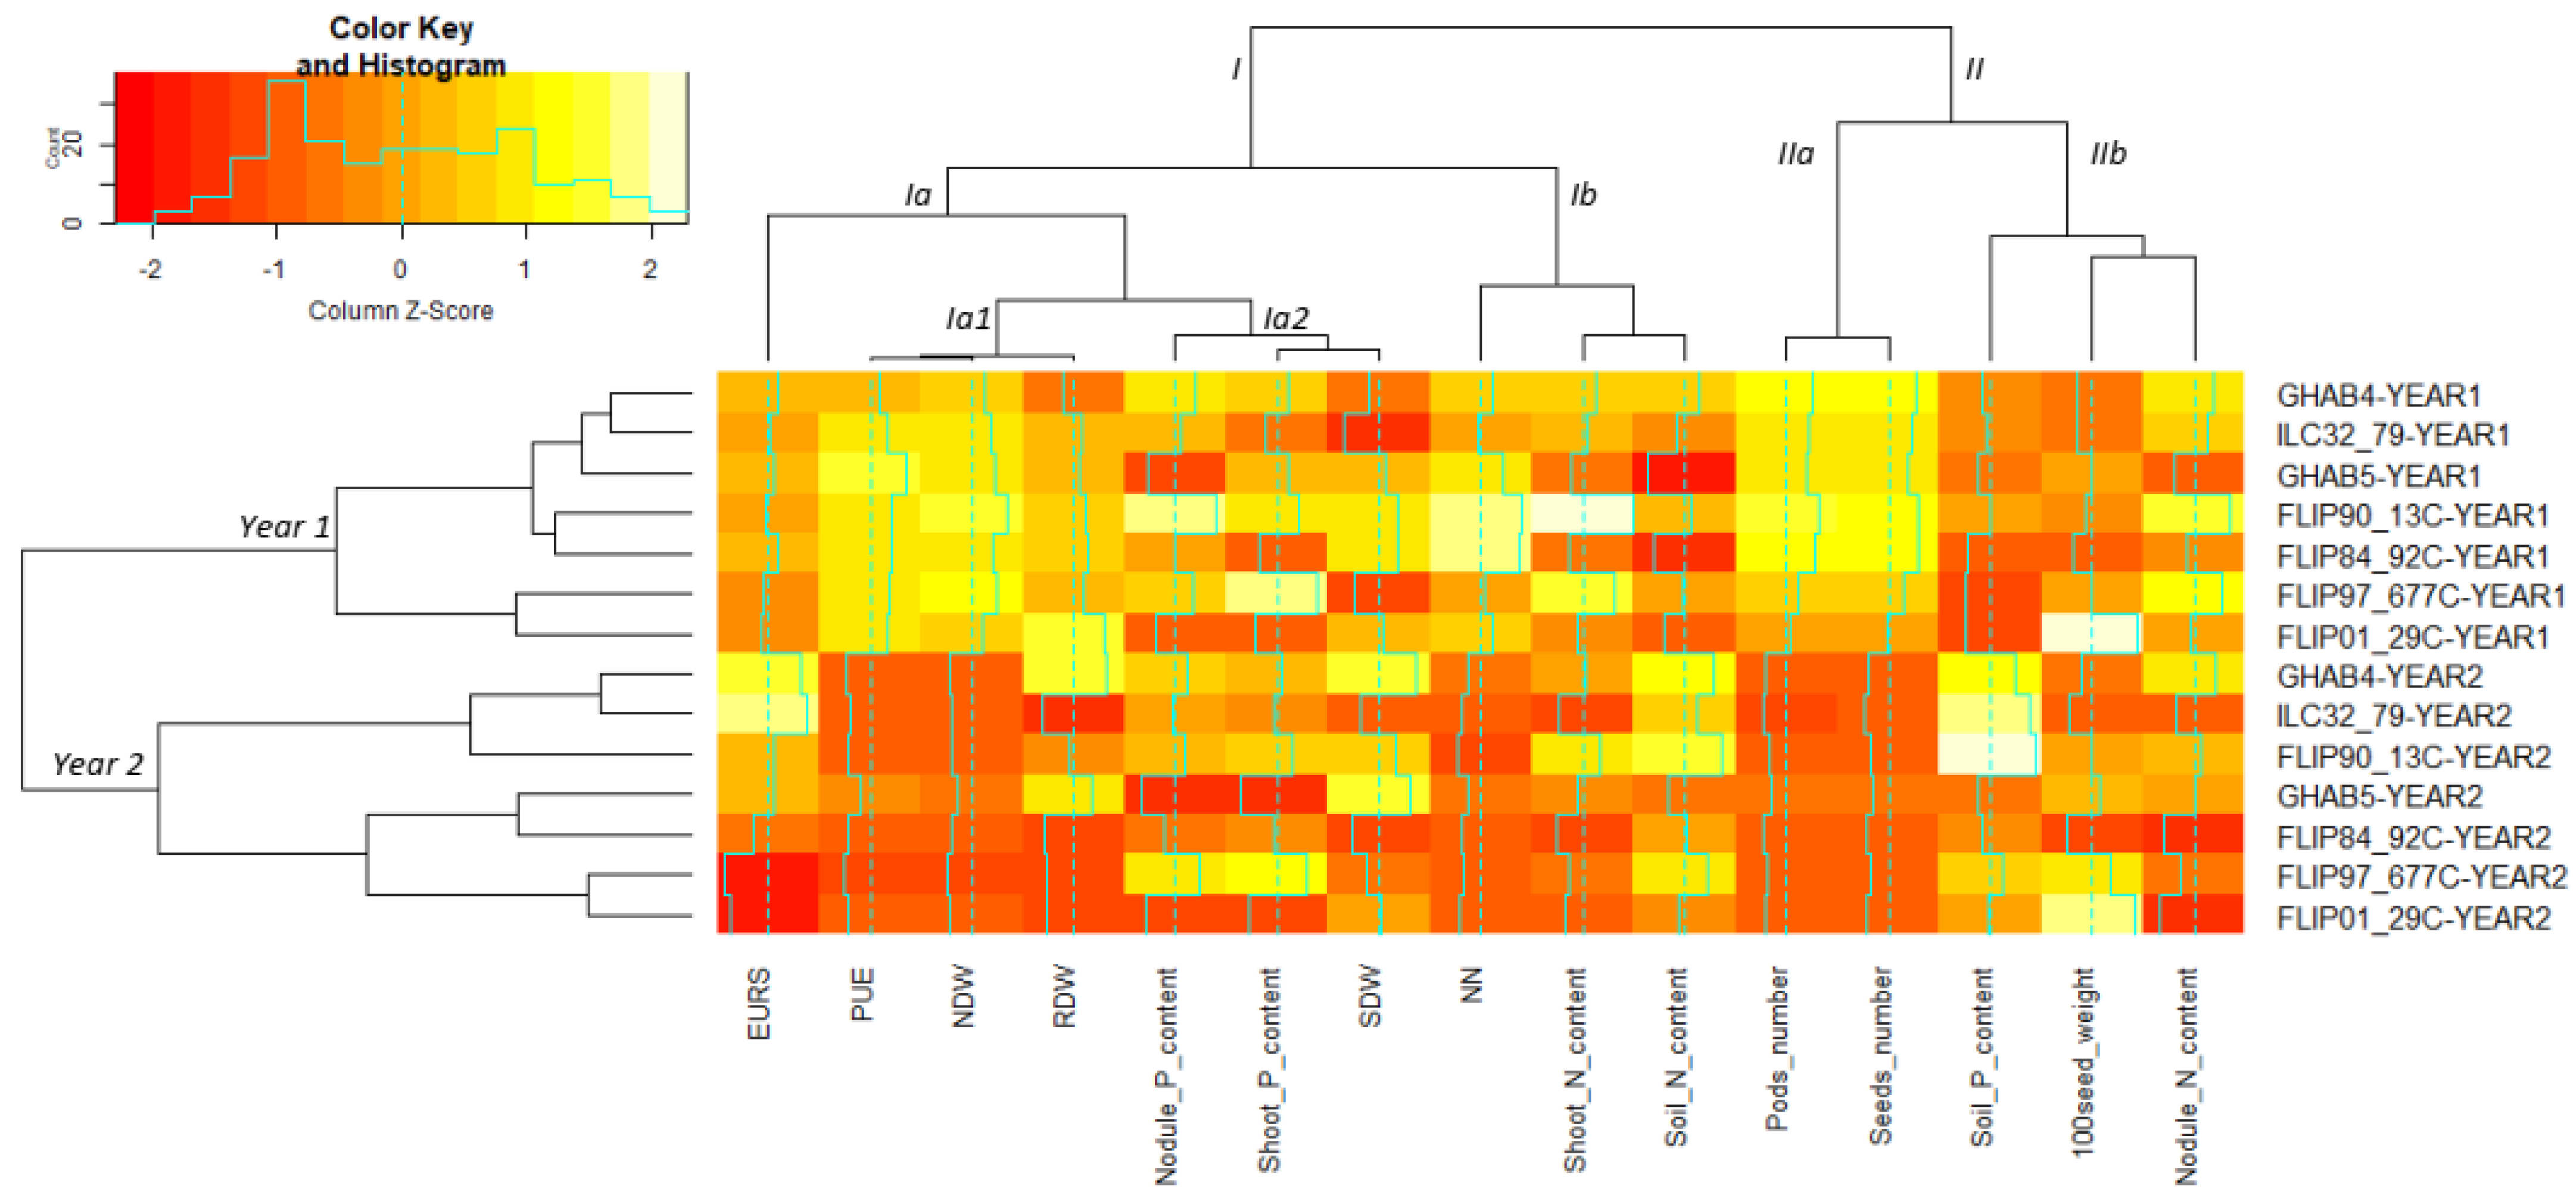
3.5. Functional Integrative Analysis Evidences the Efficient Varieties for Low-Input Agriculture

The aims of the integrative analysis were (i) to identify the relationships between the different traits and as such provide insight into the positively or negatively correlated parameters, and (ii) to find out the key traits for evaluating the low-P stress tolerance.
The hierarchical clustering analysis divided the traits into two distinct groups (Figure 6). Cluster I includes traits primarily associated with plant and tissue growth. Three sub-clusters were identified, which respectively group together (1) the PUE with the NDW and RDW; (2) the SDW with the plant P contents (nodule and shoot); (3) the NN with the shoot and soil N contents. Cluster II is mainly associated to the grain yield components. Cluster IIa groups together the pod and seed numbers, while Cluster IIb closely links the 100 seed weight parameter with the nodule N content and, to a lesser extent, with the soil P content. This finding may help to define the easiest and most useful traits to record, as phenotyping often remains the most expensive and laborious part of the breeding effort. For example, the NDW is a good indicator of the PUE (Figure 3 and Figure 6), thus eliminating the need to further quantify the nodule P content.
The method also distinguished the two growing seasons (Year1 and Year2 clusters in Figure 6) despite the quite similar soil N and P concentrations recorded during the two cropping seasons (Figure 1a, Table S1). This suggests that additional factors, probably related to drought (Figure 1c), contribute to the major environmental variation and shape the plant functional performance under a low-P availability. Moreover, the functional traits related to the shoot development and the weight of 100 seeds showed strong differences between the different cultivars, but less marked contrasts during the two cropping seasons.
Regarding the clustering of the chickpea genotypes, two highly contrasted pairs of cultivars (GHAB4/ILC32_79 and FLIP97_677C/FLIP01_29C, respectively) were consistently grouped over the two years. GHAB4/ILC32_79 showed lower values in the 100 seed weight but higher values in the nodule N content, EURS, and soil P content, than FLIP97_677C/FLIP01_29C. The particular agronomic interest of each pair of cultivars relies on the functional traits linked to the N acquisition and the use efficiency and the ability to solubilize P in the soil, to produce a source of P bioavailable for the plant. Based on this integrative analysis including all 15 measured traits, the other three genotypes GHAB5, FLIP90_13C, and FLIP84_92C, showed intermediate performances and their classification was modified according to the years.

4. Discussion

Nowadays, low input farming systems (LIFSs) that seek to minimize the off-farm inputs and look for the highest efficiency of the on-farm resources are strongly encouraged by a societal demand for eco-responsible agricultural practices [35,36]. This approach still faces several challenges to overcome the low crop efficiency in nutrient-limiting environments. The development of new improved varieties, tolerant to the environmental constraints, is one of the most promising levers to achieve this goal.
In this study, the chickpea genotypes grown under low-P conditions showed a significant variation in all plant traits measured, except the dry weights of the nodules and shoots and the germinability. The traits related to yield (i.e., number of seeds and weight of 100 seeds) and to the acquisition of P and N, were the most contrasting traits. The genetic variation in the P use efficiency in the chickpea has been previously reported under various artificial growing conditions. Using FePO4 as a poorly soluble form of P to mimic P-deficient soils, a significant difference in the plant growth, shoot P content, P acquisition and P use efficiency were revealed among 226 chickpea genotypes grown in pots [37]. Studies based on in pot-culture experiments with soil, with varied levels of added P, highlighted the significant genotypic differences in the root and shoot growth, the P uptake and utilization efficiencies, as well as in the macronutrients uptake (i.e., Zn, Fe, Cu, and Mn), among 20 chickpea genotypes [38]. Significant genotypic variations in the P acquisition and the PUE were observed among 155 chickpea genotypes evaluated under field conditions with and without P fertilization, in Ethiopia [12]. Our approach, under agro-ecological conditions, is consistent with these findings regarding the genotypic variation in the N and P nutrient uptake. This also suggests the relevance of the current set of cultivars to initiate a breeding program to improve the P tolerance in that given production basin, as we evidence the variation in the yield-related agronomic traits in response to the low-P availability. Interestingly, our analysis reveals the maintenance of the nodule biomass and germinability, a point that cannot be addressed easily under artificial conditions using pot cultivation.
P nutrition plays a key role in the nodule development and N2 fixation. A P-deficiency affects the formation of the nodules [39], and negatively impacts the nitrogen fixation process [40,41]. As expected, a strong positive correlation between the nodule P and N concentrations was revealed in our study. To cope with a P-deficiency, plants can implement different strategies aiming either to enhance the P acquisition and uptake or to maintain the P utilization [42]. As reported in various legumes, the nodules are strong P sinks during the P starvation and exhibit a lower percentage of a P decline than other plant organs, to maintain their metabolic functions [13]. A similar pattern is observed in our study as high P concentrations in the nodules were measured together with high nodule-to-shoot P content ratios (from 1.44 for the GHAB5 genotype to 1.77 for ILC32_79). These results support the maintenance of the nodule P homeostasis as one putative adaptive strategy deployed by these chickpeas cultivars to the stressing P-deficiency culture conditions in the trials. The effect of the P deprivation on the nodule number per unit shoot mass may vary, depending on the legume species, genotype, and experimental conditions [40]. In Virgilia divaricate, a tree legume that grows in nutrient-poor soils in the Cape Floristic region (CFA), the biomass of the nodules remained unchanged even if the number of nodules decreased with low-P [42]. Similarly, in our study, the nodule biomass remains constant across all genotypes, although these are differently affected for the number of nodules (Figure 2). Asides from stabilizing the P homeostasis in the plant symbiotic fraction and maintaining the nodule biomass, increasing the PUE for the nodulation is critical for improving the symbiotic efficacy under P-depleted conditions. The observed strong correlation between the PUE and the nodule dry weight (NDW) suggests such an adaptive mechanism in the tested chickpea cultivars to cope with the negative impact of a P-deficiency on the symbiotic N fixation capacities. Our results show that the processes of the P acquisition and utilization efficiencies are genetically uncoupled. This is a key point allowing the designing of distinct breeding strategies to promote one or both components of the PUE, with the aim of developing new varieties of chickpeas tolerant to a P deficiency.
A feature of our study is the severe drought in 2019, revealed by the NDDI analysis. The poor performance, especially in pod and seed numbers, was mainly due to erratic rainfall during the flowering phase (two weeks after the buds set), resulting in occasional drought episodes during this critical development phase in the chickpea. Until now, most studies on the response of legumes to a P-deficiency have been carried out under controlled conditions without drought events. Noticeably, it is reported that under field conditions, stress due to the soil P-deficiency can be further accentuated by drought [16]. Phosphate in the soil diffuses very slowly (about 0.1 mm/day). As the soil’s water content decreases during a drought, the radius of the soil’s pore filled with water also decreases and thus, the P mobility decreases, accordingly [43]. The detrimental interaction between the combined stresses, such as a P-deficiency and drought, is likely to increase in the near future under the effect of climate change. This may be particularly important in semi-arid areas where legume crops are widely grown and which already suffer from severe P-deficiencies.
Nonetheless and remarkably, the seed weight and, ultimately, germinability are maintained regardless of the growing environment while the grain yield is strongly impacted. This suggests that the chickpea cultivars triggered physiological adaptations to an unfavorable growing environment by reducing the pod and seed production, while ensuring the proper filling of reserves in the grains. Such an adaptive strategy can maximize the germination potential to produce the next generation, and therefore population survival. This may suggest that the species is able to convert soil P into appropriate grain characteristics required for a sustained germinability, regardless of the conditions to which it is exposed [44]. The same strategy—maintenance of the good function over number—is also observed for the nodules where the nodule dry weight was conserved while the nodule number decreased under drought stress in the second year.
The genotypic response to a natural P-deficiency varies significantly among the seven chickpea genotypes. This allows us to propose three different breeding strategies, based on the distinctive properties of the cultivars. FLIP90_13C is a good candidate for a first breeding strategy, aiming to simultaneously improving the acquisition of the P and N nutrients. Despite its sensitivity to the changing environmental conditions during the two growing seasons, FLIP90_13C acquired more N and P in the nodules and effectively reallocated these two nutrients to the shoots. It also showed the highest P content available in the rhizospheric soil, highlighting its good ability to solubilize the non-assimilable phosphorus. FLIP90_13C also had the highest number of nodules, which would contribute to the ability to tolerate a P deficiency. Its good capacities for acquiring N and P ultimately result in high performance, in terms of grain and seed production. GHAB4 is an interesting candidate for a second breeding strategy, for stability under changing environments. GHAB4 showed a stable performance for the N and P acquisition over both growing seasons, that differ tremendously in drought events, highlighting its ability to maintain these physiological capabilities. Cultivar FLIP97_677C can be an alternative parent to develop such a strategy. Lastly, a third breeding strategy can be built upon the GHAB5 cultivar, which is particularly interesting for its superior PUE.
Newly described markers linked to the root traits critical for the P-acquisition and the PUE [45] will help to effectively develop P-efficient chickpea varieties. The combination of a genomics-assisted selection approach [17] with a thorough phenotypic evaluation of the key breeding targets can be carried out by taking into account the characteristics of the micronutrient uptake (e.g., zinc and calcium) as well as the metabolic pathways involved in the nodule acclimation under Pi starvation [46,47]. The matching of the rhizobial strains to the host legume variety is also an important factor for maximizing the grain legume productivity [48]. Because the rhizobia strains differ considerably in their tolerance to a P-deficiency [49] or in their ability to solubilize P [50], further studies are also needed to investigate the best-performing interactions between the P-efficient chickpea genotypes and the rhizobial strains in P-deficient soils.

5. Conclusions

A P deficiency differentially affects the functional growth and nodulation traits between chickpea cultivars. This suggests the presence of adaptive mechanisms, to maintain the required physiological efficiency of the plant. A P-deficiency also differently alters the components of the grain yield, but does not impact the seed germinability. Lastly, a P-deficiency can hinder the proper establishment of the symbiosis in a cultivar-dependent manner. The phosphorus acquisition and use efficiency for the nodule formation, two critical traits for optimal growth, are genetically uncoupled in the set of analyzed cultivars. Using the distinctive properties of these cultivars, which are adapted to a given agro-ecological region of Algeria, we propose different breeding strategies to increase the share of the chickpea cultivation as a high N-fixer in low input farming systems. We suggest our approach may contribute to lay out a rationale for initiating targeted breeding programs towards improving the tolerance to the P-deficiency of this very important legume crop.

Supplementary Materials

The following supporting information can be downloaded at: https://www.mdpi.com/article/10.3390/agronomy12123150/s1; Figure S1: Functional nodules as evidenced by the red color of the nodules due to the characteristic presence of leghemoglobin. (a) and (b) FLIP90_1C nodules during the 2018 season, (c) ILC32_79 nodules during the 2019 season; Table S1: Granulometrical and chemical soil properties; Table S2: Names and pedigree of the seven chickpea genotypes under study; Table S3: Assessment of the germinability of the seeds harvested during the two successive growing seasons for the seven chickpea cultivars under study; Table S4: Efficiency in the use of the rhizobial symbiosis (EURS) of the seven chickpea genotypes grown under a low-P availability during two cropping seasons (2018 and 2019).

Author Contributions

Conceptualization; L.G., M.L. and C.B.; experimental data acquisition: S.I.D.; NDDI calculation: R.J.; biostatistical data analyses: S.I.D. and C.B.; writing—original draft preparation; S.I.D., C.B. and L.G.; writing—review and editing; M.R. and M.L.; supervision; C.B., L.G. and M.L.; funding acquisition; L.G. and M.L. All authors have read and agreed to the published version of the manuscript.

Funding

This work was financially supported by the Algerian-French PHC Tassili collaborative project (Code PHC: 18MDU101, Code Campus France: 40031YA).

Data Availability Statement

The data that support the findings of this study are available upon request from the authors.

Acknowledgments

We thank the Technical Institute for Field Crops (ITGC, Algeria) for kindly providing the seeds of the chickpea cultivars under study.

Conflicts of Interest

The authors declare no conflict of interest. The funders had no role in the design of the study; in the collection; analyses; or interpretation of the data; in the writing of the manuscript; or in the decision to publish the results.

Appendix A. Normalized Difference Drought Index (NDDI) Calculation

The NDDI is a combination remote sensing-derived vegetation condition index that has been found to be more sensitive to drought in agricultural conditions, when compared with other drought indices [22]. It is called a combination index since it derived as a normalized difference of two other satellite-based indices—the normalized difference vegetation index (NDVI), which is an indicator of the vegetation health or greenness, and the normalized difference water index (NDWI), which is an indicator of the moisture content in the vegetation canopy. For this study, the Google Earth Engine (GEE) [https://earthengine.google.com, accessed on 30 April 2022] cloud computing platform was used to derive the three indices. The multi-spectral data from the European Space Agency’s Sentinel 2 satellite platform, at a spatial resolution of 20 m and a temporal resolution of 10 days, formed the underlying data for computing the indices. The Sentinel imagery over the study areas from the start of the particular year until the end of the harvest (July) were filtered to eliminate those in which an excess of 30% of the pixels are covered by clouds. The three indices are computed as:
NDVI = (NIR − Red)/(NIR + Red) = (B8 − B4)/(B8 + B4) = (ρ_800 − ρ_670)/(ρ_800 + ρ_670)
NDWI = (SWIR − Green)/(SWIR + Green) = (B11 − B3)/(B11 + B3) = (ρ_1600 − ρ_560)/(ρ_1600 + ρ_560)
NDDI = (NDVI − NDWI)/(NDVI + NDWI)
where NIR: near-infrared band; SWIR: short-wave infrared band; red, green: red and green bands; B#: band number particular to Sentinel 2 and ρ_w: wavelength of the band in the electromagnetic spectrum.
The NDDI values computed above are then scaled to the range [−1, 1], for easier comprehension.

References

  1. Plaxton William, L.H. Annual Plant Reviews, Phosphorus Metabolism in Plants; Wiley-Blackwell: Hoboken, NJ, USA, 2015; Volume 48, ISBN 9780123643193. [Google Scholar]
  2. Tiziani, R.; Pii, Y.; Celletti, S.; Cesco, S.; Mimmo, T. Phosphorus Deficiency Changes Carbon Isotope Fractionation and Triggers Exudate Reacquisition in Tomato Plants. Sci. Rep. 2020, 10, 15970. [Google Scholar] [CrossRef] [PubMed]
  3. Bargaz, A.; Zaman-allah, M.; Farissi, M.; Lazali, M. Physiological and Molecular Aspects of Tolerance to Environmental Constraints in Grain and Forage Legumes. Int. J. Mol. Sci. 2015, 16, 18976–19008. [Google Scholar] [CrossRef] [Green Version]
  4. Lazali, M.; Bargaz, A. Examples of Belowground Mechanisms Enabling Legumes to Mitigate Phosphorus Deficiency. In Legume Nitrogen Fixation in Soils with Low Phosphorus Availability; Springer International Publishing: Cham, Switzerland, 2017; pp. 135–152. ISBN 9783319557298. [Google Scholar]
  5. Wen, Z.; Pang, J.; Tueux, G.; Liu, Y.; Shen, J.; Ryan, M.H.; Lambers, H.; Siddique, K.H.M. Contrasting Patterns in Biomass Allocation, Root Morphology and Mycorrhizal Symbiosis for Phosphorus Acquisition among 20 Chickpea Genotypes with Different Amounts of Rhizosheath Carboxylates. Funct. Ecol. 2020, 34, 1311–1324. [Google Scholar] [CrossRef]
  6. Tiziani, R.; Puschenreiter, M.; Smolders, E.; Mimmo, T.; Herrera, J.C.; Cesco, S.; Santner, J. Millimetre-Resolution Mapping of Citrate Exuded from Soil-Grown Roots Using a Novel, Low-Invasive Sampling Technique. J. Exp. Bot. 2021, 72, 3513–3525. [Google Scholar] [CrossRef]
  7. Kohli, P.S.; Kumar Verma, P.; Verma, R.; Parida, S.K.; Thakur, J.K.; Giri, J. Genome-Wide Association Study for Phosphate Deficiency Responsive Root Hair Elongation in Chickpea. Funct. Integr. Genom. 2020, 20, 775–786. [Google Scholar] [CrossRef] [PubMed]
  8. Prodhan, M.A.; Finnegan, P.M.; Lambers, H. How Does Evolution in Phosphorus-Impoverished Landscapes Impact Plant Nitrogen and Sulfur Assimilation? Trends Plant Sci. 2019, 24, 69–82. [Google Scholar] [CrossRef] [PubMed]
  9. Lazali, M.; Blavet, D.; Pernot, C.; Desclaux, D.; Drevon, J.J. Efficiency of Phosphorus Use for Dinitrogen Fixation Varies between Common Bean Genotypes under Phosphorus Limitation. Agron. J. 2017, 109, 283–290. [Google Scholar] [CrossRef]
  10. Han, Y.; White, P.J.; Cheng, L. Mechanisms for Improving Phosphorus Utilization Efficiency in Plants. Ann. Bot. 2022, 129, 247–258. [Google Scholar] [CrossRef]
  11. Lazali, M.; Brahimi, S.; Jacques, J. Rhizosphere High Yields in a Low-P Tolerant Recombinant Inbred Line of Common Bean under Fi Eld Conditions. Rhizosphere 2018, 8, 27–33. [Google Scholar] [CrossRef]
  12. Keneni, G.; Bekele, E.; Assefa, F.; Imtiaz, M.; Debele, T. Characterization of Ethiopian Chickpea (Cicer arietinum L.) Germplasm Accessions for Phosphorus Uptake and Use Efficiency II. Interrelationships of Characters and Gains from Selection. Ethiop. J. Appl. Sci. Technol. 2015, 6, 77–96. [Google Scholar]
  13. Sulieman, S.; Tran, L.S.P. Phosphorus Homeostasis in Legume Nodules as an Adaptive Strategy to Phosphorus Deficiency. Plant Sci. 2015, 239, 36–43. [Google Scholar] [CrossRef]
  14. Drevon, J.J.; Abadie, J.; Alkama, N.; Andriamananjara, A.; Amenc, L.; Bargaz, A.; Carlssonn, G.; Jaillard, B.; Lazali, M.; Ghoulam, C.; et al. Phosphorus Use Efficiency for N2 Fixation in the Rhizobial Symbiosis with Legumes. Biol. Nitrogen Fixat. 2015, 1–2, 455–464. [Google Scholar] [CrossRef]
  15. Abdelrahman, M.; El-sayed, M.A.; Hashem, A.; Valentine, A.J. Metabolomics and Transcriptomics in Legumes Under Phosphate Deficiency in Relation to Nitrogen Fixation by Root Nodules. Front. Plant Sci. 2018, 9, 922. [Google Scholar] [CrossRef] [PubMed] [Green Version]
  16. Pang, J.; Ryan, M.H.; Lambers, H.; Siddique, K.H. Phosphorus Acquisition and Utilisation in Crop Legumes under Global Change. Curr. Opin. Plant Biol. 2018, 45, 248–254. [Google Scholar] [CrossRef] [PubMed]
  17. Varshney, R.K.; Roorkiwal, M.; Sun, S.; Bajaj, P.; Chitikineni, A.; Thudi, M.; Singh, N.P.; Du, X.; Upadhyaya, H.D.; Khan, A.W.; et al. A Chickpea Genetic Variation Map Based on the Sequencing of 3366 Genomes. Nature 2021, 599, 622–627. [Google Scholar] [CrossRef]
  18. Giller, K.E. Nitrogen fixation in tropical cropping systems; CAB International: Wallingford, UK, 2001. [Google Scholar]
  19. Khaitov, B.; Abdiev, A. Performance of chickpea (Cicer arietinum L.) to bio-fertilizer and nitrogen application in arid condition. J. Plant Nutr. 2018, 41, 1980–1987. [Google Scholar] [CrossRef]
  20. Alem, C.; Asres, T. Participatory evaluation and selection of chickpea varieties at Debre Mawi and Debre Yakob watersheds, Western Amhara Region, Ethiopia. In Proceedings of the Harnessing Chickpea Value Chain for Nutrition Security and Commercialization of Smallholder Agriculture in Africa, Debre Zeit, Ethiopia, 30 January–1 February 2014; Korbu, L., Damte, T., Fikre, A., Eds.; 2016; pp. 163–167. [Google Scholar]
  21. Ullah, A.; Farooq, M.; Rehman, A.; Hussain, M.; Siddique, K.H.M. Zinc Nutrition in Chickpea (Cicer arietinum): A Review. Crop Pasture Sci. 2020, 71, 199–218. [Google Scholar] [CrossRef]
  22. Abebe, T.N.; Beyene, S.; Hawassa, E. Growth Limiting Nutrient(s) and Their Effects on the Yield and Nutrient Uptake of Chickpea (Cicer arietinum L.) in Nitisols, Southern Ethiopia. J. Environ. Earth Sci. 2021, 11, 12. [Google Scholar] [CrossRef]
  23. Lazali, M.; Boudsocq, S.; Taschen, E.; Farissi, M.; Hamdi, W.; Ralli, P.; Sentenac, H. Crosymed Project: Enhancing Nutrient Use Efficiency through Legumes in Agroecosystems of the Mediterranean Basin. Sustainability 2021, 13, 4695. [Google Scholar] [CrossRef]
  24. Gu, Y.; Brown, J.F.; Verdin, J.P.; Wardlow, B. A Five-Year Analysis of MODIS NDVI and NDWI for Grassland Drought Assessment over the Central Great Plains of the United States. Geophys. Res. Lett. 2007, 34, 1–6. [Google Scholar] [CrossRef] [Green Version]
  25. Du, T.L.T.; Du Bui, D.; Nguyen, M.D.; Lee, H. Satellite-Based, Multi-Indices for Evaluation of Agricultural Droughts in a Highly Dynamic Tropical Catchment, Central Vietnam. Water 2018, 10, 659. [Google Scholar] [CrossRef]
  26. Latati, M.; Blavet, D.; Alkama, N.; Laoufi, H.; Drevon, J.J.; Gérard, F.; Pansu, M.; Ounane, S.M. The Intercropping Cowpea-Maize Improves Soil Phosphorus Availability and Maize Yields in an Alkaline Soil. Plant Soil 2014, 385, 181–191. [Google Scholar] [CrossRef]
  27. Yong, T.W.; Chen, P.; Dong, Q.; Du, Q.; Yang, F.; Wang, X.; Liu, W.C.; Yang, W.Y. Optimized Nitrogen Application Methods to Improve Nitrogen Use Efficiency and Nodule Nitrogen Fixation in a Maize-Soybean Relay Intercropping System. J. Integr. Agric. 2018, 17, 664–676. [Google Scholar] [CrossRef]
  28. Zhang, J.; Peng, S.; Shang, Y.; Brunel, B.; Li, S.; Zhao, Y.; Liu, Y.; Chen, W.; Wang, E.; Singh, R.P.; et al. Genomic Diversity of Chickpea-Nodulating Rhizobia in Ningxia (North Central China) and Gene Flow within Symbiotic Mesorhizobium Muleiense Populations. Syst. Appl. Microbiol. 2020, 43, 126089. [Google Scholar] [CrossRef] [PubMed]
  29. Aydi, S.; Drevon, J.J.; Abdelly, C. Effect of Salinity on Root-Nodule Conductance to the Oxygen Diffusion in the Medicago Truncatula-Sinorhizobium Meliloti Symbiosis. Plant Physiol. Biochem. 2004, 42, 833–840. [Google Scholar] [CrossRef]
  30. Kjeldahl, J. New method for the determination of nitrogen in organic substances. Fresenius J. Anal. Chem. 1883, 22, 366–383. [Google Scholar] [CrossRef] [Green Version]
  31. Walkley, A.; Armstrong, B.I. An examination of the Degtjareff method for determining soil organic matter, and a proposed modification of the chromic acid titration method. Soil Sci. 1934, 37, 29–38. [Google Scholar] [CrossRef]
  32. Olsen, Sterling Robertson. Estimation of Available Phosphorus in Soils by Extraction with Sodium Bicarbonate; No. 939; US Department of Agriculture: Washington, DC, USA, 1954.
  33. Valizadeh, G.R.; Rengel, Z.; Rate, A.W. Response of wheat genotypes efficient in P utilisation and genotypes responsive to P fertilisation to different P banding depths and watering regimes. Aust. J. Agric. Res. 2003, 54, 59–65. [Google Scholar] [CrossRef]
  34. Team RC. R: A Language and Environment for Statistical Computing. In R Foundation for Statistical Computing [Internet]; Team RC: Vienna, Austria, 2021; Available online: https://www.R-project.org/ (accessed on 8 December 2022).
  35. Sarkar, D.; Kar, S.K.; Chattopadhyay, A.; Shikha; Rakshit, A.; Tripathi, V.K.; Dubey, P.K.; Abhilash, P.C. Low Input Sustainable Agriculture: A Viable Climate-Smart Option for Boosting Food Production in a Warming World. Ecol. Indic. 2020, 115, 106412. [Google Scholar] [CrossRef]
  36. Cesco, S.; Lucini, L.; Miras-Moreno, B.; Borruso, L.; Mimmo, T.; Pii, Y.; Puglisi, E.; Spini, G.; Taskin, E.; Tiziani, R.; et al. The Hidden Effects of Agrochemicals on Plant Metabolism and Root-Associated Microorganisms. Plant Sci. 2021, 311, 111012. [Google Scholar] [CrossRef]
  37. Pang, J.; Megan, H.; Lambers, H.; Siddique, K.H.M. Leaf Transpiration Plays a Role in Phosphorus Acquisition among a Large Set of Chickpea Genotypes. Plant Cell Environ. 2018, 41, 2069–2079. [Google Scholar] [CrossRef] [PubMed]
  38. Srinivasarao, C.; Ganeshamurthy, A.; Ali, M.; Venkateswarlu, B. Phosphorus and Micronutrient Nutrition of Chickpea Genotypes in a Multi-Nutrient-Deficient Typic Ustochrept. J. Plant Nutr. 2006, 29, 747–763. [Google Scholar] [CrossRef]
  39. Liu, A.; Contador, C.A.; Fan, K.; Lam, H.M. Interaction and Regulation of Carbon, Nitrogen, and Phosphorus Metabolisms in Root Nodules of Legumes. Front. Plant Sci. 2018, 871, 1860. [Google Scholar] [CrossRef] [PubMed] [Green Version]
  40. Valentine, A.J.; Kleinert, A.; Benedito, V.A. Adaptive Strategies for Nitrogen Metabolism in Phosphate Deficient Legume Nodules. Plant Sci. 2017, 256, 46–52. [Google Scholar] [CrossRef]
  41. Zerihun, A. On-Farm Yield Variability and Responses of Common Bean (Phaseolus vulgaris L.) Varieties to Rhizobium Inoculation with Inorganic Fertilizer Rates. J. Anim. Plant Sci. 2017, 32, 5120–5133. [Google Scholar]
  42. Stevens, G.G.; Pérez-Fernández, M.A.; Morcillo, R.J.L.; Kleinert, A.; Hills, P.; Brand, D.J.; Steenkamp, E.T.; Valentine, A.J. Roots and Nodules Response Differently to P Starvation in the Mediterranean-Type Legume Virgilia Divaricata. Front. Plant Sci. 2019, 10, 73. [Google Scholar] [CrossRef] [Green Version]
  43. Farooq, M.; Gogoi, N.; Barthakur, S.; Baroowa, B.; Bharadwaj, N.; Alghamdi, S.S. Drought Stress in Grain Legumes during Reproduction and Grain Filling. J. Agron. Crop Sci. 2016, 203, 81–102. [Google Scholar] [CrossRef]
  44. Adusei, G.; Aidoo, M.K.; Srivastava, A.K.; Asibuo, J.Y.; Gaiser, T. The Variability of Grain Yield of Some Cowpea Genotypes in Response to Phosphorus and Water Stress under Field Conditions. Agronomy 2021, 11, 28. [Google Scholar] [CrossRef]
  45. Thudi, M.; Chen, Y.; Pang, J.; Kalavikatte, D.; Bajaj, P.; Roorkiwal, M.; Chitikineni, A.; Ryan, M.H.; Lambers, H.; Siddique, K.H.M.; et al. Novel Genes and Genetic Loci Associated With Root Morphological Traits, Phosphorus-Acquisition Efficiency and Phosphorus-Use Efficiency in Chickpea. Front. Plant Sci. 2021, 12, 636973. [Google Scholar] [CrossRef]
  46. Sulieman, S.; Kusano, M.; Van Ha, C.; Watanabe, Y.; Abdalla, M.A.; Abdelrahman, M.; Kobayashi, M.; Saito, K.; Mühling, K.H.; Tran, L.S.P. Divergent Metabolic Adjustments in Nodules Are Indispensable for Efficient N2 Fixation of Soybean under Phosphate Stress. Plant Sci. 2019, 289, 110249. [Google Scholar] [CrossRef]
  47. Sulieman, S.; Abdelrahman, M.; Tran, L.S.P. Carbon Metabolic Adjustment in Soybean Nodules in Response to Phosphate Limitation: A Metabolite Perspective. Environ. Exp. Bot. 2022, 196, 104810. [Google Scholar] [CrossRef]
  48. Allito, B.; Nana, E.-M.; Alemneh, A. Rhizobia Strain and Legume Genome Interaction Effects on Nitrogen Fixation and Yield of Grain Legume: A Review. Mol. Soil Biol. 2015, 6, 1–12. [Google Scholar] [CrossRef]
  49. Marra, L.M.; de Oliveira-Longatti, S.M.; Soares, C.R.F.S.; Olivares, F.L.; de Souza Moreira, F.M. The Amount of Phosphate Solubilization Depends on the Strain, C-Source, Organic Acids and Type of Phosphate. Geomicrobiol. J. 2019, 36, 232–242. [Google Scholar] [CrossRef]
  50. Mabrouk, Y.; Hemissi, I.; Salem, I.B.; Mejri, S.; Saidi, M.; Belhadj, O. Potential of rhizobia in improving nitrogen fixation and yields of legumes. Symbiosis 2018, 107, 73495. [Google Scholar]
Figure 1. Geographic and pedoclimatic description of the field experimental sites. Localization of the experimental sites in Boumadfaa, Algeria, for the two cropping seasons (latitude 36°21′23.5″ N and longitude 2°29′16.5″ E for the 2018 trial, latitude 36°21′48.4″ N and longitude 2°27′46.9″ E for the 2019 trial). (a) The total nitrogen (N) and bioavailable phosphorus (Olsen P) contents of the soil are indicated for the two trials. More detailed information on the soil characteristics is available in Table S1. Ombrothermic diagram during the two growing seasons, 2018 (solid line) and 2019 (dotted line). (b) Monthly rainfall (mm) and mean air temperatures (°C) recorded under the field conditions are plotted with the precipitation scale = 2 × temperature scale. The sowing dates for the two growing seasons are indicated in italics. (c) Normalized difference drought index (NDDI). Positive NDDI means drought, negative means no drought.
Agronomy 12 03150 g001
Figure 2. Evaluation of the plant growth, nodulation performances and yield components of the seven chickpea cultivars grown under low-P availability field conditions during two cropping seasons. Nodule biomass (a), nodule number (b), and roots and shoot biomass (c,d) were measured at the flowering stage while pod numbers (e), seed numbers (f), 100 seed weights (g), and grain yield (h) were recorded at grain maturity, from eighteen replicates for each of the two growing seasons in 2018 (red) and 2019 (blue). The distribution of these continuous variables is plotted using boxplots that display the median, first and third quartiles, and outliers. Letters identify significantly different groups, according to the Tukey test for multiple mean comparisons at p = 0.05. NDW, nodule dry weight; NN, nodule number; RDW, root dry weight; SDW, shoot dry weight.
Agronomy 12 03150 g002
Figure 3. Principal component analysis of fifteen plant functional traits for seven chickpea genotypes grown under a phosphorus deficiency soil, during two growing seasons. (ac) panels correspond to the biplots of different combinations of the three first dimensions. The graph was obtained using the fviz_pca_biplot function of the factoextra package of the R software. NDW, RDW, SDW, nodule, root and shoot dry weight; NN, PN, SN, nodule, pod, and seed number; SW_100S, 100 seed weight, PUE, phosphorus use efficiency and EURS, efficiency in use of the rhizobial symbiosis; N_P_C, S_P_C, Soil_P_C, N_N_C, S_N_C and Soil_N_C, nodule, shoot and soil P and N content, respectively.
Agronomy 12 03150 g003
Figure 4. Evaluation of the nitrogen acquisition of the seven chickpea cultivars grown under low-P availability field conditions during the two cropping seasons. Nodule (a), shoot (b) and soil (c) nitrogen content are represented. Data were recorded from nine replicates for each of the two growing seasons from 2018 (red) to 2019 (blue). Letters identify significantly different groups, according to the Tukey test for the multiple mean comparisons at p = 0.05.
Agronomy 12 03150 g004
Figure 5. Evaluation of the phosphorus acquisition of the seven chickpea cultivars grown under low-P availability field conditions during two growing seasons. Nodule (a), shoot (b) and soil (c) phosphorus content are represented. Data were recorded from nine replicates for each of the two growing seasons from 2018 (red) to 2019 (blue). Letters identify significantly different groups, according to the Tukey test for the multiple mean comparisons at p = 0.05. DW, dry weight.
Agronomy 12 03150 g005
Figure 6. Hierarchical clustering analysis of the 15 plant functional parameters of the seven chickpea genotypes through two growing seasons, from 2018 to 2019, grown in field conditions under a low-soil P availability. The hierarchical clustering for the chickpea genotypes, based on the plant biomass (SDW, RDW), yield components (pod and seed numbers), nutrient acquisition (P and N content in the nodules and shoots), the nodulation (nodules number and biomass, rhizobial symbiosis efficiency), and the soil N and P availability parameters, was computed, based on the Pearson correlations. Z-scores were calculated and used to generate the heatmap. Dendrogram on the left shows the relationships between the chickpea genotypes and the growing seasons, according to the different plant functional parameters. Dendrogram on the upper part shows the relationships between the parameters, according to the performance pattern of the chickpea genotypes. Yellow color indicates a high value and the orange color indicates a low value. The graph was obtained using the heatmap.2 function of the gplot package of R software. SDW, shoot dry weight; RDW, root dry weight; NDW, nodule dry weight; NN, nodule number; PUE, phosphorus use efficiency and EURS, efficiency in the use of the rhizobial symbiosis.
Agronomy 12 03150 g006
Table 1. Analyses of variance for the plant growth and nodulation of seven chickpea genotypes grown under a low-P availability.
SDW (g)RDW (g)NDW (g)NN
Source of VariationDFMSF ValuePr(>F)MSF ValuePr(>F)MSF ValuePr(>F)MSF ValuePr(>F)
genotype60.542.720.01 *0.032.090.05 .0.023.090.006 **0.262.680.02 *
year10.020.120.730.2419.591.47 × 10−5 ***2.86508.33<2.2 × 10⁻¹⁶ ***12.65132.25<2 × 10⁻¹⁶ ***
block (year)40.512.550.04 *0.032.220.07.0.046.238.77 × 10−5 ***0.192.010.09 .
genotype × year60.341.710.120.086.928.80 × 10−7 ***0.012.260.04 *0.444.630.0002 ***
residuals2340.20 0.01 0.01 0.10
Field experiments with the seven genotypes of chickpea were conducted in random complete block design (RCBD) with three blocks, during two growing seasons from 2018 to 2019, under a P-deficiency soil. Data on the plant growth and nodulation parameters were measured at the flowering stage. Data were analyzed using a two-way ANOVA with interaction with a fixed effects model. To homogenize the variances and normalize the residuals of the ANOVA, Box–Cox power transformations (obtained using the boxcox function of the MASS R package) were used if necessary. SDW, shoot dry weight; RDW, root dry weight; NDW, nodule dry weight; NN, nodule number; DF, degree of freedom; MS, mean square; Pr(>F), p-value. Signif. codes: 0 ‘***’ 0.001 ‘**’ 0.01 ‘*’ 0.05 ‘.’ 0.1 ‘ ’ 1.
Table 2. Analyses of variance for the grain yield components of the seven chickpea genotypes grown under a low-P availability.
Pod NumbersSeed Numbers
Source of VariationDFMSF ValuePr(>F)MSF ValuePr(>F)
genotype60.615.721.67 × 10−5 ***0.776.116.95 × 10−6 ***
year193.71879.78<2.2 × 10⁻¹⁶ ***91.41723.74<2.2 × 10⁻¹⁶ ***
block (year)40.312.870.02 *0.292.320.06 .
genotype × year60.595.572.35 × 10−5 ***0.524.080.0007 ***
residuals1950.11 0.13
100 Seed Weights (g) Grain Yield (100 kg ha−1)
Source of VariationDFMSF ValuePr(>F)DFMSF ValuePr(>F)
genotype61,309,44832.192.44 × 10−10 ***60.6310.295.38 × 10−9 ***
year148,3121.190.29182.231340.47<2.2 × 10⁻¹⁶ ***
block (year)459,8571.470.2440.376.060.0002 ***
genotype × year643,6751.070.4160.437.082.24 × 10−6 ***
residuals2440,680 1080.06
Field experiments with the seven genotypes of chickpea were conducted in random complete block design (RCBD) with three blocks, during two growing seasons from 2018 to 2019, under a P-deficiency soil. Data on the grain yield components were recorded at grain maturity. Data were analyzed using a two-way ANOVA with interaction with a fixed effects model. To homogenize the variances and normalize the residuals of the ANOVA, Box–Cox power transformations (obtained using the boxcox function of the MASS R package) were used if necessary. DF, degree of freedom; MS, mean square; Pr(>F), P-value. Signif. codes: 0 ‘***’ 0.001 ‘**’ 0.01 ‘*’ 0.05 ‘.’ 0.1 ‘ ’ 1.
Table 3. Analysis of variance for the nitrogen acquisition of the seven chickpea genotypes grown under a low-P availability.
Nodule N Content (mg kg−1)Shoot N Content (mg kg−1)Soil N Content (mg kg−1)
Source of VariationDFMSF Value Pr(>F)MSF Value Pr(>F)MSF Value Pr(>F)
genotype652.6470,973.88<2.2 × 10⁻¹⁶ ***11.1425,156.44<2.2 × 10⁻¹⁶ ***204,3713527.49<2 × 10⁻¹⁶ ***
year1110.71149,280.35<2.2 × 10⁻¹⁶ ***22.9051,709.79<2 × 10⁻¹⁶ ***501,7418660.16<2 × 10⁻¹⁶ ***
block (year)40.0333.63<2.2 × 10⁻¹⁶ ***0.00010.160.96951.640.17
genotype × year621.2328,624.30<2.2 × 10⁻¹⁶ ***2.325228.35<2.2 × 10⁻¹⁶ ***7547130.27<2 × 10⁻¹⁶ ***
residuals1080.001 0.0004 58
Field experiments with the seven genotypes of chickpea were conducted in random complete block design (RCBD) with three blocks, during two growing seasons from 2018 to 2019, under a P-deficiency soil. Data were harvested at the flowering stage and analyzed using a two-way ANOVA with interaction with a fixed effects model. To homogenize the variances and normalize the residuals of the ANOVA, the following transformations were used: (shoot N content (mg kg−1))0.8, (shoot N content (mg kg−1))2. N, nitrogen; DW, dry weight; DF, degree of freedom; MS, mean square; Pr(>F), P-value. Signif. codes: 0 ‘***’ 0.001 ‘**’ 0.01 ‘*’ 0.05 ‘.’ 0.1 ‘ ’ 1.
Table 4. Analysis of variance for the phosphorus acquisition of the seven chickpea genotypes grown under a low-P availability.
Nodule P Content (mg g−1)Shoot P Content (mg g−1)Soil P Content (mg kg−1)
Source of VariationDFMSF ValuePr(>F)MSF ValuePr(>F)MSF ValuePr(>F)
genotype60.003338.85<2.2 × 10⁻¹⁶ ***0.10202.94<2.2 × 10⁻¹⁶ ***131.3289.97<2 × 10⁻¹⁶ ***
year10.00192.443.51 × 10−16 ***0.0250.311.43 × 10−10 ***750.15513.93<2 × 10⁻¹⁶ ***
block (year)40.000021.730.150.00010.280.894.082.790.03 *
genotype × year60.00019.323.17 × 10−8 ***0.0250.95<2.2 × 10⁻¹⁶ ***35.0924.04<2 × 10⁻¹⁶ ***
residuals1080.00001 0.0005 1.46
Field experiments with the seven genotypes of chickpea were conducted in a random complete block design (RCBD) with three blocks, during two growing seasons, from 2018 to 2019, under a-P deficiency soil. Data were harvested at the flowering stage and analyzed using a two-way ANOVA with interaction with a fixed effects model. To homogenize the variances and normalize the residuals of the ANOVA, the following transformations were used: (nodule P content (mg g−1 DW))−1.3, (shoot P content (mg g−1 DW))0.3 and (soil P content (mg kg−1))0.7. P, phosphorus; DW, dry weight; DF, degree of freedom; MS, mean square; Pr(>F), P-value. Signif. codes: 0 ‘***’ 0.001 ‘**’ 0.01 ‘*’ 0.05 ‘.’ 0.1 ‘ ’ 1.
Table 5. (a) Analysis of variance for the P use efficiency (PUE) for the N fixation of the seven chickpea genotypes grown under a low-P availability. (b) Multiple mean comparisons of the PUE of the seven chickpea genotypes grown in the field under a P-deficiency soil, over two seasons in 2018 and 2019.
(a) P Use Efficiency
Source of VariationDFMSF valuePr(>F)
genotype60.00013.040.02 *
year10.005216.561.65 × 10−13 ***
block (year)40.000020.840.51
genotype × year60.000010.490.81
residuals240.00002
(b)GenotypeP Use Efficiency
GHAB40.0124 a
FLIP97_677C0.0147 ab
ILC32_790.0153 ab
FLIP01_29C0.0154 ab
FLIP90_13C0.0160 ab
FLIP84_92C0.0165 ab
GHAB50.0231 b
Field experiments with the seven genotypes of chickpea were conducted in random complete block design (RCBD), with three blocks during two growing seasons, from 2018 to 2019, under a P-deficiency soil. Data for the PUE for the N fixation (i.e., ratio of the nodule biomass: nodule P content, expressed in (mg NDW (mg kg−1)−1) were recorded at the flowering stage and analyzed using a two-way ANOVA with interaction with a fixed effects model. Letters identify significantly different groups, according to the Tukey test for the multiple mean comparisons at p = 0.05. P, phosphorus; DF, degree of freedom; MS, mean square; Pr(>F), P-value; NDW, nodule dry weight. Signif. codes: 0 ‘***’ 0.001 ‘**’ 0.01 ‘*’ 0.05 ‘.’ 0.1 ‘ ’ 1.
Publisher’s Note: MDPI stays neutral with regard to jurisdictional claims in published maps and institutional affiliations.

