Article

The Application of Fertilizer Phosphorus Affected Olsen P and the Phosphorus Fractions of Hedley Method in Black Soil

1
College of Tropical Crops, Hainan University, Haikou 570228, China
2
Key Laboratory of Arable Land Quality Monitoring and Evaluation, Ministry of Agriculture and Rural Affairs, Institute of Agricultural Resources and Regional Planning, Chinese Academy of Agricultural Sciences, Beijing 100081, China
3
Heilongjiang Academy of Black Soil Conservation and Utilization, Harbin 150086, China
4
Jilin Academy of Agricultural Sciences, Changchun 130033, China
5
Institute of Eco-Environment and Industrial Technology, Shanxi Agricultural University, Taiyuan 030031, China
*
Authors to whom correspondence should be addressed.
Agronomy 2022, 12(12), 3146; https://doi.org/10.3390/agronomy12123146
Submission received: 8 November 2022 / Revised: 5 December 2022 / Accepted: 7 December 2022 / Published: 11 December 2022

Abstract

:
Olsen phosphorus (Olsen P) is an important indicator of soil labile phosphorus. Determining the effect of fertilization on Olsen P and P fractions (labile phosphorus, medium labile phosphorus and stable phosphorus) can guide the application of phosphate fertilizer. Therefore, it is of great significance to clarify the changes of Olsen P and P fractions and the influencing factors under long-term fertilization. This study investigated changes in Olsen P and P fractions in haplic phaeozems soils (0–20 cm) in two 30-year fertilization sites (Harbin, Gongzhuling) of northern China. Four treatments were examined: treatment with no fertilizer or manure (CK), nitrogen and potassium (NK), nitrogen, phosphorus and potassium (NPK), and manure, nitrogen, phosphorus and potassium (MNPK). The results showed that after NK application, Olsen P decreased by an average of 1.5 mg kg−1 for every 100 kg ha−2 of soil phosphorus lost due to continuous phosphorus uptake by the crop; with NPK, Olsen P increased by an average of 17.6 mg kg−1 for every 100 kg ha−2 of P surplus; with MNPK, the increase curve of Olsen P was similar to an S-curve with periods of rapid growth and periods of equilibrium. In the equilibrium period of Olsen P, the equilibrium values were 52.0 and 156.2 mg kg−1 in Harbin and Gongzhuling. After 20 years of long-term different fertilization, labile P (LP), medium labile P (MLP) and stable P (SP) decreased by 21.1, 16.6 and 15.1 mg kg−1 on average for the treatment without P application (NK), and the percentage decreases were 2.8, 5.7 and 2.1%, respectively. With the treatment of NPK, LP and MLP increased by 25.5 and 79.2 mg kg−1, and the percentage increases were 1.8 and 16.1%. With the treatment of MNPK, the increase in LP and MLP was significantly higher than that with NPK. Soil organic carbon (SOC), total nitrogen (TN) and carbon/nitrogen (C/N) had the greatest effects on Olsen P and P fractions and the total contribution rate was >40%. In summary, fertilization system caused significant changes in Olsen P and P fractions. After about 20 years of long-term combined application of MNPK, the growth of Olsen P can be kept constant. SOC and TN had important effects on Olsen P and P fractions in black soil. Therefore, the application of phosphorus fertilizer should be adjusted according to the type and time of fertilization in black soil in order to avoid waste of phosphorus fertilizer.

1. Introduction

Phosphorus (P) application is an important way to increase soil Olsen P in farmland. Analyzing Olsen P and P fractions (labile P, medium labile P and stable P) and predicting their change trends can guide the application of P fertilizer and improve crop yield [1,2]. The application of P caused a large amount of P accumulation in farmland. Unreasonable fertilization will lead to the continuous increase in Olsen P, which will increase the risk of P loss in the rainy season, resulting in waste of resources and environmental pollution [3,4,5]. Therefore, it is necessary to clarify the effect of fertilization on Olsen P and P fractions, so the change in Olsen P can be calculated by fitting the equation, which can predict the recent change and provide data for fertilization. By calculating the P budget, we can know the accumulation and loss of P in the soil. On this basis, we can summarize the annual profit and loss, so as to accurately determine the accumulated budget P of farmland [6,7]. Therefore, different fertilization treatments for long-term experiments (>15 years) are selected to calculate the change in Olsen P per 100 kg ha−2 of soil P budget, predict their future change trends and adjust the fertilizer application [8]. Previous studies have shown that long-term application of phosphate fertilizer leads to a univariate or bivariate linear increase in Olsen P [9], and that the combined application of manure and N, P and K fertilizers is an effective way to improve fertility [10]. However, long-term continuous fertilization causes constant changes in Olsen P and P fractions, which we predict should be phased. Therefore, we need to reevaluate and predict the changes of Olsen P and fractions in soil, so as to provide a theoretical basis for the rational utilization of P fertilizer.
To clarify the impact of fertilizer application on Olsen P in cropland, researchers focused on understanding the relationship between the Olsen P increasing trend and P surplus, so as to avoid large P surplus and reduce fertilizer costs [11,12]. Shen (2014) established a linear equation to explain the relationship between Olsen P and P surplus after 15 years of fertilizer application, and considered that the combined application of manure and chemical P fertilizer was a better fertilization method to increase Olsen P [8]. During 16–22 years of continuous fertilization, the increasing trend of Olsen P was fast first and then slow, and the fitted relationship was a bilinear equation [10]. However, if long-term continuous application of organic fertilizer and chemical P can keep the increase in Olsen P unchanged, this fertilization method should be improved. In conclusion, these results showed that the increase in Olsen P changed over time, and whether its increase trend was phased needs to be evaluated again.
Tiessen’s modified Hedley method was widely used to evaluate the fractions of P [13,14]. The study on P fractions showed that the application of P fertilizer could increase soil labile P and medium labile P significantly, and labile P decreased without P application [1,15]. Most of the previous studies focused on the change in P fractions. At the same time, the change in its proportion should also be paid attention to, because the change in its proportion can better reflect the proportion of different P fractions in total P. Therefore, a comprehensive study of the dynamic changes of P fractions and their proportions can better reflect the impact of fertilization on phosphorus in soil. However, the change trends of Olsen P, P fractions and P fractions proportion corresponding P components in soil are yet to be clarified. Earlier studies showed climate, soil properties and fertilizers all affect the change in P in soil [4,16,17]. Under the same climate conditions, fertilization can directly affect soil P, and also indirectly affect P by affecting soil organic carbon, total nitrogen and pH [18,19]. Therefore, it is necessary to understand the dynamic changes of soil Olsen P, P fractions and the proportion of P fractions under different fertilization conditions and to clarify the impact of soil properties on them.
The black soils in Harbin and Gongzhuling are rich in humus, which are common in Northeast of China. Because black soil is fertile, unreasonable fertilization will cause resource waste and environmental pollution. Therefore, understanding the change trends of Olsen P and P fractions and identifying their influencing factors will help to guide fertilization strategies and optimize the application of P fertilizers. The objectives of this study were: (1) to reevaluate the growth trend and component changes of Olsen P after long-term fertilization in black soil; (2) to investigate the effects of physical and chemical properties of black soil on Olsen P and P fractions; (3) to provide data support for the rational application of P fertilizers in black soil.

2. Material and Methods

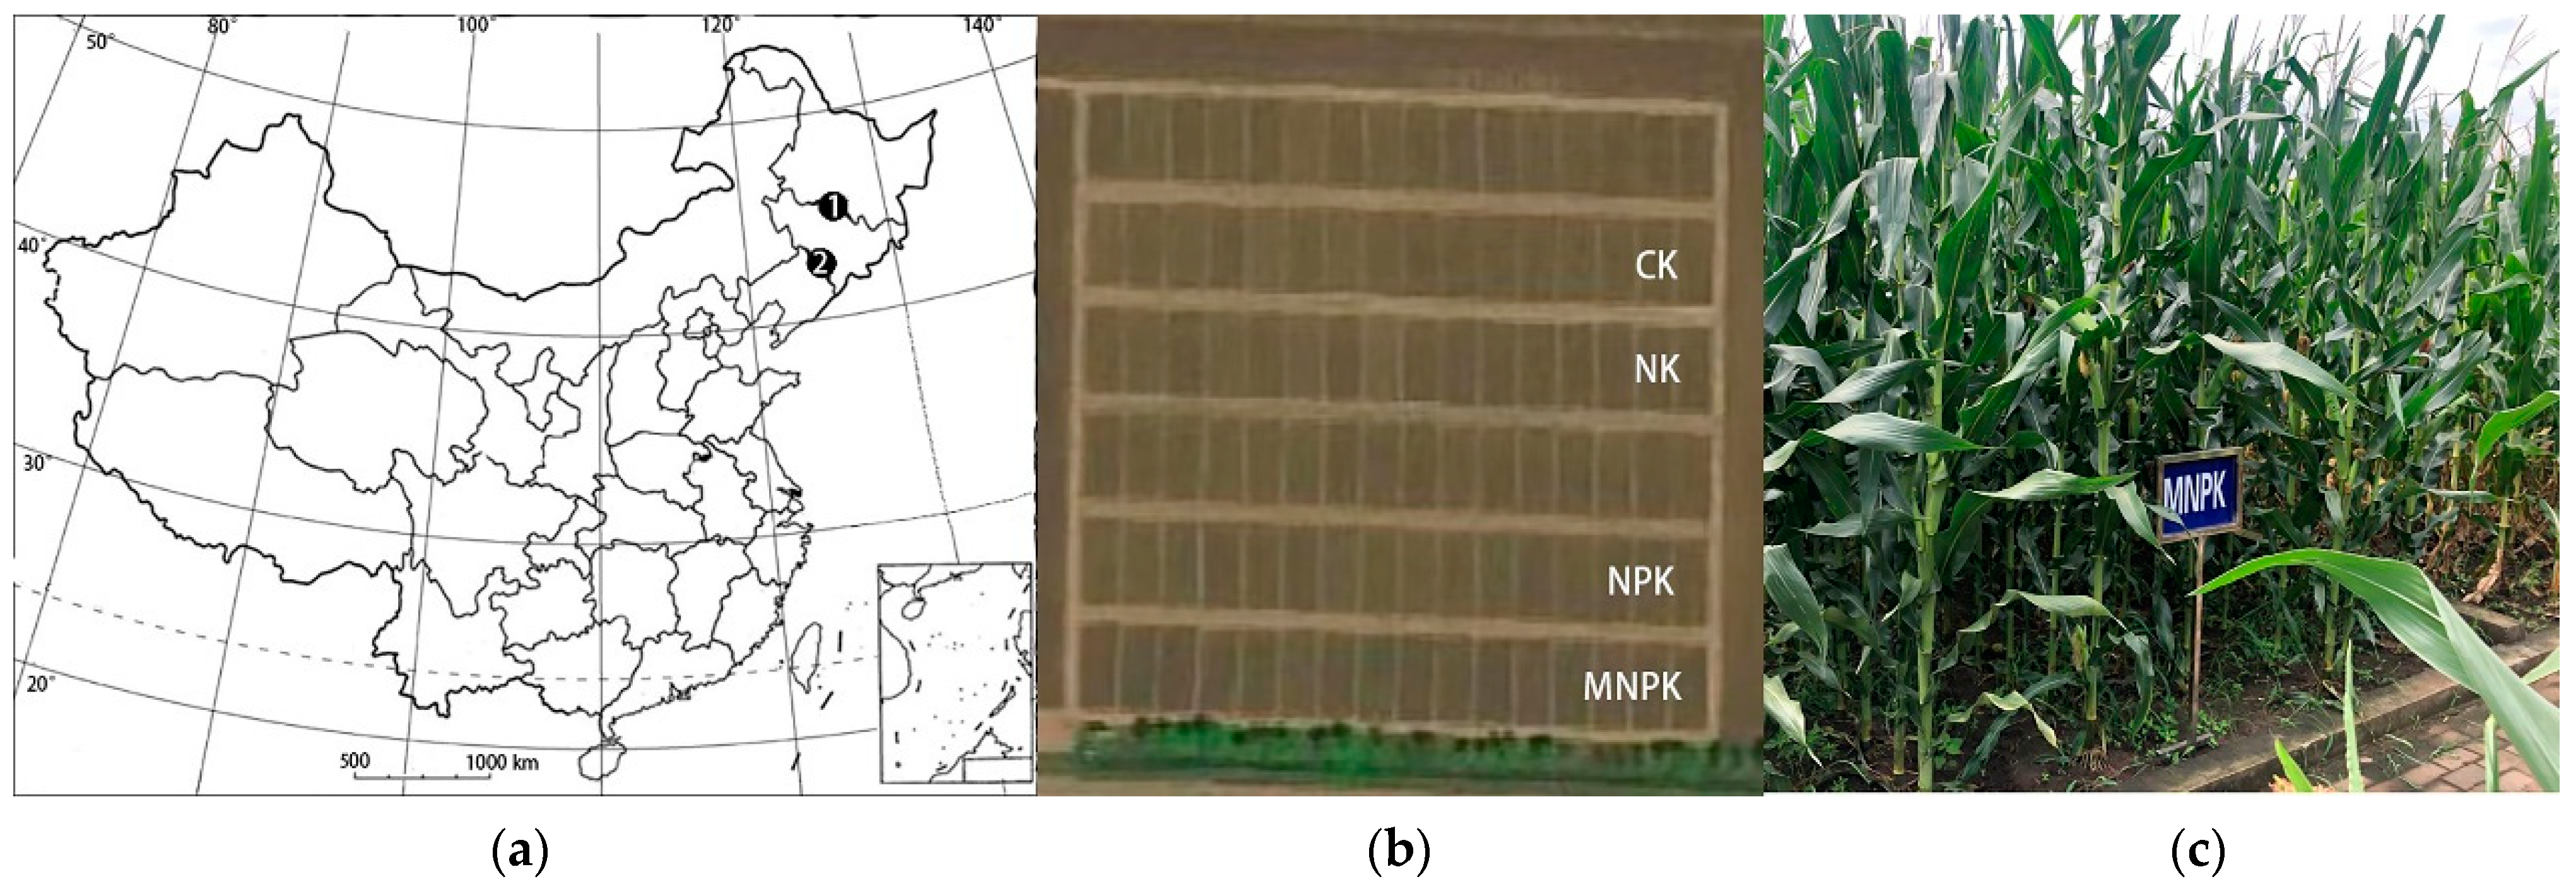
2.1. Site Description

The two long-term experiments are located in Harbin (HRB) City, Heilongjiang Province and Gongzhuling (GZL) City, Jilin Province (Figure 1). The black soil in Harbin and Gongzhuling are rich in humus, the soil classification of which is haplic phaeozems [20]. The experiment period selected for this study was from 1979 to 2009 in HRB and 1990 to 2020 in GZL, encompassing 30 years of continuous fertilizer application in both experiments. The climate type is a mid-temperate, semi-humid, continental monsoon climate. The geographical location and initial soil physicochemical properties of the two experiments are shown in Table 1 and Table 2. The fractions of P in the manure were analyzed with liquid phase 31P NMR (Nuclear magnetic resonance), which showed: the water-soluble P was 4.15 g kg−1 in pig manure, 12.1 times that of horse manure; inorganic orthophosphate accounted for 54.3%, 0.64 times that of horse manure; and phosphate monoester accounted for 45.2%, 3.5 times that of horse manure [9].

2.2. Experiment Design

The experiment areas in HRB and GZL were 168 and 400 m2, respectively. The three treatments selected were treatment with no fertilizer or manure (CK), nitrogen and potassium (NK), nitrogen, phosphorus and potassium (NPK) and manure combined with nitrogen, phosphorus and potassium (MNPK). No replicates were set for the two long-term experiments. Urea, diammonium phosphate or calcium superphosphate, potassium chloride or potassium sulfate were used as nitrogen, phosphorus and potassium fertilizers, respectively. In HRB, manure was applied after maize sowing and chemical fertilizer was applied in the autumn after harvest, and in GZL, chemical fertilizer and manure were applied before corn sowing, with pig manure applied from 1991 to 2005 and cow manure from 2006 to 2020 (Table 3).

2.3. Soil Sampling and Data

Soil samples were collected from the 0–20 cm after crop harvest, and 5 fresh soil samples were randomly selected from the plots and mixed well, air-dried and passed through a 2.0 mm sieve to determine the effective nutrients. Olsen P was determined by colorimetry after being extracted with 0.5 mol/L NaHCO3 (pH = 8.5) at 25 ℃, as proposed by Olsen researcher [21]. Total soil P was digested with H2SO4−HClO4 and measured using the molybdenum-blue colorimetric method. In addition, organic matter, total nitrogen, total potassium, available nitrogen, pH and soil physical properties were determined and analyzed according to the methods proposed by Lu [22]. The fractions of P were determined by Tiessen modified Hedley method [13,14]. P was initially extracted with an anionic-exchange resin (resin P) and then with NaHCO3 (NaHCO3−P). Resin P and NaHCO3−P are assumed to be the most plant-available (labile) fractions. Moderately labile P sorbed on amorphorus Fe and Al minerals was subsequently extracted with NaOH (NaOH-P), followed by ultrasonification in NaOH to obtain “protected P” occluded or contained within aggregates. Primary mineral P was extracted with HCI (HCl−P), and the remaining P was removed by an H2O2−H2SO4 digestion (Residual−P). In order to avoid systematic errors caused by different testers, we compared and corrected the sum of all P fractions with the total phosphorus (TP) determined.
All the data of soil physical and chemical properties in this paper were from two long-term experiments. The P of grain and straw were measured and their yields were counted every year after the crops were harvested. All dynamic data were summarized by annual monitoring data.

2.4. Formula Calculation and Statistical Analysis

Here lists the formula:
ΔOlsen P = Olsen Pi − Olsen P0
where Pi measured represents Olsen P (mg kg−1) at the ith year and P0 measured represents Olsen P (mg kg−1) at initial soils.
Pinput = PCP + PMP
where Pinput (kg ha−2) is the amount of phosphorus applied in manure and fertilizer phosphate every year, measured and counted before sowing, PCP (kg ha−2) is the amount of phosphorus applied in fertilizer every year, and PMP (kg ha−2) is the amount of phosphorus applied in manure every year.
Puptake = PG × YG + PS × YS
where Puptake (kg ha−2) is the total phosphorus removal by both grain and straw per year, measured and counted after crop harvest, PG is the phosphorus content in grains, YG is grain yield, PS is the phosphorus content in straw, and YS is straw yield.
P budget = 1979 / 1990 yr ( P input P uptake )
where Pbudget (kg ha−2) is the budget of phosphorus, and yr is the starting year for calculating the cumulative phosphorus budget.

2.5. Statistical Analyses

The relationship between the change in Olsen P and P budget in two black soils after long-term continuous fertilization was examined by fitting relationship between linear and curve equation. Among them, the fitting relationship between ΔOlsen P and P budget was fitted with a linear equation (CK, NK, NPK treatment), and the fitting equation of MNPK treatment is similar to a S-shaped curves. Data for each measured variable were subjected to one-way ANOVA and significant differences were then compared between treatments at the least-significant difference (LSD) of p = 0.05. The correlations between ΔOlsen P and P fractions were determined using the R 3.6.3 language. Redundancy analysis (RDA) was conducted because it is a widely used and adaptive descriptive data analysis tool that allows one to determine the structure of the interdependencies between the main parameters under study. In this case, soil variables included organic carbon, total nitrogen, pH, CaCO3, clay, organic carbon/total nitrogen, organic carbon/phosphorus, total nitrogen/phosphorus. The results yielded by such analyses might help identify the most influential factors on the soil parameter variability among the investigated treatments. Canoco5 was used for RDA analysis, which was developed by American Microcomputer Power Computer Company. All the diagrams were drawn with sigmaPlot12.5 and Excel software.

3. Results

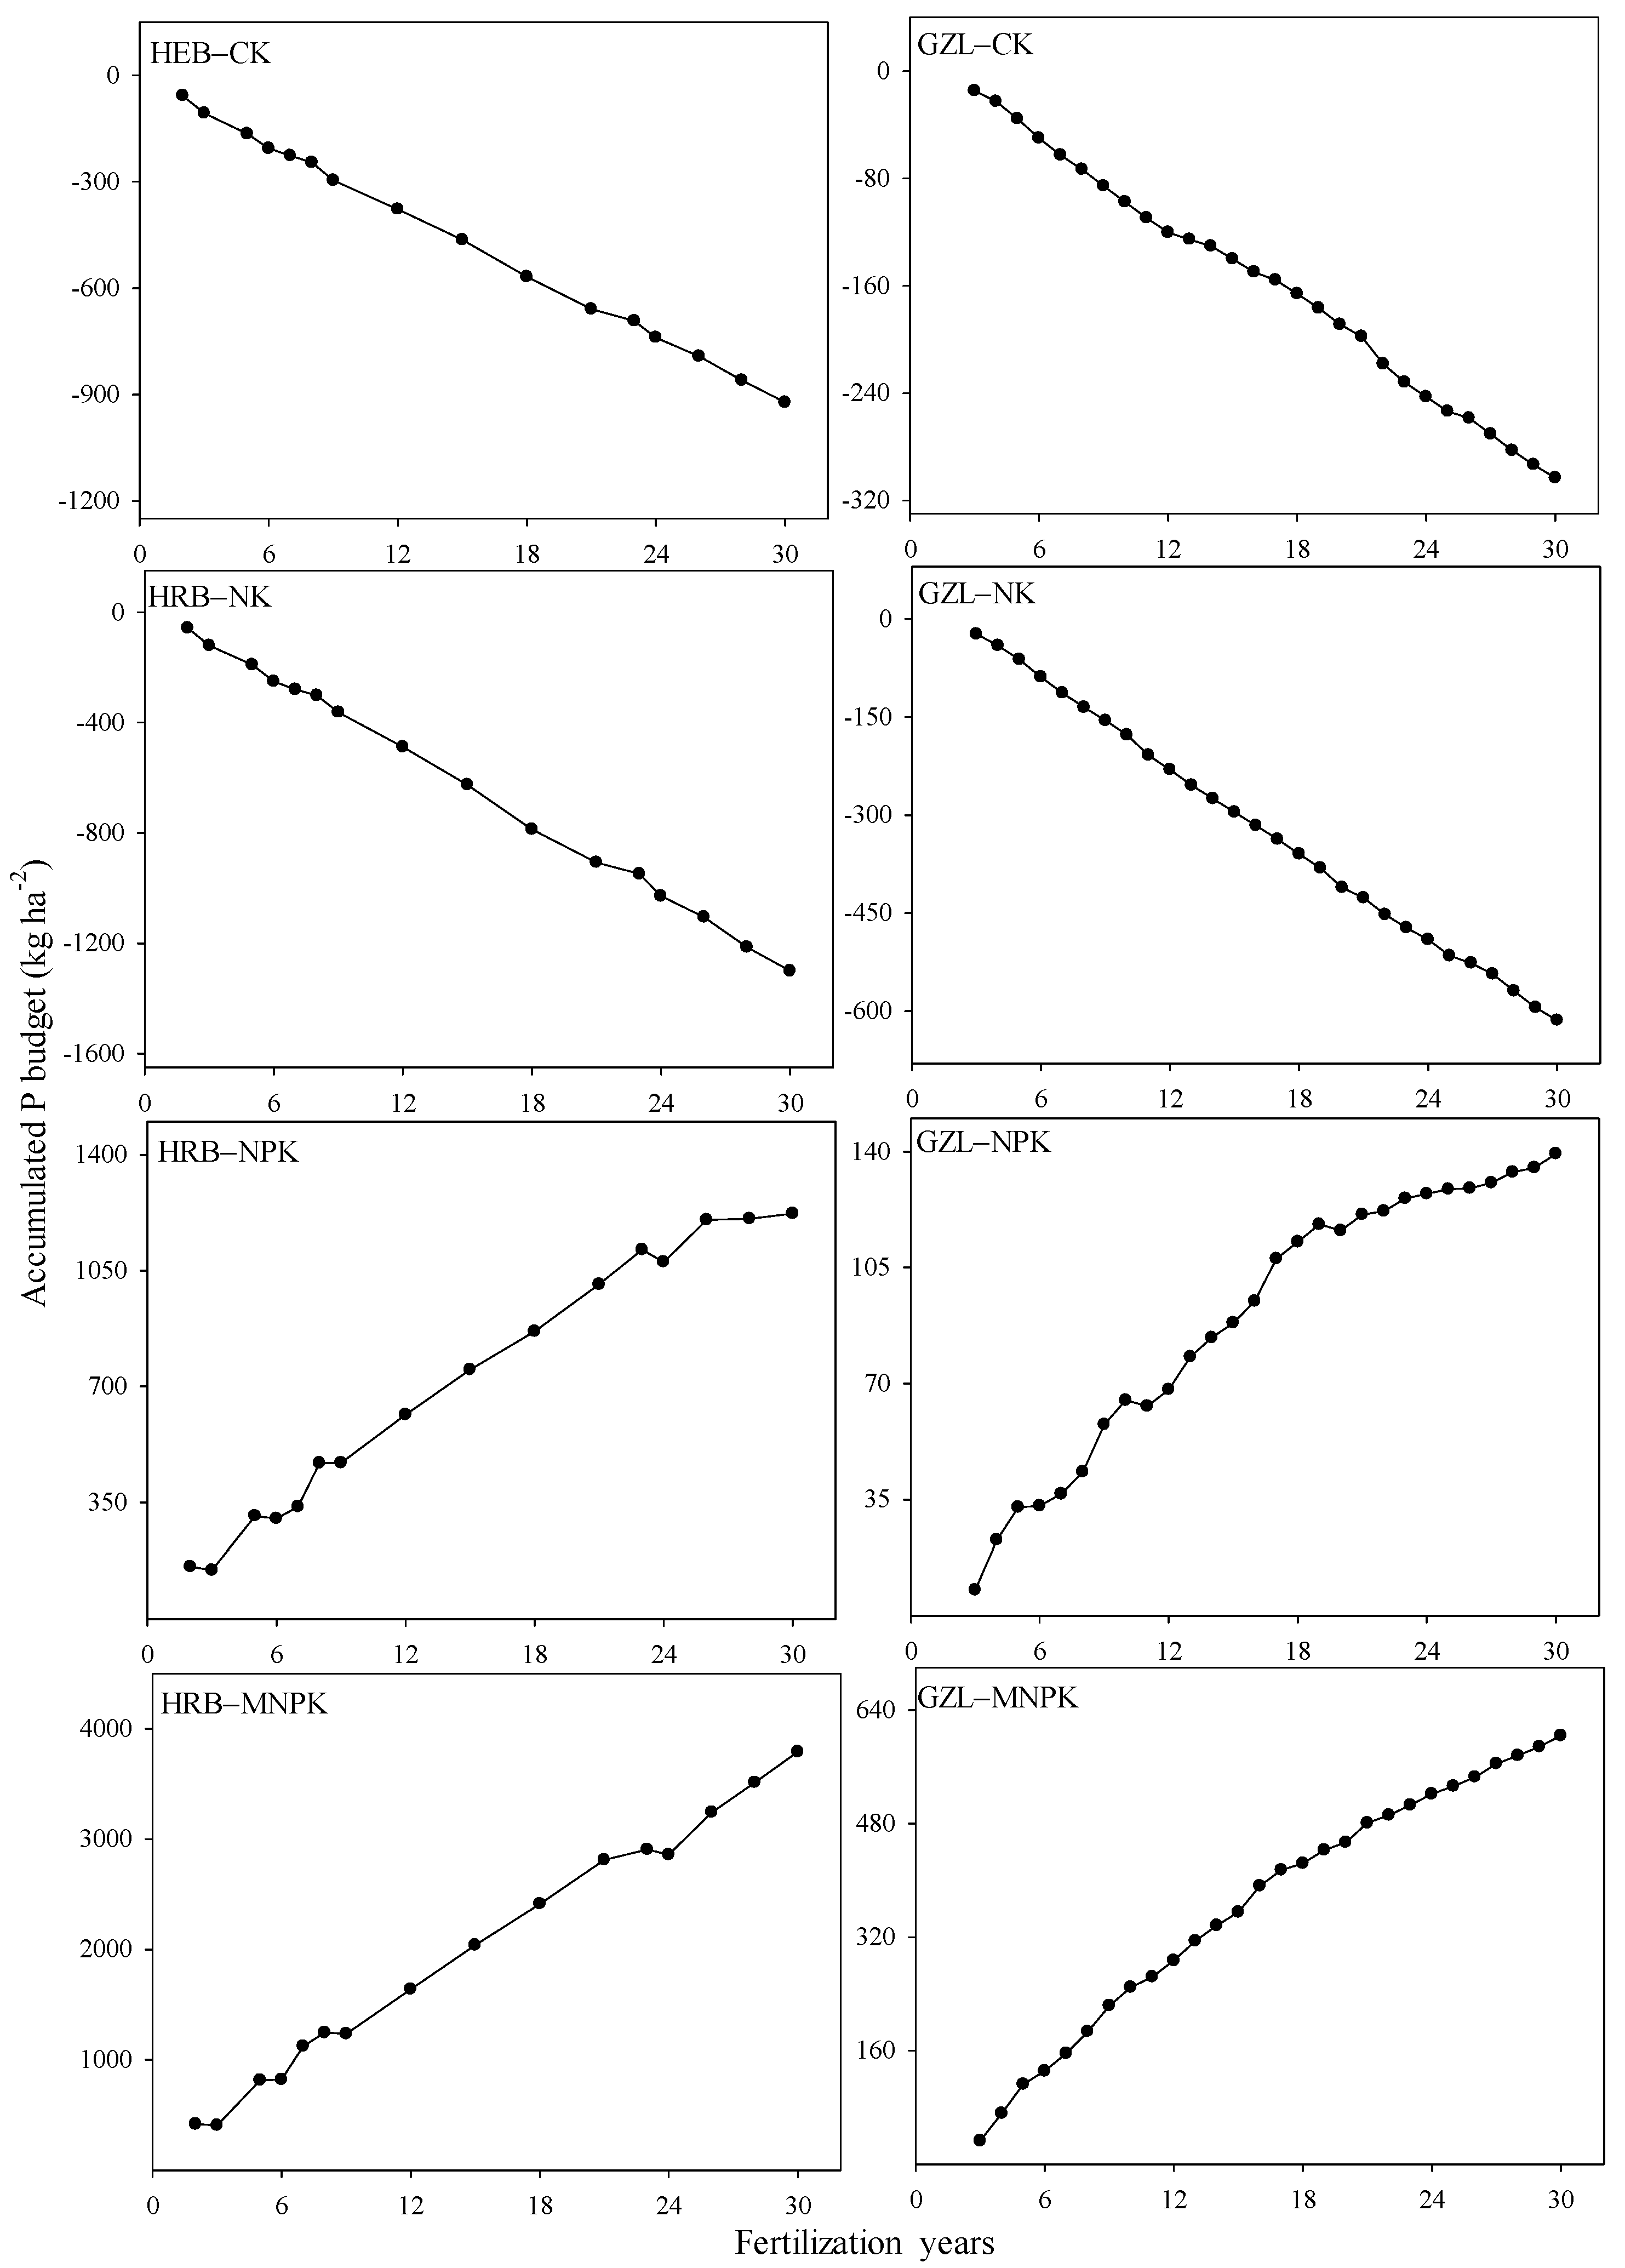
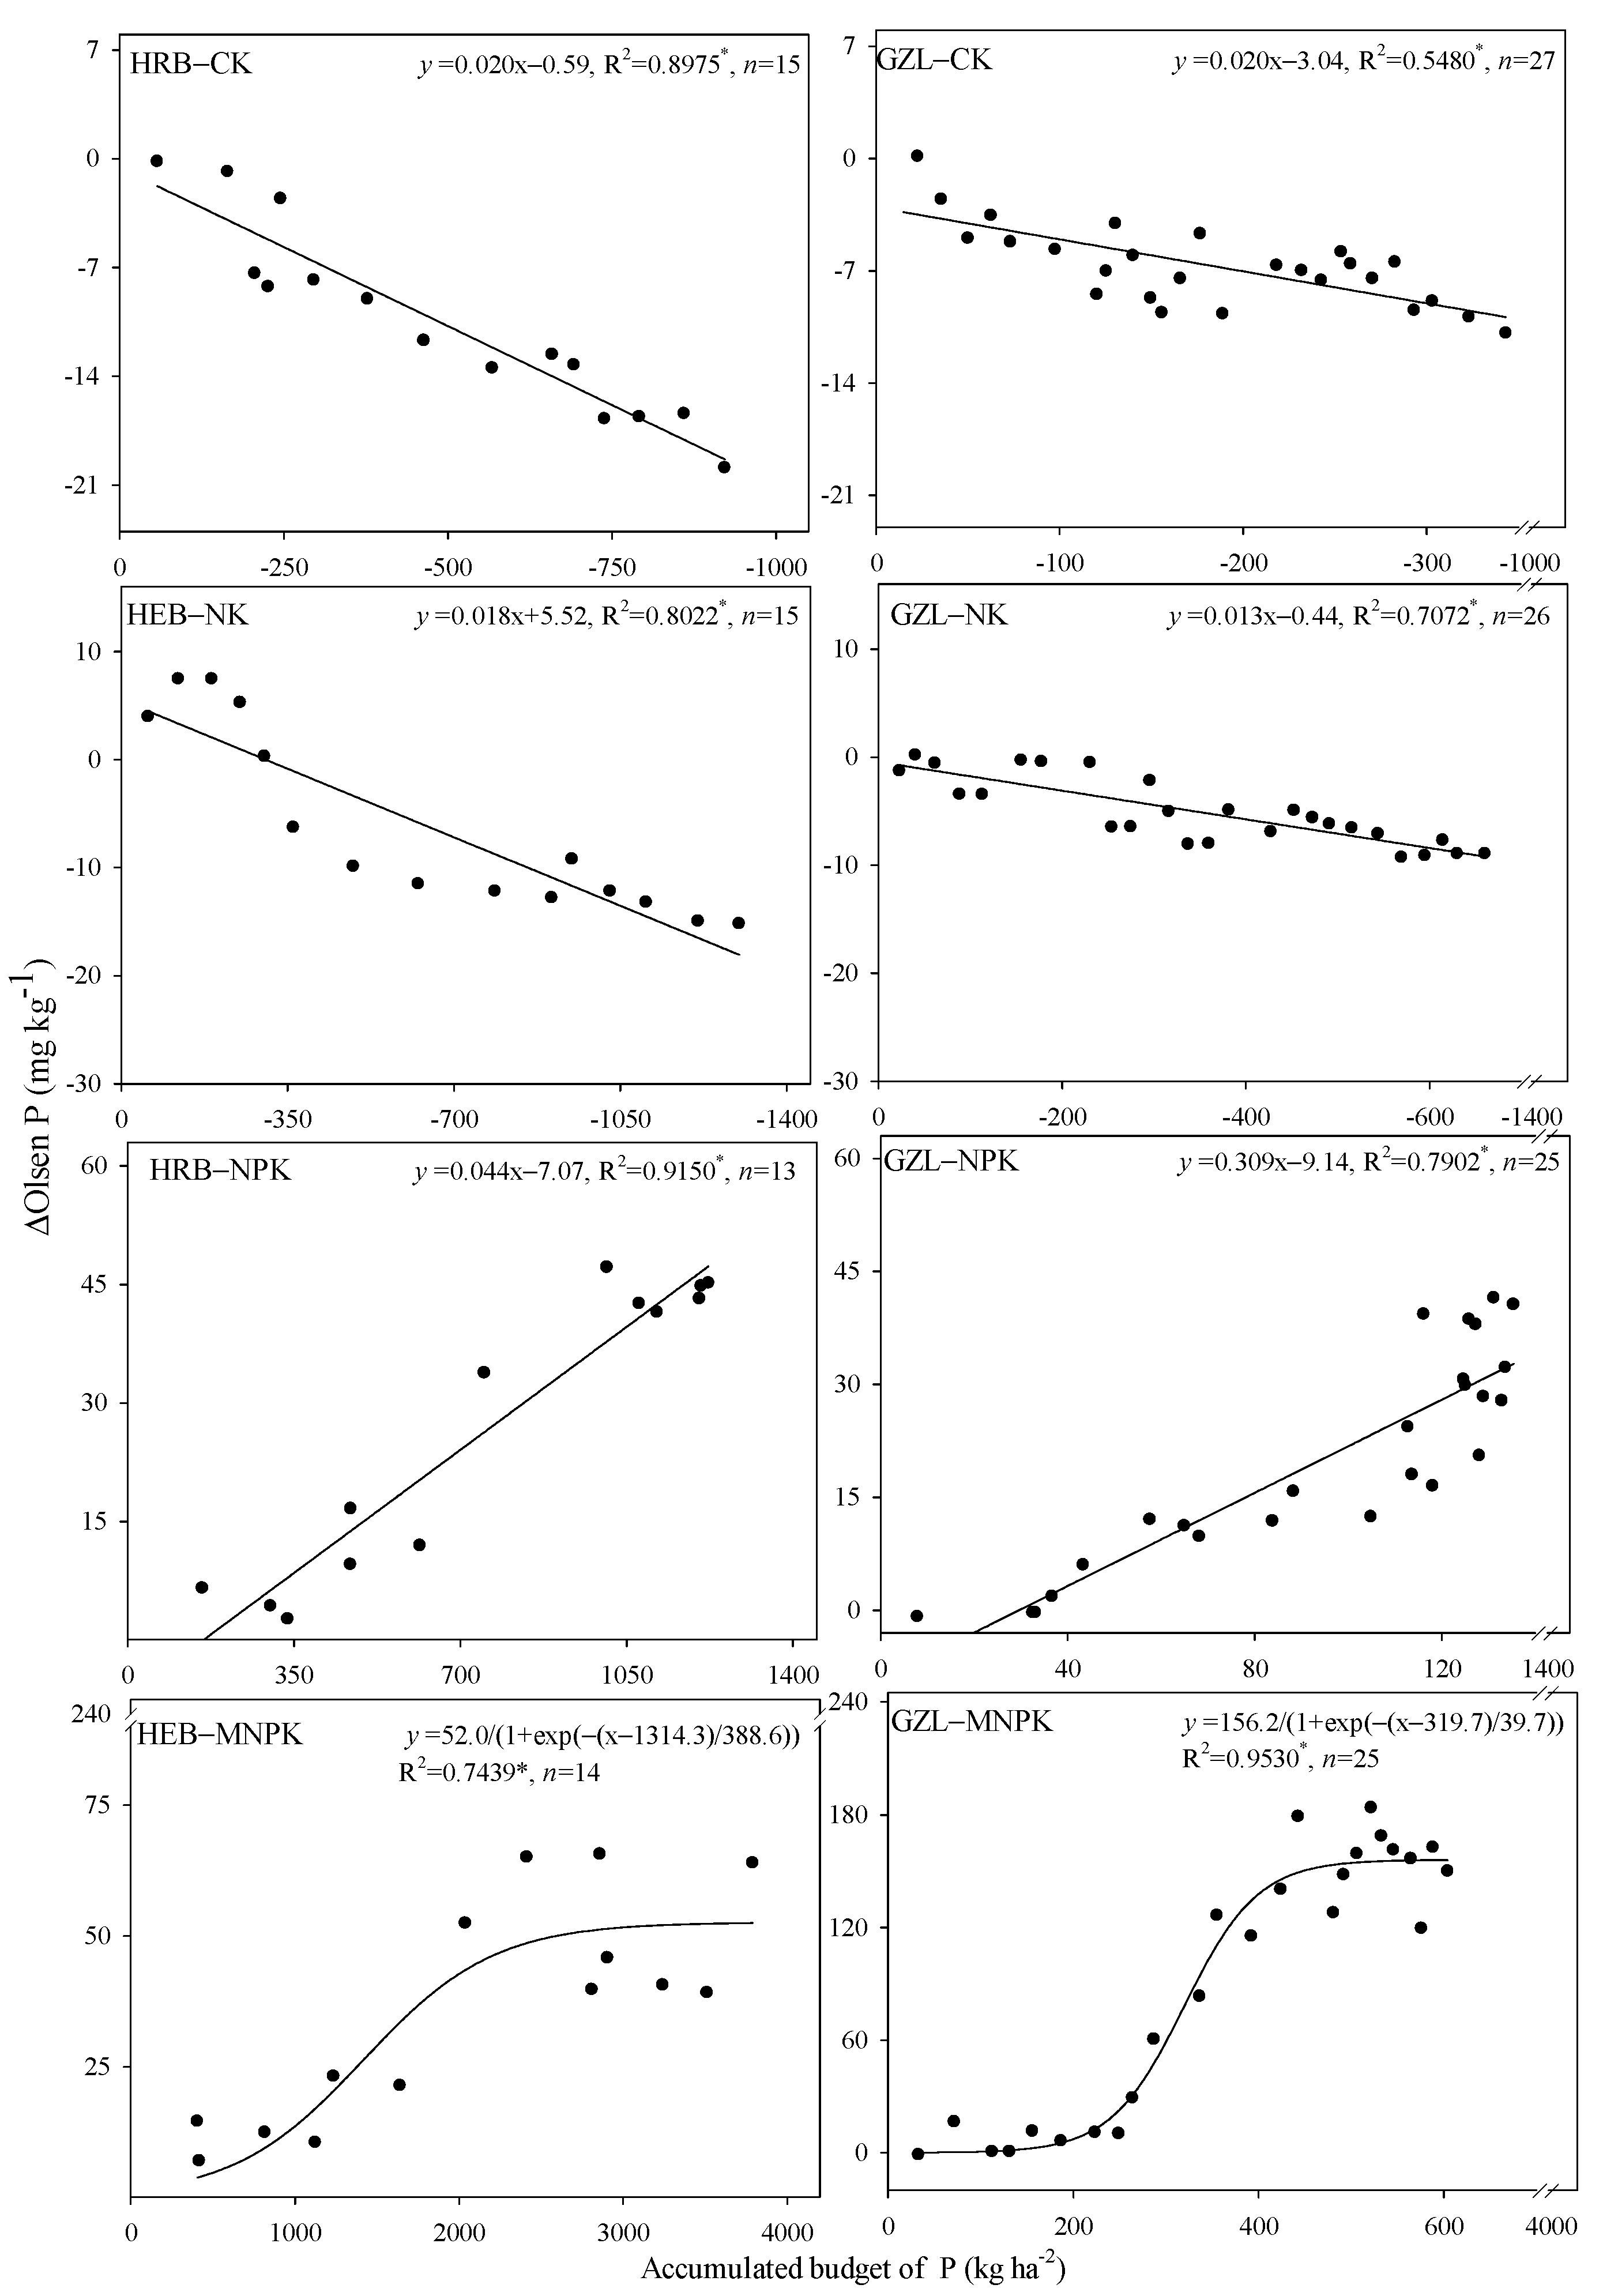
3.1. ΔOlsen P and P Budget

After 30 years of continuous fertilization, the trend of accumulated P budget of the same treatment was similar in the two tests (Figure 2). The treatment without P application resulted in P loss, and the P loss of NK treatment was higher than that of CK treatment. P application increased accumulated P, and the cumulative P increase in MNPK treatment was higher than that in NPK treatment. In HRB, the accumulated P deficit in NK treatment was 1300 kg ha−2, and the accumulated phosphorus surplus under NPK and MNPK treatments was 1223 and 3790 kg ha−2, respectively. In GZL, the accumulated phosphorus deficit in NK treatment was 614 kg ha−2, and the accumulated P surplus under NPK and MNPK treatments was 138 and 614 kg ha−2, respectively. Therefore, long-term different fertilization measures affected the accumulated P surplus and deficit in black soil.
The fitting equations between ΔOlsen P and budget of P for the three treatments (NK, NPK and MNPK) at the two long-term experiments were analyzed (Figure 3). With the same fertilization treatment, the fitting curves of ΔOlsen P and P budget were similar at two long-term experiments. Applying phosphate fertilizer (NPK and MNPK) can significantly increase the surplus of P in black soil (p < 0.05), while treatments with no phosphate fertilization (CK and NK) resulted in continuous P loss. With NK treatment, Olsen P decreased by 1.8 mg kg−1 for every 100 kg ha−2 of P loss in HRB and 1.3 mg kg−1 in GZL. With NPK treatment, Olsen P increased by 4.4 mg kg−1 for every 100 kg ha−2 of P surplus in HRB and 30.9 mg kg−1 in GZL. With MNPK treatment, the growth of Olsen P was phased and reached equilibrium after a rapid increase. The equilibrium value of ΔOlsen P was 52.0 mg kg−1 in HRB and 156.2 mg kg−1 in GZL. In conclusion, after 29–36 years of different fertilization, fertilization practices resulted in significant changes in Olsen P in the black soil, with NK treatment causing a significant decrease in Olsen P, NPK treatment causing a linear increase and MNPK treatment causing a phased upward trend.

3.2. Fractions of P

The changes of P fractions were analyzed at two experiments with long-term continuous fertilization for 30 years. P fractions in 4 years (1995, 2000, 2005 and 2010) were selected to subtract the P fractions in 1990 (Table 4). The results showed that compared with the P fractions in 1990, with treatments without P application (CK and NK), LP (labile P), MLP (medium labile P) and SP (stable P) decreased by 21.1, 16.6 and 15.1 mg kg−1 on average in 2010, and the percentage decrease was 2.8, 5.7 and 2.1%; with P application (NPK and MNPK), LP and MLP increased by 25.5 and 79.2 mg kg−1, and the percentage increase was 1.8 and 16.1% in NPK in 2010. With the treatment of MNPK, the increase in LP and MLP was significantly higher than that with three other treatments in 2005 and 2010. In short, different successive fertilization practices significantly affected the phosphorus pool in black soil; without phosphorus application it continued to decline, while with phosphorus application it continued to be supplemented.

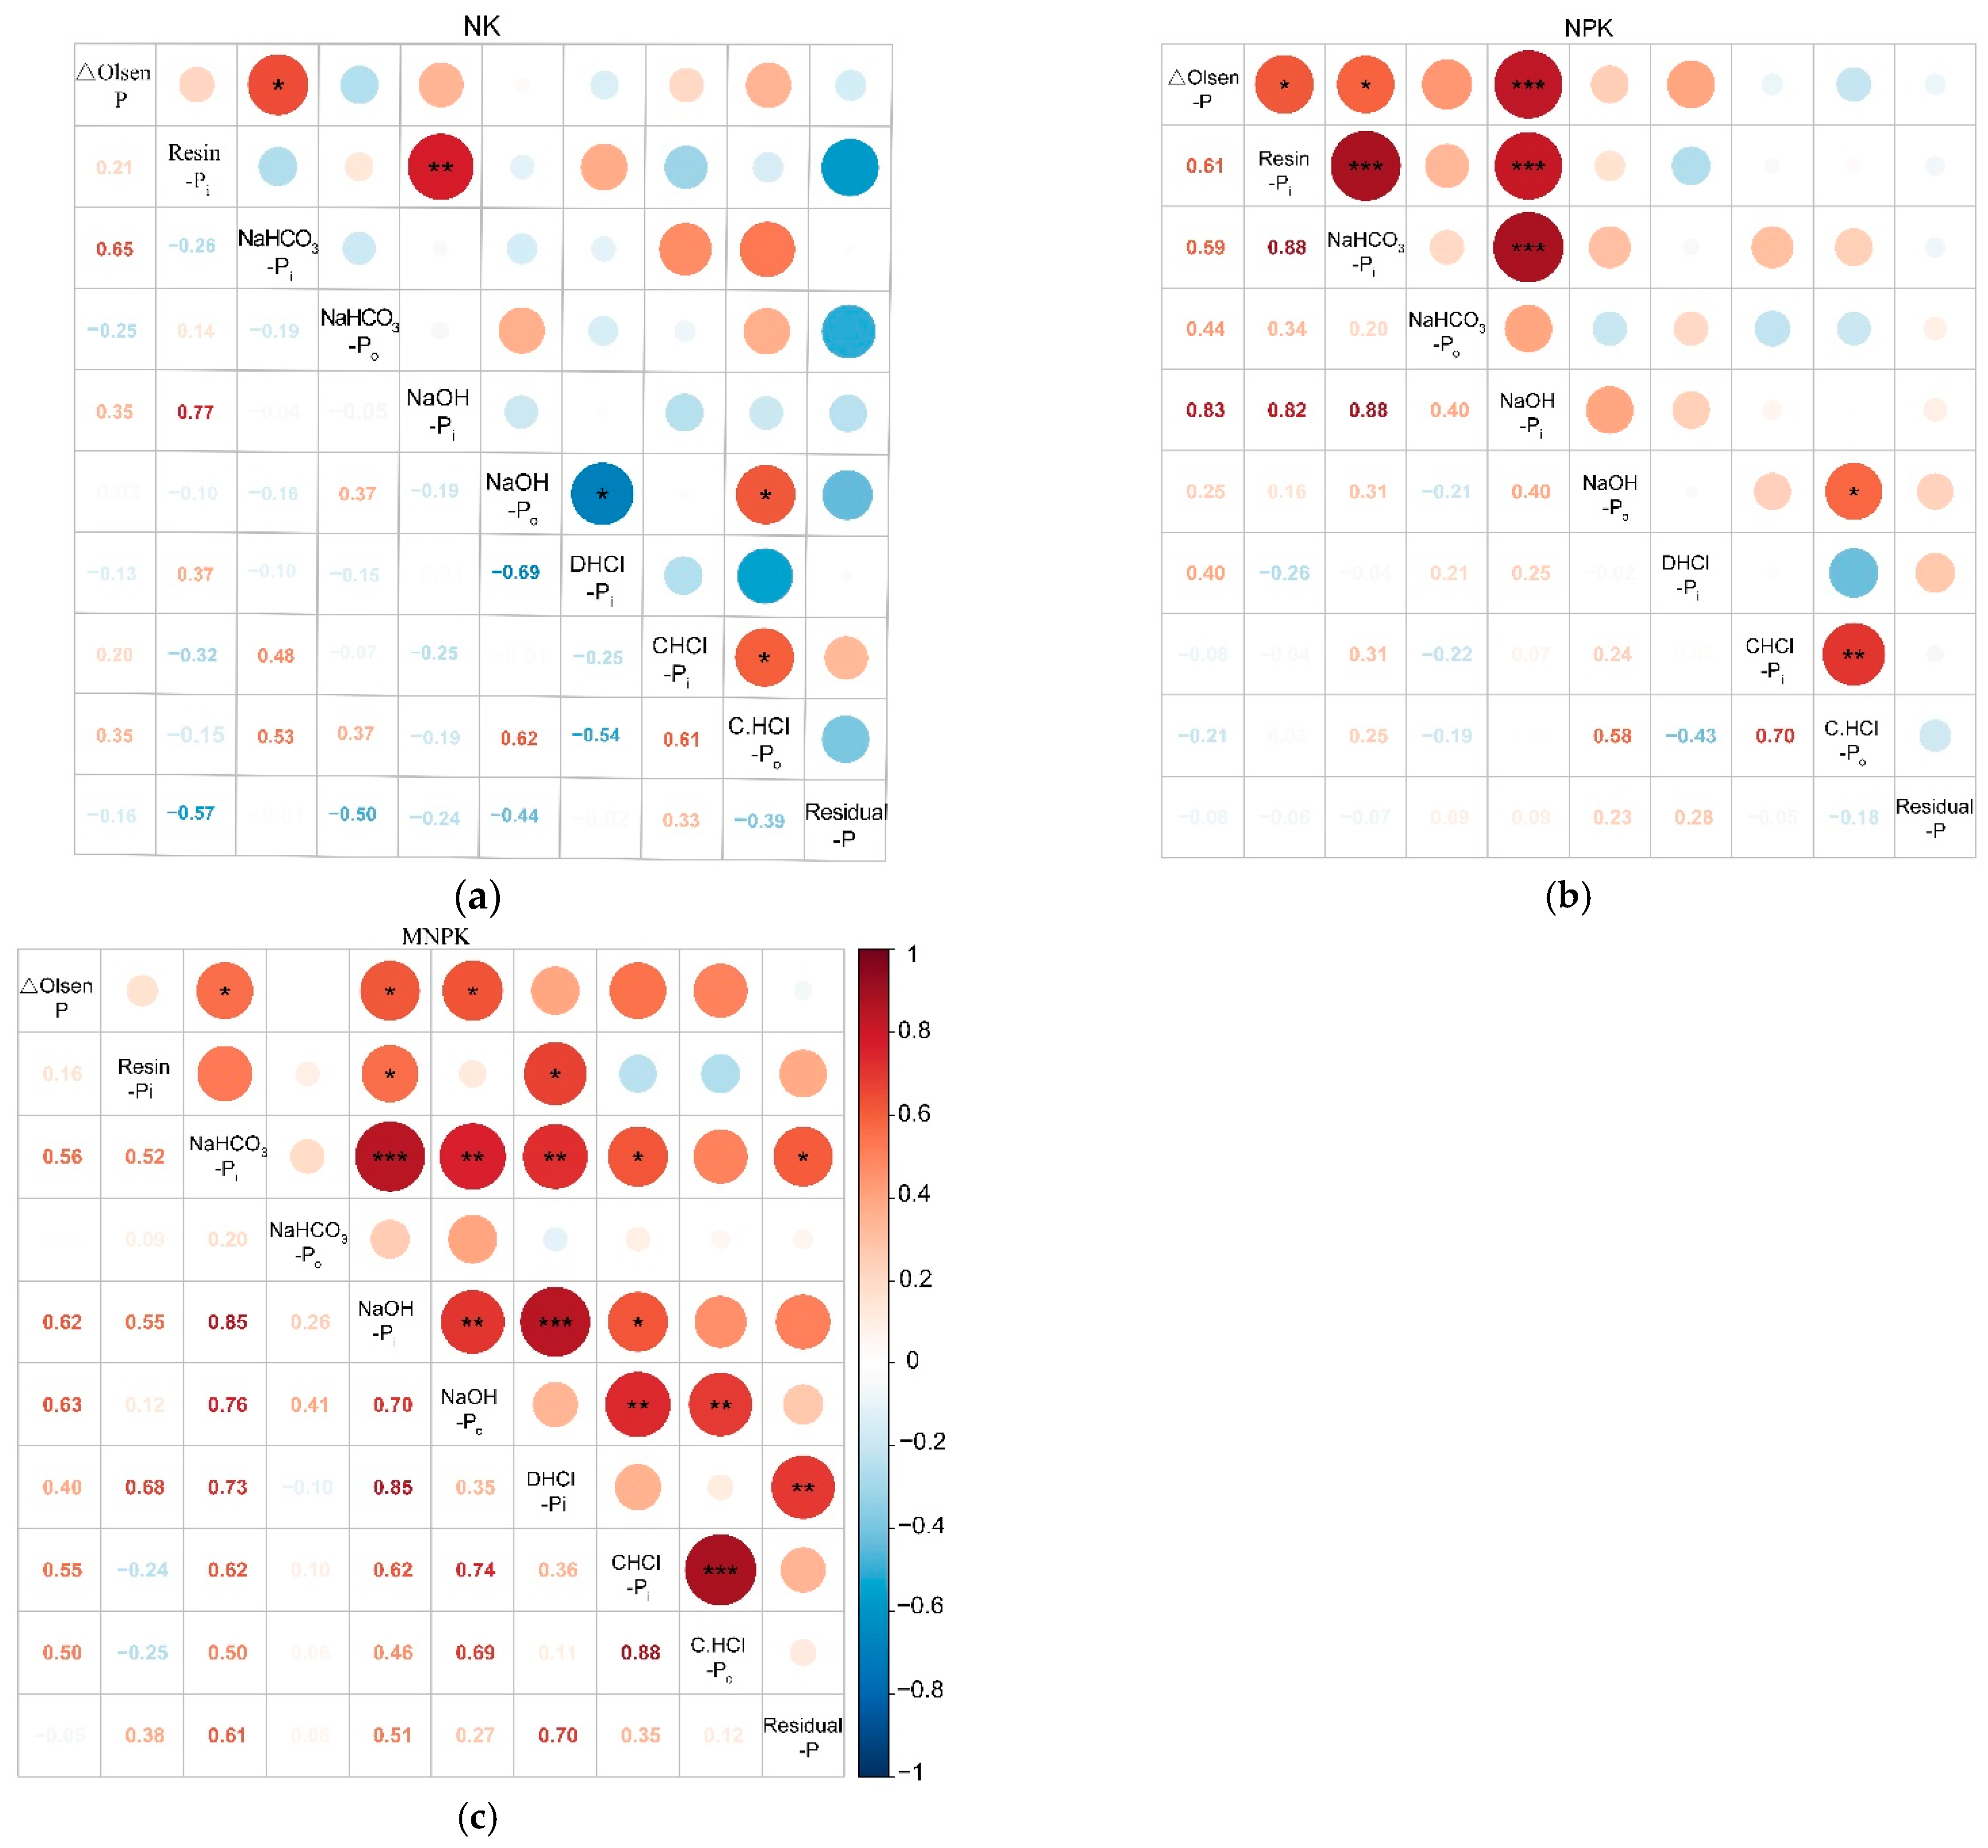
3.3. Relation of Olsen P Change with P Fractions

The correlation between ΔOlsen P and the fractions in three treatments (n = 12) was analyzed. The results showed that with CK treatment, Δ Olsen P had no significant correlation with the fractions; with NK treatment, ΔOlsen P and NaHCO3-Pi were significantly correlated (p < 0.05); with NPK treatment, ΔOlsen P was positively correlated with Resin-Pi, NaHCO3-Pi and NaOH-Pi (p < 0.05); with MNPK treatment, ΔOlsen P was positively correlated with NaHCO3-Pi, NaOH-Po and NaOH-Pi (p < 0.05). ΔOlsen P and NaOH-Pi were significantly correlated with NPK and MNPK treatments (Figure 4). In short, NaHCO3-Pi was most closely related to the change in Olsen P in black soil. After P application, the increment in Olsen P was closely related to the LP and MLP in the black soil.

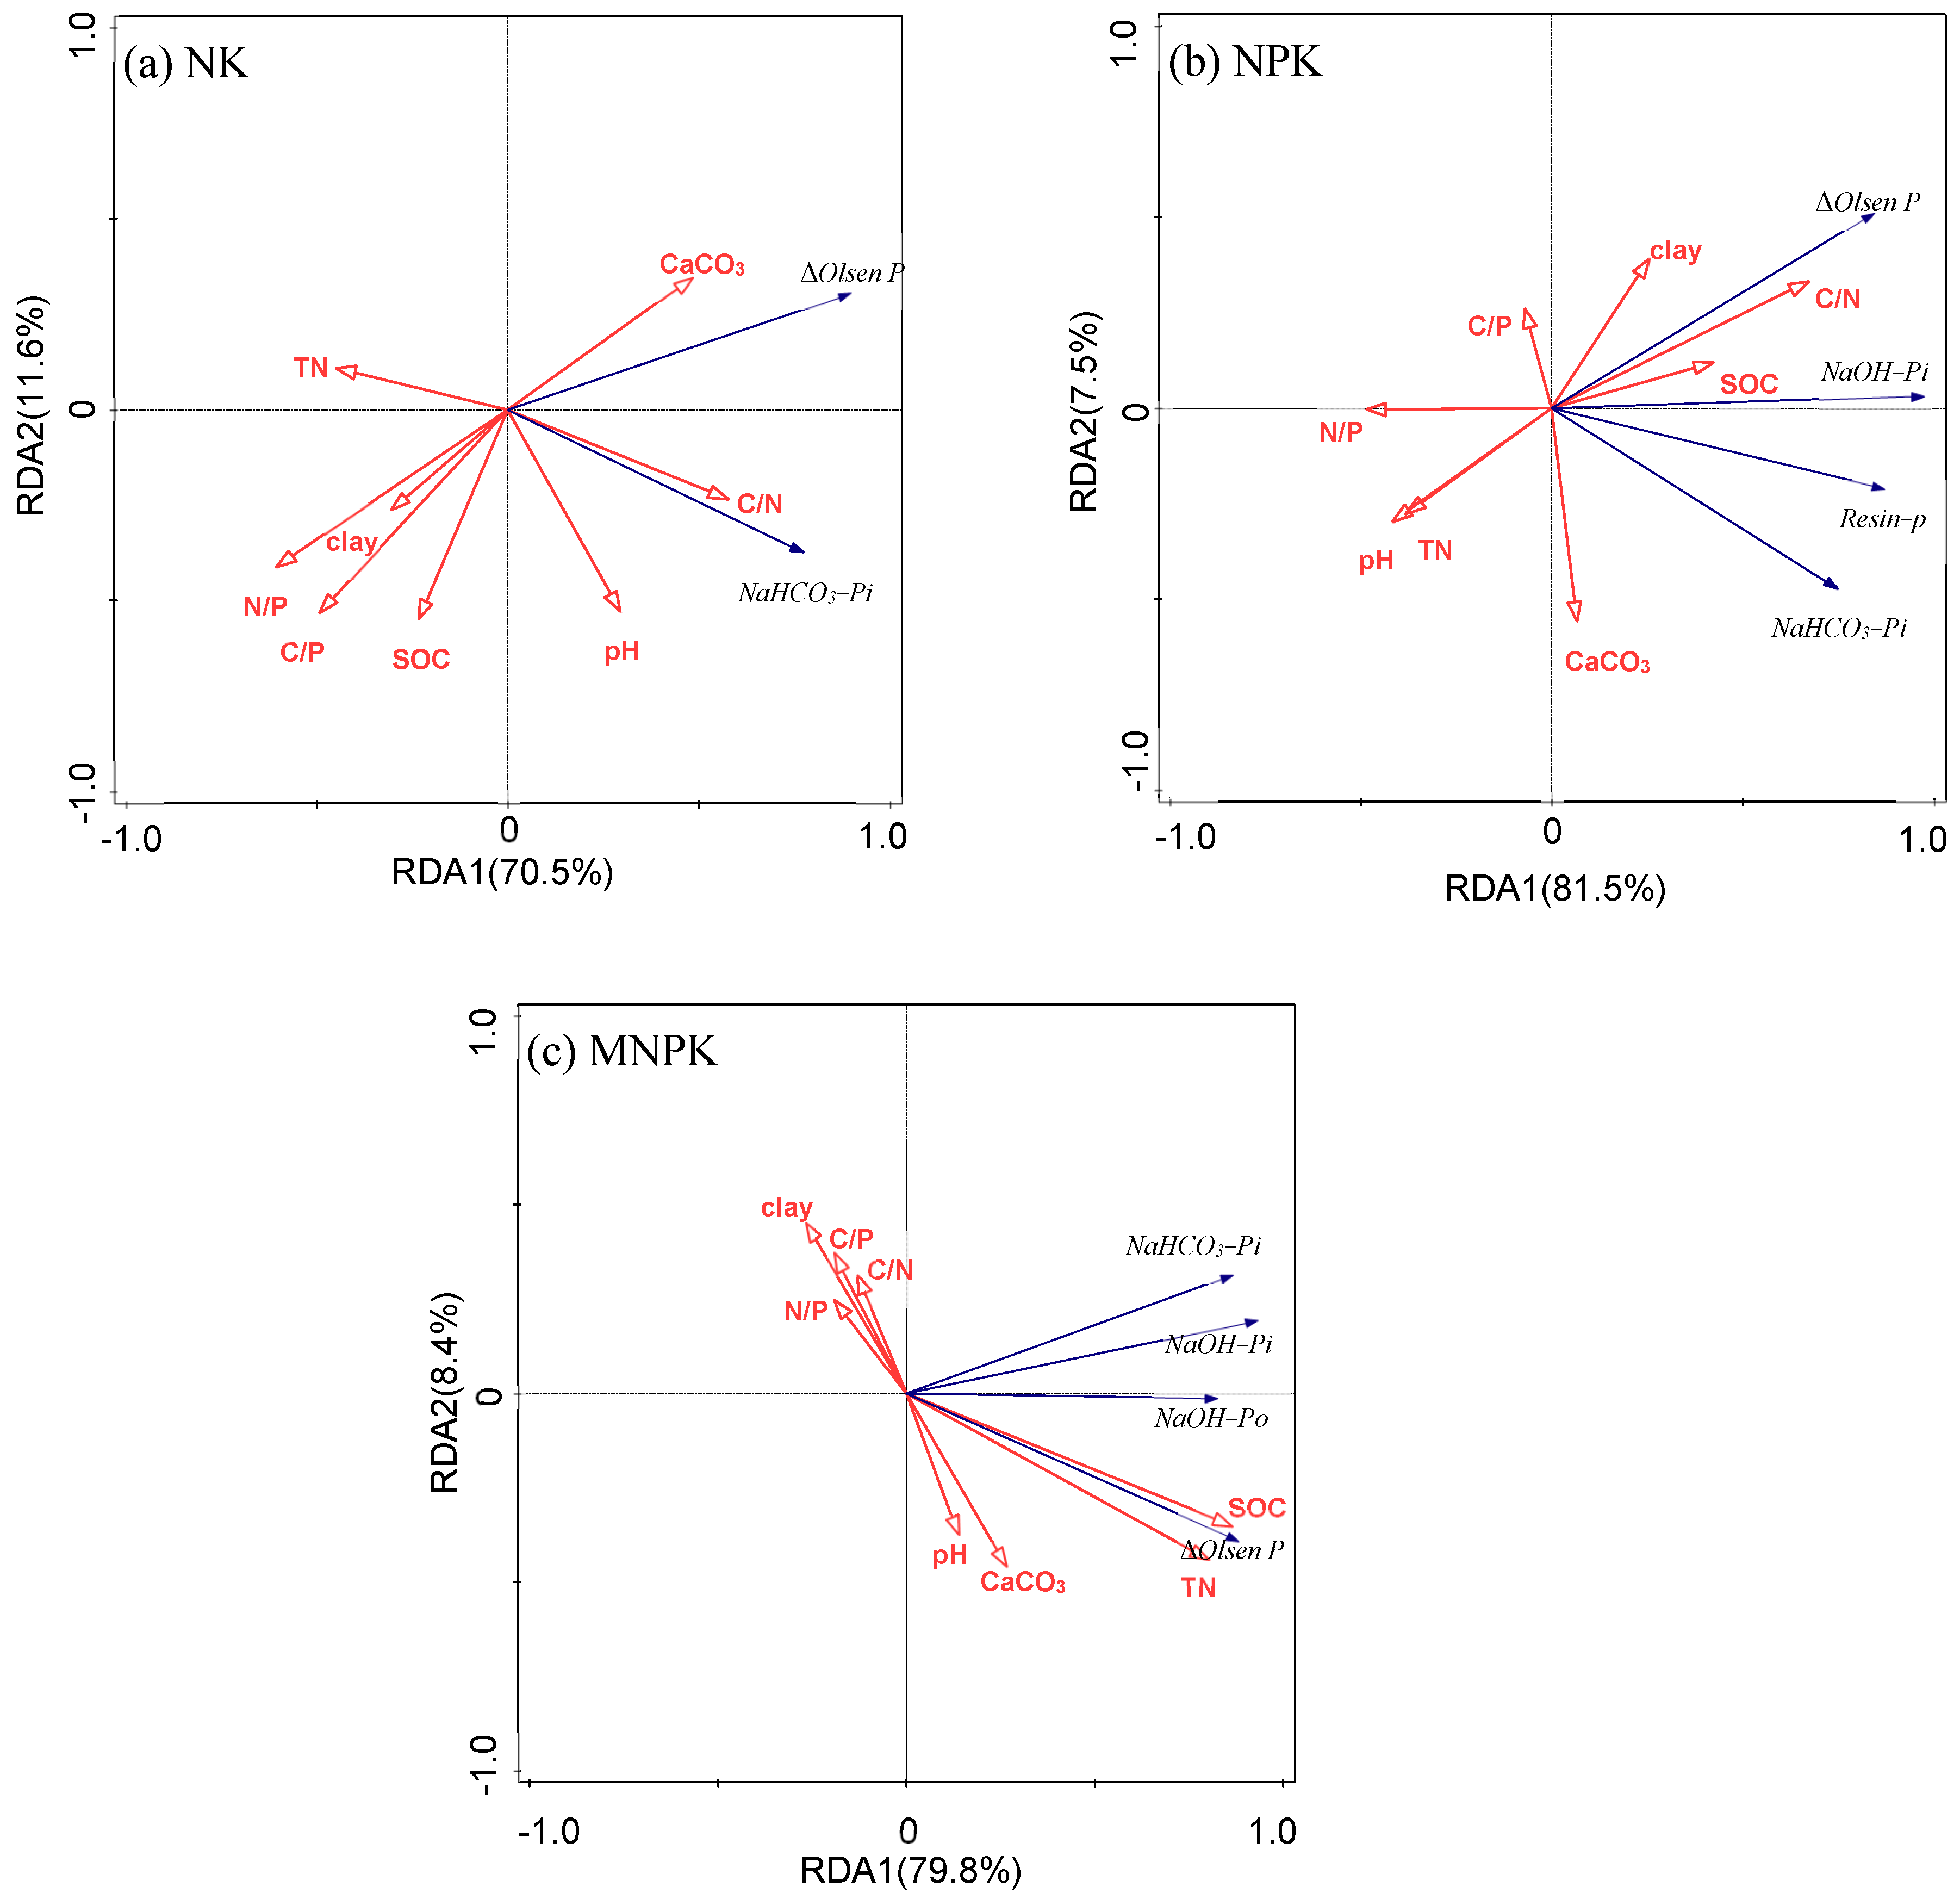
3.4. Relation of Olsen P Change with Other Factors

In order to clarify the impact of soil physical and chemical properties on Olsen P and its related P fractions, we conducted an RDA analysis on two groups of variables (Figure 5). The results showed that with NK treatment, carbon/nitrogen (C/N) and carbon/phosphorus (C/P) had greater effect on Olsen P, and the total contribution rate was 43.2%; with NPK treatment, the same C/N and C/P had greater impact on Olsen P, and the total contribution rate was 61.0%; with MNPK treatment, SOC and nitrogen/phosphorus (N/P) had greater impact on Olsen P, and the total contribution rate was 70.2%. In conclusion, the difference between SOC and TN was the main reason for the change in Olsen P and its fractions in black soil.

4. Discussion

4.1. Effects of Fertilization on Olsen P

The results of this study showed that different fertilization measures affected the change trend of Olsen P during P budget. Olsen P decreased without P application, while Olsen P increased with P application in black soil. Olsen P showed a linear decreasing trend with NK treatment, a linear increasing trend with NPK treatment, and a similar S-shaped curve with MNPK treatment. Similar to the results of previous studies, continuous application of P would increase P surplus in black soil, while P application would cause an increase in Olsen P in P surplus [23,24]. Moreover, during 30 years of continuous fertilization, Olsen P showed a linear upward trend with NPK treatment. However, the growth trend of Olsen P with MNPK treatment was different from that of previous studies, which showed a phased increase.
In the first eight years of fertilization in GZL, Olsen P increased slowly. At the beginning of the experiment in GZL, the initial value of Olsen P was 11.8 mg kg−1, much lower than that of 22.2 mg kg−1 in HRB (Table 2). Fox ‘s research showed that in the soil with low P, the input of P fertilizer increased P fixation, while the increase in Olsen P was slow [25]. Therefore, at the beginning of the experiment, a large P fertilizer input increased P fixation in GZL, and Olsen P increased more slowly than in HRB. This may be due to the fact that soil P was already excessively depleted prior to the experiment, so the early fertilization may increase the fixation of P.
Olsen P experienced a rapid growth period with MNPK treatment, and the continuous accumulation of P in soil caused the rapid rise in Olsen P. The increase in soil organic matter increased labile P and reduced the adsorption of P, and Olsen P increased rapidly. With MNPK treatment, the increase in Olsen P reached equilibrium at the later stage, especially in GZL. One possible reason is that continuous fertilization would lead to saturation of P adsorption in the soil [17], and lead to infiltration and loss of Olsen P. Schmieder and Yang ‘s research showed that P migration is related to organic carbon and mineral types. Long term application of MNPK could produce orthophosphate in GZL, which is adsorbed to the surface of clay minerals, resulting in the saturation of a large amount of P in these mineral phases, which could promote the migration of P to the lower layer of the soil [18,26]. Similarly, Fang’s research in GZL experiment showed that Olsen P under MNPK treatment was significantly higher than that under NPK treatment in 20–40 cm, and soil organic carbon and total nitrogen had the greatest effects on Olsen P and P fractions [16]. The research by Yang et al. on black soil showed that the increase in soil organic matter increased Olsen P and P activation coefficient, and improved the desorption capacity of P in black soil [26]. Therefore, these reasons led to a phased increase in Olsen P in MNPK treatment.

4.2. Effects of P Fractions and Soil Properties on Olsen P

The P fractions and their proportions were analyzed over six years (1990, 1995, 2000, 2005 and 2010). The results showed that long-term P application increased the content and proportion of LP and MLP in 20 years in black soil. Similar to previous research results, long-term P application reduced the mineralization of P, and manure input increased the proportion of MLP [27]. Moreover, ΔOlsen P was significantly correlated with NaHCO3−Pi and NaOH−-Pi, indicating that both single and compound application of manure P increased inorganic P in LP and MLP, and the effect on inorganic P was higher than that on organic P. With MNPK, the input of P fertilizer increased all forms of P fractions, but the proportion of SP decreased significantly, indicating that MNPK was more conducive to increasing LP and MLP in the soil, and the increase range of LP and MLP was higher than that of SP. With MNPK treatment, fertilization increased all P fractions in black soil, SP increase was not significant, but SP% decreased significantly, indicating that long-term manure combined with NPK increased LP and MLP more than SP, resulting in significant increase in LP + MLP and (LP + MLP) %, leading to a significant SP% decrease. In short, different fertilization measures affected the fractions and percentage of P in black soil.
With MNPK, the increasing trend of Olsen P was similar in the two experiments, but there were differences. Olsen P increased slowly in the early stage in GZL, and its equilibrium value was 3.54 times that in HRB. There are two possible reasons for the differences. Firstly, the research by Dou et al. showed that the amount of fertilizer input and the type of manure would affect the P fractions [28]. There were differences in the input amount of fertilizer P and manure in the two experiments. The fractions of P in the manure were analyzed with liquid phase 31P NMR (Nuclear magnetic resonance). The results showed that there were great differences between pig and horse manure in terms of water-soluble P, inorganic orthophosphate and phosphate monoester. The water-soluble P was 4.15 g kg−1, 12.1 times that of horse manure, inorganic orthophosphate accounted for 54.3%, 0.64 times that of horse manure, and phosphate monoester accounted for 45.2%, 3.5 times that of horse manure. Secondly, the physical and chemical properties of soil, especially the content of CaCO3, significantly affect the content of LP [29,30]. Although they are both in black soil, their soil physical properties are different. We measured the CaCO3 in HRB and GZL from 2007 to 2013. In HRB, the mean value of CaCO3 was 0.01%, while in GZL, the mean value was 0.32% (Table 2). However, in RDA analysis, CaCO3 and clay contributed much less than organic carbon and total nitrogen., and it is likely that their impact on P fractions was limited to the initial stage of the experiment. Pizzeghello’s research showed that long-term factors influencing the mobility of P in soil were not only excessive P inputs, but also the types of P fertilizer applied, especially the excessive input of manure that increased the loss of P [31]. Therefore, it is necessary to conduct culture tests to gain a clearer understanding of the dynamic adsorption process of P by mineral components in the future.
Our study showed that the main factors affecting the Olsen P and P fractions were organic carbon and nitrogen in the soil. Previous studies have shown that SOC, TN, soil mineral types and microorganisms had important effects on P fractions [19]. Firstly, soil SOC and TN had a direct impact on Olsen P and P fractions [26]. Fertilizer could promote the increase in SOC and LP. SOC had an important effect on the adsorption-desorption of P in black soil, and the availability of P could be improved by reducing the adsorption and increasing the desorption of P [32]. Secondly, Wang’s research on black soil showed that the input of soil C, N and P affected the microbial community structure in Heilongjiang in China [33]. Heuck also found that long-term nitrogen input reduced the P dissolution and mineralization capacity of microorganisms. The P dissolution capacity of microorganisms was mainly regulated by C/P, and its abundance was significantly positively correlated with soil TN and SOC [34]. Therefore, the contents and ratios of SOC and TN were closely related to the changes of P fractions in black soil.
This study was conducted only in the long-term experiment of black soil in China, where soil P retention is mainly regulated by the adsorption by NaOH-Pi, soil organic carbon and total nitrogen. However, in acid soils of Qiyang, P is mainly adsorbed on the surface of clay minerals, and rainfall mainly controls the retention of soil P [35,36]. In calcareous soils of the Spanish Mediterranean region, the fixation of P is mainly through adsorption of calcium carbonate [23]. These results showed that the effects of soil type and climatic properties on soil P dynamics could not be ignored. Therefore, in order to accurately evaluate the availability of soil P and reasonably apply P fertilizer, we should also consider the comparative study of P fractions in different climates and soil types in the future.

5. Conclusions

Different long-term fertilization made the changes in Olsen P and P fractions tend to be different in black soil. With the application of MNPK, Olsen P increased in stages, which was different from the linear increase in NPK. The input of P fertilizer increased the labile P. At the same time, NPK had a greater impact on the medium labile P, while the application of MNPK significantly reduced the ratio of stable P. Although labile P played an important role in improving soil P availability, moderate labile P continued to decrease significantly under P deficiency. After 30 years of different long-term fertilization, Olsen P decreased by an average of 1.5 mg kg−1 for every 100 kg ha−2 budget of soil P under NK treatment, and increased by an average of 17.6 mg kg−1 under NPK treatment. The increase curve of Olsen P under MNPK treatment was similar to an S-curve with periods of rapid growth and periods of equilibrium and the equilibrium values were 52.0 and 156.2 mg kg−1 in Harbin and Gongzhuling. Our findings fill the knowledge gap about the continuous changes of Olsen P and P fractions in black soil, which are very important for formulating fertilization strategies. By comparing Olsen P and its equilibrium values, the input amount of phosphate fertilizer can be adjusted in advance. Therefore, this study provides deeper understanding of the impact of long-term different fertilization measures on the dynamics of different soil P pools, and provides guidance for sustainable P management. However, it is necessary to study the characteristics of P adsorption and desorption in different fertilization stages to fully understand the change characteristics of soil P fractions in other soil types and meteorological conditions in the future.

Author Contributions

Conceptualization: F.S. and M.X.; Methodology: M.X. and N.S.; Validation: F.S. and M.X.; Formal analysis: F.S.; Investigation: F.S. and M.X.; Resources: M.X., B.Z., X.M., P.Z. and H.G.; Data curation: M.X.; Writing original draft: F.S.; Writing-review & editing: M.X.; N.S.; Supervision: M.X.; Project administration: N.S.; Funding acquisition: N.S. All authors have read and agreed to the published version of the manuscript.

Funding

The research was supported by National Natural Science Foundation of China (42177341) and the National Key Research and Development Program of China (2022YFD1500905).

Acknowledgments

We fully appreciate the editors and all anonymous reviewers for their constructive comments on this manuscript.

Conflicts of Interest

The authors declare no conflict of interest.

References

  1. Chen, M.; Chen, J.; Sun, F. Agricultural phosphorus flow and its environmental impacts in China. Sci. Total Environ. 2008, 405, 140–152. [Google Scholar] [CrossRef] [PubMed]
  2. Rowe, H.; Withers, P.J.A.; Baas, P.; Chan, N.I.; Doody, D.; Holiman, J.; Jacobs, B.; Li, H.G.; MacDonald, G.K.; McDowell, R.; et al. Integrating legacy soil phosphorus into sustainable nutrient management strategies for future food, bioenergy and water security. Nutr. Cycl. Agroecosyst. 2015, 104, 393–412. [Google Scholar] [CrossRef]
  3. Koopmans, G.F.; Chardon, W.J.; Dolfing, J.; Oenema, O.; van der Meer, P.; van Riemsdijk, W.H. Wet chemical and phosphorus 31 nuclear magnetic resonance analysis of phosphorus speciation in a sandy soil receiving long-term fertilizer or animal manure applications. J. Environ. Qual. 2003, 32, 287–295. [Google Scholar] [CrossRef] [PubMed]
  4. Ockenden, M.C.; Hollaway, M.J.; Beven, K.J.; Collins, A.L.; Evans, R.; Falloon, P.D.; Forber, K.J.; Hiscock, K.M.; Kahana, R.; Macleod, C.J.A.; et al. Major agricultural changes required to mitigate phosphorus losses under climate change. Nat. Commun. 2017, 8, 1. [Google Scholar] [CrossRef] [PubMed] [Green Version]
  5. Peng, L.; Xue, X.G.; Tang, Q.H.; Zhu, Y.; Xiao, L.J.; Yang, Y.; Lin, Q.Q. Phosphorus retention and loss in three types of soils with implications for geographical pattern of eutrophication in China. Water Environ. J. 2019, 34, 9–18. [Google Scholar] [CrossRef]
  6. Cao, N.; Chen, X.P.; Cui, Z.L.; Zhang, F.S. Change in soil available phosphorus in relation to the phosphorus budget in China. Nutr. Cycl. Agroecosyst. 2012, 94, 161–170. [Google Scholar] [CrossRef]
  7. Messiga, A.J.; Ziadi, N.; Ple’net, D.; Parent, L.E.; Morel, C. Long-term changes in soil phosphorus status related to P budgets under maize monoculture and mineral P fertilization. Soil Use Manag. 2010, 26, 354–364. [Google Scholar] [CrossRef]
  8. Shen, P.; Xu, M.G.; Zhang, H.M.; Yang, X.Y.; Huang, S.M.; Zhang, S.X.; He, X.H. Long-term response of soil Olsen P and organic C to the depletion or addition of chemical and organic fertilizers. Catena 2014, 118, 20–27. [Google Scholar] [CrossRef]
  9. Zhan, X.Y.; Zhang, L.; Zhou, B.K.; Zhu, P.; Zhang, S.X.; Xu, M.G. Changes in Olsen Phosphorus Concentration and Its Response to Phosphorus Balance in Black Soils under Different Long-Term Fertilization Patterns. PLoS ONE 2015, 10, e0131713. [Google Scholar] [CrossRef]
  10. Zhang, W.W.; Wang, Q.; Wu, Q.H.; Zhang, S.X.; Zhu, P.; Peng, C.; Huang, S.M.; Wang, B.R.; Zhang, H.M. The response of soil Olsen P to the P budgets of three typical cropland soil types under long-term fertilization. PLoS ONE 2020, 15, e0230178. [Google Scholar] [CrossRef] [PubMed]
  11. Aulakh, M.S.; Garg, A.K.; Kabba, B.S. Phosphorus accumulation, leaching and residual effects on crop yields from long-term application in the subtropics. Soil Use Manag. 2007, 23, 417–427. [Google Scholar] [CrossRef]
  12. Blake, L.; Mercik, S.; Koerschens, M.; Moskal, S.; Poulton, P.R.; Goulding, K.W.T.; Weige, A.; Powlson, D.S. Phosphorus content in soil, uptake by plants and budget in three European long-term field experiments. Nutr. Cycl. Agroecosyst. 2000, 56, 263–275. [Google Scholar] [CrossRef]
  13. Tiessen, H.; Moir, J. Characterization of Available P by Sequential Extraction; CRC Press: Boca Raton, FL, USA, 1993. [Google Scholar]
  14. Hedley, M.J.; Stewart, J.W.B.; Chauhan, B.S. Changes in inorganic and organic soil phosphorus fractions induced by cultivation practices and by laboratory incubations. J. Soil Sci. Soc. Am. 1982, 46, 970–976. [Google Scholar] [CrossRef]
  15. Meyer, G.; Bell, M.J.; Doolette, C.L.; Brunetti, G.; Zhang, Y.Q.; Lombi, E.; Kopittke, P.M. Plant-Available Phosphorus in Highly Concentrated Fertilizer Bands: Effects of Soil Type, Phosphorus Form, and Coapplied Potassium. J. Agric. Food Chem. 2020, 68, 29. [Google Scholar] [CrossRef] [PubMed]
  16. 16 Fang, H.W.; Chen, M.H.; Chen, Z.H.; Zhao, H.M.; He, G.J. Effects of sediment particle morphology on adsorption of phosphorus elements. Int. J. Sediment Res. 2013, 28, 246–253. [Google Scholar] [CrossRef]
  17. Yan, X.; Wei, Z.Q.; Hong, Q.Q.; Lu, Z.H.; Wu, J.F. Phosphorus fractions and sorption characteristics in a subtropical paddy soil as influenced by fertilizer sources. Geoderma 2017, 295, 80–85. [Google Scholar] [CrossRef]
  18. Schmiedera, F.; Bergströma, L.; Riddlea, M.; Gustafssona, J.P.; Klysubunb, W.; Zehetnerc, F.; Condrond, L.; Kirchmanna, H. Phosphorus speciation in a long-term manure-amended soil profile-Evidence from wet chemical extraction, 31P-NMR and P K-edge XANES spectroscopy. Geoderma 2018, 322, 19–27. [Google Scholar] [CrossRef]
  19. Wu, Q.H.; Zhang, S.X.; Zhu, P.; Huang, S.M.; Wang, B.R.; Zhao, L.P.; Xu, M.G. Characterizing differences in the phosphorus activation coefficient of three typical cropland soils and the influencing factors under long-term fertilization. PLoS ONE 2017, 12, e0176437. [Google Scholar] [CrossRef] [Green Version]
  20. Luo, G.B. FAO World Soil Legend Classification System Revision. Adv. Soil Sci. 1988, 6, 22–32. (In Chinese) [Google Scholar]
  21. Olsen, S.R. Estimation of Available Phosphorus in Soils by Extraction with Sodium Bicarbonate; Miscellaneous Paper; Institute for Agricultural Research: Samaru, Nigeria, 1954. [Google Scholar]
  22. Lu, R.K. Analytical Methods of Soil and Agricultural Chemistry; China Agricultural Science and Technology Press: Beijing, China, 1999. (In Chinese) [Google Scholar]
  23. D´iaz, I.; Torrent, J. Changes in Olsen P in Relation to P Balance in Contrasting Agricultural Soils. Pedosphere 2016, 26, 636–642. [Google Scholar] [CrossRef]
  24. Medinski, T.; Freese, D.; Reitz, T. Changes in soil phosphorus balance and phosphorus-use efficiency under long-term fertilization conducted on agriculturally used Chernozem in Germany. Can. J. Soil Sci. 2018, 98, 650–662. [Google Scholar] [CrossRef]
  25. Fox, R.L.; Kamprath, E.J. Phosphate Sorption Isotherms for Evaluating the Phosphate Requirements of Soils. Soil Sci. Soc. Am. J. 1970, 34, 902–907. [Google Scholar] [CrossRef]
  26. Yang, X.Y.; Chen, X.W.; Yang, X.T. Effect of organic matter on phosphorus adsorption and desorption in a black soil from Northeast China. Soil Tillage Res. 2019, 187, 85–91. [Google Scholar] [CrossRef]
  27. Luo, L.; Ma, Y.B.; Sanders, R.L.; Xu, C.; Li, J.M.; Myneni, S.C.B. Phosphorus speciation and transformation in long-term fertilized soil: Evidence from chemical fractionation and P K-edge XANES spectroscopy. Nutr. Cycl. Agroecosyst. 2017, 107, 1–12. [Google Scholar] [CrossRef]
  28. Dou, Z.X.; Ramberg, C.F.; Toth, J.D.; Wang, Y.; Sharpley, A.N.; Boyd, S.E.; Chen, C.R.; Williams, D.; Xu, Z.H. Phosphorus speciation and sorption-desorption characteristics in heavily manured soils. Soil Sci. Soc. Am. J. 2009, 73, 93–101. [Google Scholar] [CrossRef] [Green Version]
  29. Milića, S.; Ninkova, J.; Zeremskia, T.; Latkovićb, D.; Šeremešićb, S.; Radovanovićc, V.; Žarković, B. Soil fertility and phosphorus fractions in a calcareous chernozem after a long-term field experiment. Geoderma 2019, 339, 9–19. [Google Scholar] [CrossRef]
  30. Song, K.; Xue, Y.; Zheng, X.Q.; Lv, W.g.; Qiao, H.X.; Qin, Q.; Yang, J.J. Effects of the continuous use of organic manure and chemical fertilizer on soil inorganic phosphorus fractions in calcareous soil. Sci. Rep. 2017, 7, 1164. [Google Scholar] [CrossRef] [Green Version]
  31. Pizzeghello, D.; Berti, A.; Nardi, S.; Morari, F. Phosphorus-related properties in the profiles of three Italian soils after long-term mineral and manure applications. Agric. Ecosyst. Environ. 2014, 189, 216–228. [Google Scholar] [CrossRef]
  32. Kang, J.; Hesterberg, D.; Osmond, D.L. Soil organic matter effects on phosphorus sorption: A path analysis. Soil Sci. Soc. Am. J. 2009, 73, 360–366. [Google Scholar] [CrossRef]
  33. Wang, L.; Luo, X.S.; Liao, H.; Chen, W.; Wei, D.; Cai, P.; Huang, Q.Y. Ureolytic microbial community is modulated by fertilization regimes and particle-size fractions in a Black soil of Northeastern China. Soil Biol. Biochem. 2018, 116, 171–178. [Google Scholar] [CrossRef]
  34. Heuck, C.; Weig, A.; Spohn, M. Soil microbial biomass C:N:P stoichiometry and microbial use of organic phosphorus. Soil Biol. Biochem. 2015, 85, 119–129. [Google Scholar] [CrossRef]
  35. Shen, J.; Yuan, L.; Zhang, J.; Li, H.; Bai, Z.; Chen, X.; Zhang, W.; Zhang, F. Phosphorus dynamics: From soil to plant. Plant Physiol. 2011, 156, 997–1005. [Google Scholar] [CrossRef] [PubMed] [Green Version]
  36. Zicker, T.; von Tucher, S.; Kavka, M.; Eichler-Lobermann, B. Soil test phosphorus as affected by phosphorus budgets in two long-term field experiments in Germany. Field Crops Res. 2018, 218, 158–170. [Google Scholar] [CrossRef]
Figure 1. Approximate distribution map of experiments and fertilization treatment. 1 represents HRB, 2 represents GZL. (a): Location, (b): Trial design, (c): Field view.
Agronomy 12 03146 g001
Figure 2. Accumulated of P budget at two fertilization sites. HRB and GZL are the abbreviations of the names of the long-term experiment sites, which are located in Harbin and Gongzhuling in China. CK, no fertilizer or manure; NK, nitrogen and potassium; NPK, nitrogen, phosphorus and potassium; MNPK, manure, nitrogen, phosphorus and potassium.
Agronomy 12 03146 g002
Figure 3. Relationship between ΔOlsen P and different P budget. HRB and GZL are the abbreviations of the names of long-term experiment sites, which are located in Harbin and Gongzhuling in China. CK, no fertilizer or manure; NK, nitrogen and potassium; NPK, nitrogen, phosphorus and potassium; MNPK, manure, nitrogen, phosphorus and potassium. The fitting equation of MNPK is y = A/(1 + exp (−(x−x0)/b)), “A” represents the equilibrium value, * p < 0.05, “n” represents the number of samples.
Agronomy 12 03146 g003
Figure 4. Correlation analysis between ΔOlsen P and P fractions. NK, nitrogen and potassium; NPK, nitrogen, phosphorus and potassium; MNPK, manure, nitrogen, phosphorus and potassium. The red indicates positive correlation, the blue indicates negative correlation, the circle is large and dark, the correlation is strong. The * in the circle indicates significant correlation, and the value on the left of the figure indicates R2. *, p < 0.05, **, p < 0.01, ***, p < 0.001. (a) NK treatment, (b) NPK treatment, (c) MNPK treatment.
Agronomy 12 03146 g004
Figure 5. RDA analysis of P fractions and parameters. NK, nitrogen and potassium; NPK, nitrogen, phosphorus and potassium; MNPK, manure, nitrogen, phosphorus and potassium. (a) NK treatment, (b) NPK treatment, (c) MNPK treatment.
Agronomy 12 03146 g005
Table 1. Soil type, geographical location and climate in the two experiments.
PlaceStarting YearSoil TypeLatitudeLongitudeAltitude (m)MAT (2)
(°C)
MAP (3)
(mm)
MAE (4)
(mm)
HRB (1)1979haplic
phaeozems
45°40′126°35′1514.95381565
GZL1990haplic
phaeozems
43°30′124°48′2206.65911409
(1) HRB and GZL are the abbreviations of the names of the long-term experiment sites, which are located in Harbin and Gongzhuling in China. (2) MAT is the mean annual temperature, (3) MAP is the mean annual precipitation, (4) MAE is the average annual evaporation.
Table 2. Initial physical and chemical properties of soil in the two experiments.
PlaceSOC (2)TN (3)AN (4)TP (5)Olsen-P0 (6)TK (7)AK (8)pHBulk
Density
CaCO3SandSiltClay
g kg−1g kg−1mg kg−1g kg−1mg kg−1g kg−1mg kg−1-g cm−3%%%%
HRB (1)15.41.51511.0722.225.5200.07.21.40.0146.1 23.8 30.1
GZL13.21.41140.6111.818.4158.37.61.21.6842.0 28.7 29.3
(1) HRB and GZL are the abbreviations of the names of the long-term experiment sites, which are located in Harbin and Gongzhuling in China. (2) SOC is soil organic carbon, (3) TN is soil total nitrogen, (4) AN is soil ammonia nitrogen, (5) TP is total phosphorus, (6) Olsen P0 is the initial Olsen P, (7) TK is total potassium, (8) AK is effective potassium.
Table 3. Fertilizer input and crop rotation.
PlaceTreatmentInorganic N-P-K (kg/hm2)Manure
(t ha−1)
Types of ManureCrop Rotation
HRB (1)CK (2)W (3)-0-0-0C-0-0-0S-0-0-00-Wheat-corn-soybean
NKW-150-0-63C-150-0-63S-75-0-620-
NPKW-150-33-63C-150-33-63S-75-65.5-620-
MNPKW-150-33-63C-150-33-63S-75-65.5-6218.6Horse
GZLCKC-0-0-00-Corn
NKC-50-0-680-
NPKC-50-36-680-
MNPKC-50-36-6823.0Pig/Cattle
(1) HRB and GZL are the abbreviations of the names of the long-term experiment sites, which are located in Harbin and Gongzhuling in China. (2) CK, no fertilizer or manure; NK, nitrogen and potassium; NPK, nitrogen, phosphorus and potassium; MNPK, manure, nitrogen, phosphorus and potassium. (3) The crops were wheat (W), corn (C) and soybean (S).
Table 4. Increase amount and percentage of P fractions at the two long-term experiments (mg kg−1).
Treatment1995 (Year)2000 (Year)2005 (Year)2010 (Year)
ΔLP (1)ΔMLPΔSPΔLPΔMLP ΔSPΔLPΔMLP ΔSPΔLPΔMLP ΔSP
CK (2)0.91 ± 0.2 aA−12.5 ± 0.4 aA1.1± 2.5 aA−10.5 ± 1.9 bA−7.1 ± 5.9 aA−1.4 ± 1.5 aA−17.1 ± 10.9 cA−16.7 ± 6.9 aA−19.7 ± 2.9 bA−22.3 ± 8.7 cA−15.9 ± 5.5 aA−17.8 ± 0.4 bA
NK−7.3 ± 2.6 aB−14.5 ± 0.6 aB−8.4 ± 1.1 aB−2.1 ± 2.3 bB−8.8 ± 4.1 bA−12.7 ± 6.4 aB−7.5 ± 2.2 aA−17.3 ± 5.5 abA−13.3 ± 8.6 aA−17.8 ± 3.4 cA−17.3 ± 9.6 a bA−12.3 ± 8.5 aA
NPK1.24 ± 0.7 aAC25.2 ± 6.0 aC−18.1 ± 1.2 aC7.75 ± 4.4 bC67.2 ± 13.5 bB−16.0 ± 9.1 aB13.4 ± 7.7 bB79.9 ± 13.7 bB−16.5 ± 1.9 abA25.5 ± 2.1 cB79.2 ± 4.1 bB−15.1 ± 2.6 abA
MNPK3.5 ± 2.1 aAC29.1 ± 7.6 aC−13.3 ± 10.5 aAB38.1 ± 11.4 bD119.9 ± 27.1 bC24.3 ± 16.8 bD40.8 ± 21.0 bB290.6 ± 183.1 bcC23.5 ± 5.5 bC90.2 ± 22.9 cC437.3 ± 71.3 cC55.3 ± 4.4 cC
TreatmentΔLP %ΔMLP %ΔSP %ΔLP %ΔMLP%ΔSP %ΔLP %ΔMLP % ΔSP %ΔLP %ΔMLP %ΔSP %
CK−0.28 ± 0.1 aA−5.9 ± 0.3 aA 0.5 ± 0.6 aA−2.5 ± 0.1 bA−3.3 ± 1.6 bA−0.9 ± 0.6 bA−3.9 ± 2.8 bA−3.1 ± 2.1 bA−2.9 ± 1.5 cA−3.1 ± 0.7 bA−2.6 ± 1.9 bA−2.2 ± 0.7 cA
NK−2.0 ± 0.6 aB−1.5 ± 0.3 aB 0.7 ± 0.9 aA −1.0 ± 0.2 bB−3.4 ± 1.6 bA−0.9 ± 0.5 aA−2.4 ± 0.6 aA−9.4 ± 6.3 bA −0.2 ± 0.4 aB −2.5 ± 0.7 aA−8.9 ± 6.5 bA−1.9 ± 1.2 bA
NPK1.3 ± 2.1 aC23.0 ± 1.1 aC−23.4 ± 0.4 aB0.4 ± 0.7 bC15.8 ± 9.0 aB20.0 ± 7.8 aB0.6 ± 0.5 abB18.3 ± 3.8 aB21.8 ± 4.4 aC 1.8 ± 0.7 abB16.1 ± 5.6 bB22.7 ± 6.3 aB
MNPK1.2 ± 1.7 aAC3.8 ± 1.7 aD−3.7 ± 1.1 aC4.3 ± 1.0 bD73.9 ± 20.1 bC −9.6 ± 5.5 aC6.4 ± 1.9 bC13.9 ± 5.9 cB−20.3 ± 3.2 bD5.1 ± 2.7 bB13.0 ± 6.0 cB −18.1 ± 0.3 bC
(1) ΔLP: lable P in 1995 minus which in 1990, Similarly, in other years ΔLP was also the LP of that year minus the LP of 1990, it is as same for ΔMLP and ΔSP. ΔLP = ΔResin−P + ΔNaHCO3−Pi + ΔNaHCO3−Po; ΔMLP = ΔNaOH−Pi + ΔNaOH−Po + ΔDHCl−Pi; ΔSP = ΔCHCl−Pi + ΔCHCl−Po + ΔResidual−P. ΔLP% = ΔResin−P %+ ΔNaHCO3−Pi%+ ΔNaHCO3−Po%; ΔMLP% = ΔNaOH−Pi% + ΔNaOH−Po% + ΔDHCl−Pi%; ΔSP% = ΔCHCl−Pi% + ΔCHCl−Po% + ΔResidual−P%. (2) CK, no fertilizer or manure; NK, nitrogen and potassium; NPK, nitrogen, phosphorus and potassium; MNPK, manure, nitrogen, phosphorus and potassium. Factor levels marked with the same letter do not differ at the p < 0.05 level of significance, The lower case letters(a) indicate P fractions in different periods. The uppercase letters(A) indicate P fractions in different treatments. The unit of all P fractions (ΔLP, ΔMLP and ΔSP) were mg kg−1.
Publisher’s Note: MDPI stays neutral with regard to jurisdictional claims in published maps and institutional affiliations.

