

Effects of Cutting Stages and Additives on the Fermentation Quality of Triticale, Rye and Oat Silage in Qinghai-Tibet Plateau
Abstract
:1. Introduction
2. Materials and Methods
2.1. Site Description
2.2. Experimental Materials
2.3. Experimental Design and Methods
2.4. Determination of the Fermentation Quality
2.5. Statistical Analysis
3. Results
3.1. Differences in DM, DMY and Fermentation Quality of Silage for the Single Factor
3.1.1. Forage Species
3.1.2. Cutting Stages
3.1.3. Lactic Acid Bacteria Additives
3.2. The Interactions of Two Factors
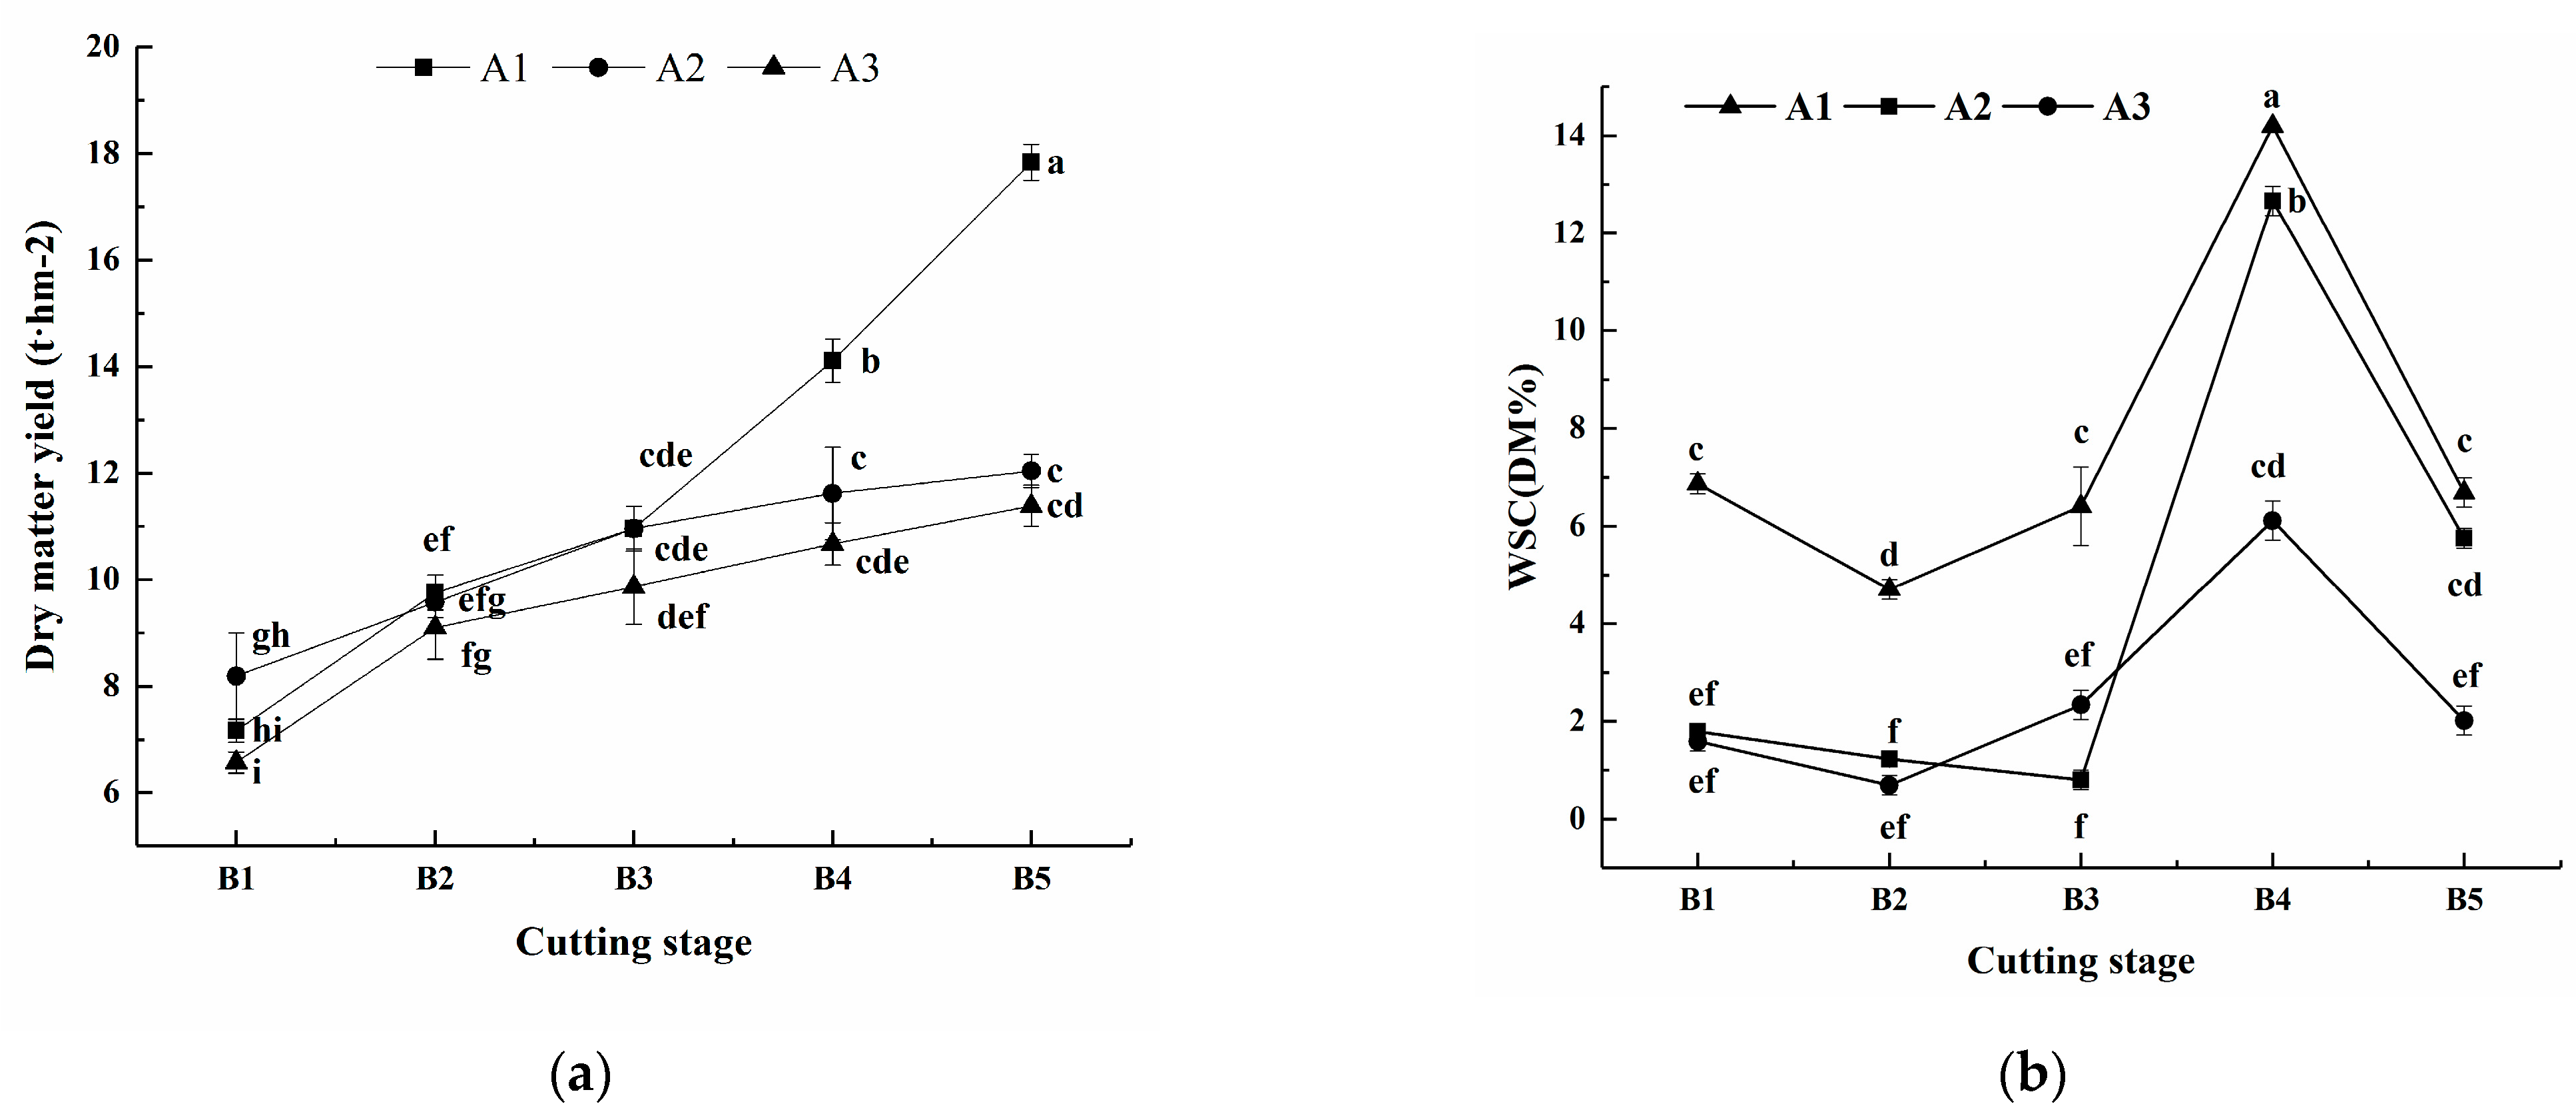
3.2.1. Forage Species × Cutting Stages
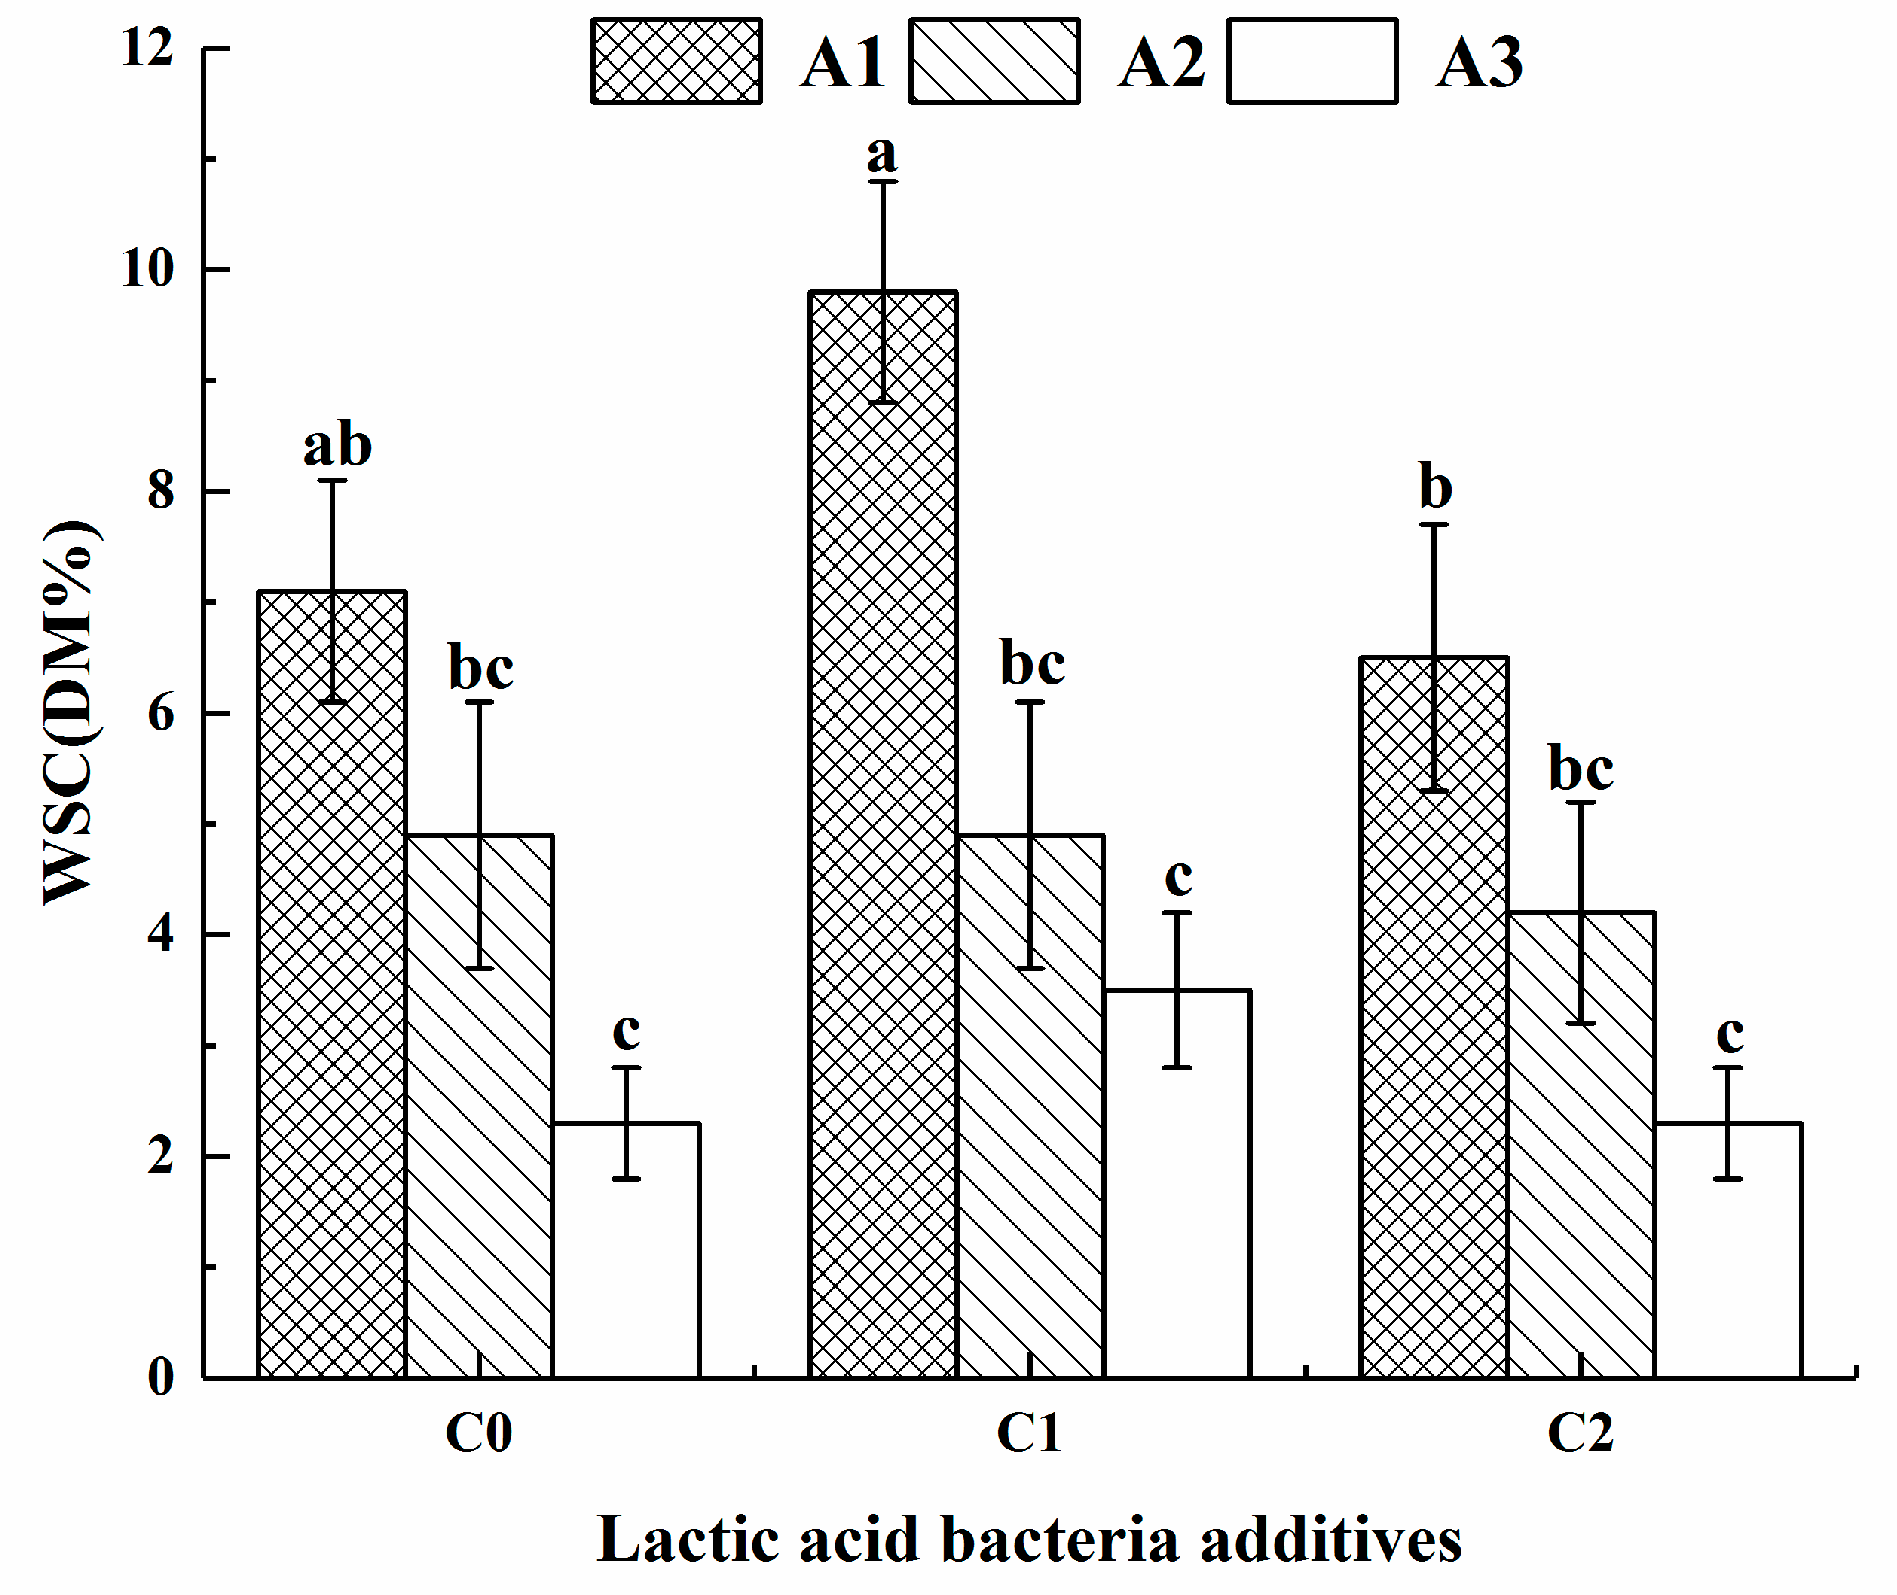
3.2.2. Forage Species × Lactic Acid Bacteria Additives
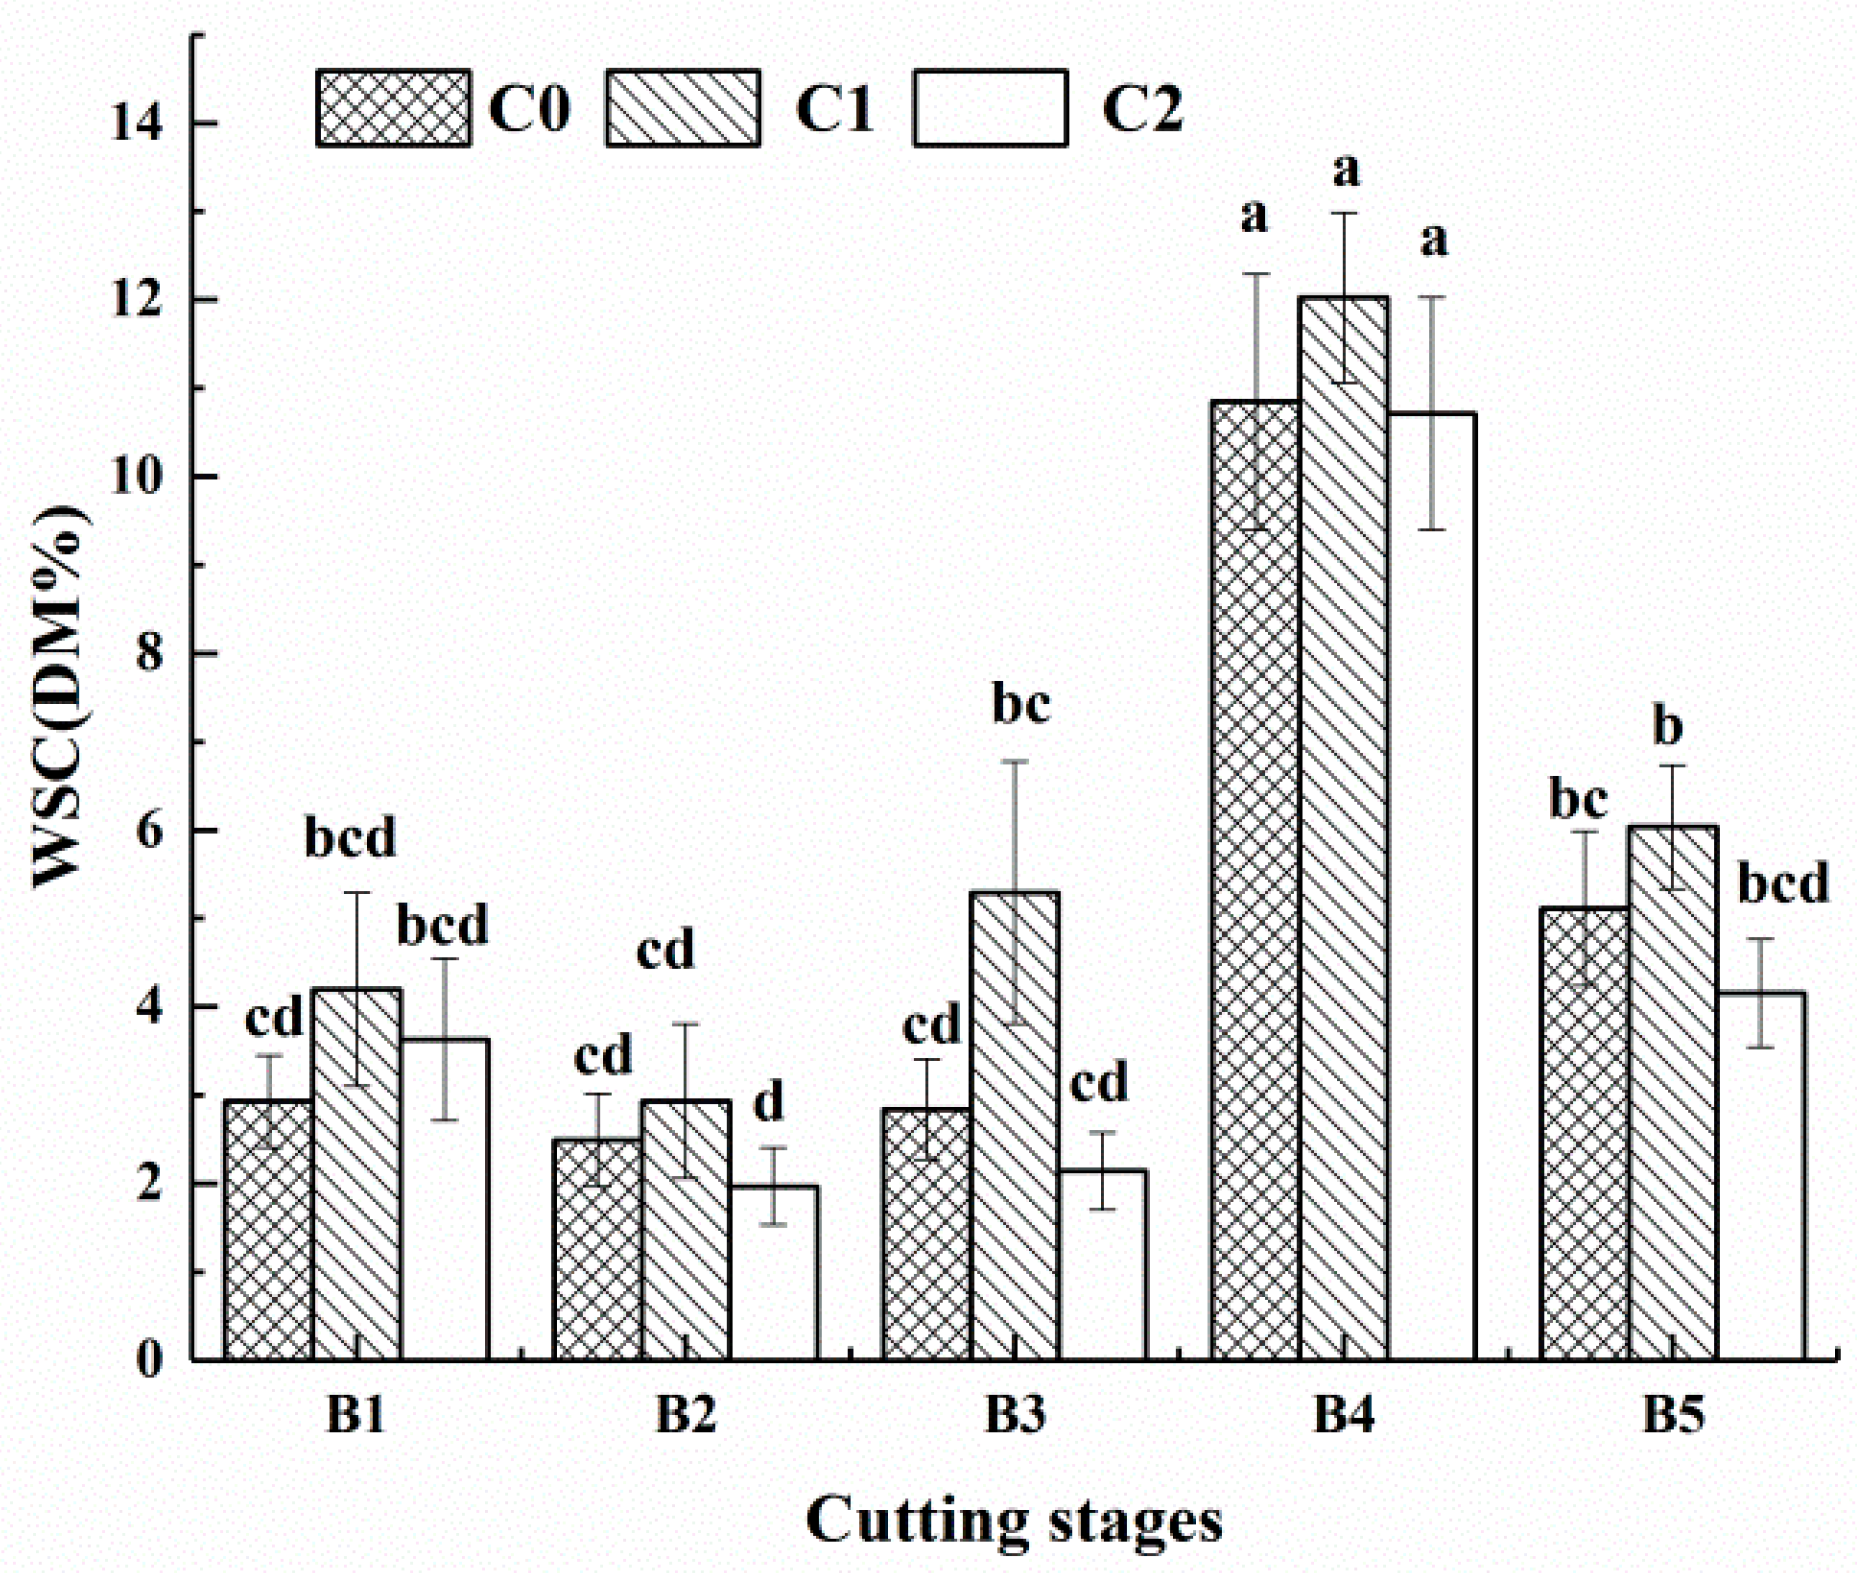
3.2.3. Cutting Stage × Lactic Acid Bacteria Additives
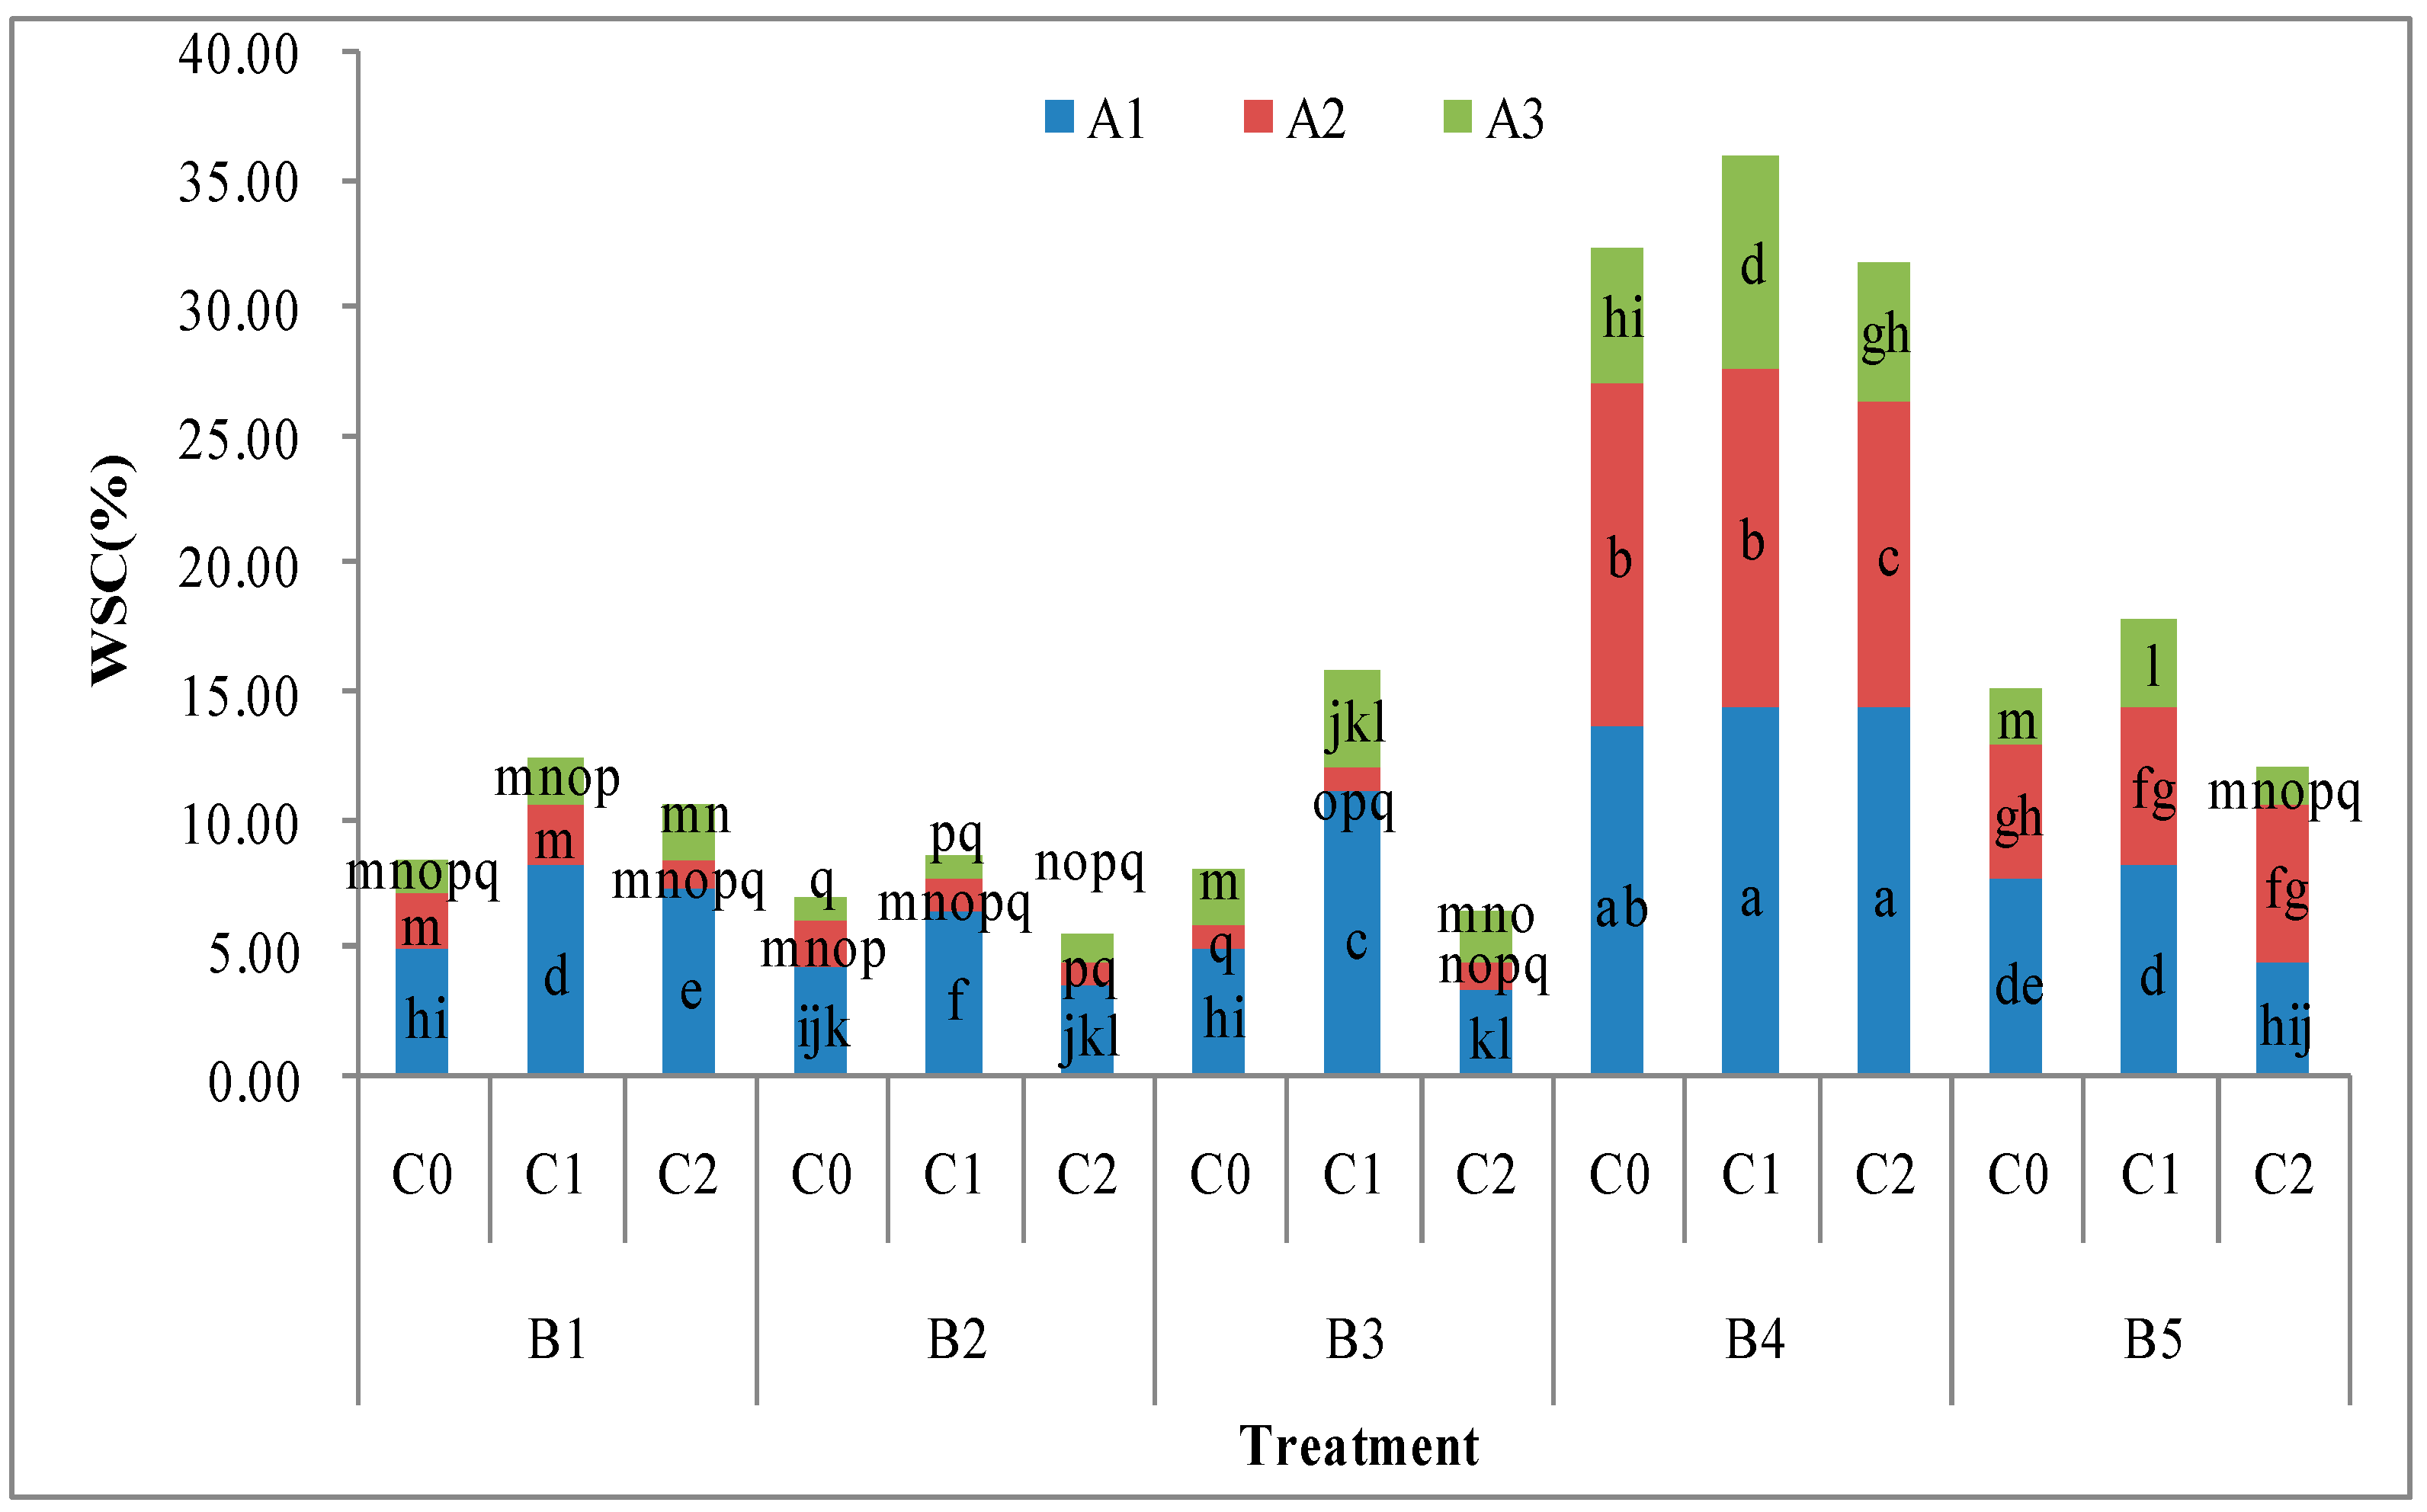
3.3. The Interactions of the Three Factors (Forage Species, Cutting Stages and Lactic Acid Bacteria Additives)
3.3.1. WSC Content
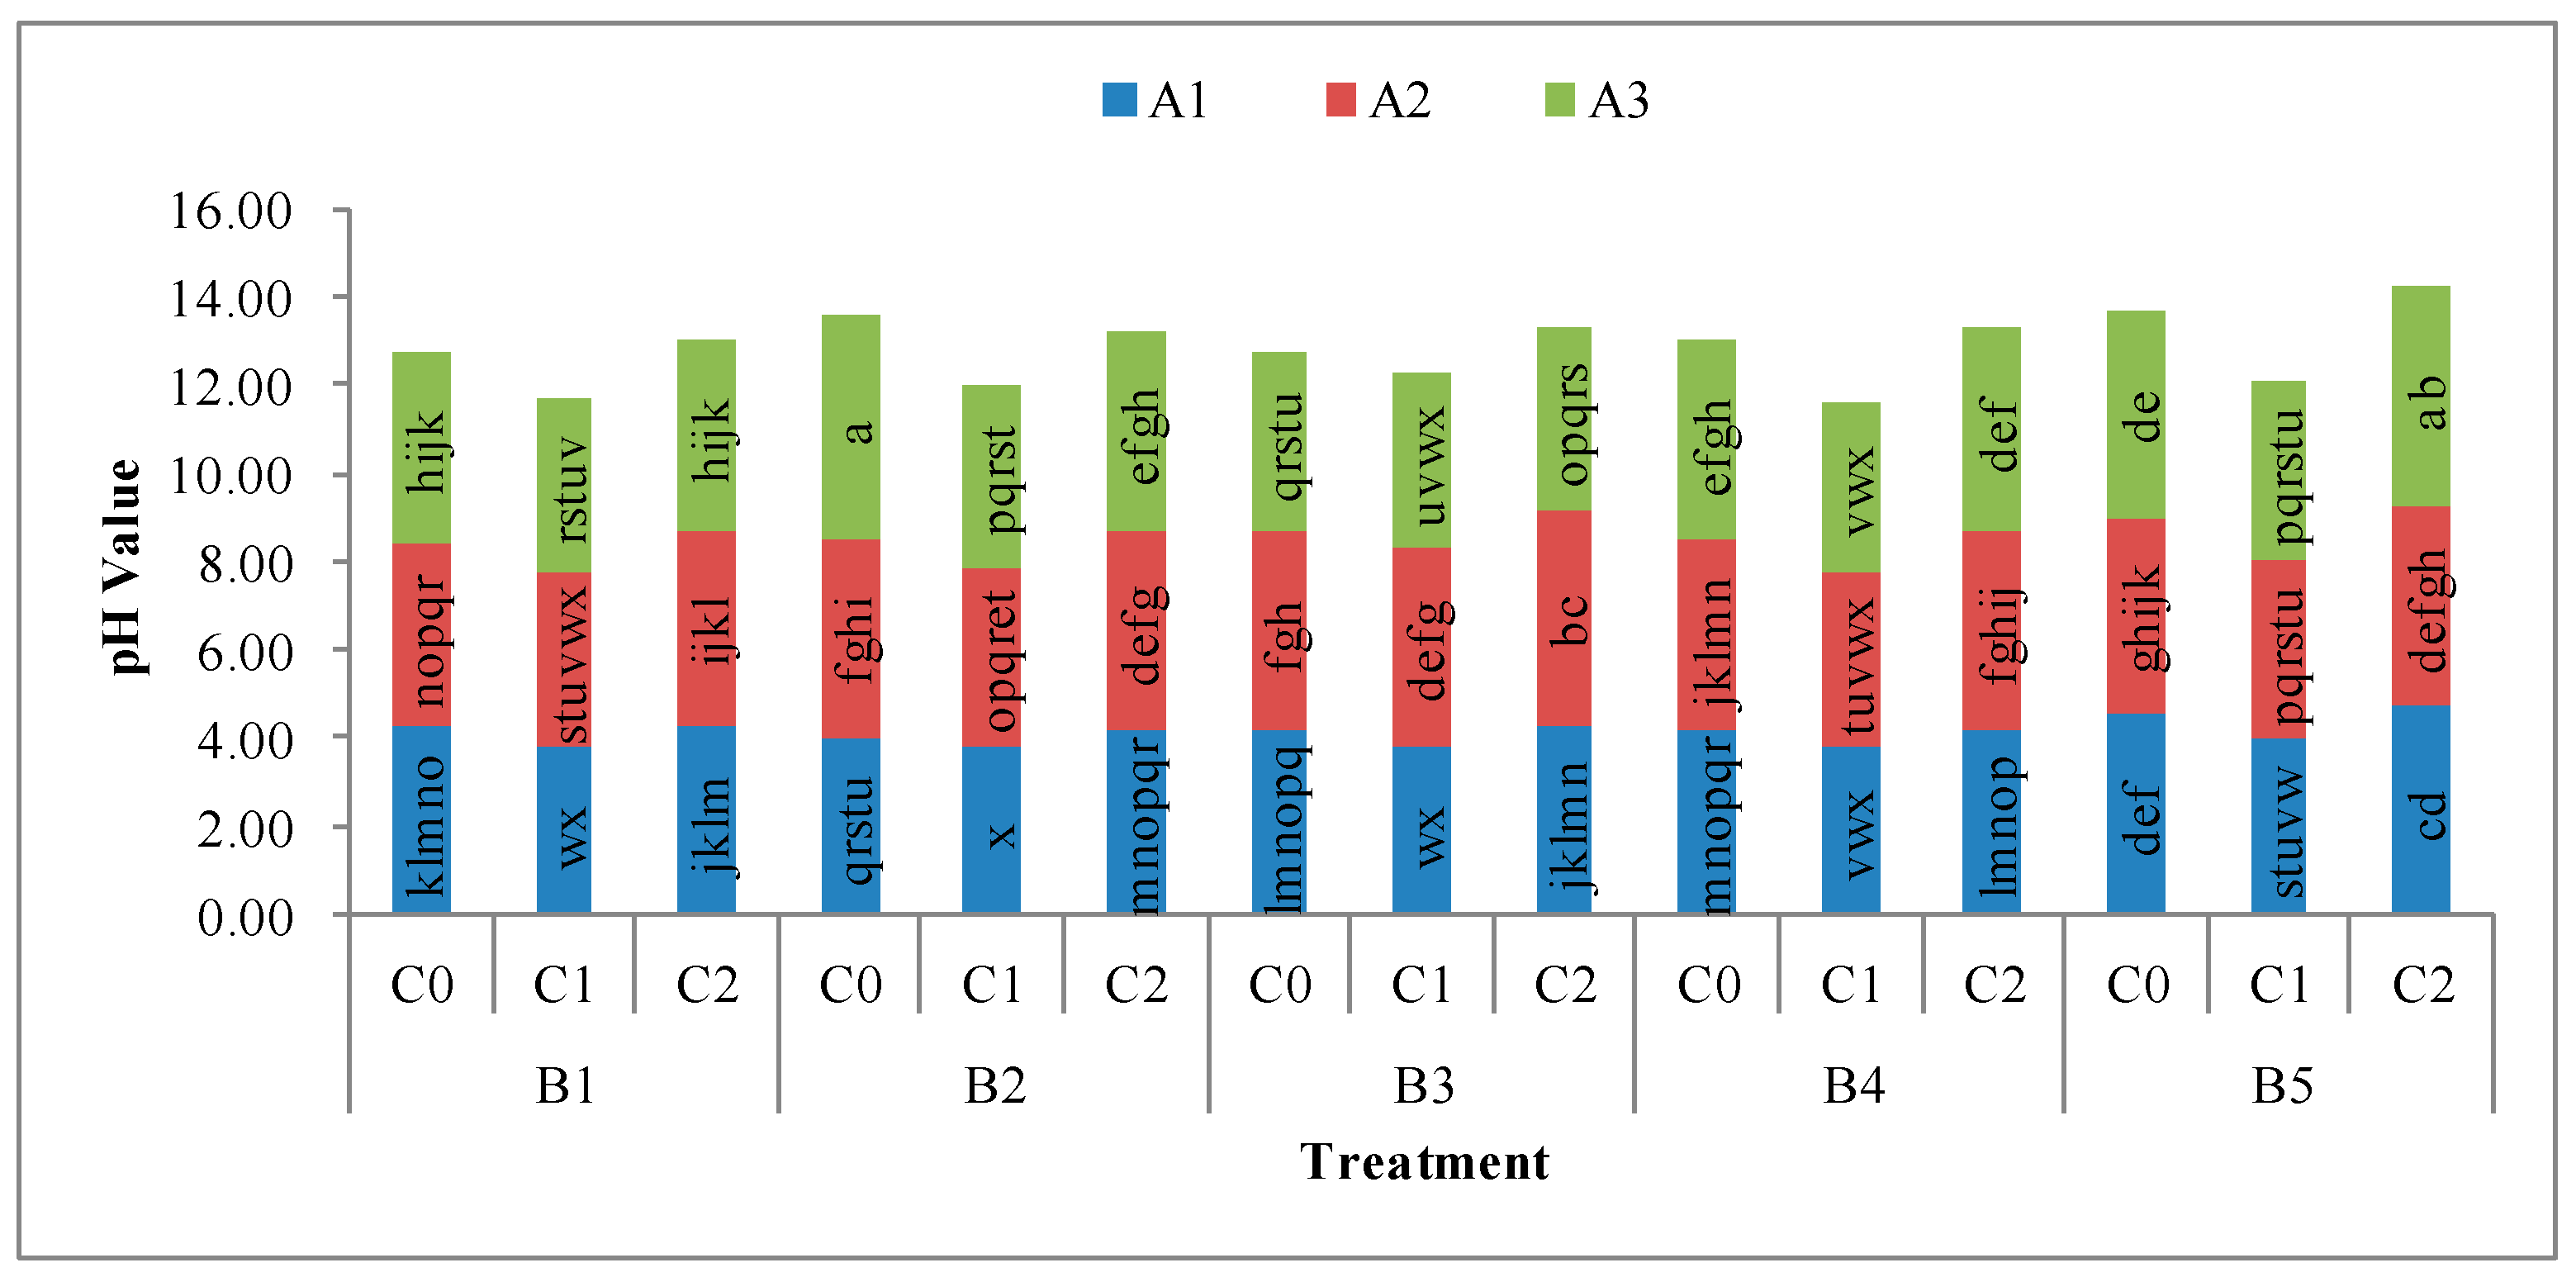
3.3.2. pH Value
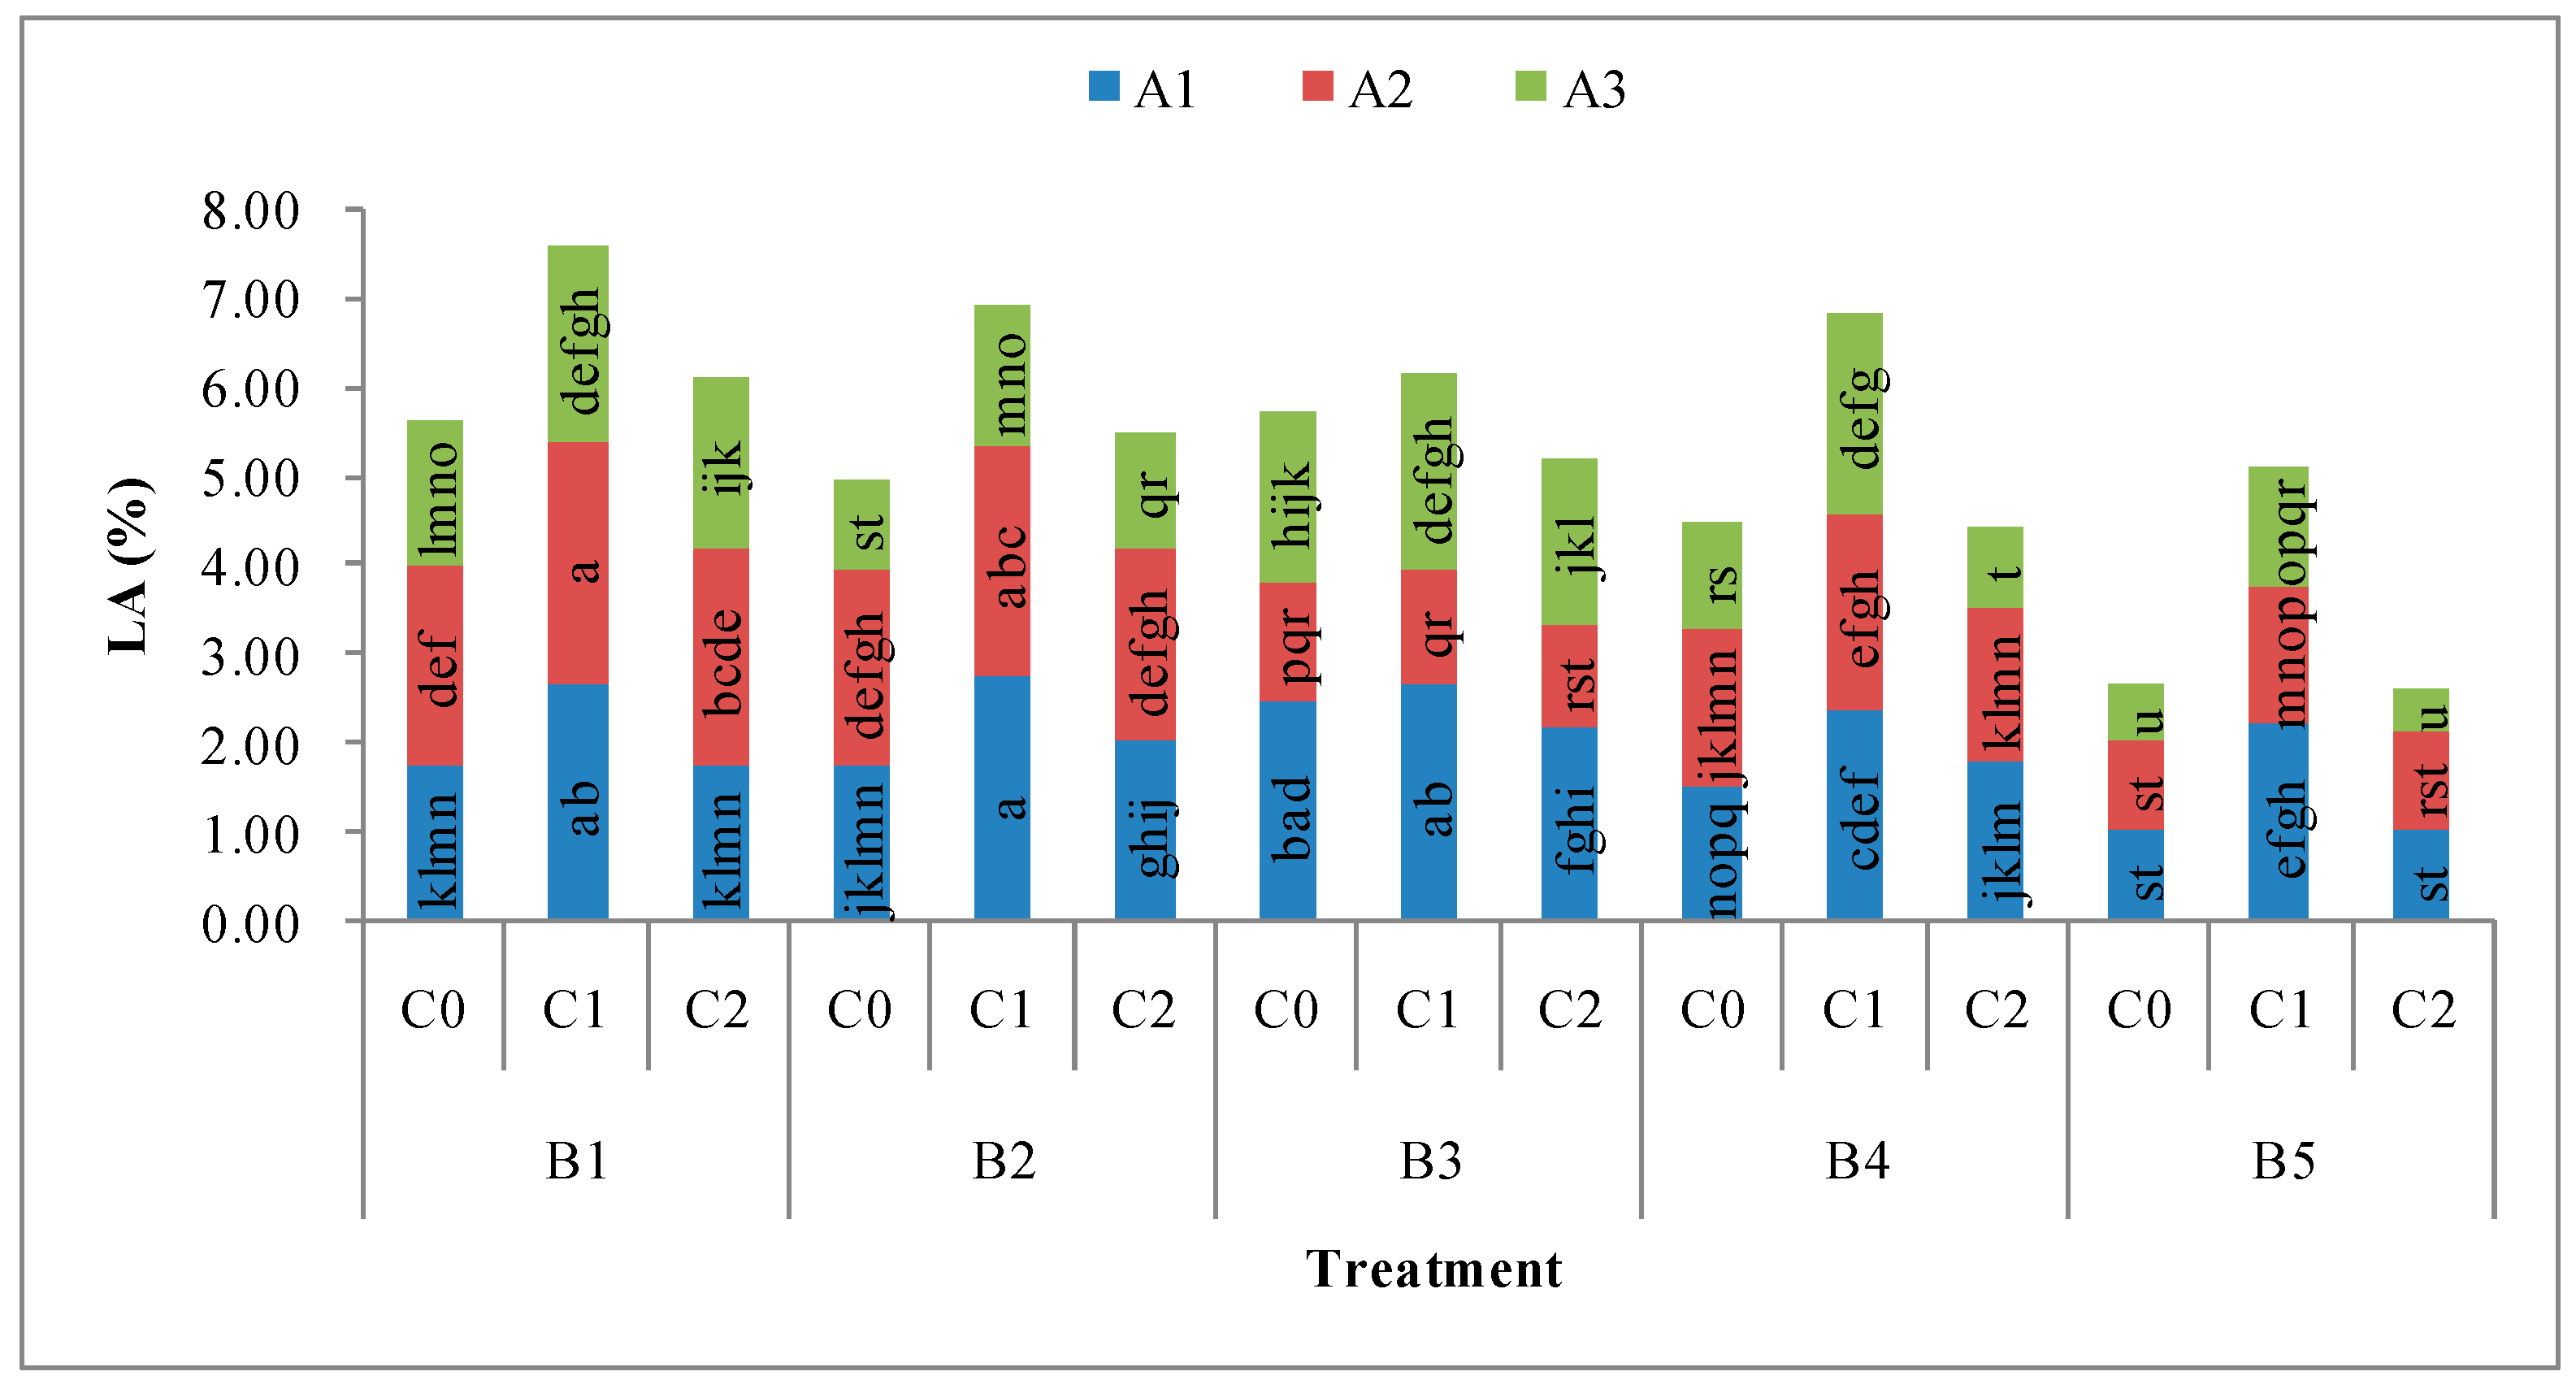
3.3.3. LA Content
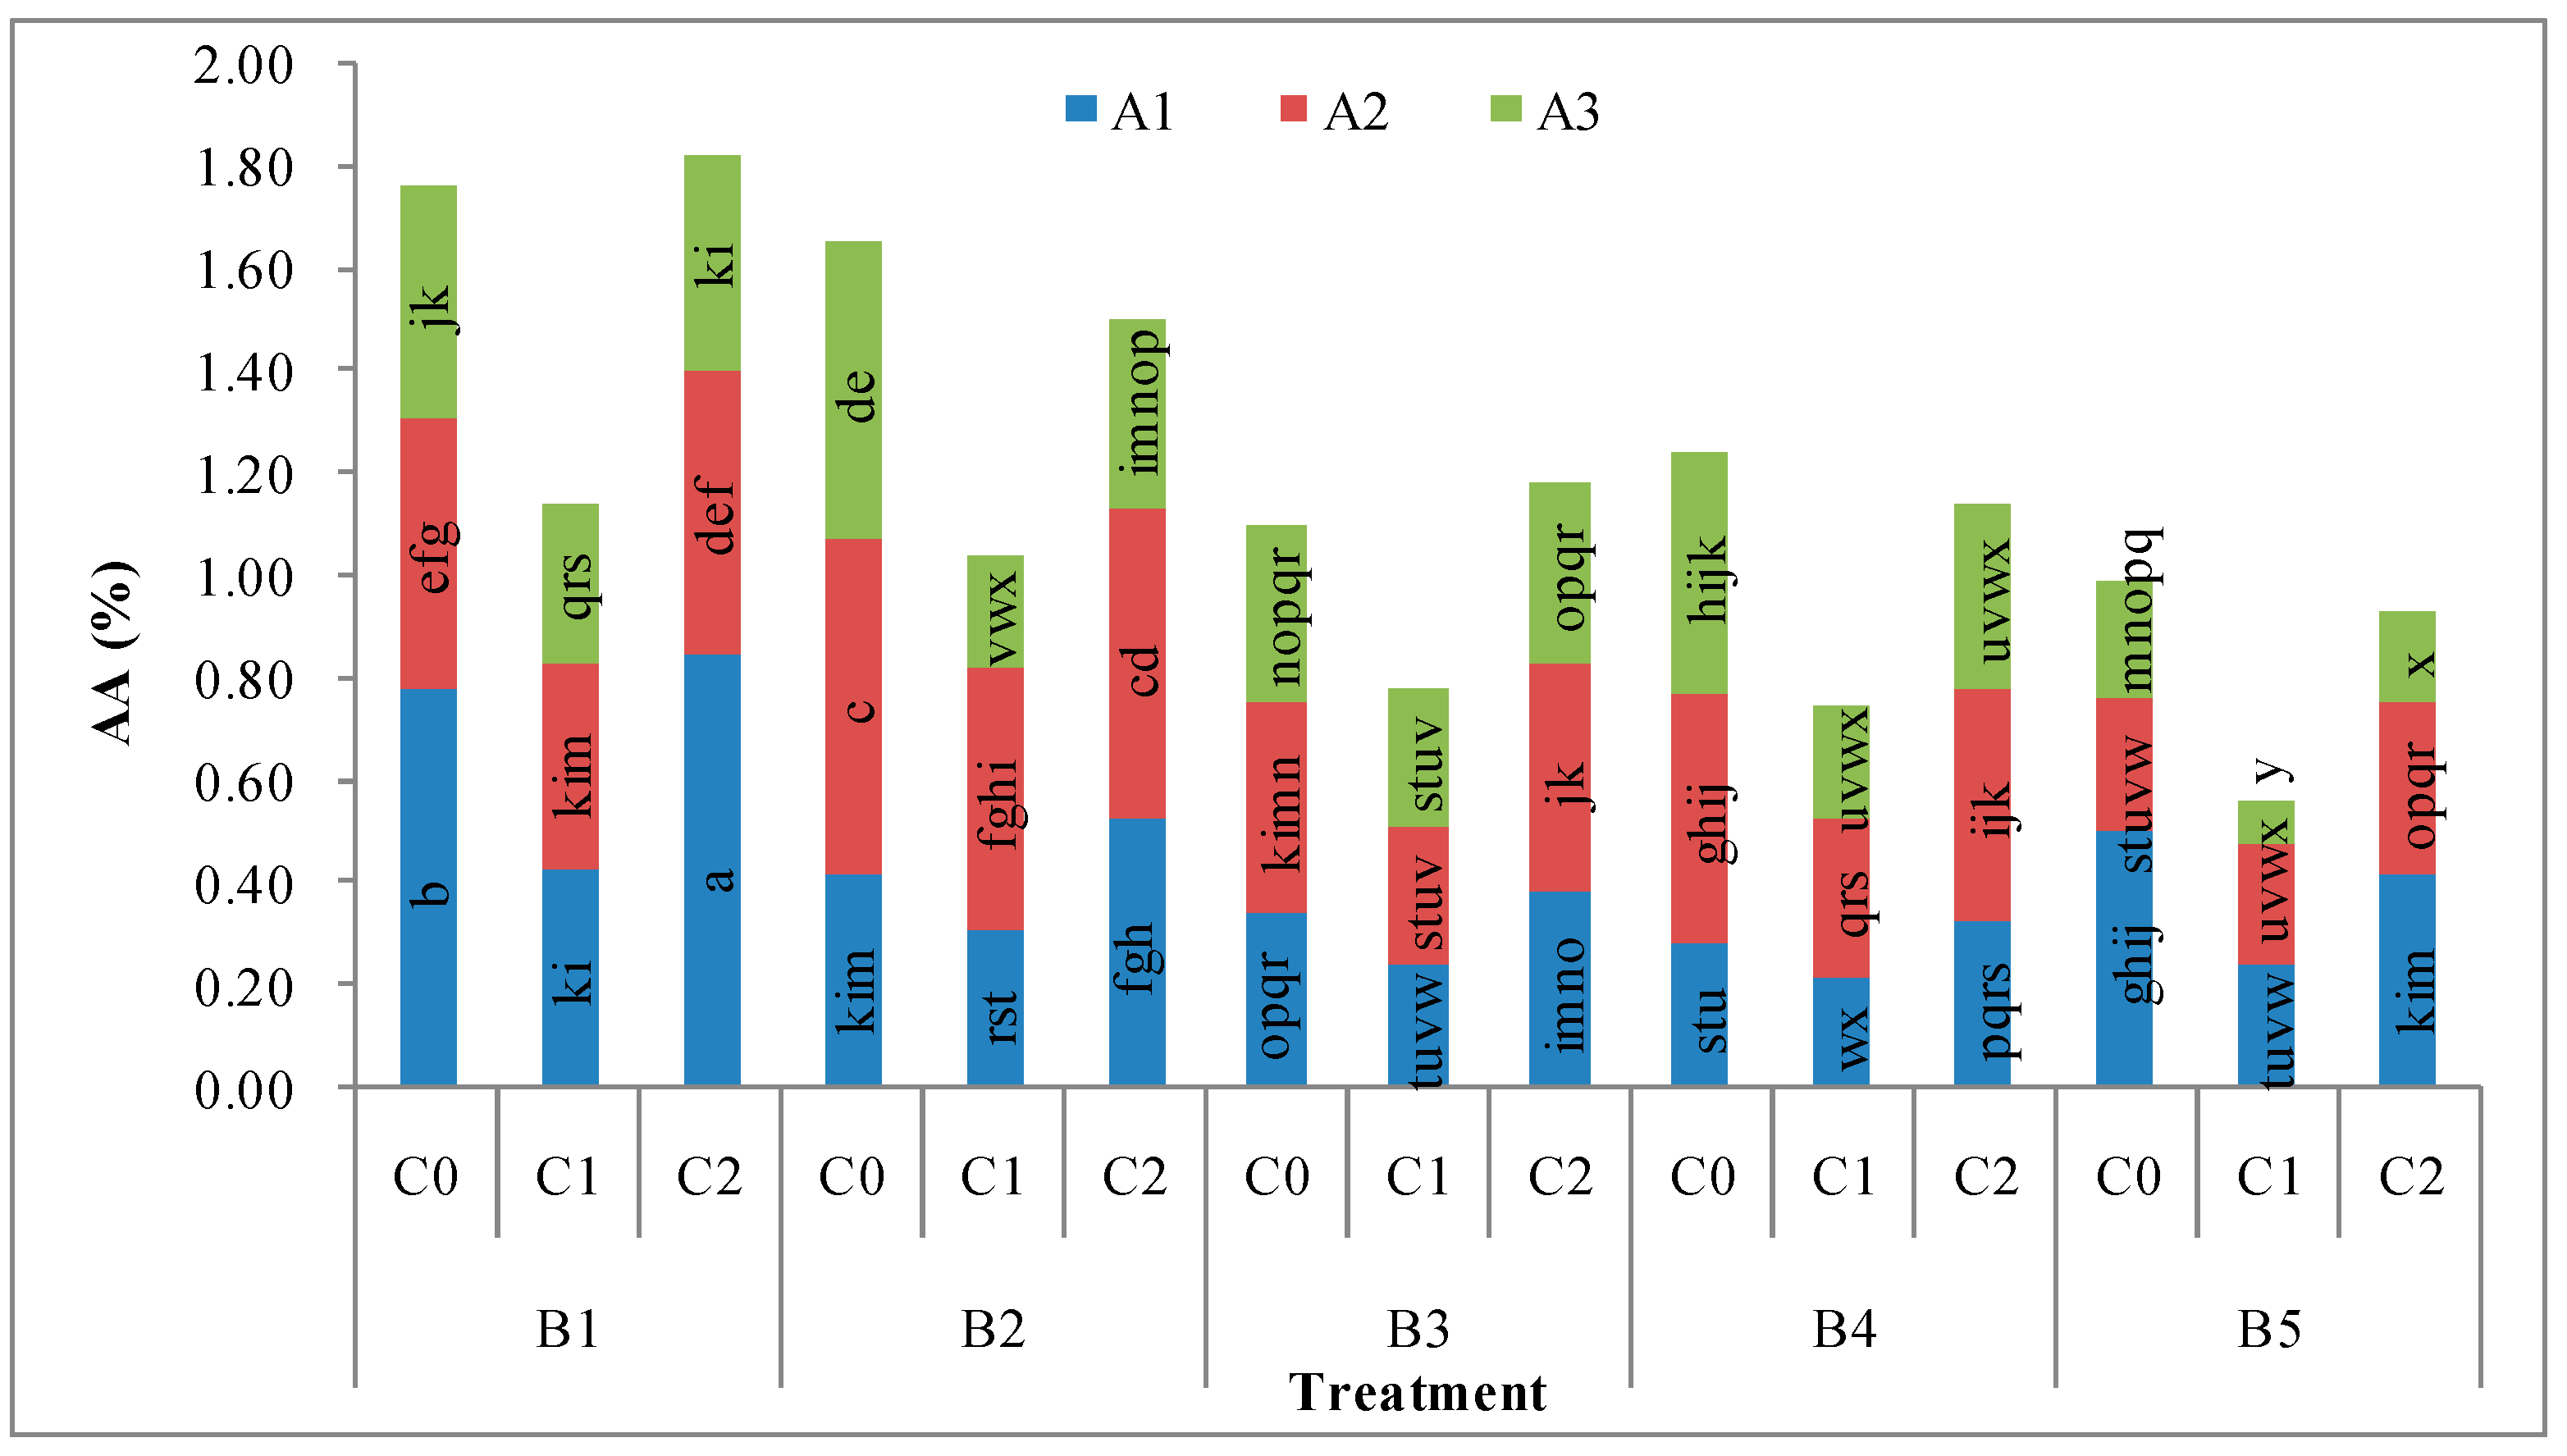
3.3.4. AA Content
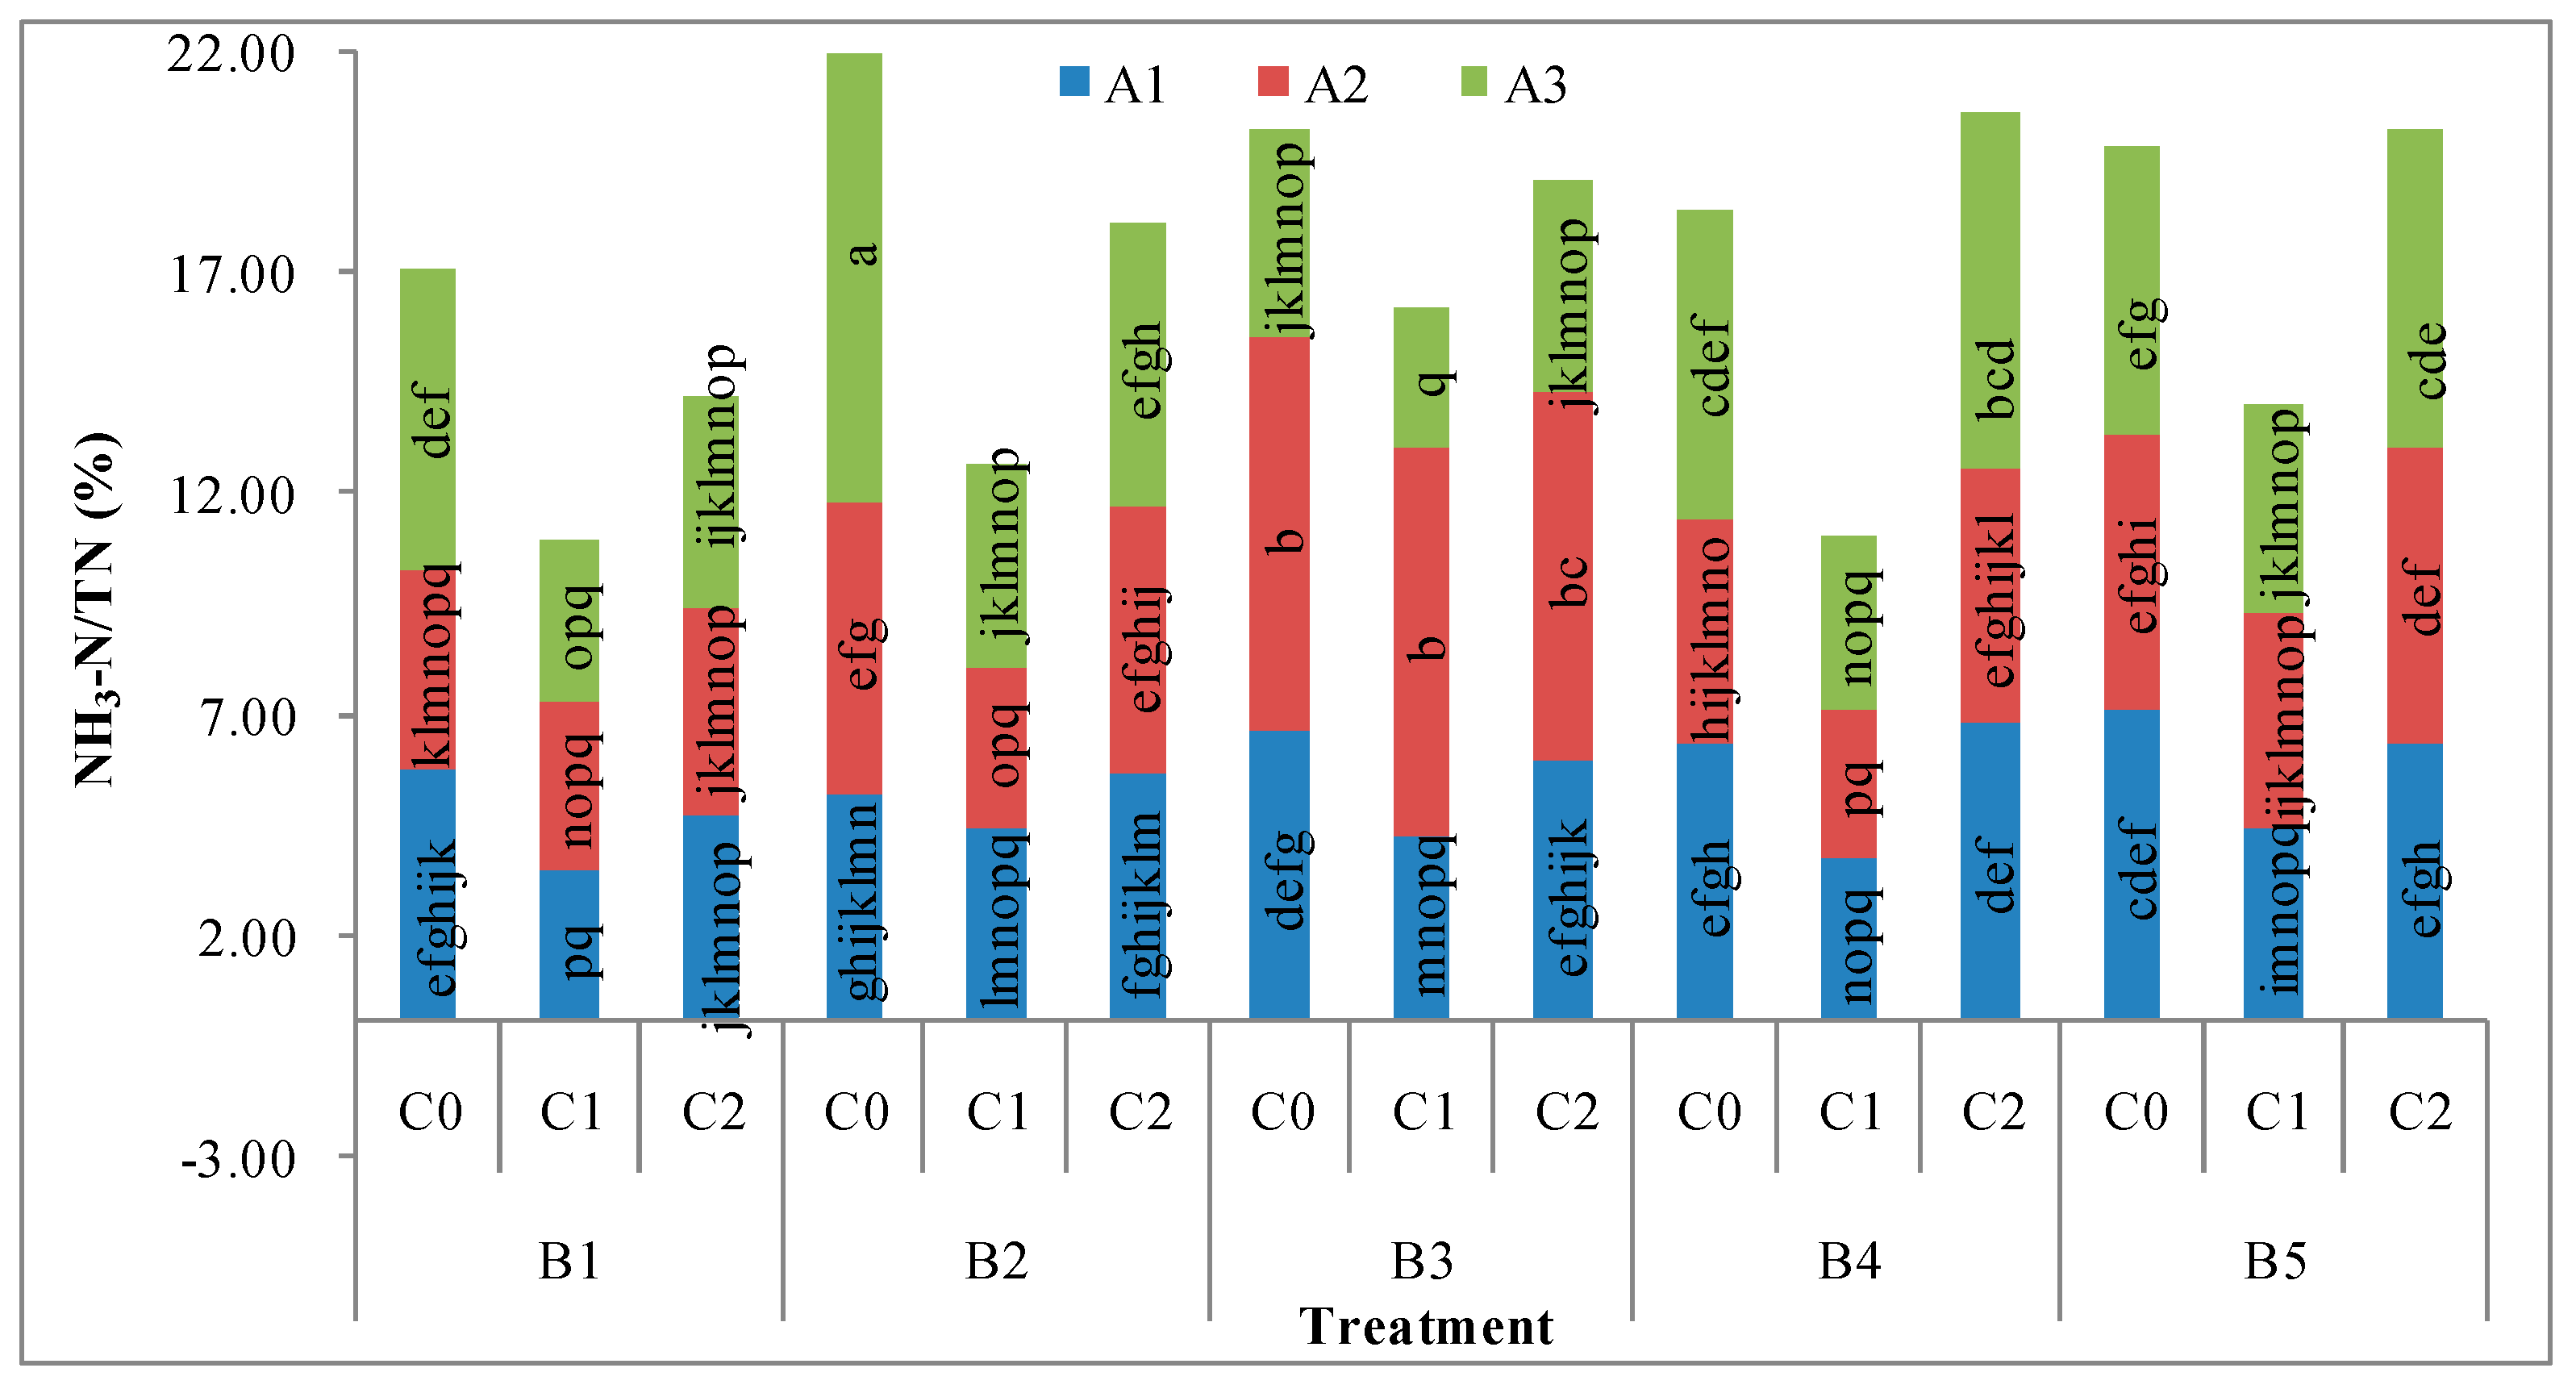
3.3.5. NH3-N/TN Content
4. Discussion
4.1. The Optimum Harvesting Time for Triticale, Rye and Oat to Produce Quality Silage in Qinghai–Tibet Alpine Area Was the Milky Stage
4.2. Lactic Acid Bacteria Additives Sila-Max Could Improve the Silage Fermentation Qualities of Triticale, Rye and Oat
4.3. Triticale Variety ‘Gannong No.2’ Is the Best Raw Material to Produce Quality Silage in Qinghai–Tibet Alpine Area
5. Conclusions
Author Contributions
Funding
Data Availability Statement
Acknowledgments
Conflicts of Interest
References
- Zhang, J.; Guo, G.; Chen, L.; Li, J.F.; Yuan, X.J.; Yu, C.Q.; Shimojo, M.; Shao, T. Effect of applying lactic acid bacteria and propionic acid on fermentation quality and aerobic stability of oats-common vetch mixed silage on the tibetan plateau. Anim. Sci. J. 2014, 86, 595–602. [Google Scholar] [CrossRef]
- Xu, T.W.; Xu, S.X.; Hu, L.Y.; Zhao, N.; Liu, Z.; Ma, L.; Liu, H.J.; Zhao, X.Q. Effect of Dietary Types on Feed Intakes, Growth Performance and Economic Benefit in Tibetan sheep and Yaks on the Qinghai-Tibet Plateau during Cold Season. PLoS ONE 2017, 12, e0169187. [Google Scholar] [CrossRef] [Green Version]
- Zhang, Z.; Zhang, J.; Zhao, X.; Xie, W.; Wang, Y. Assessing and Broadening Genetic Diversity of Elymus sibiricus Germplasm for the Improvement of Seed Shattering. Molecules 2016, 21, 869. [Google Scholar] [CrossRef] [Green Version]
- Kang, H.; Wang, H.; Huang, J.; Wang, Y.; Zhou, Y. Divergent development of hexaploid triticale by a wheat–rye–psathyrostachys huashanica trigeneric hybrid method. PLoS ONE 2016, 11, e0155667. [Google Scholar] [CrossRef] [PubMed] [Green Version]
- Li, P.; Tang, X.L.; Liao, C.S.; Li, M.Y.; Chen, L.Y.; Lu, G.R.; Huang, X.K.; Chen, C.; Gou, W.L. Effects of Additives on Silage Fermentation Characteristic and In Vitro Digestibility of Perennial Oat at Different Maturity Stages on the Qinghai Tibetan. Microorganisms 2021, 9, 2403. [Google Scholar] [CrossRef] [PubMed]
- Chen, S.W.; Chang, Y.Y.; Huang, H.Y.; Kuo, S.M.; Wang, H.T. Application of condensed molasses fermentation solubles and lactic acid bacteria in corn silage production. J. Sci. Food Agric. 2020, 100, 2722–2731. [Google Scholar] [CrossRef] [PubMed]
- Coblentz, W.K.; Akins, M.S. Silage review: Recent advances and future technologies for baled silages. J. Dairy Sci. 2018, 101, 4075–4092. [Google Scholar] [CrossRef]
- Fabiszewska, A.U.; Zielińska, K.J.; Wróbel, B. Trends in designing microbial silage quality by biotechnological methods using lactic acid bacteria inoculants: A minireview. World J. Microbiol. Biotechnol. 2019, 35, 76–84. [Google Scholar] [CrossRef] [Green Version]
- Samanta, A.K.; Misra, A.K.; Singh, A.P.; Verma, N.C. On farm trials on silage: Quality and palatability of maize stover silage. Indian J. Anim. Sci. 2014, 71, 276–277. Available online: https://www.researchgate.net/publication/287014627_On_farm_trials_on_silage_Quality_and_palatability_of_maize_stover_silage (accessed on 20 July 2022).
- Kung, L., Jr.; Shaver, R.D.; Grant, R.J.; Schmidt, R.J. Silage review: Interpretation of chemical, microbial, and organoleptic components of silages. J. Dairy Sci. 2018, 101, 4020–4033. [Google Scholar] [CrossRef]
- Scharenberg, A.; Arrigo, Y.; Gutzwiller, A.; Soliva, C.R.; Wyss, U.; Kreuzer, M.; Dohme, F. Palatability in sheep and in vitro nutritional value of dried and ensiled sainfoin (Onobrychis viciifolia) birdsfoot trefoil (Lotus corniculatus), and chicory (Cichorium intybus). Arch. Anim. Nutr. 2007, 61, 481–496. [Google Scholar] [CrossRef] [PubMed]
- Luo, R.; Zhang, Y.; Wang, F.; Liu, K.; Huang, G.; Zheng, N.; Wang, J. Effects of Sugar Cane Molasses Addition on the Fermentation Quality, Microbial Community, and Tastes of Alfalfa Silage. Animals 2021, 11, 355. [Google Scholar] [CrossRef] [PubMed]
- Chen, S.; Zhao, J.; Dong, D.; Hu, J.; Huang, G.; Sun, F.; Yu, C.; Shao, T. Effect of citric acid residue and short-chain fatty acids on fermentation quality and aerobic stability of lucerne ensiled with lactic acid bacteria inoculants. J. Appl. Microbiol. 2022, 132, 189–198. [Google Scholar] [CrossRef]
- Woolford, M.K. Microbiological screening of the straight chain fatty acids (C1-C12) as potential silage additives. J. Sci. Food Agric. 1975, 26, 219–228. [Google Scholar] [CrossRef] [PubMed]
- Zhang, Q.; Li, X.J.; Zhao, M.M.; Yu, Z. Isolating and evaluating lactic acid bacteria strains for effectiveness of Leymus chinensis silage fermentation. Lett. Appl. Microbiol. 2014, 59, 391–397. [Google Scholar] [CrossRef]
- Aufrère, J.; Graviou, D.; Demarquilly, C. Protein degradation in the rumen of red clover forage at various stages of growth and conserved as silage or wrapped big bales. Reprod. Nutr. Dev. 2002, 42, 559–572. [Google Scholar] [CrossRef] [Green Version]
- Yang, H.Y.; Wang, X.F.; Liu, J.B.; Gao, L.J.; Ishii, M.; Igarashi, Y.; Cui, Z.J. Effects of water-soluble carbohydrate content on silage fermentation of wheat straw. J. Biosci. Bioeng. 2006, 101, 232–237. [Google Scholar] [CrossRef]
- Muck, R.E.; Nadeau, E.M.G.; McAllister, T.A.; Contreras-Govea, F.E.; Santos, M.C.; Kung, L. Silage review: Recent advances and future uses of silage additives. J. Dairy Sci. 2018, 101, 3980–4000. [Google Scholar] [CrossRef]
- Pauly, T.M.; Hansson, B.I.; Tham, W.A. The effect of mechanical forage treatments on the growth of clostridium tyrobutyricum and listeria monocytogenes in grass silage. Anim. Feed Sci. Tech. 1999, 78, 127–139. [Google Scholar] [CrossRef]
- Driehuis, F.; Wilkinson, J.M.; Jiang, Y.; Ogunade, I.; Adesogan, A.T. Silage review: Animal and human health risks from silage. J. Dairy Sci. 2018, 101, 4093–4110. [Google Scholar] [CrossRef]
- Wallsten, J.; Hatfield, R. Cell wall chemical characteristics of whole-crop cereal silages harvested at three maturity stages. J. Sci. Food Agric. 2016, 96, 3604–3612. [Google Scholar] [CrossRef] [PubMed]
- Asano, K.; Ishikawa, T.; Araie, A.; Ishida, M. Improving quality of common reed (Phragmites communis Trin.) silage with additives. Asian-Australas J. Anim. Sci. 2018, 31, 1747–1755. [Google Scholar] [CrossRef] [PubMed] [Green Version]
- Rojas, G.C.; Catrileo, S.A.; Manríquez, B.M.; Calabí, F.F. An evaluation of the cutting stage on triticale (×Triticosecale Wittmack) for silage. Agric. Técnica 2004, 64, 34–40. Available online: https://www.researchgate.net/publication/27789347 (accessed on 13 May 2022).
- Jia, L.; Wang, J.K.; Wang, Y.; Li, S.; Liu, X.W.; Gao, X.L. Effects of silage duration on nutrition and fermentation quality of forage rye and triticale. J. Qingdao Agric. Univ. (Nat. Sci.) 2021, 38, 245–250. [Google Scholar] [CrossRef]
- Mustafa, A.F.; Seguin, P. Effects of stage of maturity on ensiling characteristics and ruminal nutrient degradability of oat silage. Arch. Tierernahr. 2003, 57, 347–357. [Google Scholar] [CrossRef]
- Zhao, G.Q.; Ju, Z.L.; Chai, J.K.; Jiao, T.; Jia, Z.F.; Casper, D.P.; Zeng, L.; Wu, J.P. Effects of silage additives and varieties on fermentation quality, aerobic stability and nutritive value of oat silage. J. Anim. Sci. 2018, 96, 3151–3160. [Google Scholar] [CrossRef]
- Er, M.; Keles, G. Buckwheat conservation as hay or silage: Agronomic evaluation, nutritive value, conservation quality, and intake by lactating dairy goats. Trop. Anim. Health Prod. 2021, 53, 215. [Google Scholar] [CrossRef]
- Wang, C.Z.; Wang, T. Feed Science; China Agriculture Press: Beijing, China, 2003. (In Chinese) [Google Scholar]
- Del Valle, T.A.; Zenatti, T.F.; Antonio, G.; Campana, M.; Gabdra, J.R.; Zilio, E.M.; de Mattos, L.F.; de Morais, J.G. Effect of chitosan on the preservation quality of sugarcane silage. Grass Forage Sci. 2018, 73, 630–638. [Google Scholar] [CrossRef]
- Chen, L.; Li, J.; Dong, Z.; Yuan, X.; Shao, T. Effects of applying oil-extracted microalgae on the fermentation quality, feed-nutritive value and aerobic stability of ensiled sweet sorghum. J. Sci. Food Agric. 2018, 98, 4462–4470. [Google Scholar] [CrossRef]
- Petrova, P.; Arsov, A.; Tsvetanova, F.; Parvanova-Mancheva, T.; Vasileva, E.; Tsigoriyna, L.; Petrov, K. The complex role of lactic acid bacteria in food detoxification. Nutrients 2022, 14, 2038. [Google Scholar] [CrossRef]
- Shahbazi, R.; Sharifzad, F.; Bagheri, R.; Alsadi, N.; Yasavoli-Sharahi, H.; Matar, C. Anti-Inflammatory and Immunomodulatory Properties of Fermented Plant Foods. Nutrients 2021, 13, 1516. [Google Scholar] [CrossRef]
- Santos, A.O.; Ávila, C.L.; Schwan, R.F. Selection of tropical lactic acid bacteria for enhancing the quality of maize silage. J. Dairy Sci. 2013, 96, 7777–7789. [Google Scholar] [CrossRef]
- Yusuff, O.; Rafii, M.Y.; Norhani, A.; Usman, M.; Ghazali, H.; Asfaliza, R.; Gous, M. Fermentation Quality and Additives: A Case of Rice Straw Silage. Biomed. Res. Int. 2016, 13, 1–14. [Google Scholar] [CrossRef] [Green Version]
- Guo, G.; Yuan, X.; Li, L.; Wen, A.; Shao, T. Effects of fibrolytic enzymes, molasses and lactic acid bacteria on fermentation quality of mixed silage of corn and hulless–barely straw in the Tibetan Plateau. Grassl. Sci. 2014, 60, 240–246. [Google Scholar] [CrossRef]
- Jung, J.S.; Ravindran, B.; Soundharrajan, I.; Awasthi, M.K.; Choi, K.C. Improved performance and microbial community dynamics in anaerobic fermentation of triticale silages at different stages. Bioresour. Technol. 2022, 345, 126485. [Google Scholar] [CrossRef]
- Auerbach, H.; Theobald, P.; Kroschewski, B.; Weiss, K. Effects of Various Additives on Fermentation, Aerobic Stability and Volatile Organic Compounds in Whole-Crop Rye Silage. Agronomy 2021, 10, 1873. [Google Scholar] [CrossRef]
- Jiao, T.; Lei, Z.; Wu, J.; Li, F.; Casper, D.P.; Wang, J.; Jiao, J. Effect of additives and filling methods on whole plant corn silage quality, fermentation characteristics and in situ digestibility. Anim. Biosci. 2021, 34, 1776–1783. [Google Scholar] [CrossRef]
- Hajighasemi, S.R.; Keshavarz-Afshar, R.; Chaichi, M.R. Nitrogen Fertilizer and Seeding Rate Influence on Grain and Forage Yield of Dual-Purpose Barley. Agron. J. 2016, 108, 1486–1495. [Google Scholar] [CrossRef] [Green Version]
- Thomas, T.A. An automated procedure for the determination of soluble carbohydrates in herbage. Sci. Food Agric. 1977, 28, 639–642. [Google Scholar] [CrossRef]
- Broderick, G.A.; Kang, J.H. Automated simultaneous determination of ammonia and total amino acids in ruminal fluid and in vitro media. J. Dairy Sci. 1980, 63, 64–75. [Google Scholar] [CrossRef]
- Borreani, G.; Tabacco, E.; Schmidt, R.J.; Holmes, B.J.; Muck, R.E. Silage review: Factors affecting dry matter and quality losses in silages. J. Dairy Sci. 2018, 101, 3952–3979. [Google Scholar] [CrossRef] [Green Version]
- Vissers, M.M.; Driehuis, F.; Te Giffel, M.C.; De Jong, P.; Lankveld, J.M. Concentrations of butyric acid bacteria spores in silage and relationships with aerobic deterioration. J. Dairy Sci. 2007, 90, 928–936. [Google Scholar] [CrossRef] [PubMed]
- Borreani, G.; Tabacco, E.; Cavallarin, L. A new oxygen barrier film reduces aerobic deterioration in farm-scale corn silage. J. Dairy Sci. 2007, 90, 4701–4706. [Google Scholar] [CrossRef] [Green Version]
- Muglali, O.H.; Salman, M.; Selcuk, Z.; Genc, B.; Karadas, F. The effect of a lactic acid bacteria inoculant on corn silage ensiled at the different stages of vegetation. Vet. Res. 2012, 5, 41–45. Available online: https://www.medwelljournals.com/abstract/?doi=vr.2012.41.45 (accessed on 8 August 2021).
- Seale, D.R.; Henderson, A.R.; Pettersson, K.O.; Lowe, J.F. The effect of addition of sugar and inoculation with two commercial inoculants on the fermentation of lucerne silage in laboratory silos. Grass Forage Sci. 1986, 41, 61–70. [Google Scholar] [CrossRef]
- Meeske, R.; Basson, H.M. The effect of a lactic acid bacterial inoculant on maize silage. Anim. Feed Sci. Tech. 1998, 70, 239–247. [Google Scholar] [CrossRef]
- Li, M.; Zi, X.; Zhou, H.; Lv, R.; Tang, J.; Cai, Y. Effect of lactic acid bacteria, molasses, and their combination on the fermentation quality and bacterial community of cassava foliage silage. Anim. Sci. J. 2021, 92, e13635. [Google Scholar] [CrossRef] [PubMed]
- Chen, L.; Cai, Y.; Li, P.; You, M.; Cheng, Q.; Lu, Y.; Gou, W. Inoculation of exogenous lactic acid bacteria exerted a limited influence on the silage fermentation and bacterial community compositions of reed canary grass straw on the Qinghai-Tibetan Plateau. J. Appl. Microbiol. 2020, 129, 1163–1172. [Google Scholar] [CrossRef]
- Perazzo, A.F.; Carvalho, G.G.; Santos, E.M.; Bezerra, H.F.; Silva, T.C.; Pereira, G.A.; Ramos, R.C.; Rodrigues, J.A. Agronomic evaluation of sorghum hybrids for silage production cultivated in semiarid conditions. Front. Plant Sci. 2017, 8, 1088. [Google Scholar] [CrossRef] [PubMed]
- Anjum, M.I.; Javaid, S.; Ashfaq, F.; Iqbal, J. Effects of maize silage substitution with sugarbeet or citrus pulp ensiled with corncobs on growth performance, digestibility, and economic benefits in buffalo calves. Trop. Anim. Health Prod. 2022, 54, 326. [Google Scholar] [CrossRef]
- Liu, H.C. Discriminations of Triticale and Rye, and Studies on the High-Yield Cultivation Techniques in the Alpine Pastoral Area of the Northeastern Margin of Qinghai-Tibet Plateau, China; Gansu Agricultural University: Lanzhou, China, 2018; Available online: https://kns.cnki.net/kcms/detail/detail.aspx?filename=1019908431.nh&dbcode=CDFD&dbname=CDFD2020&v=nZmkcQ-HereEOfVMIwvzG4S800CunzN3nO_iuDwkzX1CIaGnOdSoU8hBL4It3oP9 (accessed on 7 May 2020).
- Dai, H.L. Comparisons on the Productivity and Quality of Nutrition and Silage for Triticale, Rye and Oat in Gannan Plateau; Gansu Agricultural University: Lanzhou, China, 2018; Available online: https://kns.cnki.net/kcms/detail/detail.aspx?filename=1019908421.nh&dbcode=CMFD&dbname=CMFD2020&v=nZmkcQ-Herd3yp41veQrn8-OWP-bkTQwKFo24bgmnZ7YLOURCQi1MtOxS5MVfAah (accessed on 5 March 2020).
- Wang, W.Q.; Liu, J.; Tian, X.H.; Du, W.H. Evaluations on the adaptability of Triticosecale Wittmack ‘Gannong No.4′ in different regions of Qinghai province. Acta Agrestia Sin. 2020, 28, 1626–1634. [Google Scholar] [CrossRef]
- Carvalho, B.F.; Ávila, C.L.S.; Miguel, M.; Pinto, J.C.; Santos, M.C.; Schwan, R.F. Aerobic stability of sugar-cane silage inoculated with tropical strains of lactic acid bacteria. Grass Forage Sci. 2015, 70, 308–323. [Google Scholar] [CrossRef]
- Li, X.L.; Wang, L.Q. Research progress on Medicago sativa silage technology. Acta Prataculturae Sin. 2005, 14, 9–15. Available online: https://www.researchgate.net/publication/284675834_Research_progress_on_Medicago_sativa_silage_technology (accessed on 3 May 2020).
- Chen, L.; Guo, G.; Yuan, X.; Zhang, J.; Li, J.; Shao, T. Effects of applying molasses, lactic acid bacteria and propionic acid on fermentation quality, aerobic stability and in vitro gas production of total mixed ration silage prepared with oat-common vetch intercrop on the Tibetan Plateau. J. Sci. Food Agric. 2016, 96, 1678–1685. [Google Scholar] [CrossRef] [PubMed]
- Nadeau, E.M.; Buxton, D.R.; Russell, J.R.; Allison, M.J.; Young, J.W. Enzyme; bacterial inoculant; and formic acid effects on silage composition of orchardgrass and alfalfa. J. Dairy Sci. 2000, 83, 1487–1502. [Google Scholar] [CrossRef]
- Xu, J.; Bao, J.W.; Su, X.F.; Zhang, H.J.; Zeng, X.; Tang, L.; Wang, K.; Zhang, J.H.; Chen, X.S.; Mao, Z.G. Effect of propionic acid on citric acid fermentation in an integrated citric acid-methane fermentation process. Bioprocess Biosyst. Eng. 2016, 39, 391–400. [Google Scholar] [CrossRef] [PubMed]
- Jia, T.; Yun, Y.; Yu, Z. Propionic Acid and Sodium Benzoate Affected Biogenic Amine Formation, Microbial Community, and Quality of Oat Silage. Front. Microbiol. 2021, 8, 750920. [Google Scholar] [CrossRef]


| Variable | DM | DMY | Fermentation Quality | |||||
|---|---|---|---|---|---|---|---|---|
| pH | WSC | LA | AA | PA | NH3-N/TN | |||
| Within the forage species | 0.98 | 3.25 * | 82.91 ** | 1061.06 ** | 136.83 ** | 154.20 ** | 1298.98 ** | 5.35 * |
| Within the cutting stages | 177.23 ** | 17.93 ** | 37.95 ** | 1176.29 ** | 192.12 ** | 277.83 ** | 134.44 ** | 17.04 ** |
| Within the lactic acid bacteria additives | - | - | 385.78 ** | 111.79 ** | 267.30 ** | 389.73 ** | 11.60 ** | 115.1 ** |
| Forage species × Cutting stages | 77.45 ** | 33.68 ** | 45.90 ** | 94.94 ** | 67.28 ** | 80.43 ** | 132.21 ** | 29.73 ** |
| Forage species × Lactic acid bacteria additives | - | - | 11.89 ** | 33.09 ** | 13.20 ** | 20.08 ** | 16.48 ** | 6.75 ** |
| Cutting stages × Lactic acid bacteria additives | - | - | 11.39 ** | 9.74 ** | 11.14 ** | 7.29 ** | 7.70 ** | 6.29 ** |
| Forage species × Cutting stages × Lactic acid bacteria additives | - | - | 5.68 ** | 15.9 ** | 3.67 ** | 11.98 ** | 8.85 ** | 4.37 ** |
| Single Factor | Treatment | DM (%) | DMY(t·hm−2) | pH Value | WSC(%) | LA(%) | AA(%) | PA(%) | NH3-N/TN(%) |
|---|---|---|---|---|---|---|---|---|---|
| Forage species | A1 | 29.10 ± 4.55 a | 11.97 ± 0.99 a | 4.13 ± 0.04 b | 7.89 ± 0.58 a | 1.97 ± 0.08 a | 0.41 ± 0.03 b | 0.20 ± 0.02 a | 5.39 ± 0.19 b |
| A2 | 29.35 ± 4.76 a | 10.48 ± 0.44 ab | 4.35 ± 0.04 a | 4.60 ± 0.68 b | 1.84 ± 0.09 b | 0.44 ± 0.02 a | 0.00 ± 0.00 b | 5.82 ± 0.27 a | |
| A3 | 28.01 ± 4.29 a | 9.52 ± 0.48 b | 4.34 ± 0.06 a | 2.79 ± 0.31 c | 1.50 ± 0.08 c | 0.32 ± 0.02 c | 0.00 ± 0.00 b | 5.86 ± 0.34 a | |
| Cutting stage | B1 | 19.51 ± 0.20 e | 7.31 ± 0.34 d | 4.17 ± 0.04 d | 3.52 ± 0.51 c | 2.14 ± 0.08 a | 0.53 ± 0.03 a | 0.09 ± 0.03 b | 4.70 ± 0.23 c |
| B2 | 22.06 ± 0.97 d | 9.48 ± 0.23 c | 4.30 ± 0.07 b | 2.38 ± 0.38 d | 1.92 ± 0.11 b | 0.47 ± 0.03 b | 0.09 ± 0.03 b | 6.02 ± 0.43 a | |
| B3 | 26.61 ± 0.58 c | 10.59 ± 0.30 bc | 4.25 ± 0.06 c | 3.39 ± 0.60 c | 1.89 ± 0.10 b | 0.34 ± 0.01 c | 0.12 ± 0.03 a | 6.16 ± 0.41 a | |
| B4 | 30.78 ± 0.78 b | 12.13 ± 0.59 ab | 4.21 ± 0.06 cd | 11.14 ± 0.71 a | 1.74 ± 0.09 c | 0.35 ± 0.02 c | 0.04 ± 0.01 c | 5.56 ± 0.34 b | |
| B5 | 45.40 ± 0.97 a | 13.76 ± 1.04 a | 4.44 ± 0.07 a | 5.03 ± 0.45 b | 1.15 ± 0.09 d | 0.28 ± 0.02 d | 0.01 ± 0.00 d | 6.01 ± 0.24 a | |
| Lactic acid bacteria additive | C0 | - | - | 4.38 ± 0.04 b | 4.77 ± 0.60 b | 1.56 ± 0.08 b | 0.45 ± 0.02 a | 0.06 ± 0.02 b | 6.60 ± 0.28 a |
| C1 | - | - | 3.97 ± 0.03 c | 6.04 ± 0.66 a | 2.16 ± 0.07 a | 0.28 ± 0.02 b | 0.06 ± 0.02 b | 4.32 ± 0.21 b | |
| C2 | - | - | 4.47 ± 0.04 a | 4.46 ± 0.40 c | 1.59 ± 0.08 b | 0.44 ± 0.02 a | 0.08 ± 0.02 a | 6.15 ± 0.19 a |
| Cutting Stage | Test Materials | DM(%) | pH Value | LA | AA | PA | NH3-N/TN |
|---|---|---|---|---|---|---|---|
| (%) | (%) | (%) | (%) | ||||
| B1 | A1 | 19.77 ± 0.87 fg | 4.11 ± 0.08 def | 2.03 ± 0.16 bc | 0.68 ± 0.07 a | 0.27 ± 0.02 b | 4.64 ± 0.38 def |
| A2 | 19.12 ± 0.45 g | 4.14 ± 0.06 cdef | 2.49 ± 0.06 a | 0.50 ± 0.02 bc | 0.00 ± 0.00 d | 4.37 ± 0.20 ef | |
| A3 | 19.63 ± 1.18 fg | 4.25 ± 0.07 cdef | 1.91 ± 0.10 c | 0.39 ± 0.02 d | 0.01 ± 0.00 d | 5.08 ± 0.53 cdef | |
| B2 | A1 | 22.57 ± 1.08 ef | 3.98 ± 0.05 f | 2.15 ± 0.15 abc | 0.41 ± 0.03 cd | 0.27 ± 0.03 b | 5.08 ± 0.19 cdef |
| A2 | 23.44 ± 0.71 e | 4.39 ± 0.08 abcd | 2.33 ± 0.09 ab | 0.60 ± 0.02 ab | 0.00 ± 0.00 d | 5.41 ± 0.46 cdef | |
| A3 | 20.18 ± 1.54 fg | 4.54 ± 0.15 ab | 1.29 ± 0.09 d | 0.39 ± 0.05 d | 0.00 ± 0.00 d | 7.57 ± 1.05 ab | |
| B3 | A1 | 27.20 ± 0.05 cd | 4.09 ± 0.08 ef | 2.41 ± 0.08 a | 0.32 ± 0.02 def | 0.35 ± 0.03 a | 5.61 ± 0.47 cdef |
| A2 | 25.46 ± 1.02 de | 4.64 ± 0.06 a | 1.26 ± 0.05 d | 0.38 ± 0.03 de | 0.00 ± 0.00 d | 8.68 ± 0.23 a | |
| A3 | 27.17 ± 0.40 cd | 4.01 ± 0.04 f | 2.00 ± 0.06 bc | 0.32 ± 0.02 def | 0.00 ± 0.00 d | 4.20 ± 0.28 f | |
| B4 | A1 | 30.16 ± 0.56 bc | 4.05 ± 0.07 ef | 1.87 ± 0.13 c | 0.27 ± 0.02 f | 0.09 ± 0.01 c | 5.65 ± 0.50 cdef |
| A2 | 32.34 ± 1.72 b | 4.24 ± 0.08 cdef | 1.89 ± 0.08 c | 0.42 ± 0.03 cd | 0.01 ± 0.00 d | 4.72 ± 0.42 cdef | |
| A3 | 29.85 ± 0.68 bc | 4.33 ± 0.13 bcde | 1.46 ± 0.21 d | 0.35 ± 0.04 def | 0.01 ± 0.00 d | 6.33 ± 0.75 bc | |
| B5 | A1 | 45.82 ± 0.9 ab | 4.42 ± 0.12 abc | 1.40 ± 0.20 d | 0.39 ± 0.04 d | 0.01 ± 0.01 d | 5.97 ± 0.40 cde |
| A2 | 47.16 ± 0.52 a | 4.34 ± 0.08 bcde | 1.21 ± 0.09 d | 0.28 ± 0.02 ef | 0.00 ± 0.00 d | 5.92 ± 0.32 cde | |
| A3 | 43.23 ± 0.58 c | 4.57 ± 0.14 ab | 0.84 ± 0.13 e | 0.17 ± 0.02 g | 0.00 ± 0.00 d | 6.14 ± 0.54 bcd |
| Lactic Acid Bacteria Additives | Forage Species | pH Value | LA(%) | AA(%) | PA(%) | NH3-N/TN(%) |
|---|---|---|---|---|---|---|
| A1 | 4.24 ± 0.06 cd | 1.68 ± 0.13 b | 0.46 ± 0.05 a | 0.18 ± 0.03 b | 6.22 ± 0.26 ab | |
| C0 | A2 | 4.37 ± 0.04 bc | 1.71 ± 0.14 b | 0.47 ± 0.04 a | 0.00 ± 0.00 c | 6.24 ± 0.41 ab |
| A3 | 4.53 ± 0.10 ab | 1.28 ± 0.13 c | 0.42 ± 0.03 ab | 0.00 ± 0.00 c | 7.34 ± 0.66 a | |
| A1 | 3.83 ± 0.02 f | 2.51 ± 0.06 a | 0.28 ± 0.02 cd | 0.17 ± 0.03 b | 4.06 ± 0.12 d | |
| C1 | A2 | 4.12 ± 0.06 de | 2.07 ± 0.15 b | 0.35 ± 0.03 bc | 0.01 ± 0.00 c | 4.90 ± 0.55 cd |
| A3 | 3.97 ± 0.02 ef | 1.91 ± 0.10 b | 0.22 ± 0.02 d | 0.01 ± 0.00 c | 4.00 ± 0.24 d | |
| A1 | 4.33 ± 0.06 c | 1.73 ± 0.11 b | 0.50 ± 0.05 a | 0.24 ± 0.05 a | 5.89 ± 0.22 bc | |
| C2 | A2 | 4.55 ± 0.05 a | 1.73 ± 0.15 b | 0.49 ± 0.03 a | 0.00 ± 0.00 c | 6.32 ± 0.37 ab |
| A3 | 4.52 ± 0.08 ab | 1.30 ± 0.15 c | 0.34 ± 0.03 bc | 0.00 ± 0.00 c | 6.24 ± 0.40 ab |
| Cutting Stage | Lactic Acid Bacteria Additives | pH Value | LA (%) | AA (%) | PA (%) | NH3-N/TN(%) |
|---|---|---|---|---|---|---|
| B1 | C0 | 4.25 ± 0.04 cd | 1.87 ± 0.11 bcde | 0.59 ± 0.05 a | 0.09 ± 0.04 ab | 5.70 ± 0.44 bcd |
| C1 | 3.91 ± 0.03 f | 2.52 ± 0.08 a | 0.38 ± 0.02 c | 0.07 ± 0.03 ab | 3.65 ± 0.09 f | |
| C2 | 4.34 ± 0.02 bc | 2.03 ± 0.12 bcd | 0.61 ± 0.06 a | 0.11 ± 0.06 ab | 4.74 ± 0.18 def | |
| B2 | C0 | 4.52 ± 0.15 ab | 1.64 ± 0.19 de | 0.55 ± 0.04 a | 0.08 ± 0.04 ab | 7.79 ± 0.98 a |
| C1 | 3.98 ± 0.05 f | 2.30 ± 0.18 ab | 0.34 ± 0.05 cde | 0.08 ± 0.03 ab | 4.23 ± 0.18 ef | |
| C2 | 4.41 ± 0.08 bc | 1.83 ± 0.15 cde | 0.50 ± 0.04 ab | 0.12 ± 0.06 ab | 6.04 ± 0.14 bc | |
| B3 | C0 | 4.23 ± 0.08 cde | 1.91 ± 0.17 bcde | 0.37 ± 0.01 cd | 0.10 ± 0.05 ab | 6.75 ± 0.65 ab |
| C1 | 4.08 ± 0.12 def | 2.04 ± 0.20 bcd | 0.26 ± 0.01 def | 0.11 ± 0.05 ab | 5.40 ± 0.88 bcd | |
| C2 | 4.42 ± 0.11 bc | 1.73 ± 0.15 de | 0.40 ± 0.02 c | 0.15 ± 0.07 a | 6.35 ± 0.57 ab | |
| B4 | C0 | 4.33 ± 0.08 bc | 1.49 ± 0.10 e | 0.41 ± 0.03 bc | 0.03 ± 0.01 ab | 6.16 ± 0.49 bc |
| C1 | 3.87 ± 0.02 f | 2.26 ± 0.05 abc | 0.25 ± 0.02 ef | 0.05 ± 0.02 ab | 3.68 ± 0.12 f | |
| C2 | 4.43 ± 0.06 bc | 1.47 ± 0.15 e | 0.38 ± 0.03 c | 0.02 ± 0.01 ab | 6.86 ± 0.44 ab | |
| B5 | C0 | 4.57 ± 0.05 ab | 0.88 ± 0.07 f | 0.33 ± 0.04 cde | 0.01 ± 0.01 ab | 6.62 ± 0.18 ab |
| C1 | 4.02 ± 0.02 ef | 1.70 ± 0.13 de | 0.19 ± 0.03 f | 0.00 ± 0.00 b | 4.66 ± 0.31 def | |
| C2 | 4.74 ± 0.07 a | 0.87 ± 0.10 f | 0.31 ± 0.04 cde | 0.00 ± 0.00 b | 6.75 ± 0.29 ab |
Publisher’s Note: MDPI stays neutral with regard to jurisdictional claims in published maps and institutional affiliations. |
© 2022 by the authors. Licensee MDPI, Basel, Switzerland. This article is an open access article distributed under the terms and conditions of the Creative Commons Attribution (CC BY) license (https://creativecommons.org/licenses/by/4.0/).
Share and Cite
Ma, J.; Dai, H.; Liu, H.; Du, W. Effects of Cutting Stages and Additives on the Fermentation Quality of Triticale, Rye and Oat Silage in Qinghai-Tibet Plateau. Agronomy 2022, 12, 3113. https://doi.org/10.3390/agronomy12123113
Ma J, Dai H, Liu H, Du W. Effects of Cutting Stages and Additives on the Fermentation Quality of Triticale, Rye and Oat Silage in Qinghai-Tibet Plateau. Agronomy. 2022; 12(12):3113. https://doi.org/10.3390/agronomy12123113
Chicago/Turabian StyleMa, Jun, Hanling Dai, Hancheng Liu, and Wenhua Du. 2022. "Effects of Cutting Stages and Additives on the Fermentation Quality of Triticale, Rye and Oat Silage in Qinghai-Tibet Plateau" Agronomy 12, no. 12: 3113. https://doi.org/10.3390/agronomy12123113