Article

Water Quality, Source Identification, and Risk Assessment of Heavy Metals Using Multivariate Analysis in the Han River Watershed, South Korea

Han River Environment Research Center, National Institute of Environmental Research, 42, Dumulmeori-Gil 68beon-Gil, Yangseo-Myeon, Yangpyeong-gun, Incheon 12585, Gyeonggi-do, Republic of Korea
*
Author to whom correspondence should be addressed.
Agronomy 2022, 12(12), 3111; https://doi.org/10.3390/agronomy12123111
Submission received: 23 October 2022 / Revised: 29 November 2022 / Accepted: 5 December 2022 / Published: 8 December 2022

Abstract

:
This study aimed to investigate the irrigation water quality, major pollution sources, and human health hazards by focusing on heavy metal concentrations in the surface water of the Han River watershed, South Korea that supplies water for consumption and irrigation. Here, Mn was found to have the highest mean concentration, with the maximum concentration recorded at IH-2. The heavy metal concentrations were higher during summer and fall than that during spring. The mean concentration of heavy metals was relatively high in the downtown area (1.8 times) and downstream of the wastewater treatment facilities (1.3 times), indicating that the wastewater treatment facilities (WTFs) may be the primary source of pollution. Water at most of the sites were found to be suitable for irrigation. However, the sodium absorption ratio and soluble sodium percentage indicated that IH-2 was unsuitable. The results of the principal component analysis indicated that anthropogenic (vehicle and industrial) activities were the primary sources of metal pollution. Ingestion was identified as the primary exposure pathway in terms of health risks. However, the hazard quotients and hazard index for all pathways were below the safety limit (<1) for children and adults.

1. Introduction

Surface water is extremely susceptible to pollution due to wastewater disposal activities in river basins which often have high population densities due to favorable living conditions [1,2]. The quality of surface water in a region is determined by natural processes (e.g., precipitation, erosion, and weathering) as well as anthropogenic impacts (e.g., urban, industrial, and agricultural activities and increased use of water resources) [3,4]. The identification and quantification of these sources are vital in the management of land and water resources within a river basin [5]. Seasonal changes in agricultural activity, stormwater runoff, interflow, and atmospheric deposition have a substantial impact on river water quality [6,7,8]. Therefore, determining seasonal variability in surface water quality is critical for assessing temporal variations in pollution from natural or anthropogenic causes.
Heavy metals enter surface water bodies from various sources, including surface river runoff, wastewater discharge, sediment release, and atmospheric deposition [9,10,11]. Anthropogenic sources, such as the discharge of urban and industrial wastewater, combustion of fossil fuels, mining activities, smelting operations, and excessive use of fertilizers, have a significant impact on heavy metal concentrations in surface water bodies [12,13,14,15]. Heavy metals can therefore be employed as sensitive markers to indicate changes in aquatic systems caused by anthropogenic contamination.
The negative effects of heavy metals are not restricted to aquatic organisms but can lead to various ailments in humans as well [16]. Heavy metals can concentrate and magnify elements in the food chain, such as in water, sediments, zooplankton, and fish, which is one of the major pathways for human exposure to heavy metals [17].
A comprehensive risk assessment of heavy metals is required to establish benchmark chemical concentrations that have zero or minimal risks to the environment and human health. Several countries and international organizations have now set recommendations and standards to maintain and improve the quality of riverine ecosystems [18,19,20,21].
This study examined the Han River watershed, the principal water source in South Korea. Surface water in a watershed is essential for human activity and serves various purposes, thereby making its management and monitoring vital. It is, therefore, crucial to investigate the sources of contaminants, assess the risks to human health, and analyze the quality of potable and agricultural water at the national level. The goals of this study, therefore, were to (1) evaluate the spatiotemporal variations of As, Cd, Cu, Mn, Ni, Pb, and Zn; (2) determine the irrigation water quality of the river using the sodium adsorption ratio (SAR), residual sodium carbonate (RSC), soluble sodium percentage (SSP), and magnesium adsorption ratio (MAR) indexes; (3) identify the principal sources of heavy metals in the study area using multivariate statistical analysis; and (4) estimate the impact of heavy metals on human health in the Han River watershed. The findings of this study could aid in the management of water resources and the protection of human health in the Han River watershed.

2. Materials and Methods
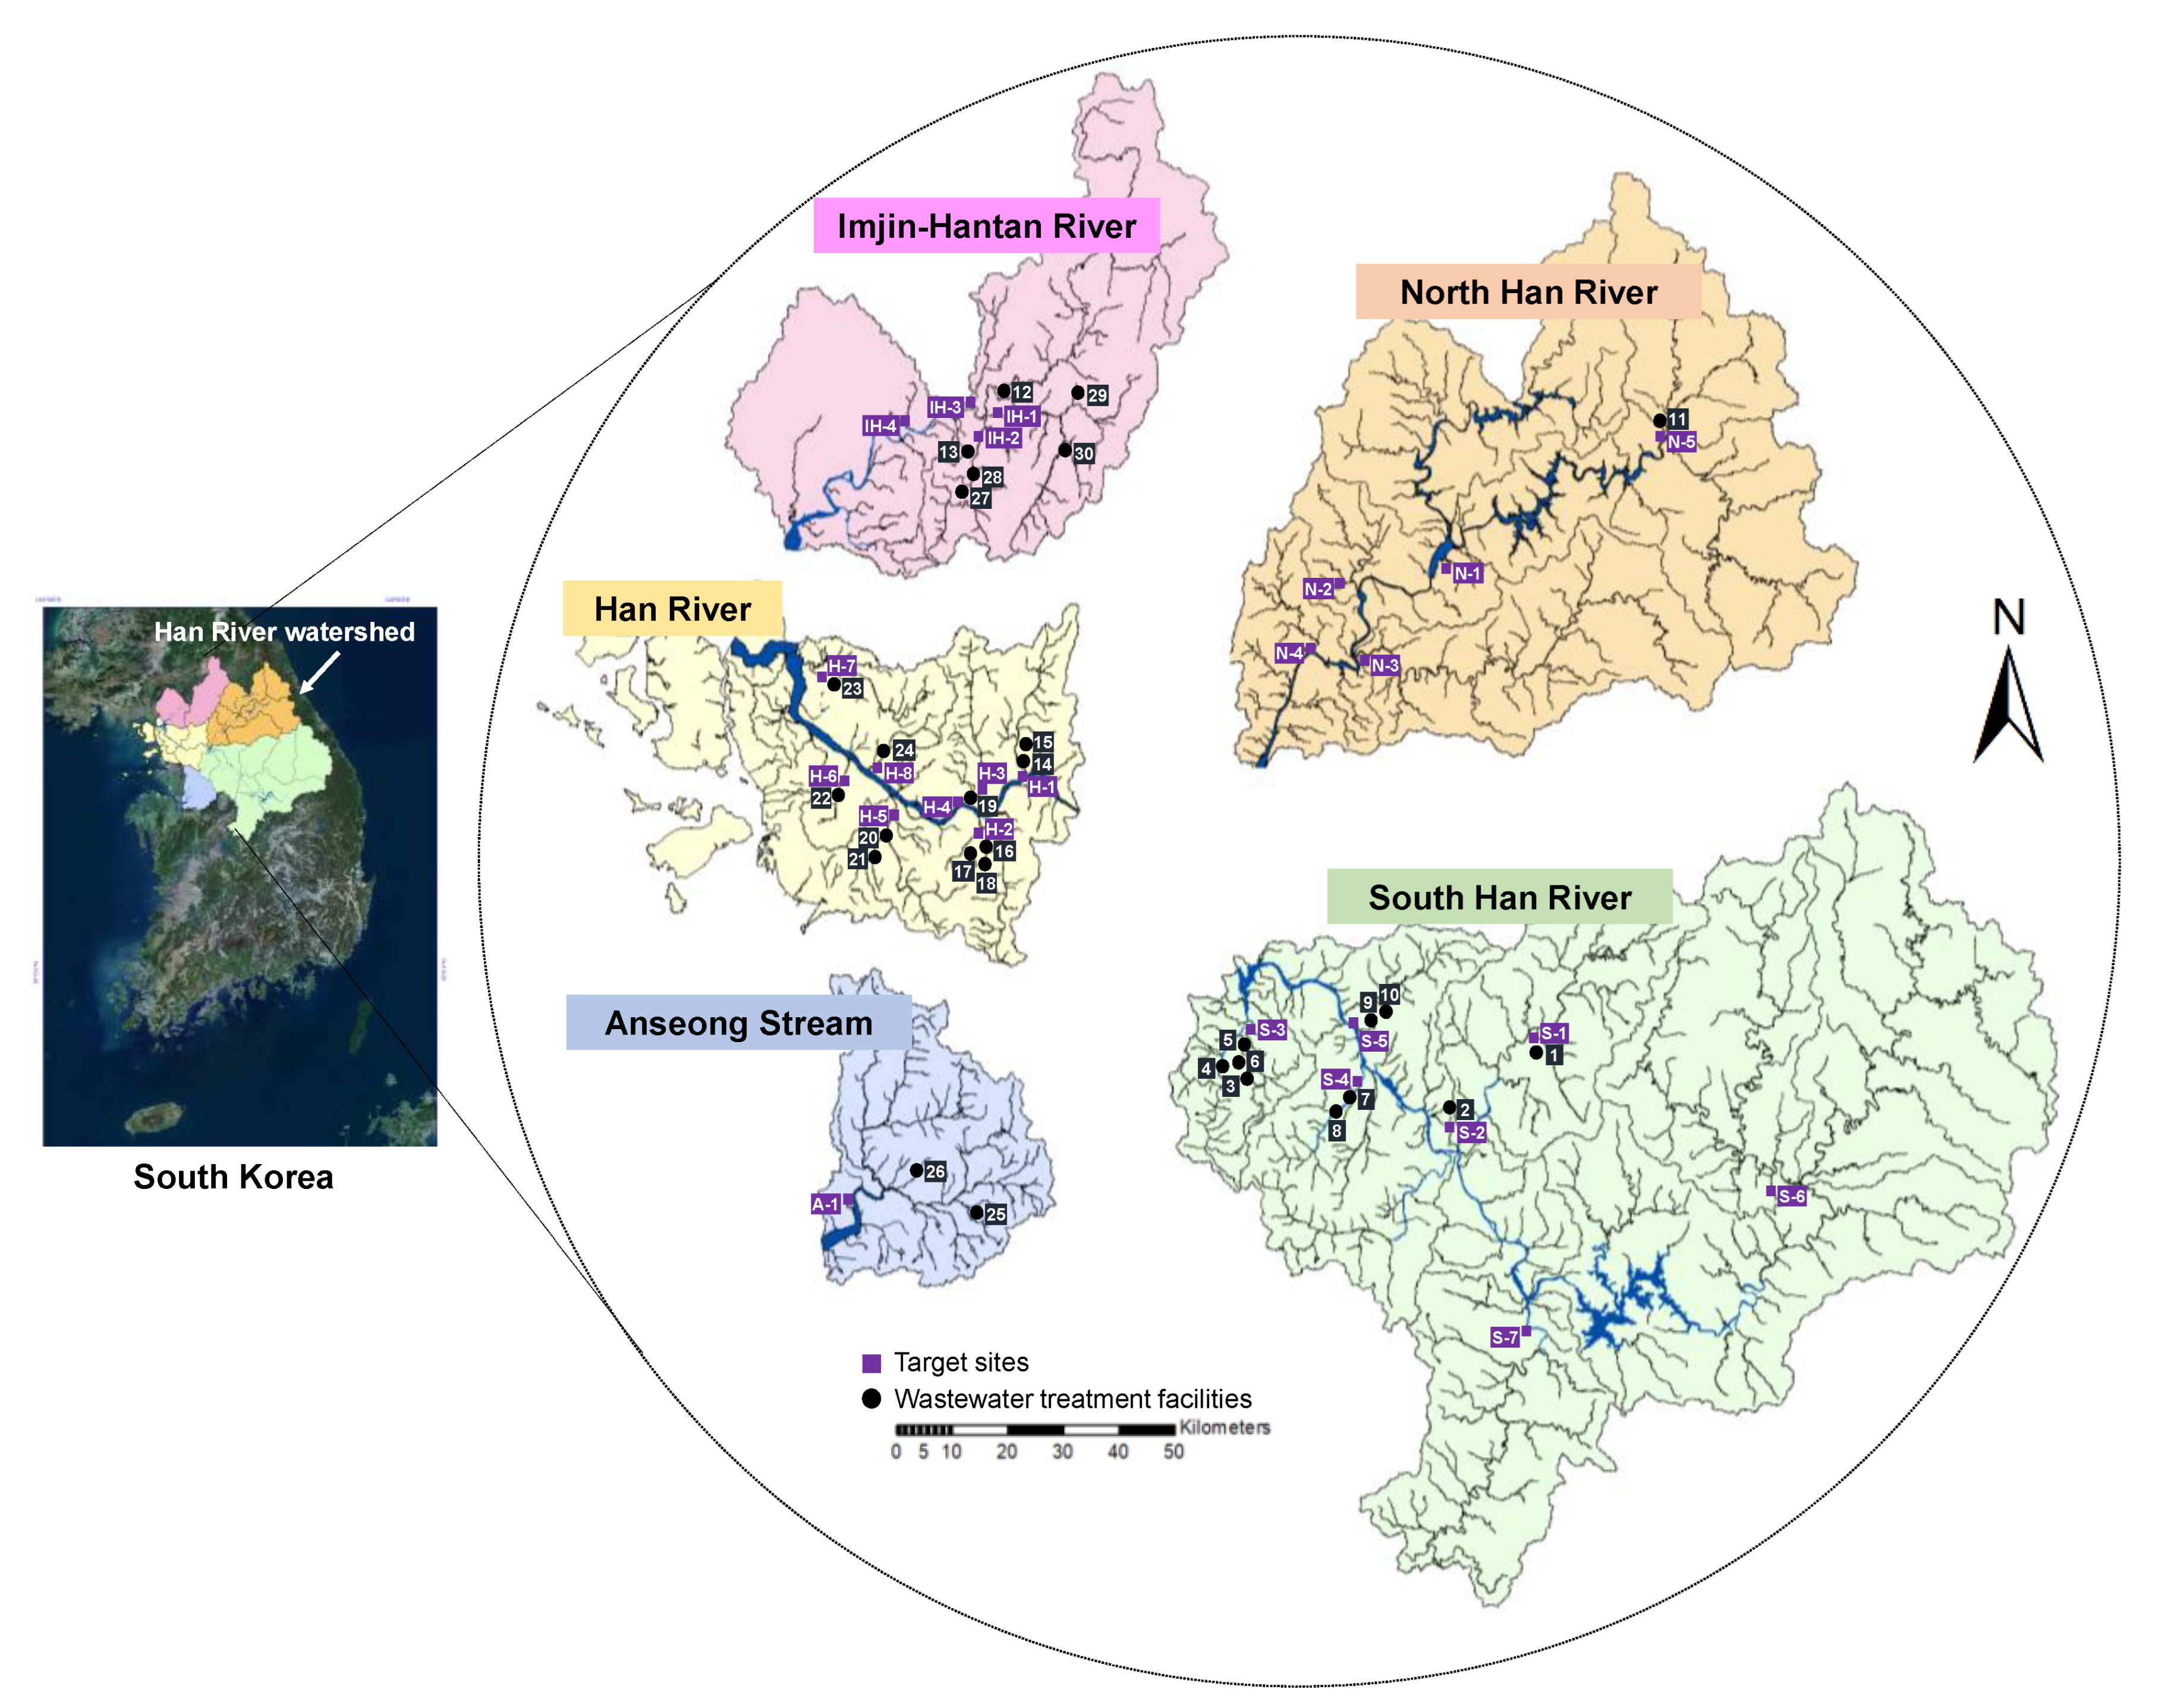
2.1. Study Area

South Korea is characterized by both continental and maritime climates. Monsoons typically occur in the summer, although water shortages are prevalent in other seasons. Owing to the relatively high coefficient of the river regime, several reservoirs have been constructed to store water for continuous agricultural use. South Korea is divided into four watersheds—the Han, Nakdong, Geum, Yeongsan, and Seomjin River watersheds. The Han River watershed has the largest surface area, whereas the Nakdong River watershed has the greatest length. The Han River flows from Gangwon-do, Chungcheongbuk-do, Gyeonggi-do, and Seoul into the West Sea. It also serves as a water source for industrial purposes, and its water is purified for human consumption. The Han River watershed spans 26,219 km2, and the Han River is 7256 km long. South Korea has 15 rivers, 12 local streams, and 678 local second-grade rivers [22]. The annual precipitation is approximately 798.1 mm, with 52% falling between June and September [23]. Five areas were categorized in the study area based on geographical characteristics such as total paddy field which as 1380 km2: 713 km2 (51.7%) for the South Han River (S), 222 km2 (16.1%) for the north Han River (N), 327 km2 (23.7%) for Imjin-Hantan River (IH), 118 km2 (8.6%) for Han River (H) [24],—and the Anseong Stream (A). Figure 1 shows location of Han River watershed in the South Korea showing the sampling sites and wastewater treatment facilities (WTFs).

2.2. Water Quality Analyses of Irrigation Water

The SAR, RSC, SSP, and MAR are frequently used to assess the quality of river irrigation water [25]. High water salinity not only poses a salinity hazard but is also hazardous to plants. Irrigation water quality is, therefore, crucial considering its impact on soil, plants, and human health. The SAR is typically regarded as an important index for evaluating irrigation water quality. High sodium content in irrigation water poses a risk of alkaline conditions and reduces soil permeability [26]. Negative RSC values indicate incomplete precipitation of Ca2+ and Mg2+ precipitation. The irrigation water quality of the Han River watershed was evaluated using the parameters SAR, RSC, SSP, and MAR, which were calculated using Equations (1)–(4) [27], respectively.
SAR = [ Na meq + ] [ Ca meq 2 + ] + [ Mg meq 2 + ] 2
RSC = ( Alkalinity   × 0.0333 ) ( Ca meq 2 + + Mg meq 2 + )
SSP = ( Na meq + + K meq + ) × 100 Na meq + + Ca meq 2 + + Mg meq 2 + + K meq +
MAR = ( Mg meq 2 + Ca meq 2 + + Mg meq 2 + ) × 100

2.3. Sampling and Analytical Method

Prior to collection, the low-density polyethylene sample bottles were prepared by soaking in 10% HNO3 overnight and rinsing with distilled water. Surface water samples were collected three times in 2015, April 20–23 (spring), August 3–6 (summer), and October 19–22 (fall). The water samples (0.5 L) was collected from the center of the river channel, using prepared sample bottles, at each of the 25 sampling sites in the Han River watershed. Seasonal water temperature, pH and dissolved organic matter (DOM) of field water samples were measured and noted (Figure S1). Subsequently, the samples were filtered through a 0.45 μm membrane filters, and HNO3 (2 mL) was added to each before storing the samples at 4 °C until analysis. Under optimal analytical conditions, inductively coupled plasma-mass spectrometry (7900 series, Agilent Technologies, Santa Clara, CA, USA) was utilized to determine the concentrations of Cd, Cu, Zn, Mn, Pb, Ni, and Ag in the surface water samples (Table S1). Heavy metal standards (Part# 5183-4688) were provided by Agilent Technologies (Santa Clara, CA, USA). Before collecting the sampled water, laboratory-made vials were routinely cleaned with fresh surface water. The quality assurance and quality control were evaluated for each batch of samples using duplicates, reagent blanks, and certified reference materials. The matrix interference (blank) was less than 2% for all the heavy metals. Analyses for each sample, in triplicate, revealed relative percentage differences of less than C5%. Each calibration curve was verified by comparing the quality control standards before, during, and after the analysis of multiple samples. The recovery and precision rates of the targeted heavy metals were 87.8–110.0% and 0.876–5.150%, respectively (Table S2). The method detection limit (MDL) values of the targeted heavy metals were as follows: Ag (0.002 μg L−1), Cd (0.002 μg L−1), Cu (0.025 μg L−1), Mn (0.025 μg L−1), Ni (0.010 μg L−1), Pb (0.009 μg L−1), and Zn (0.051 μg L−1). The sample was reanalyzed using a new calibration curve when recovery fell outside the recommended range (90–110%). All chemical compounds were of analytical quality (>95% purity), utilized without further purification, and acquired from Sigma-Aldrich, barring the heavy metals.

2.4. Human Health Risk Assessment Model

There are multiple routes of exposure to heavy metals in humans, including ingestion, dermal absorption, and inhalation. Dermal absorption and ingestion are the most common pathways of exposure via drinking water [28,29]. The US EPA states that the amount of pollutants absorbed by the body is determined by chronic daily intake (CDI), where CDI refers to the number of pollutants that are directly absorbed per kilogram of body weight per day via ingestion, dermal absorption, or inhalation [30]. The CDI values of water and skin absorption were defined using Equations (5) and (6).
CDI in = c i × IR × ABS g × EF × ED BW × AT
CDI d = c i × SA × K p × ET × EF × ED × 10 3 BW × AT
where CDIin and CIDd indicate the water ingestion and dermal absorption exposure (μg kg−1 day−1), respectively, and ci is the mean concentration of the i-th heavy metal in water (μg L−1). Table 1 presents the specifics, values, and units of the various parameters. The parameter reference values were acquired from the guidelines of the World Health Organization (WHO) and the US EPA manual [30,31].
Hazard quotients (HQs) were calculated using Equation (7) by comparing exposure or the average intake of pollutants from each exposure pathway (i.e., ingestion and dermal absorption in this study) with the associated reference dose (RfD).
HQ = CDI RfD
As presented in Table S3, the US EPA manual provided the RfD (μg kg−1 day−1) values of ingestion (RfDin) and dermal absorption (RfDd) for each heavy metal, dermal permeability coefficient (Kp), and gastrointestinal absorption factor (ABSg). In general, an exposure dose below the threshold indicates no health hazards. If the pollution level exceeded 1, as indicated by the sum of the HQs from all potential exposure pathways, there could be concerns regarding human health. As per the recommendations of the European Center for Ecotoxicology of Chemicals, a value of 1 was selected as the threshold of concern [32].

2.5. Statistical Data Analyses

Multivariate analyses of the heavy metal concentration datasets were performed with SPSS version 22.0 (IBM Corp., Armonk, NY, USA) for Windows, using one-way analysis of variance (ANOVA), two-sample paired t-test, correlation analysis, and principal component analysis (PCA) techniques. The normality and homogeneity of the data were examined using the Kolmogorov–Smirnov and Levene tests. To prevent multivariate problems, all analytical data were normalized using a log transformation and data normalization method (Z-score) before their integration for statistical analysis [33]. Sigmaplot 12.0 (Systat Inc., Point Richmond, CA, USA) was used to plot the graphs, while ArcGIS 9.2 (ESRI, Redlands, CA, USA) was utilized to produce a digital map of the Han River watershed.

3. Results and Discussion

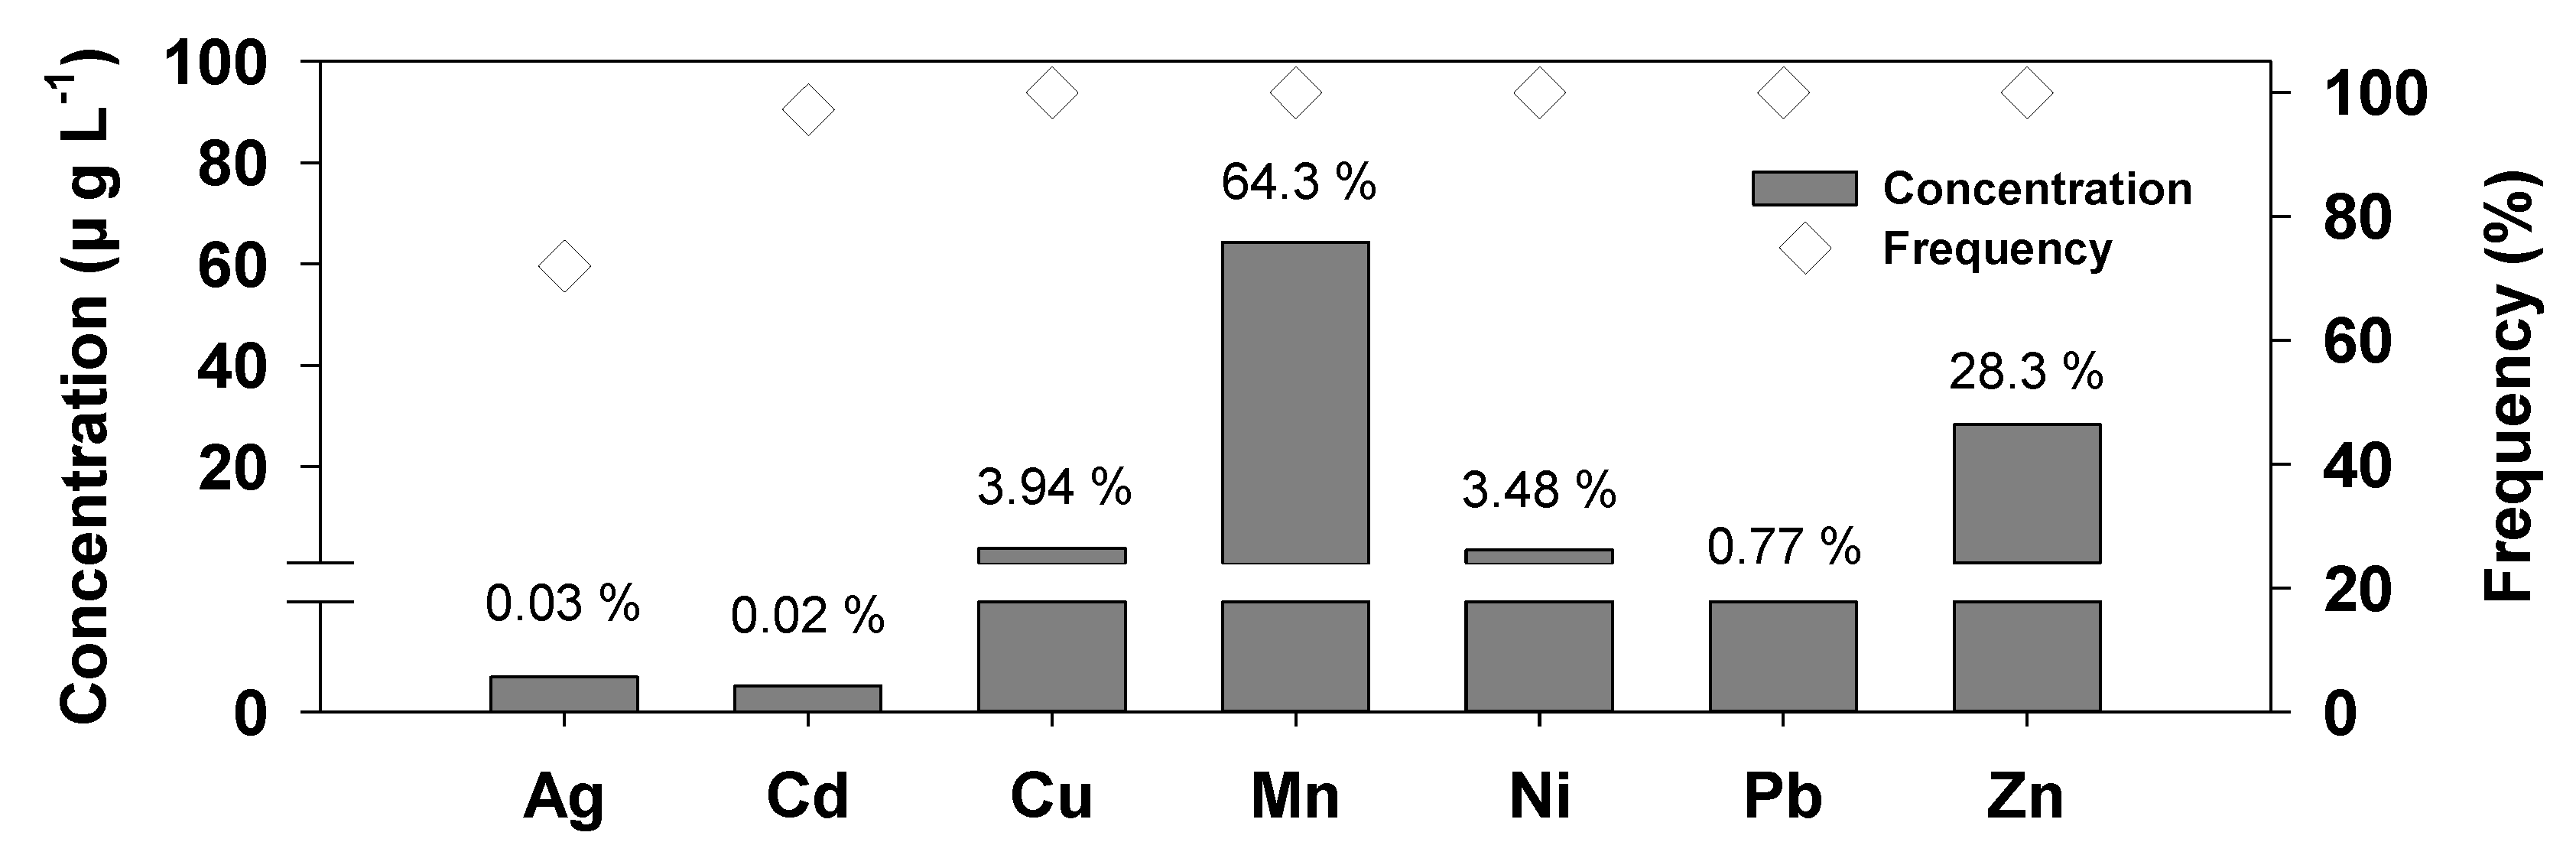
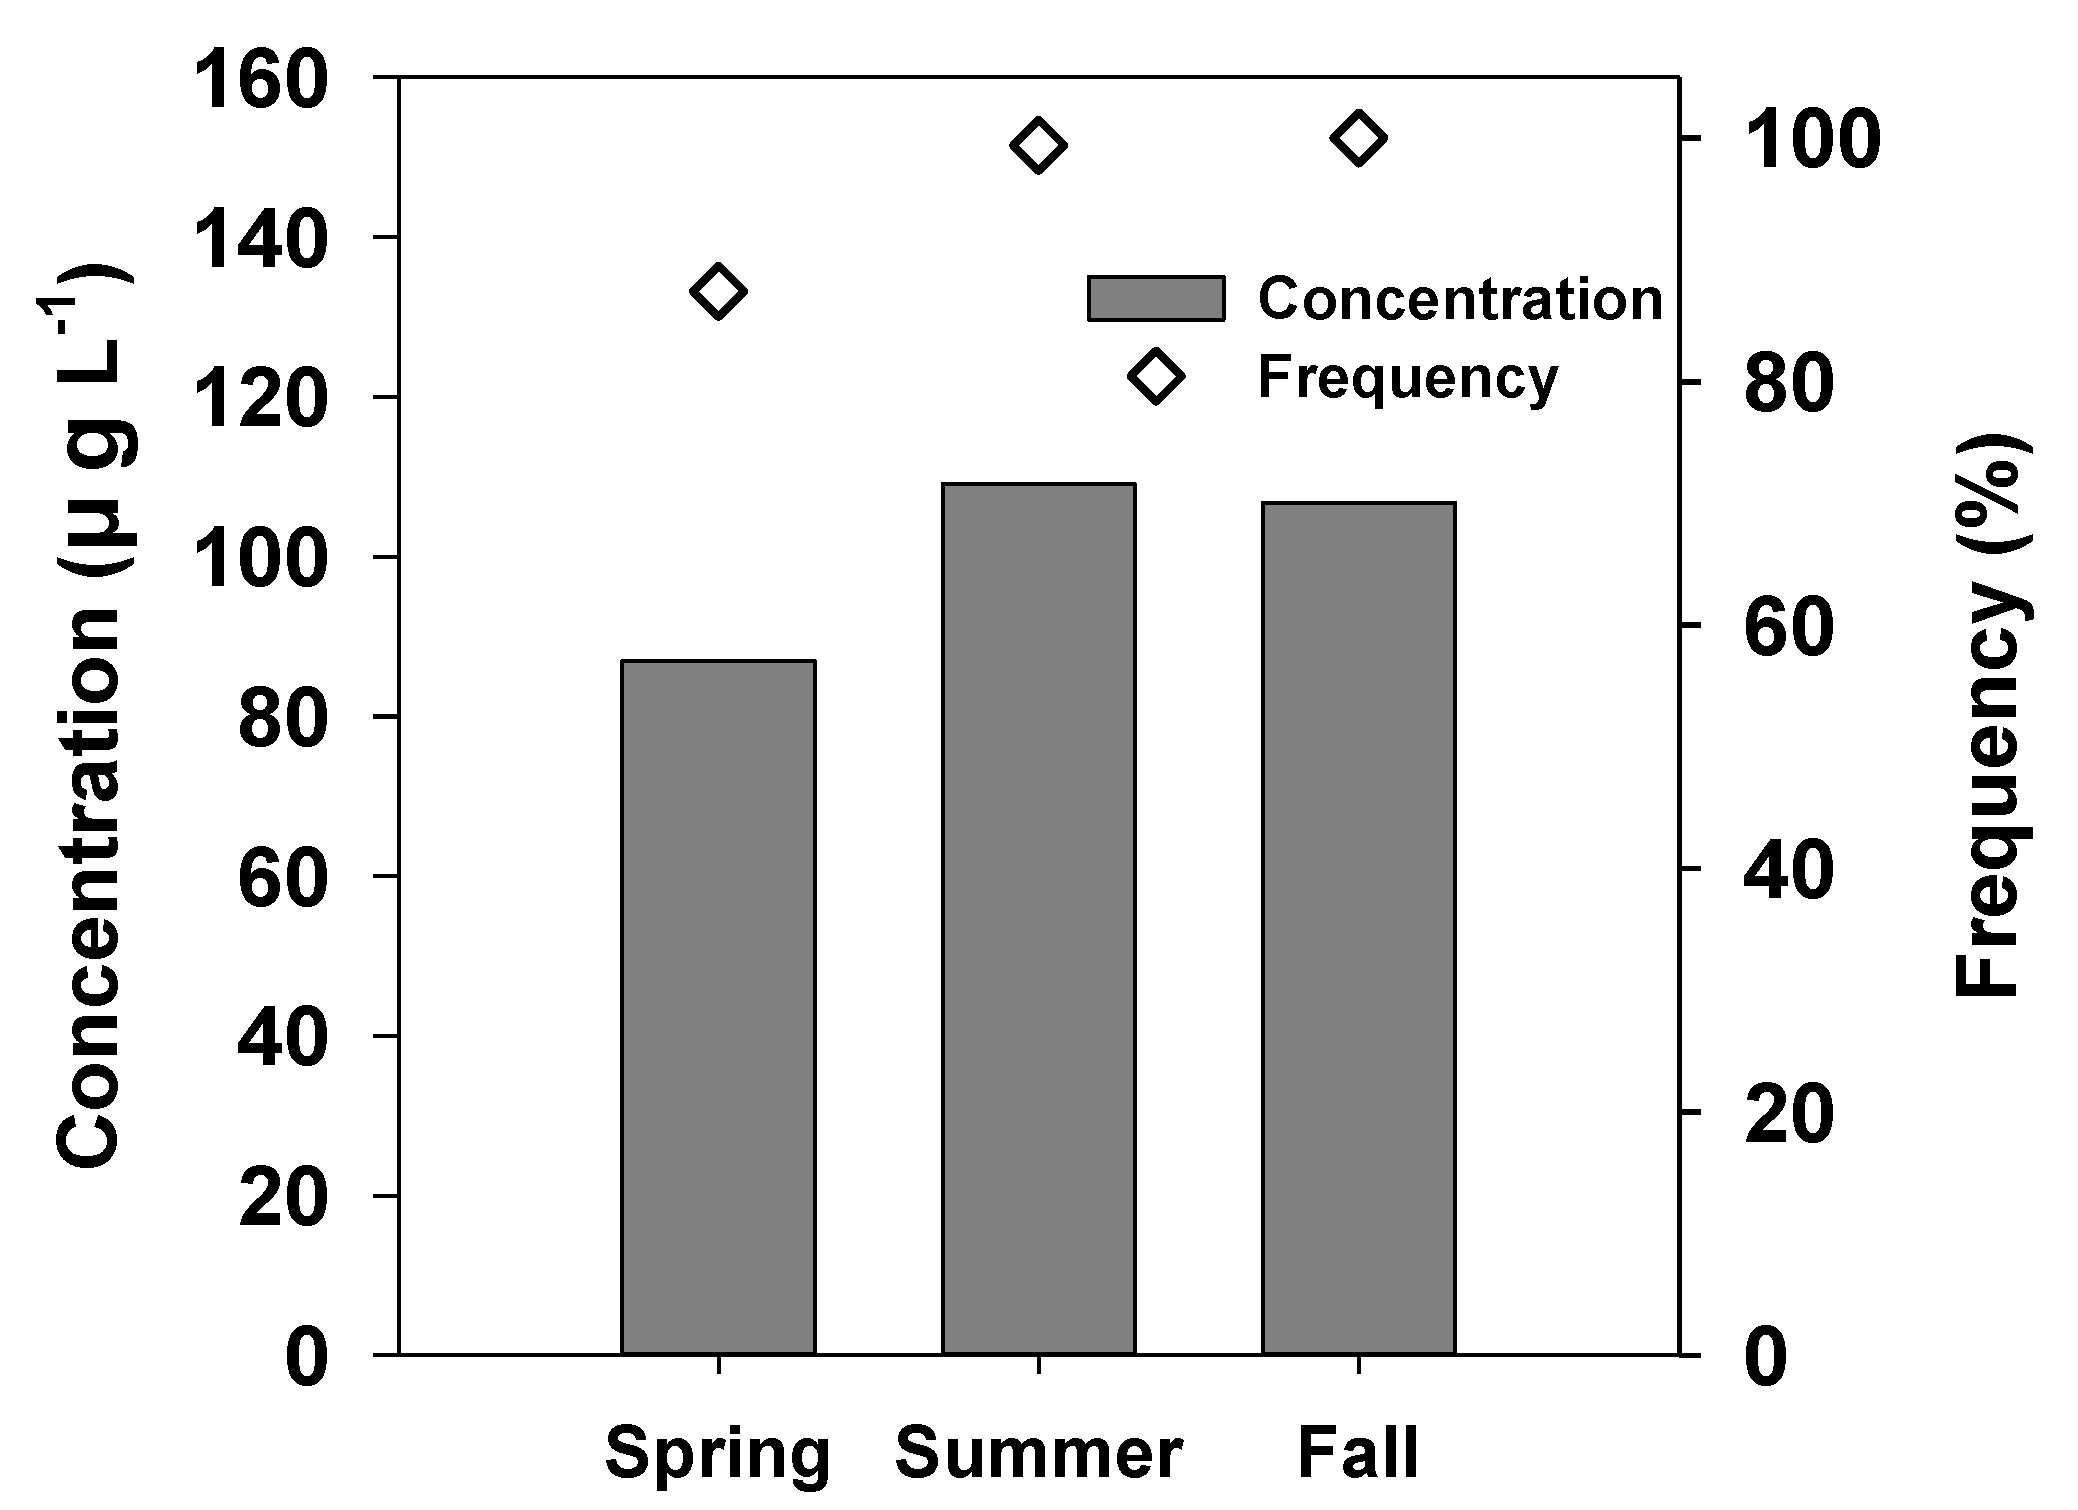
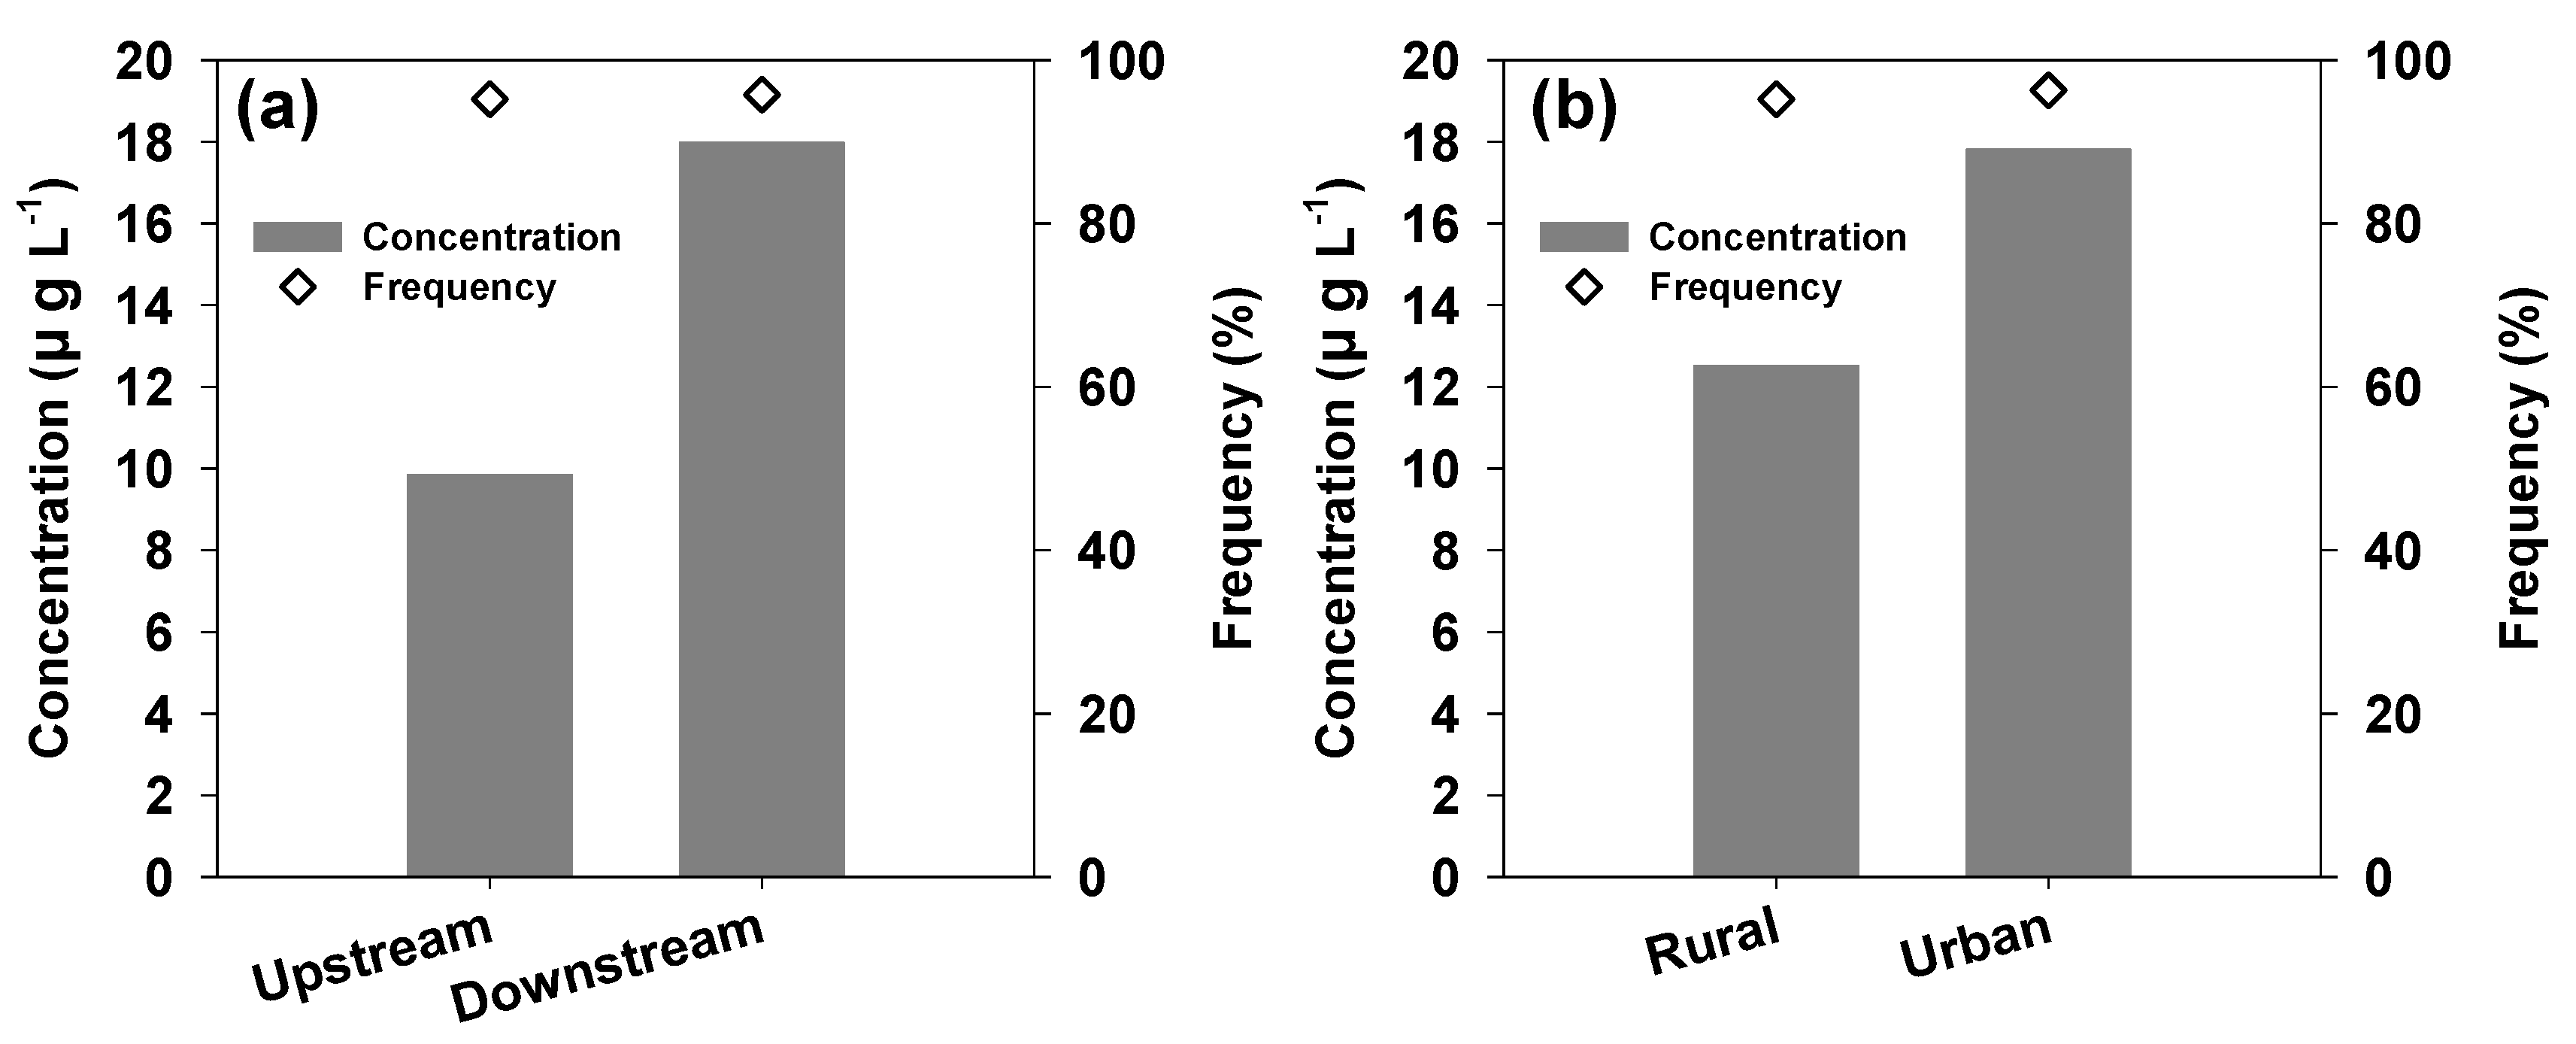
3.1. Site-Specific and Seasonal Variations of Heavy Metals

The results of the metal analysis were obtained for 2015, where the mean concentrations of Ag, Cd, Cu, Mn, Ni, Pb, and Zn were found to be 3.2 × 10⁻², 2.4 × 10⁻², 3.9 × 100, 6.4 × 101, 3.5 × 100, 0.8 × 100, and 2.8 × 101 μg L−1 across all samples, respectively. High concentrations of Mn > Zn > Cu > Ni > Pb > Cd > Ag (presented in descending order) were detected in all the sampling sites (Figure 2). Particularly high levels of Mn were detected, believed to be caused by industrial activities, such as those by steel material manufacturers and power producers, and the soil composition in paddy fields (Figure S2) [34,35,36,37].
The sampling sites with the highest concentrations of heavy metals were determined to be IH-2, H-8, H-7, S-4, and A-1, which were primarily located downstream of WTFs and consequently, may be viewed as a result of anthropogenic activities (Table 2, Figure 1 and Figure S2). In particular, the concentration of heavy metals in A-1 was 2.3 × 101 μg L−1, which was higher than the mean for all 25 sites (1.5 × 101 μg L−1) and then 16 WTPs downstream sites (1.8 × 101 μg L−1) that included brackish water. It is believed that high salinity increases the competition between cations and metals for binding sites on the organic surfaces of clay particles, thereby increasing the concentrations of certain metals in the overlying water [38].
Figure 3 presents the mean heavy metal concentrations for three seasons (spring, summer, and fall). The varying concentrations demonstrated a pronounced seasonal trend. The mean concentrations of all the investigated metals (Cd, Cu, Zn, Mn, Pb, Ni, and Ag) in the surface water were 8.7 × 101, 1.1 × 10², and 1.1 × 10² μg L−1 in spring, summer, and fall, respectively. Regardless of the sampling location, the metal concentrations were higher in summer and fall than in other seasons. A t-test was used to determine the statistical significance. The overall concentrations of the investigated metals fluctuated significantly between spring and summer (p-value = 0.000), as well as between spring and fall (p-value = 0.000). However, no significant difference was observed between summer and fall (p-value = 0.890), demonstrating how anthropogenic activities and hydrological regimes affect seasonal surface water inputs. For instance, this may be explained by the high levels of evaporation during the summer and considerable anthropogenic activity, such as agriculture, extensive mining and lubricating oil during this time [1,39]. Previous studies have shown that the concentration of heavy metals is higher during the rainy season than during the dry season [29,40,41].
In contrast, in this study, the diluting effect generated by torrential rainfall during the summer decreased the total concentrations of heavy metals [42,43,44]. In South Korea, the rainfall is concentrated, and the flow rates increase during the monsoon climate in summer, which could be impacted by dilution or non-point pollution sources. However, the results of this study demonstrate that a substantial amount of rainfall is sufficient to introduce a non-point pollution source rather than a diluting effect. In certain industrial and urban areas, the monsoon season accounts for 50% of the annual precipitation. The runoff from these areas, thus, flows into surrounding rivers as non-point pollution sources.
This phenomenon was evident at IH-4 in the summer. The high concentrations of heavy metals, especially in summer, is rather unusual, despite the fact that no point sources exist immediately upstream of this area. However, it is the most downstream point of the IH area, and it can be assumed that heavy metals generated in the industrial area upstream were introduced by rainfall (Figure S2).
The results of this study were compared to the drinking water standards of countries and institutions worldwide (Table S4). The Mn concentrations exceeded the limits prescribed by the drinking water guidelines of South Korea, WHO, US EPA, European Union (EU), Bureau of Indian Standards (BIS), Canada, Japan, and China in 14 out of 25 sampling sites. The concentrations of Ni exceeded the drinking water standards at two of the sampling sites (IH-2 and H-1); IH-2 exceeded the Japanese standards, and H-1 exceeded the EU, BIS, and China standards. Compared with other countries, the Ni concentrations were considered low or similar. The concentrations of heavy metals were consistent with prior research when compared to heavy metal concentrations from other streams or rivers worldwide.
The mean concentrations of heavy metals were relatively high in the downtown area and downstream of the WTFs (Figure 4a). The heavy metal concentrations at the downstream sampling sites of the WTFs were 1.8 times higher than those in the upstream areas and 1.3 times higher than those in the suburban areas. These results indicate that WTFs, a point source of pollution, may be regarded as the primary source of pollution and that this primarily occurs in urban areas where anthropogenic sources are more prevalent than natural sources. However, it cannot be ruled out that non-point pollution sources in the suburbs may also be sources of heavy metals (emission sources) (Figure 4b).

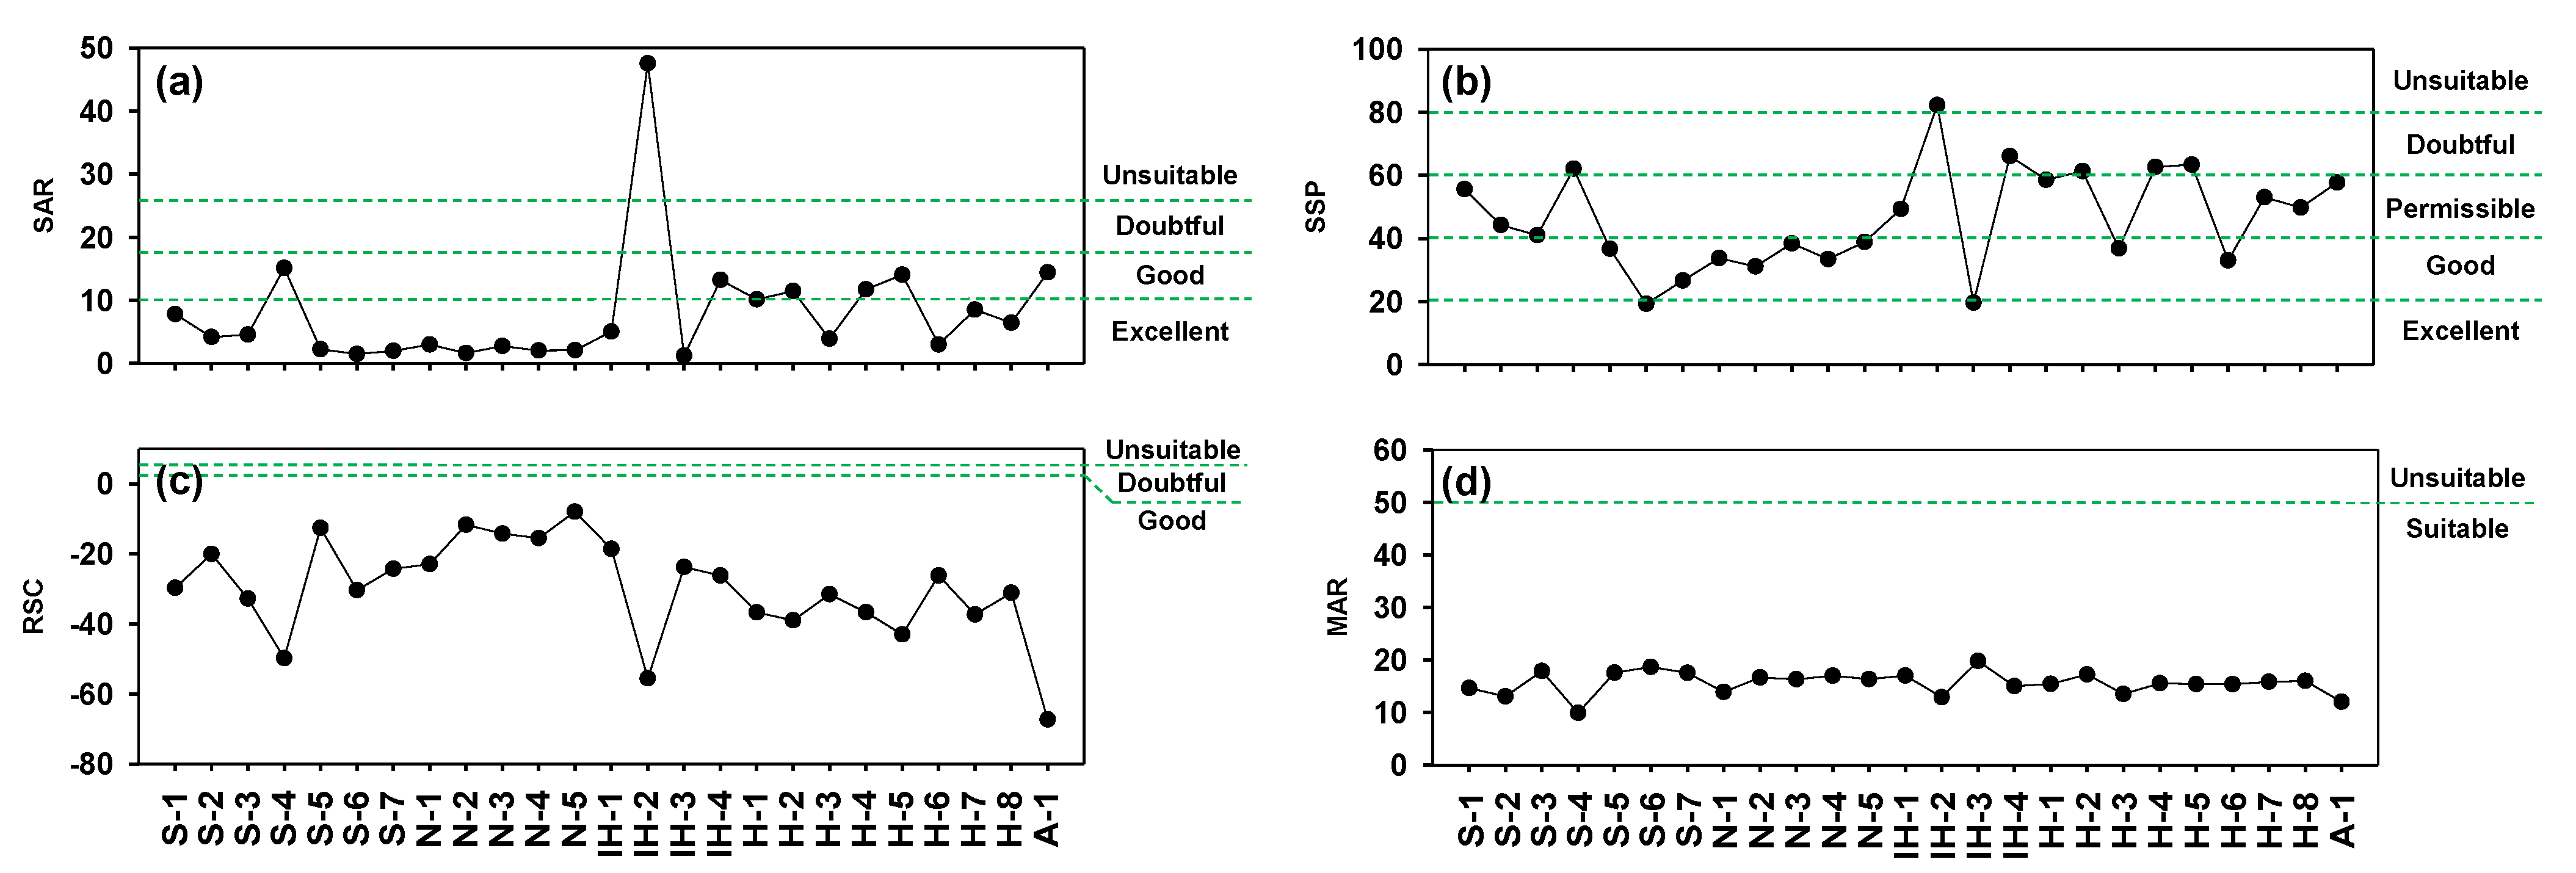
3.2. Irrigation Water Quality

According to the irrigation suitability indicators, RSC and MAR, a majority of the sites were determined to be suitable for irrigation. However, the SAR and SSP indicated that certain samples were unsuitable; the surface water at the IH-2 sampling site was unsuitable for irrigation purposes due to its high salt content, which inhibits the ability of the soil to absorb water (Figure 5).
The SAR ranged from 1.25 to 47.59, with a mean value of 8.01. The SAR values for each sample are presented in Figure 5a. The SAR values at all the sites were categorized based on the potential for irrigation [45], i.e., as having good or excellent potential, barring IH-2. The SAR values at IH-2 were deemed unsuitable for irrigation purposes, indicating that both point and non-point pollution sources were responsible for elevated Na+ concentrations.
The RSC values, ranging from −67.25 to −7.96 and with a mean value of −29.78, were used to determine whether the water was suitable for irrigating clay soils with a high cation exchange capacity [46]. The RSC values for each sample are presented in Figure 5b.
Eaton (1950) [47] categorized the RSC values as low to high (or good to unsuitable) based on their range. All the collected samples fell into one of two categories—low or good (less than 1.25). Owing to the scarcity of limestone minerals in the research area, the lower RSC values of the samples indicate that they contain fewer carbonates.
The values of SSP (Na%) for each sample are presented in Figure 5c. The mean Na% value was determined to be 46.20, ranging from 19.27–82.23. Based on the Na%, the SSP was graded as excellent, good, permissible, doubtful, or unsuitable in terms of their suitability for irrigation [48]. Accordingly, 8% of the samples were rated as excellent, 36% as good, 32% as permissible, 20% as doubtful, and 4% as unsuitable.
The mean MAR was found to be 15.66, ranging from 9.94–19.81. The MAR values for each sample are presented in Figure 5d. The MAR values were categorized as appropriate or unsuitable for irrigation purposes [49]. All the sites met the requirements of the suitable category. Because of the replacement of alkali ions in the soil, the concentrations of Ca2+ and Mg2+ would inhibit plant development, impact irrigation water quality, and influence crop yield [50].

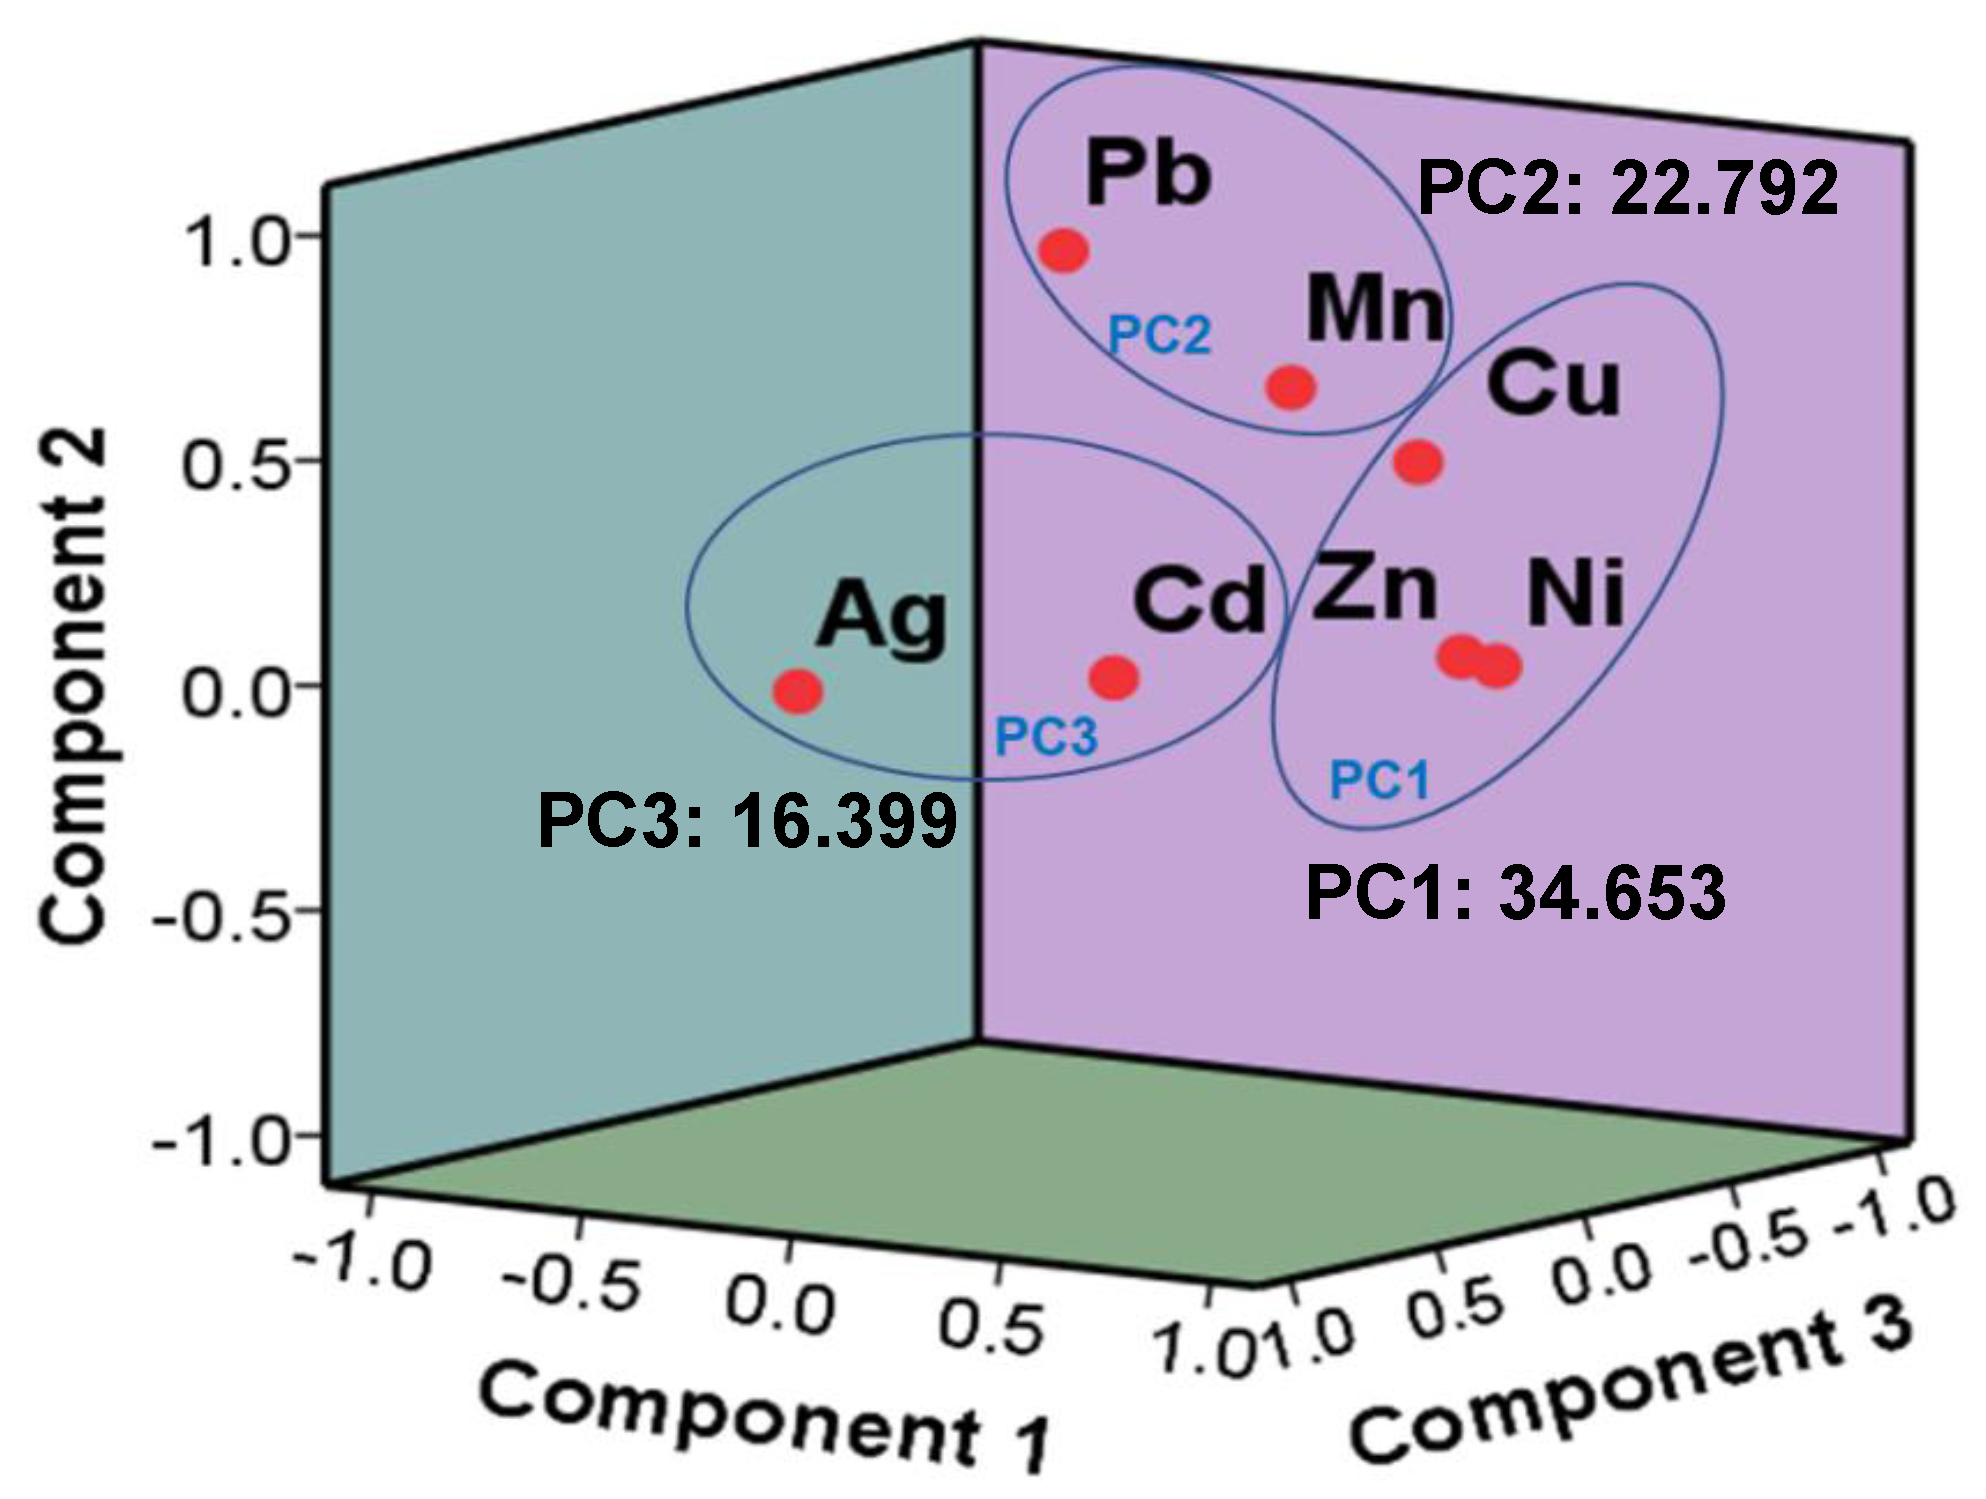
3.3. Analysis of Heavy Metal Pollution Sources

The surface water was then examined for inter-element correlations. Table 3 and Figure 6 present the results of the PCA. The PCA was implemented to facilitate the analysis of the fundamental data. This effective technique permits the identification of several correlated heavy metal groups that may share a common origin and behavior [51]. The number of significant principal components was determined according to a high cumulative percentage of explained variance of 73.8% and the Kaiser criterion with an eigenvalue > 1 [52].
The PCA results of the surface water from the Han River watershed revealed that the variables were connected to three principal components, accounting for 73.844% of the total variance. After varimax rotation, the components (factors) associated with the sources of heavy metals were extracted.
The first factor (PC1) appeared to be associated with vehicle-related sources (vehicular pollution). The first component, which accounted for 34.653% of the variance, comprised Ni, Zn, and Cu with high loadings.) Zn and Cu found in the samples are known to originate from brakes [53,54], tire wear, and other traffic sources [55,56,57]. These heavy metals remobilize in street sediments and are absorbed on the surfaces of clay particles [58,59]. As can be observed, Mn and Cd showed a low connection with the vehicle-related sources.
The second component (PC2), comprising Pb and Mn, explained 22.79% of the total variance. This could be attributed to industrial waste and agricultural activities. Pb has been linked to numerous industries, such as the manufacturing of batteries, metal products, paints, and ceramics [60]. Mn is used to control redox conditions, increase strength, and increase hardenability in carbon steels, which typically contain 0.3–1.5 wt% Mn [61]. Iron- and steel-related industries, power plants and coke ovens, paper and newsprint mills, fossil fuel electric power generators, commercial heating and refrigeration manufacturers, dry-cell battery manufacturers, and welding industries are the major industrial sources of Mn [35,36,37]. In addition, Mn and Pb were found to be present at higher levels in paddy soils, whereas Ni, Cu, and Cd levels were found to be lower [62,63,64,65].
The third component (PC3) comprised Ag and Cd, accounting for 16.399% of the variance in the results. This component appeared to have originated from urban and agricultural areas. According to Jalali and Hemati (2000) [66], Cd is present in phosphatic fertilizers used in agricultural activities. Cd may therefore enter the local water system as a non-point source of pollution via precipitation. In addition, according to Yildirim and Tokalioğlu (2016) [54], alloy surfaces and building materials are the primary sources of Cd. Ag is found in photographic films, electrical equipment, batteries, and smelting devices [67]. However, low concentrations of Ag were detected in this study. Cd and Ag may therefore be potential risk factors.

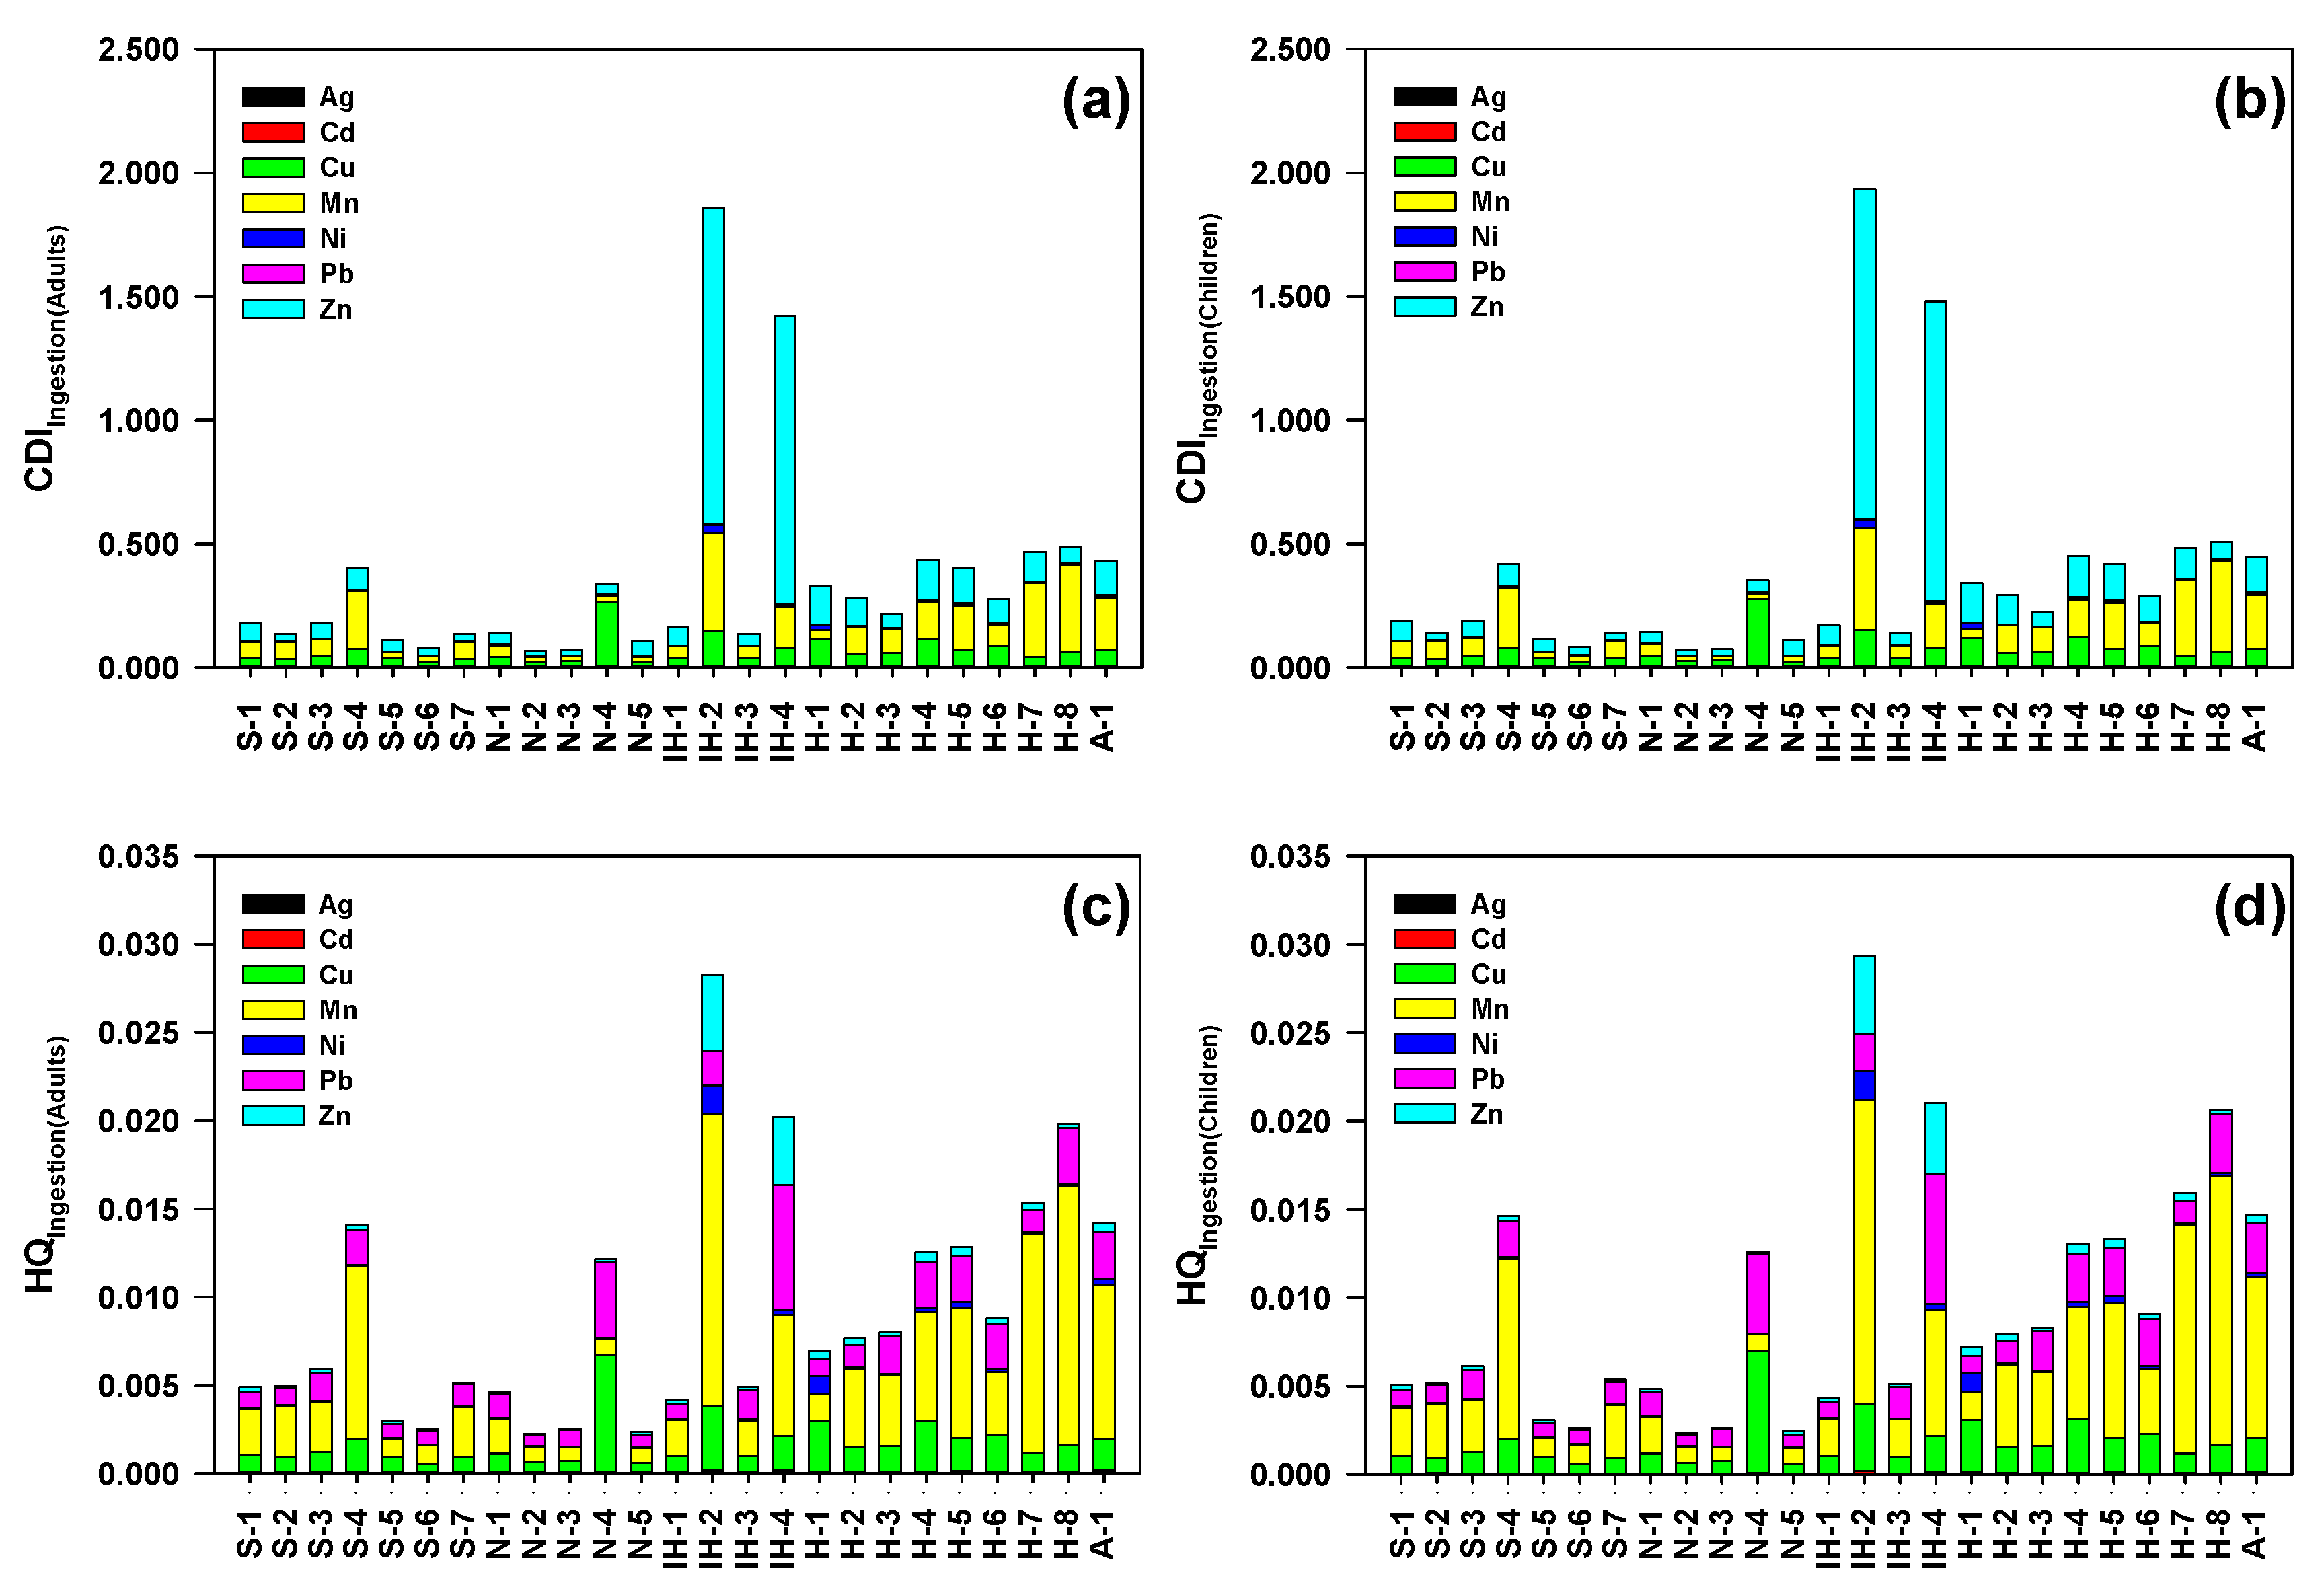
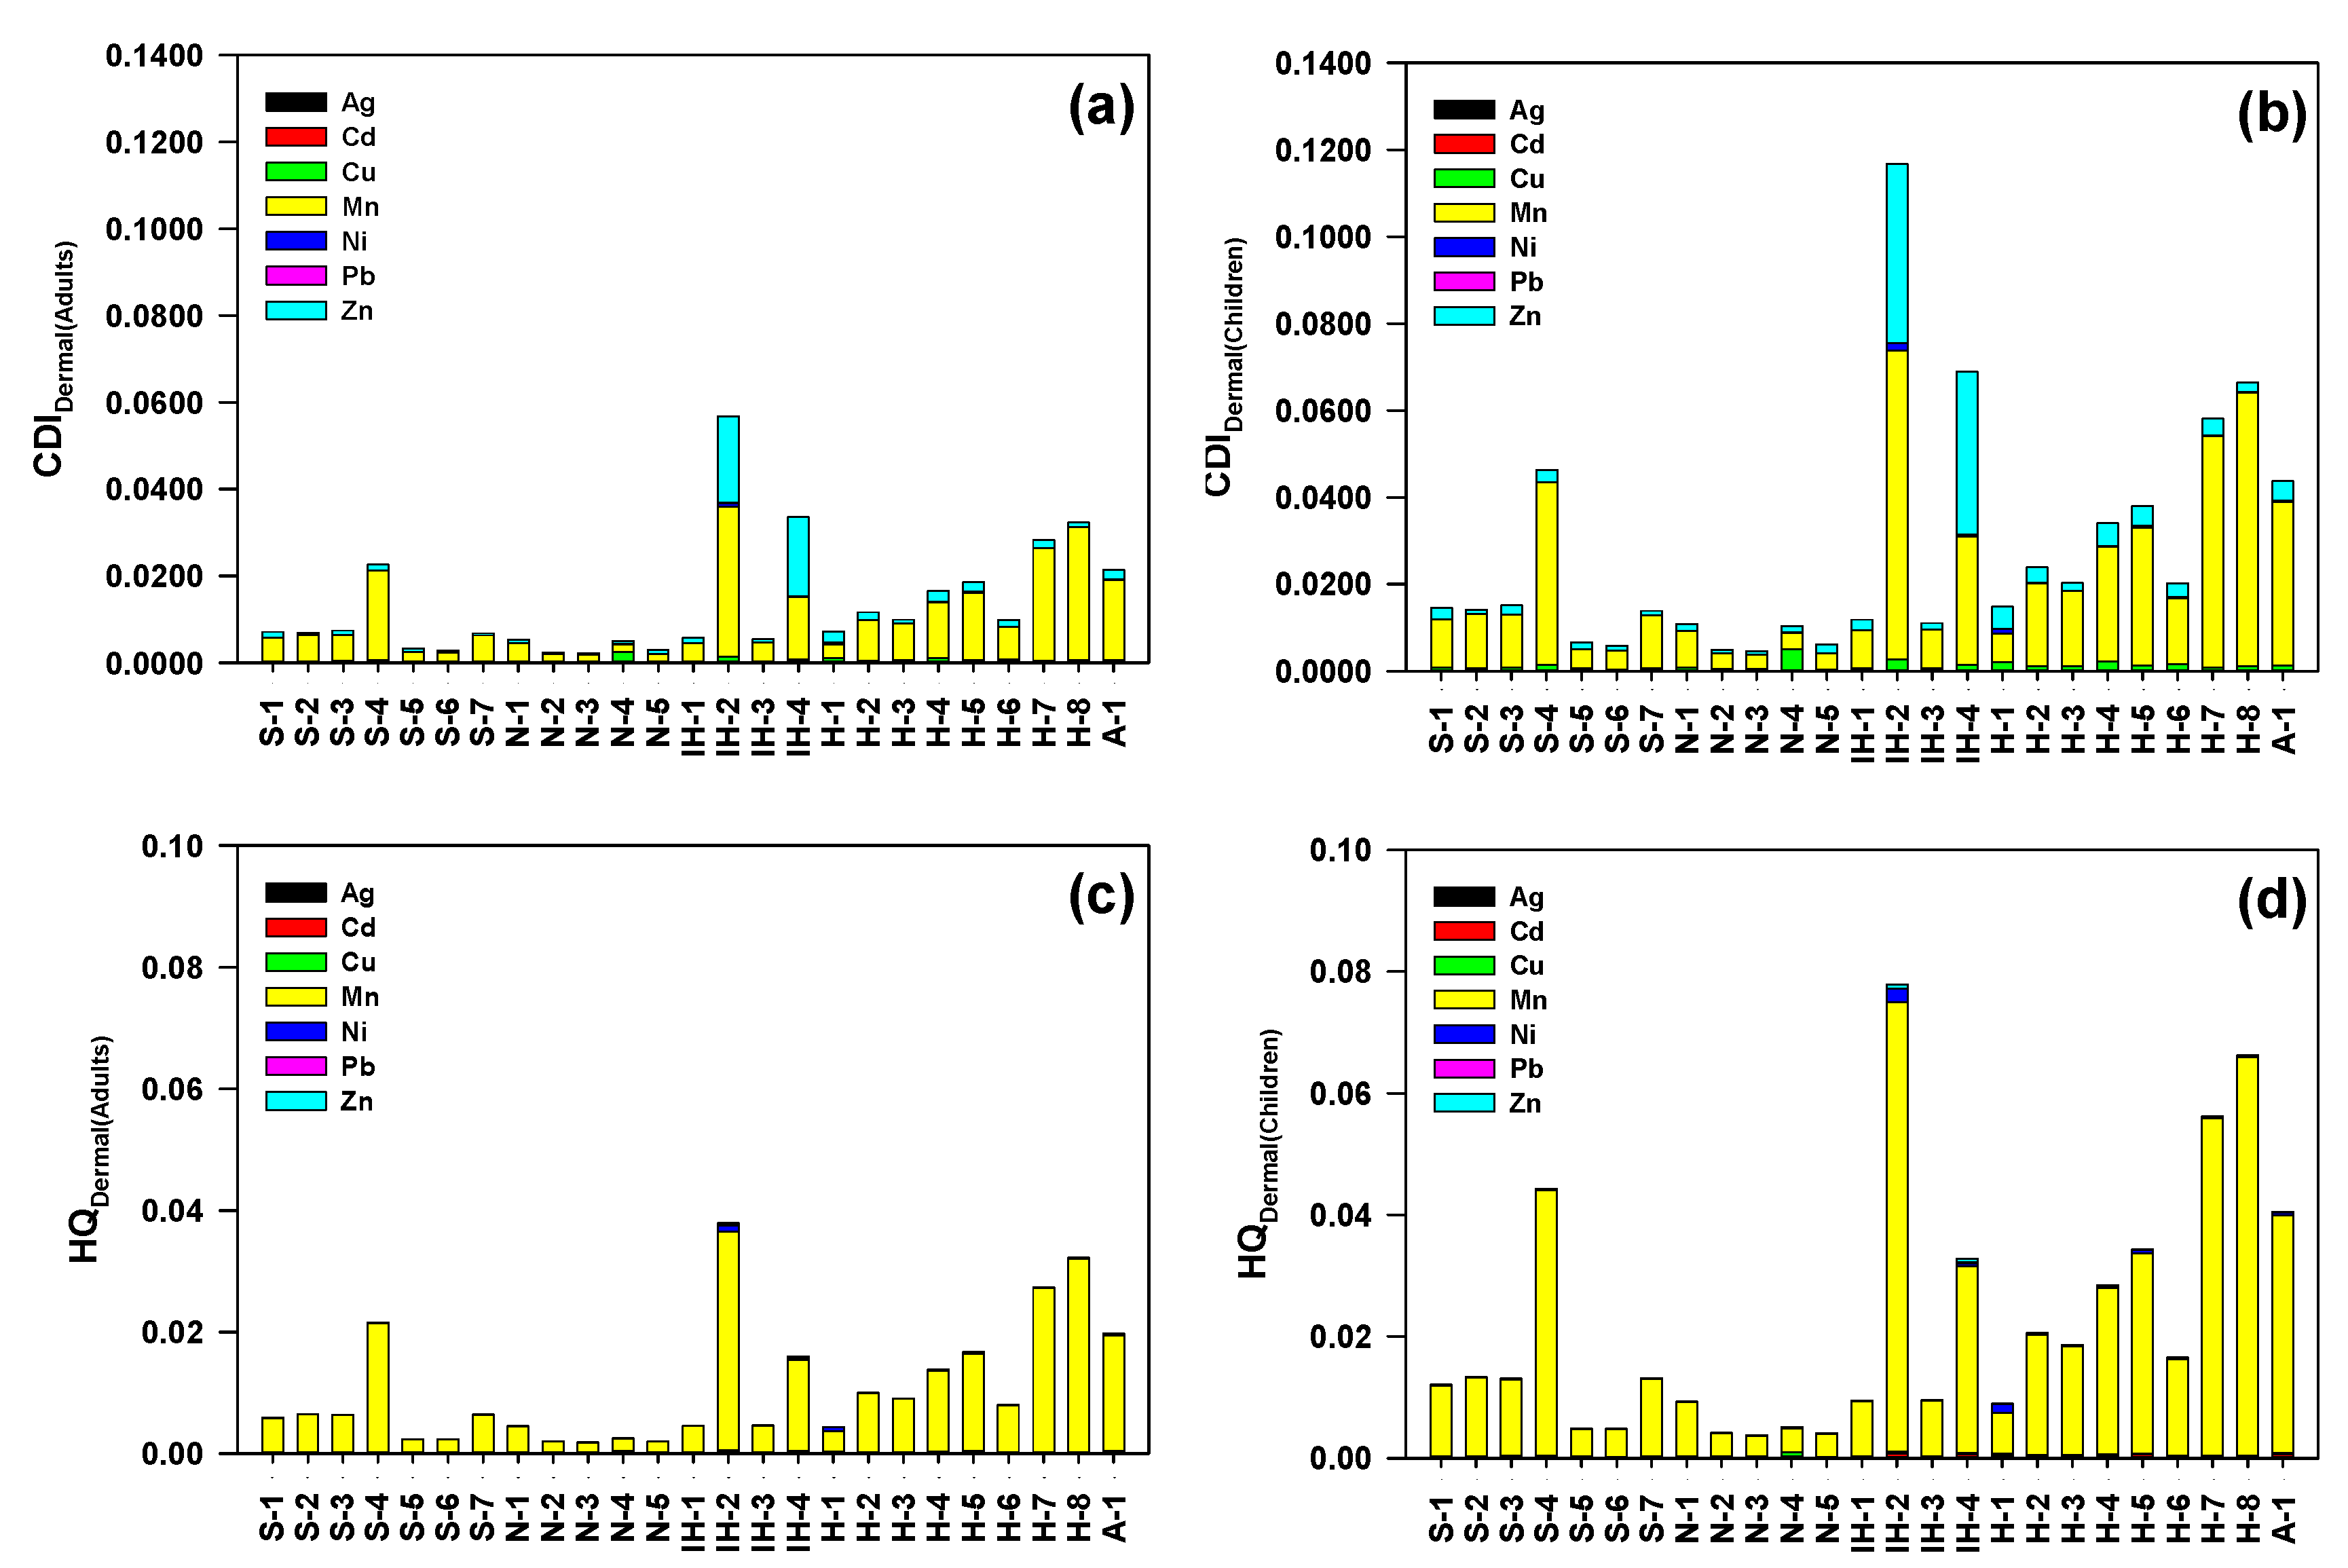
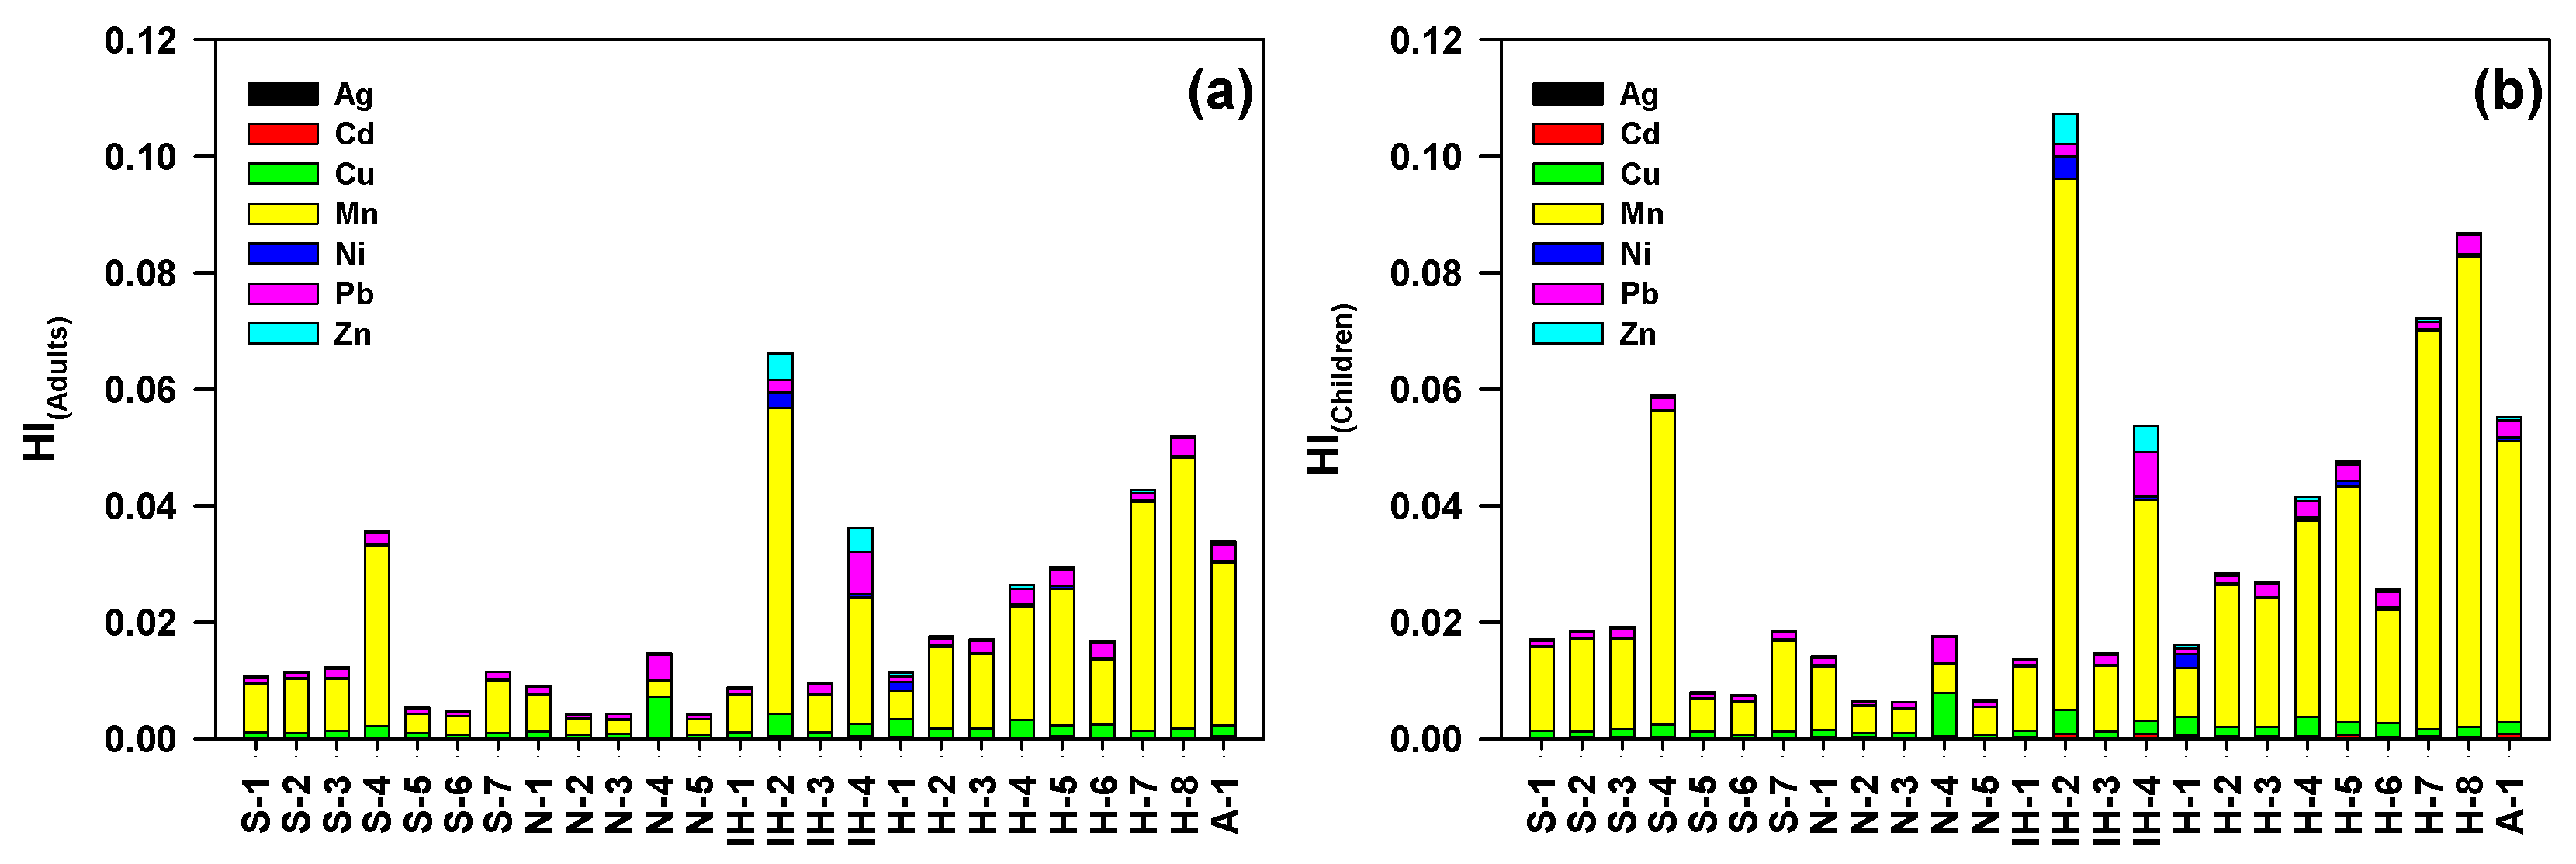
3.4. Health Risk Assessment of Heavy Metals

Human exposure to heavy metals via oral ingestion and dermal absorption was evaluated based on the heavy metal concentrations in the surface water. Adults and children were divided into separate population groups for this study. The CDI, HQ, and hazard index (HI) were calculated to determine the risk to human health. CDI is the daily exposure of a population to metallic contaminants (μg/kg/day). HQ denotes the health hazards posed by metals, with HQ values > 1 being deemed unsafe and detrimental to human health. The HI used the addition of HQs to demonstrate the potential health risks posed by various heavy metals.
In terms of the ingestion and dermal absorption rates in adults and children, the descriptive statistics of the CDI and HQ values are presented in Figure 7 and Figure 8. The computed values for CDIIngestion (adults), CDIIngestion (children), HQIngestion (adults), and HQIngestion (children) for drinking water intake at the 25 sampling sites are presented in Figure 7. The concentrations of heavy metals in the water consumed by both groups were in the order of Zn > Mn > Cu > Ni > Pb > Ag > Cd. Therefore, Zn was considered the most consumed heavy metal in both groups, with children consuming 1.74 × 10⁻¹ μg kg−1 day−1 and adults consuming 1.67 × 10⁻¹ μg kg−1 day−1. According to the data, both groups consumed polluted surface water with elevated Zn concentrations at the IH-2 and IH-4 sampling sites (Figure 7a,b). The results of the HQ represented two population groups, each consuming water containing heavy metals in the order of Mn > Pb > Cu > Zn > Ni > Cd > Ag.
The HQ values were high at the IH-2, IH-4, H-7, and H-8 sampling sites in both groups. Higher HQ values for Mn were observed at this site (4.93 × 10⁻³ μg kg−1 day−1 for children and 4.74 × 10⁻³ μg kg−1 day−1 for adults), indicating that the water was only moderately contaminated by anthropogenic sources but could still be hazardous to human health (Figure 7c,d).
The CDIDermal (adults), CDIDermal (children), HQDermal (adults), and HQDermal (children) values for the body absorption rate of water along the 25 sampling sites are summarized in Figure 8. According to the CDI values for both groups, Mn demonstrated a higher dermal absorption rate than the other metals (2.04 × 10⁻² μg kg−1 day−1 for children and 9.91 × 10⁻³ μg kg−1 day−1 for adults), indicating that heavy metals in the water were in the order of Mn > Zn > Cu > Ni > Pb > Cd > Ag type (Figure 8a,b). In addition, the HQ values demonstrated that the order of the heavy metals in the water for both groups was Mn > Cd > Ni > Cu > Zn > Pb > Ag, with the Mn concentration being above the HQ standard values for dermal absorption in children (2.12 × 10⁻² μg kg−1 day−1) and adults (1.03 × 10⁻² μg kg−1 day−1) (Figure 8c,d). All the investigated heavy metals had HQ values less than 1, indicating a potential risk to both populations as long as heavy metals are present in the water.
The HI index of trace metals was assessed for dermal absorption and ingestion rates to determine the most contaminated locations within the study area (Figure 9). The mean HI indexes for all sites ranged from 6.40 × 10⁻³ to 1.07 × 10⁻¹ for children and adults, with a mean value of 3.16 × 10⁻², and 4.28 × 10⁻³ to 6.61 × 10⁻², with a mean value of 1.99 × 10⁻², respectively (Figure 9a,b).
The HI indexes for all the heavy metals indicated that the population was not at risk. However, some locations in the middle of the basin demonstrated high HI values that were within the desirable range (<1). The estimated HQ and HI values for all exposure pathways were within the safety limit (<1) for all the populations. However, children were found to be more susceptible than adults, most likely due to physiological immaturity and exposure per unit of weight [44,68,69,70].
Although the HI values were within the desirable range, all the values were found to be close to the desired threshold set for HI values. Consequently, HI values may exceed the desired threshold in the near future and result in unfavorable conditions for a substantial population. The local population in the study area may be at a high risk owing to ingestion and dermal absorption, which was also assumed in the study. This is because metals that are hazardous to human health are also present in particles that were filtered and excluded from the analysis. Consequently, the assumption of the risks of the study may be underestimated. Heavy metal concentrations may increase in the future as a result of the progressive growth of urban and industrial areas, excessive use of pesticides and chemical fertilizers, and the discharge of pollutants from nearby sources.

4. Conclusions

This study investigated heavy metal concentrations and the associated health risks in the surface water of the Han River watershed, a major source of potable and agricultural water in South Korea. It was found that Mn had the highest mean concentration, followed by Zn, Cu, Ni, Pb, Ag, and Cd. Among the target sites, IH-2 exhibited the highest heavy metal concentrations. The mean heavy metal concentrations were highest in the downtown (1.8 times) area and downstream areas relative to WTFs (1.3 times), indicating that the WTFs may be considered the primary source of heavy metal pollution. The results implied that significant focus should be paid to Mn and Ni concentrations and how they compare with national and international drinking water guidelines. The quality of the irrigation water was determined based on the RSC and MAR values, and all the samples were deemed suitable for irrigation. The SAR represented good or excellent outcomes, barring the IH-2 sampling site. The proportions of SSP values that indicated the suitability for irrigation were as follows: excellent (8%), good (36%), permissible (32%), doubtful (20%), and unsuitable (4%). The PCA results of three factors jointly explained 73.8% of the variance, with an initial eigenvalue > 1, indicating that vehicular and industrial activities are the primary sources of metal profusion in the Han River watershed. The HQ results showed two population groups exposed to heavy metals in water in the order of Mn > Pb > Cu > Zn > Ni > Cd > Ag type via ingestion and Mn > Cd > Ni > Cu > Zn > Pb > Ag type via dermal absorption. For children and adults, the mean HI index values in all the sites were determined to be 3.16 × 10⁻² and 1.99 × 10⁻² for ingestion and dermal absorption, respectively. This indicated that the HQ and HI were close to the safety limit (<1).

Supplementary Materials

The following supporting information can be downloaded at: https://www.mdpi.com/article/10.3390/agronomy12123111/s1, Table S1: ICP-MS conditions, Table S2: Recoveries and precisions for seven heavy metals, Table S3: Dermal permeability coefficient (Kp), reference dose (RfD) and gastrointestinal absorption factor (ABSg) for each metal, Table S4: Water quality standards for drinking water in countries and organizations (µg L−1), Figure S1: Seasonal variation in water temperature (a), pH (b), and dissolved organic matter (DOM) (c) at the target sites of the Han River watershed, Figure S2: Variation of heavy metals in the Han River watershed in spring (a), summer (b) and fall (c).

Author Contributions

Conceptualization, J.K.I. and Y.S.K.; methodology, Y.C.C.; software, J.K.I.; validation, J.K.I. and Y.S.K.; formal analysis, Y.C.C.; investigation, Y.S.K. and Y.C.C.; resources, T.K.; data curation, S.H.K.; writing—original draft preparation, J.K.I. and Y.S.K.; writing—review and editing, J.K.I., Y.S.K., Y.C.C., T.K. and S.H.K.; visualization, J.K.I.; supervision, T.K.; project administration, T.K.; funding acquisition, T.K. All authors have read and agreed to the published version of the manuscript.

Funding

This research was supported by the National Institute of Environmental Research (NIER) [grant number NIER-2022-01-01-042], funded by the Ministry of Environment (MOE) and Environmental Fundamental Data Examination Project of Han River Basin Management Committee of the Republic of Korea.

Conflicts of Interest

The authors declare no conflict of interest.

References

  1. Vega, M.; Pardo, R.; Barrado, E.; Debán, L. Assessment of seasonal and polluting effects on the quality of river water by exploratory data analysis. Water Res. 1998, 32, 3581–3592. [Google Scholar] [CrossRef]
  2. Zhang, G.Z.; Liu, H.; Jia, D.W. River basin management based on the mechanisms of water rights trading. Procedia Environ. Sci. 2010, 2, 665–673. [Google Scholar] [CrossRef] [Green Version]
  3. Carpenter, S.R.; Caraco, N.F.; Correll, D.L.; Howarth, R.W.; Sharpley, A.N.; Smith, V.H. Nonpoint pollution of surface waters with phosphorus and nitrogen. Ecol. Appl. 1998, 8, 559–568. [Google Scholar] [CrossRef]
  4. Jarvie, H.P.; Whitton, B.A.; Neal, C. Nitrogen and phosphorus in east coast British rivers: Speciation, sources and biological significance. Sci. Total Environ. 1998, 210, 79–109. [Google Scholar] [CrossRef]
  5. Bellos, D.; Sawidis, T. Chemical pollution monitoring of the river pinios (Thessalia—Greece). J. Environ. Manag. 2005, 76, 282–292. [Google Scholar] [CrossRef]
  6. Singh, K.P.; Malik, A.; Mohan, D.; Sinha. Multivariate statistical techniques for the evaluation of spatial and temporal variations in water quality of Gomti River (India)—A case study. Water Res. 2004, 38, 3980–3992. [Google Scholar] [CrossRef]
  7. Ouyang, Y.; Nkedi-Kizza, P.; Wu, Q.T.; Shinde, D.; Huang, C.H. Assessment of seasonal variations in surface water quality. Water Res. 2006, 40, 3800–3810. [Google Scholar] [CrossRef]
  8. Cidu, R.; Biddau, R. Transport of trace elements under different seasonal conditions: Effects on the quality of river water in a Mediterranean area. Appl. Geochem. 2007, 22, 2777–2794. [Google Scholar] [CrossRef]
  9. Bing, H.; Wu, Y.; Sun, Z.; Yao, S. Historical trends of heavy metal contamination and their sources in lacustrine sediment from Xijiu Lake, Taihu Lake Catchment, China. J. Environ. Sci. 2011, 23, 1671–1678. [Google Scholar] [CrossRef]
  10. Roberts, D.A. Causes and ecological effects of resuspended contaminated sediments (RCS) in marine environments. Environ. Int. 2012, 40, 230–243. [Google Scholar] [CrossRef]
  11. Gu, Y.-G.; Gao, Y.-P. Bioaccessibilities and health implications of heavy metals in exposed-lawn soils from 28 urban parks in the megacity Guangzhou inferred from an in vitro physiologically-based extraction test. Ecotoxicol. Environ. Saf. 2018, 148, 747–753. [Google Scholar] [CrossRef] [PubMed]
  12. Wang, S.-L.; Xu, X.-R.; Sun, Y.-X.; Liu, J.-L.; Li, H.-B. Heavy metal pollution in coastal areas of South China: A review. Mar. Pollut. Bull. 2013, 76, 7–15. [Google Scholar] [CrossRef] [PubMed]
  13. Wang, C.; Yang, Z.; Zhong, C.; Ji, J. Temporal–spatial variation and source apportionment of soil heavy metals in the representative river–alluviation depositional system. Environ. Pollut. 2016, 216, 18–26. [Google Scholar] [CrossRef] [PubMed]
  14. Giri, S.; Singh, A.K. Risk assessment, statistical source identification and seasonal fluctuation of dissolved metals in the Subarnarekha River, India. J. Hazard. Mater. 2014, 265, 305–314. [Google Scholar] [CrossRef]
  15. Cui, J.-L.; Zhao, Y.-P.; Lu, Y.-J.; Chan, T.-S.; Zhang, L.-L.; Tsang, D.C.; Li, X.-D. Distribution and speciation of copper in rice (Oryza sativa L.) from mining-impacted paddy soil: Implications for copper uptake mechanisms. Environ. Int. 2019, 126, 717–726. [Google Scholar] [CrossRef]
  16. Singh, N.; Gupta, V.K.; Kumar, A.; Sharma, B. Synergistic effects of heavy metals and pesticides in living systems. Front. Chem. 2017, 5, 70. [Google Scholar]
  17. Achary, M.S.; Satpathy, K.K.; Panigrahi, S.; Mohanty, A.K.; Padhi, R.K.; Biswas, S.; Prabhu, R.K.; Vijayalakshmi, S.; Panigrahy, R.C. Concentration of heavy metals in the food chain components of the nearshore coastal waters of Kalpakkam, southeast coast of India. Food Control 2017, 72, 232–243. [Google Scholar] [CrossRef]
  18. Huang, Y.F.; Ang, S.Y.; Lee, K.M.; Lee, T.S. Quality of water resources in Malaysia. Pract. Water Qual. 2015, 3, 65–94. [Google Scholar]
  19. British Columbia Ministry of Environment (ECME). British Columbia Source Drinking Water Quality Guidelines: Guideline Summary; Water Quality Guideline Series: Victoria, Australia; British Columbia Ministry of Environment (ECME): Victoria, Australia, 2017. [Google Scholar]
  20. Ministry of Health. Drinking Water Standards for New Zealand 2005; Ministry of Health: Wellington, New Zealand, 2008; (revised 2008).
  21. United States Environmental Protection Agency (U.S. EPA). National Primary Drinking Water Regulations; United States Environmental Protection Agency: Washington, DC, USA, 2020. Available online: https://www.epa.gov/ground-water-and-drinking-water/national-primary-drinking-water-regulations (accessed on 3 May 2022).
  22. Ministry of Environment (MOE). Available online: https://me.go.kr/hg/web/main.do (accessed on 23 August 2022).
  23. Korea Meteorological Administration (KMA). Available online: https://www.weather.go.kr/w/index.do (accessed on 23 August 2022).
  24. Ministry of Environment (MOE). National Pollutant Investigation Report in 2015; Ministry of Environment (MOE): Sejong, Republic of Korea, 2016.
  25. Sohrabi, N.; Kalantari, N.; Amiri, V.; Nakhaei, M. Assessing the chemical behavior and spatial distribution of yttrium and rare earth elements (YREEs) in a coastal aquifer adjacent to the Urmia Hypersaline Lake, NW Iran. Environ. Sci. Pollut. Res. 2017, 24, 20502–20520. [Google Scholar] [CrossRef]
  26. Singh, K.R.; Goswami, A.P.; Kalamdhad, A.S.; Kumar, B. Development; Sustainability. Development of irrigation water quality index incorporating information entropy. Environ. Dev. Sustain. 2020, 22, 3119–3132. [Google Scholar] [CrossRef]
  27. Ravikumar, P.; Aneesul Mehmood, M.; Somashekar, R.K. Water quality index to determine the surface water quality of Sankey tank and Mallathahalli lake, Bangalore urban district, Karnataka, India. Appl. Water Sci. 2013, 3, 247–261. [Google Scholar] [CrossRef] [Green Version]
  28. Wu, B.; Zhao, D.; Jia, H.Y.; Zhang, Y.; Zhang, X.X.; Cheng, S.P. Preliminary risk assessment of trace metal pollution in surface water from Yangtze River in Nanjing Section, China. Bull. Environ. Contam. Toxicol. 2009, 82, 405–409. [Google Scholar] [CrossRef] [PubMed]
  29. Li, S.; Zhang, Q. Risk assessment and seasonal variations of dissolved trace elements and heavy metals in the Upper Han River, China. J. Hazard. Mater. 2010, 181, 1051–1058. [Google Scholar] [CrossRef]
  30. U.S. EPA. Risk Assessment Guidance for Superfund Volume 1: Human Health Evaluation Manual (Part E, Supplemental Guidance for Dermal Risk Assessment) Final; U.S. EPA: Washington, DC, USA, 2004.
  31. WHO. Guidelines for Drinking Water Quality, 4th ed.; Incorporating the First Addendum; WHO: Geneva, Switzerland, 2017. [Google Scholar]
  32. European Centre for Ecotoxicology of Chemicals. Aquatic Toxicity of Mixtures; Technical Report 80; European Centre for Ecotoxicology of Chemicals: Brussels, Belgium, 2001. [Google Scholar]
  33. Koklu, R.; Sengorur, B.; Topal, B. Water quality assessment using multivariate statistical methods—A case study: Melen River System (Turkey). Water Resour. Manag. 2010, 24, 959–978. [Google Scholar] [CrossRef]
  34. Dietrich, M.; Huling, J.; Krekeler, M.P. Metal pollution investigation of Goldman Park, Middletown Ohio: Evidence for steel and coal pollution in a high child use setting. Sci. Total Environ. 2018, 618, 1350–1362. [Google Scholar] [CrossRef] [PubMed]
  35. Malm, O.; Pfeiffer, W.C.; Fiszman, M.; Azcue, J.M. Transport and availability of heavy metals in the Paraíba do Sul-Guandu River system, Rio de Janeiro state, Brazil. Sci. Total Environ. 1988, 75, 201–209. [Google Scholar] [CrossRef]
  36. WHO. Diseases Cuased by Manganese and Its Toxic Compounds, Early Detection of Occupational Diseases; World Health Organization: Geneva, Switzerland, 1986. [Google Scholar]
  37. EPA822R03003; Health Effects Support Document for Manganese. U.S. Environmental Protection Agency: Washington, DC, USA, 2003.
  38. Elder, J.F. Metal Biogeochemistry in Surface-Water Systems: A Review of Principles and Concepts; Department of the Interior, U.S. Geological Survey: Washington, DC, USA, 1988. [Google Scholar]
  39. Adeleye, A.O.; Yerima, M.B.; Nkereuwem, M.E.; Onokebhagbe, V.O.; Daya, M.G. Effect of Bio-enhanced Streptococcus pyogenes and Enterococcus faecalis Co-culture on Decontamination of Heavy Metals Content in Used Lubricating Oil Contaminated Soil. J. Soil Plant Environ. 2022, 1, 1–15. [Google Scholar] [CrossRef]
  40. Li, S.; Xu, Z.; Cheng, X.; Zhang, Q. Dissolved trace elements and heavy metals in the Danjiangkou Reservoir, China. Environ. Geol. 2008, 55, 977–983. [Google Scholar] [CrossRef]
  41. Klavinš, M.; Briede, A.; Rodinov, V.; Kokorite, I.; Parele, E.; Klavina, I. Heavy metals in rivers of Latvia. Sci. Total Environ. 2000, 262, 175–183. [Google Scholar] [CrossRef]
  42. Zhang, L.; Zhao, B.; Xu, G.; Guan, Y. Characterizing fluvial heavy metal pollutions under different rainfall conditions: Implication for aquatic environment protection. Sci. Total Environ. 2018, 635, 1495–1506. [Google Scholar] [CrossRef]
  43. Karunanidhi, D.; Aravinthasamy, P.; Subramani, T.; Chandrajith, R.; Raju, N.J.; Antunes, I.M.H.R. Provincial and seasonal influences on heavy metals in the Noyyal River of South India and their human health hazards. Environ. Res. 2022, 204, 111998. [Google Scholar] [CrossRef]
  44. Jaiswal, M.; Gupta, S.K.; Chabukdhara, M.; Nasr, M.; Nema, A.K.; Hussain, J.; Malik, T. Heavy metal contamination in the complete stretch of Yamuna river: A fuzzy logic approach for comprehensive health risk assessment. PLoS ONE 2022, 17, e0272562. [Google Scholar] [CrossRef] [PubMed]
  45. Richards, L. Diagnosis and Improvement of saline alkali soils. In U.S. Department of Agriculture, Han Book; U.S. Governmental Print Office: Washington, DC, USA, 1954; p. 160. [Google Scholar]
  46. Zhou, Y.; Li, P.; Xue, L.; Dong, Z.; Li, D. Solute geochemistry and groundwater quality for drinking and irrigation purposes: A case study in Xinle City, North China. Geochemistry 2020, 80, 125609. [Google Scholar] [CrossRef]
  47. Eaton, F.M. Significance of carbonate in irrigation waters. Soil Sci. 1950, 69, 123–133. [Google Scholar] [CrossRef]
  48. Wilcox, L.V. The Quality of Water for Irrigation Use; United States Department of Agriculture, Economic Research Service: Washington, DC, USA, 1948.
  49. Paliwal, K.V.; Singh, S. Effect of gypsum application on the quality of irrigation waters. Madras Agric. J. 1967, 59, 646–647. [Google Scholar]
  50. Singh, S.K.; Srivastava, P.K.; Gupta, M.; Mukherjee, S. Modeling mineral phase change chemistry of groundwater in a rural-urban fringe. Water Sci. Technol. 2012, 66, 1502–1510. [Google Scholar] [CrossRef]
  51. Tahri, M.; Benyaich, F.; Bounakhla, M.; Bilal, E.; Gruffat, J.-J.; Moutte, J.; Garcia, D. Multivariate analysis of heavy metal contents in soils, sediments and water in the region of Meknes (central Morocco). Environ. Monit. Assess. 2005, 102, 405–417. [Google Scholar] [CrossRef]
  52. Kaiser, H.F. The application of electronic computers to factor analysis. Educ. Psychol. Meas. 1960, 20, 141–151. [Google Scholar] [CrossRef]
  53. Wåhlin, P.; Berkowicz, R.; Palmgren, F. Characterisation of traffic-generated particulate matter in Copenhagen. Atmos. Environ. 2006, 40, 2151–2159. [Google Scholar] [CrossRef]
  54. Yıldırım, G.; Tokalıoğlu, Ş. Heavy metal speciation in various grain sizes of industrially contaminated street dust using multivariate statistical analysis. Ecotoxicol. Environ. Saf. 2016, 124, 369–376. [Google Scholar] [CrossRef]
  55. Irvine, K.N.; Perrelli, M.F.; Ngoen-Klan, R.; Droppo, I.G. Metal levels in street sediment from an industrial city: Spatial trends, chemical fractionation, and management implications. J. Soils Sediments 2009, 9, 328–341. [Google Scholar] [CrossRef]
  56. Lough, G.C.; Schauer, J.J.; Park, J.-S.; Shafer, M.M.; DeMinter, J.T.; Weinstein, J.P. Emissions of metals associated with motor vehicle roadways. Environ. Sci. Technol. 2005, 39, 826–836. [Google Scholar] [CrossRef]
  57. Mummullage, S.; Egodawatta, P.; Ayoko, G.A.; Goonetilleke, A. Use of physicochemical signatures to assess the sources of metals in urban road dust. Sci. Total Environ. 2016, 541, 1303–1309. [Google Scholar] [CrossRef]
  58. LeGalley, E.; Krekeler, M.P. A mineralogical and geochemical investigation of street sediment near a coal-fired power plant in Hamilton, Ohio: An example of complex pollution and cause for community health concerns. Environ. Pollut. 2013, 176, 26–35. [Google Scholar] [CrossRef] [PubMed]
  59. LeGalley, E.; Widom, E.; Krekeler, M.P.; Kuentz, D.C. Chemical and lead isotope constraints on sources of metal pollution in street sediment and lichens in southwest Ohio. Appl. Geochem. 2013, 32, 195–203. [Google Scholar] [CrossRef]
  60. Ng, O.-H.; Tan, B.C.; Obbard, J.P. Lichens as bioindicators of atmospheric heavy metal pollution in Singapore. Environ. Monit. Assess. 2006, 123, 63–74. [Google Scholar] [CrossRef]
  61. Electric Power Research Institute. Carbon Steel Handbook; Electric Power Research Institute: Palo Alto, CA, USA, 2007; p. 172. [Google Scholar]
  62. Khanlari, Z.V.; Jalali, M. Concentrations and chemical speciation of five heavy metals (Zn, Cd, Ni, Cu, and Pb) in selected agricultural calcareous soils of Hamadan Province, western Iran. Arch. Agron. Soil Sci. 2008, 54, 19–32. [Google Scholar] [CrossRef]
  63. Wong, S.C.; Li, X.D.; Zhang, G.; Qi, S.H.; Min, Y.S. Heavy metals in agricultural soils of the Pearl River Delta, South China. Environ. Pollut. 2002, 119, 33–44. [Google Scholar] [CrossRef] [PubMed] [Green Version]
  64. Yang, Q.W.; Shu, W.S.; Qiu, J.W.; Wang, H.B.; Lan, C.Y. Lead in paddy soils and rice plants and its potential health risk around Lechang Lead/Zinc Mine, Guangdong, China. Environ. Int. 2004, 30, 883–889. [Google Scholar] [CrossRef] [PubMed]
  65. Agbenin, J.O. The distribution and transformation of iron and manganese in soil fractions in a savanna Alfisol under continuous cultivation. Nutr. Cycl. Agroecosyst. 2003, 66, 259–270. [Google Scholar] [CrossRef]
  66. Jalali, M.; Hemati, N. Chemical fractionation of seven heavy metals (Cd, Cu, Fe, Mn, Ni, Pb, and Zn) in selected paddy soils of Iran. Paddy Water Environ. 2013, 11, 299–309. [Google Scholar] [CrossRef]
  67. Lanzano, T.; Bertram, M.; De Palo, M.; Wagner, C.; Zyla, K.; Graedel, T.E. Conservation; Recycling. The contemporary European silver cycle. Resour. Conserv. Recycl. 2006, 46, 27–43. [Google Scholar] [CrossRef]
  68. Horton, L.M.; Mortensen, M.E.; Iossifova, Y.; Wald, M.M.; Burgess, P. What do we know of childhood exposures to metals (arsenic, cadmium, lead, and mercury) in emerging market countries? Int. J. Pediatr. 2013, 2013, 872596. [Google Scholar] [CrossRef] [PubMed]
  69. Rahman, M.S.; Molla, A.H.; Saha, N.; Rahman, A. Study on heavy metals levels and its risk assessment in some edible fishes from Bangshi River, Savar, Dhaka, Bangladesh. Food Chem. 2012, 134, 1847–1854. [Google Scholar] [CrossRef] [PubMed]
  70. Roy, S.; Gupta, S.K.; Prakash, J.; Habib, G.; Baudh, K.; Nasr, M. Ecological and human health risk assessment of heavy metal contamination in road dust in the National Capital Territory (NCT) of Delhi, India. Environ. Sci. Pollut. Res. 2019, 26, 30413–30425. [Google Scholar] [CrossRef]
Figure 1. Location of Han River watershed in the South Korea showing the sampling sites and wastewater treatment facilities (WTFs).
Agronomy 12 03111 g001
Figure 2. Total concentrations and detection frequencies of heavy metals in the Han River watershed.
Agronomy 12 03111 g002
Figure 3. Seasonal cumulative concentrations and mean detection frequencies of heavy metals in the Han River watershed.
Agronomy 12 03111 g003
Figure 4. Concentration and detection frequency of the heavy metals in (a) up-and down streams of the wastewater treatment facilities (WTFs) and (b) rural and urban regions.
Agronomy 12 03111 g004
Figure 5. Water quality assessment for irrigation water (a) sodium absorption ratio (SAR), (b) soluble sodium percentage (SSP), (c) residual sodium carbonate (RSC), and (d) magnesium adsorption ratio (MAR) in Han River watershed.
Agronomy 12 03111 g005
Figure 6. Principal component analysis (PCA) of heavy metals in the Han River watershed.
Agronomy 12 03111 g006
Figure 7. Variation of chronic daily intake (CDI) and hazard quotient (HQ) values for ingestion rate in (a,c) adult and (b,d) children population groups in the Han River watershed.
Agronomy 12 03111 g007
Figure 8. Variation of chronic daily intake (CDI) and hazard quotient (HQ) values for dermal absorption rate in (a,c) adult and (b,d) children population groups in the Han River watershed.
Agronomy 12 03111 g008
Figure 9. Variation of hazard index (HI) values for ingestion and dermal absorption in children (b) and adult (a) population groups in the Han River Watershed.
Agronomy 12 03111 g009
Table 1. Exposure parameters for health risk assessment.
Exposure ParameterDescriptionValue *Unit
AdultsChildren
CiHeavy metal concentration in waterMeasured valuesμg/L
IRIngestion rate20.64L/day
EFExposure frequency350350days/year
EDExposure duration706year
BWBody weight6520kg
ATAverage time25,5502190days
SAExposure skin area18,0006600cm2
* US EPA (2004); WHO (2017).
Table 2. Summary of heavy metal concentrations at each site of the Han River watershed.
SitesAg
(µg L−1)
Cd
(µg L−1)
Cu
(µg L−1)
Mn
(µg L−1)
Ni
(µg L−1)
Pb
(µg L−1)
Zn
(µg L−1)
S-18.2 × 10−21.3 × 10−22.3 × 1003.5 × 1011.2 × 1000.4 × 1001.3 × 101
S-21.6 × 10−11.3 × 10−22.0 × 1003.9 × 1011.1 × 1000.4 × 1004.7 × 100
S-31.4 × 10−22.0 × 10−22.7 × 1003.8 × 1011.3 × 1000.6 × 1001.1 × 101
S-41.4 × 10−21.8 × 10−24.5 × 1001.3 × 1021.6 × 1000.8 × 1001.5 × 101
S-50.7 × 10−21.1 × 10−22.2 × 1001.4 × 1010.6 × 1000.3 × 1008.1 × 100
S-61.1 × 10−21.1 × 10−21.3 × 1001.4 × 1010.7 × 1000.3 × 1005.5 × 100
S-77.3 × 10−21.4 × 10−22.1 × 1003.9 × 1011.0 × 1000.5 × 1005.0 × 100
N-12.7 × 10−21.8 × 10−22.5 × 1002.7 × 1010.9 × 1000.5 × 1007.5 × 100
N-22.4 × 10−21.7 × 10−21.4 × 1001.2 × 1010.7 × 1000.3 × 1003.9 × 100
N-31.4 × 10−21.6 × 10−21.6 × 1001.0 × 1010.7 × 1000.4 × 1004.0 × 100
N-41.1 × 10−22.4 × 10−21.6 × 1011.2 × 1010.8 × 1001.8 × 1007.6 × 100
N-51.0 × 10−20.9 × 10−21.3 × 1001.2 × 1010.5 × 1000.3 × 1001.0 × 101
IH-10.8 × 10−21.8 × 10−22.3 × 1002.7 × 1011.0 × 1000.3 × 1001.4 × 101
IH-23.7 × 10−25.7 × 10−28.7 × 1002.2 × 1022.7 × 1010.8 × 1002.2 × 102
IH-34.6 × 10−21.4 × 10−22.2 × 1002.8 × 1010.7 × 1000.7 × 1007.9 × 100
IH-42.0 × 10−25.2 × 10−24.7 × 1009.3 × 1014.8 × 1002.9 × 1002.0 × 102
H-11.0 × 10−23.5 × 10−26.8 × 1002.0 × 1011.7 × 1010.4 × 1002.6 × 101
H-22.4 × 10−22.7 × 10−23.3 × 1006.0 × 1012.1 × 1000.5 × 1001.9 × 101
H-32.1 × 10−22.4 × 10−23.5 × 1005.5 × 1011.3 × 1000.9 × 1009.7 × 100
H-41.7 × 10−22.7 × 10−27.0 × 1008.3 × 1014.0 × 1001.1 × 1002.7 × 101
H-55.4 × 10−24.8 × 10−24.4 × 1001.0 × 1026.4 × 1001.1 × 1002.4 × 101
H-62.6 × 10−21.7 × 10−25.1 × 1004.8 × 1012.8 × 1001.0 × 1001.7 × 101
H-70.8 × 10−22.7 × 10−22.6 × 1001.7 × 1021.7 × 1000.5 × 1002.1 × 101
H-84.5 × 10−22.0 × 10−23.7 × 1002.0 × 1022.8 × 1001.3 × 1001.1 × 101
A-14.9 × 10−25.0 × 10−24.3 × 1001.2 × 1024.7 × 1001.1 × 1002.3 × 101
Table 3. Principal component factor loading of heavy metals in the Han River watershed.
ComponentPC1PC2PC3
Ni0.9440.0980.053
Zn0.8500.0990.049
Cu0.6620.513-0.083
Pb−0.0230.9430.146
Mn0.4200.6380.030
Ag−0.1550.0390.870
Cd0.4150.1220.598
Eigenvalues2.4261.5951.148
% of variance34.65322.79216.399
Cumulative variance %34.65357.44573.844
Publisher’s Note: MDPI stays neutral with regard to jurisdictional claims in published maps and institutional affiliations.

