
Combined Physio-Biochemical and Transcriptome Analyses Illuminate the Resistance Response of Rice Priming with Decoyinine against Nilaparvata lugens


 ,
,  and
and 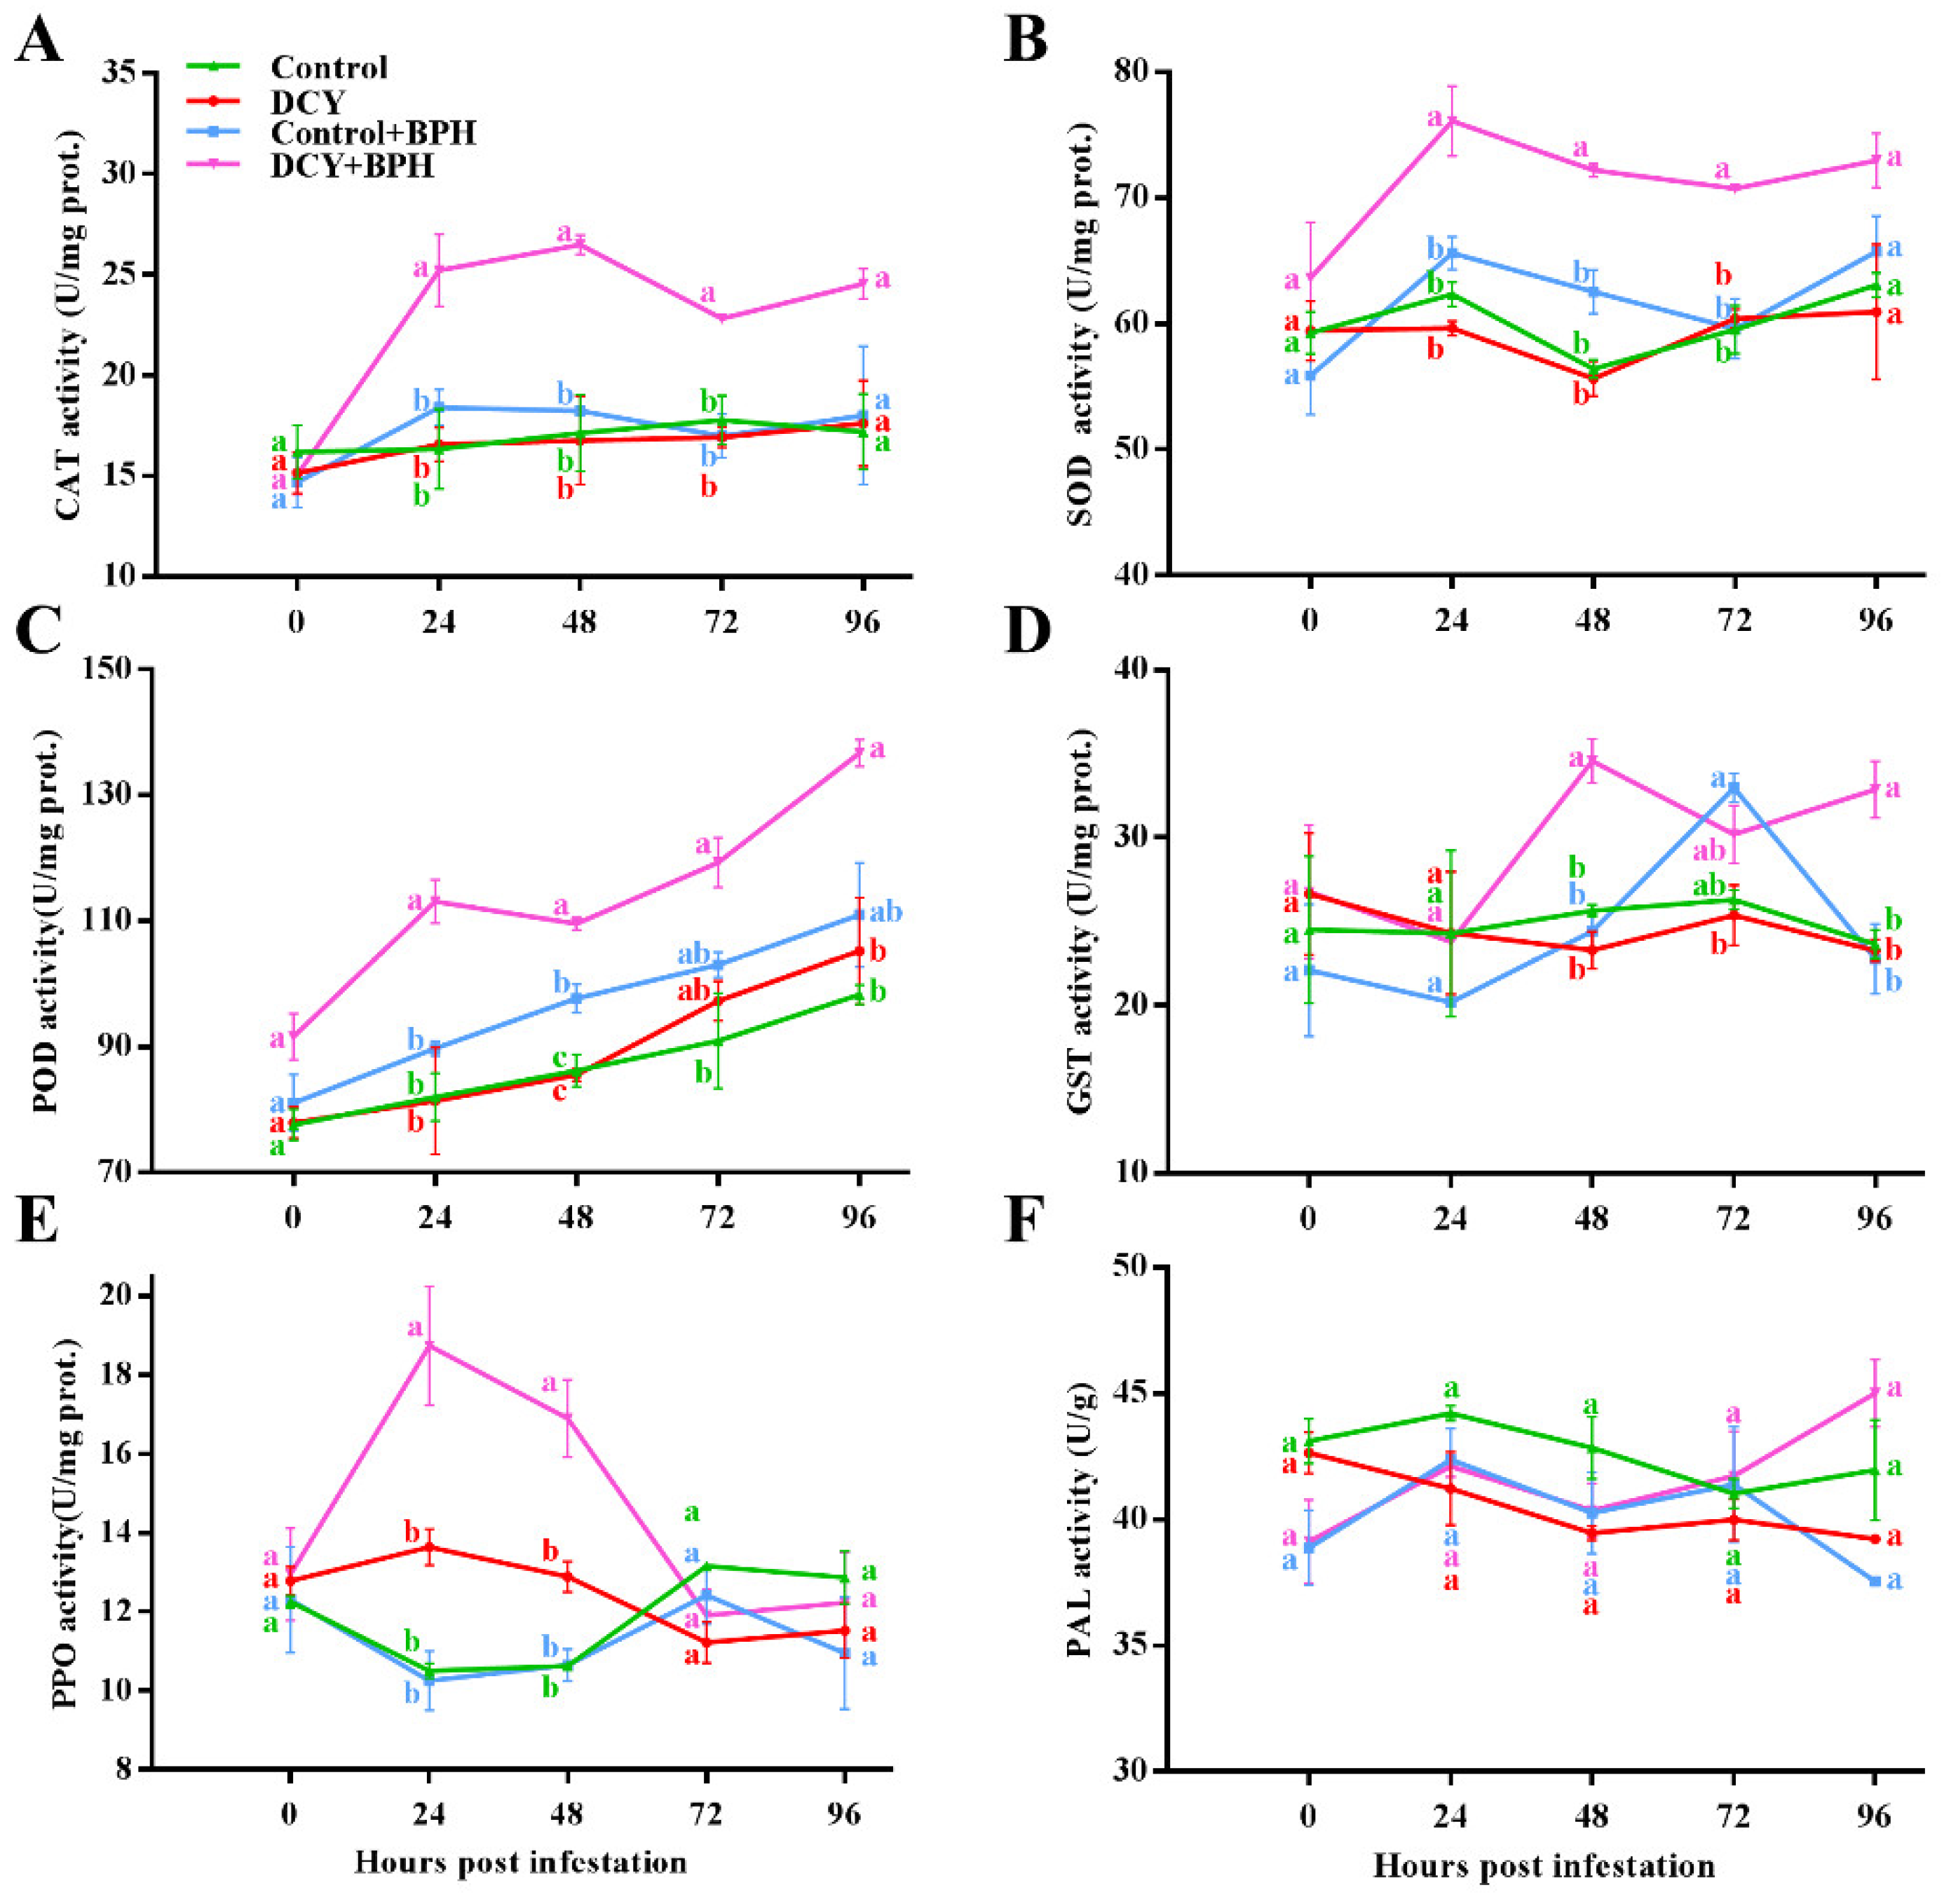
Abstract
:1. Introduction
2. Materials and Methods
2.1. Insect
2.2. Plant and Insect Treatments
2.3. Assay of Defense-Related Enzyme Activity
2.4. Measurements of MDA, H2O2, Sugars, Free Amino Acids, Flavonoid, and Callose Content
2.5. Rice RNA Library Construction, Sequencing, and Mapping
2.6. Analysis of Differential Expressed Genes (DEGs)
2.7. Gene Ontology (GO) and KEGG Enrichment Analysis
2.8. Quantitative Real-Time PCR Analysis
2.9. Statistical Analysis
3. Results
3.1. Responses of Defense-Related Enzyme to BPH Infestation
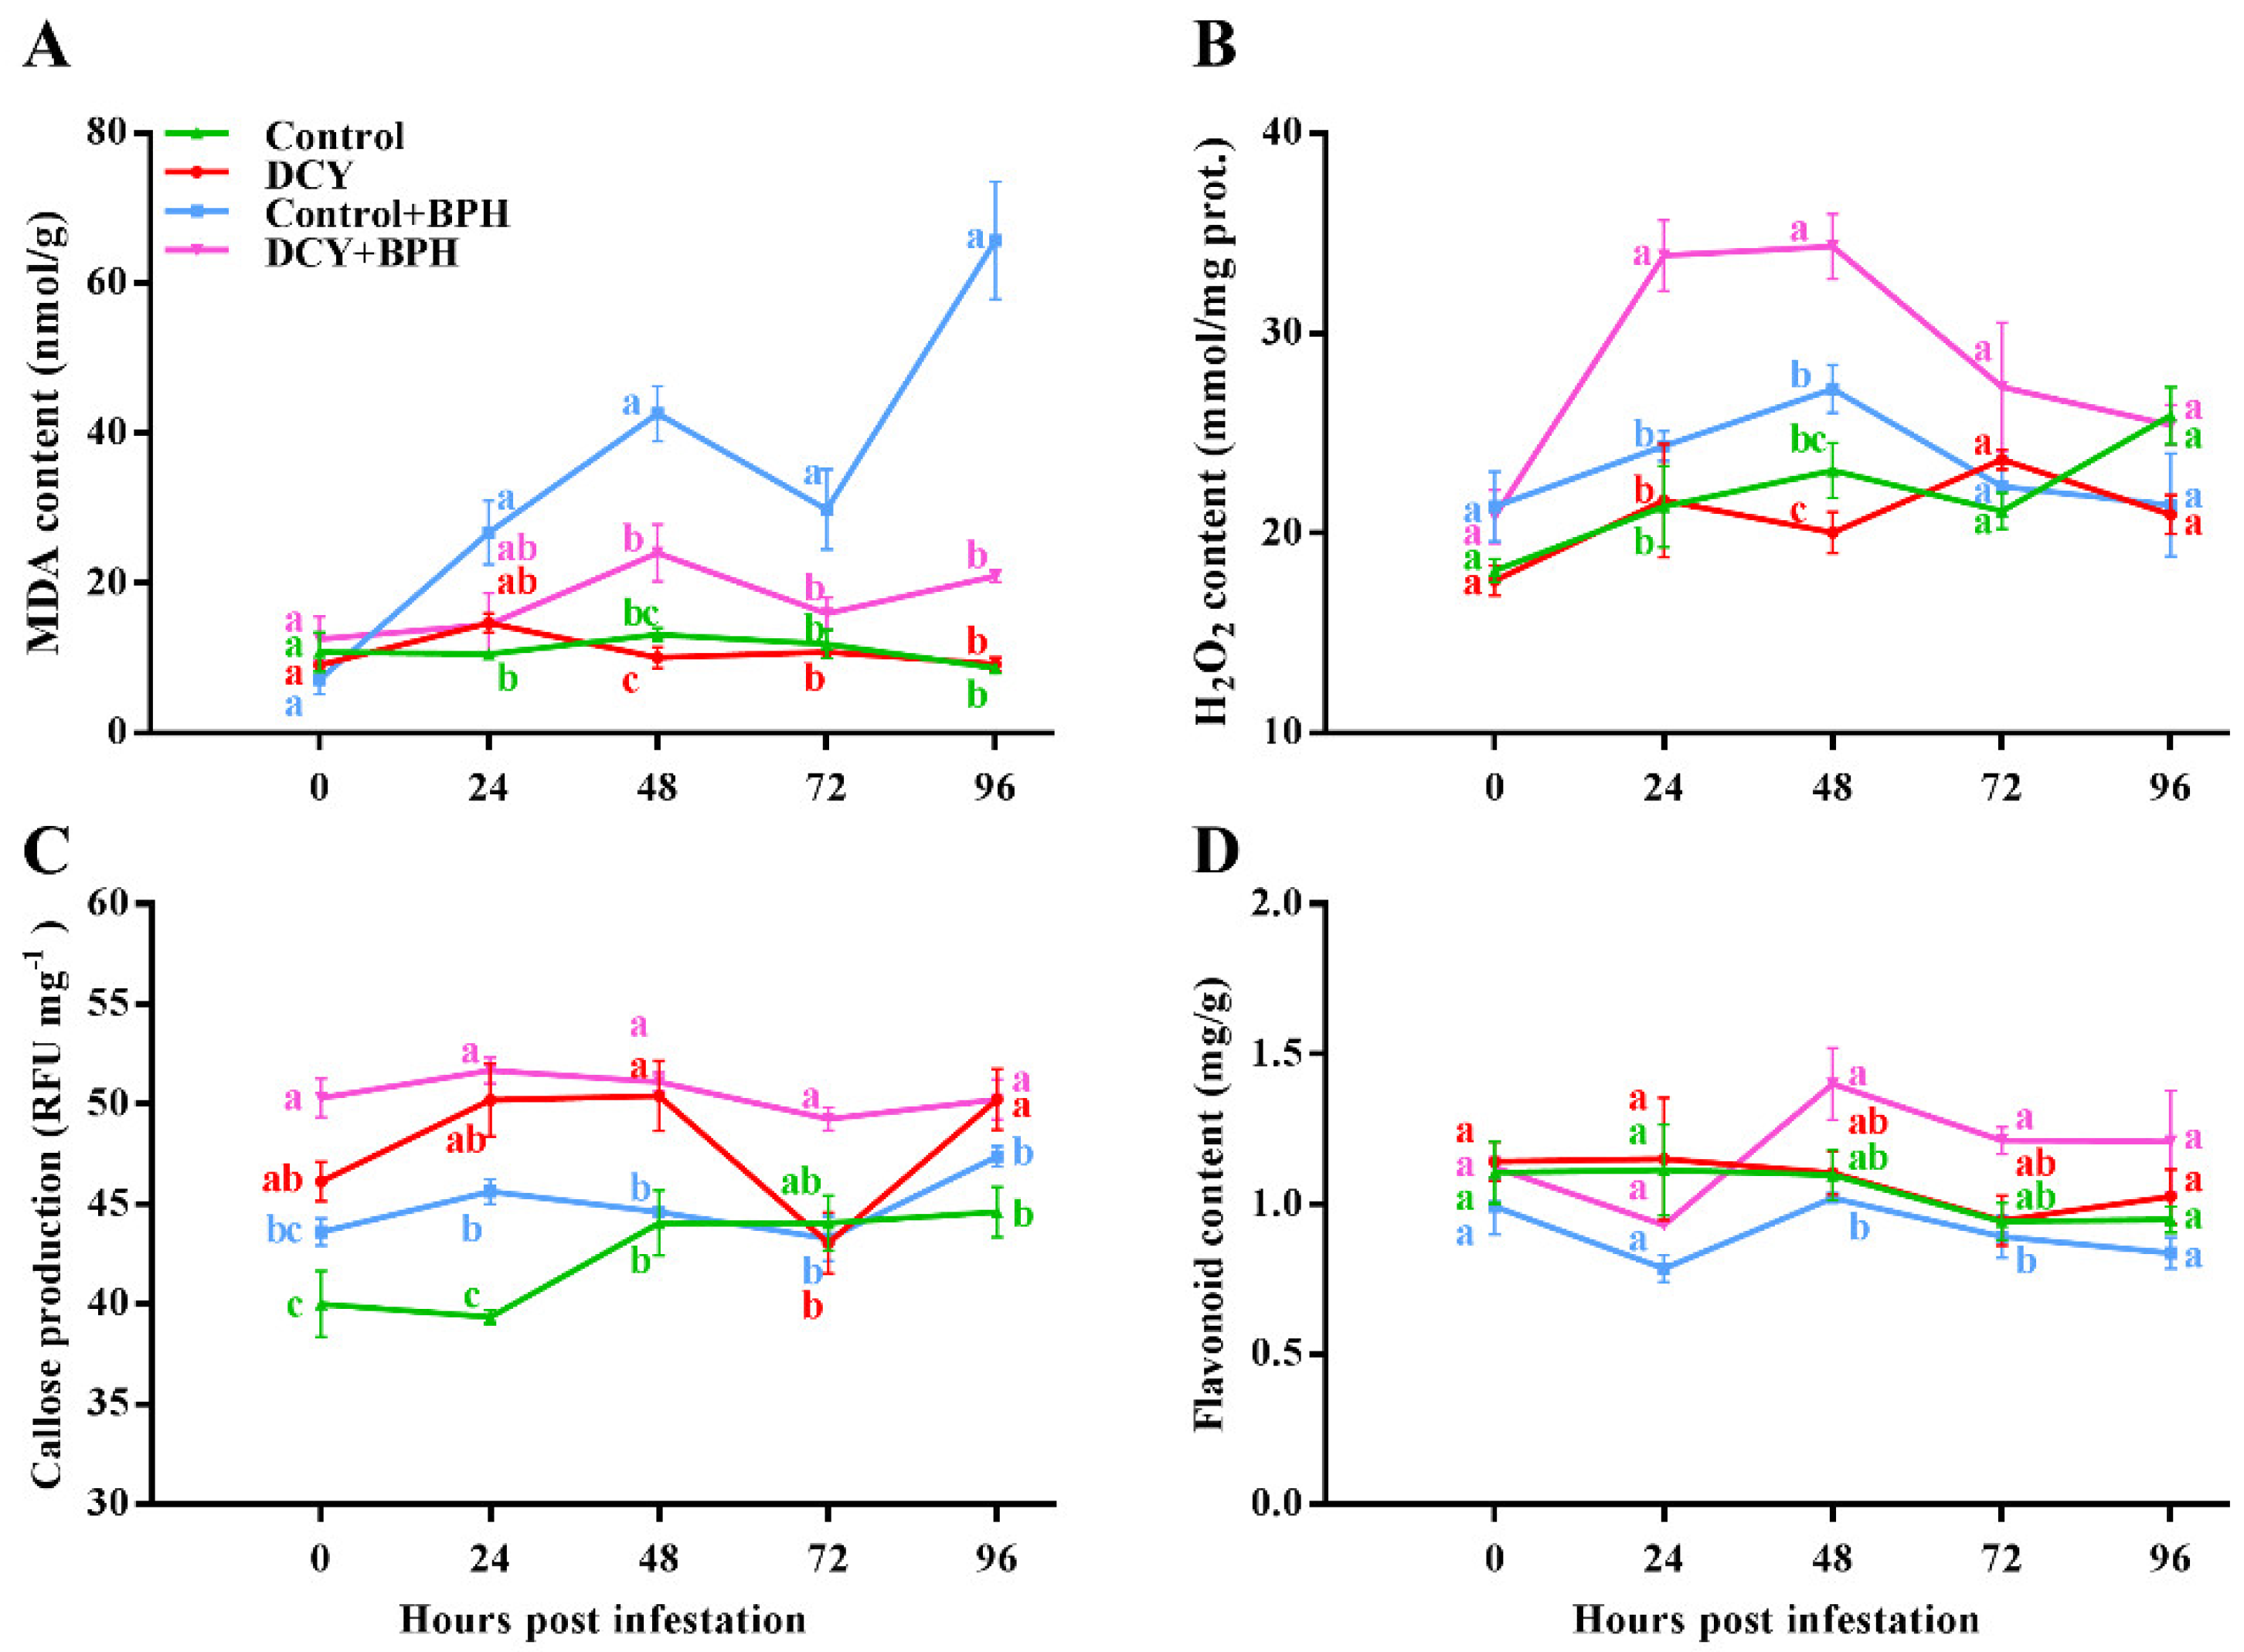
3.2. Responses of Defense-Related Compounds to BPH Infestation
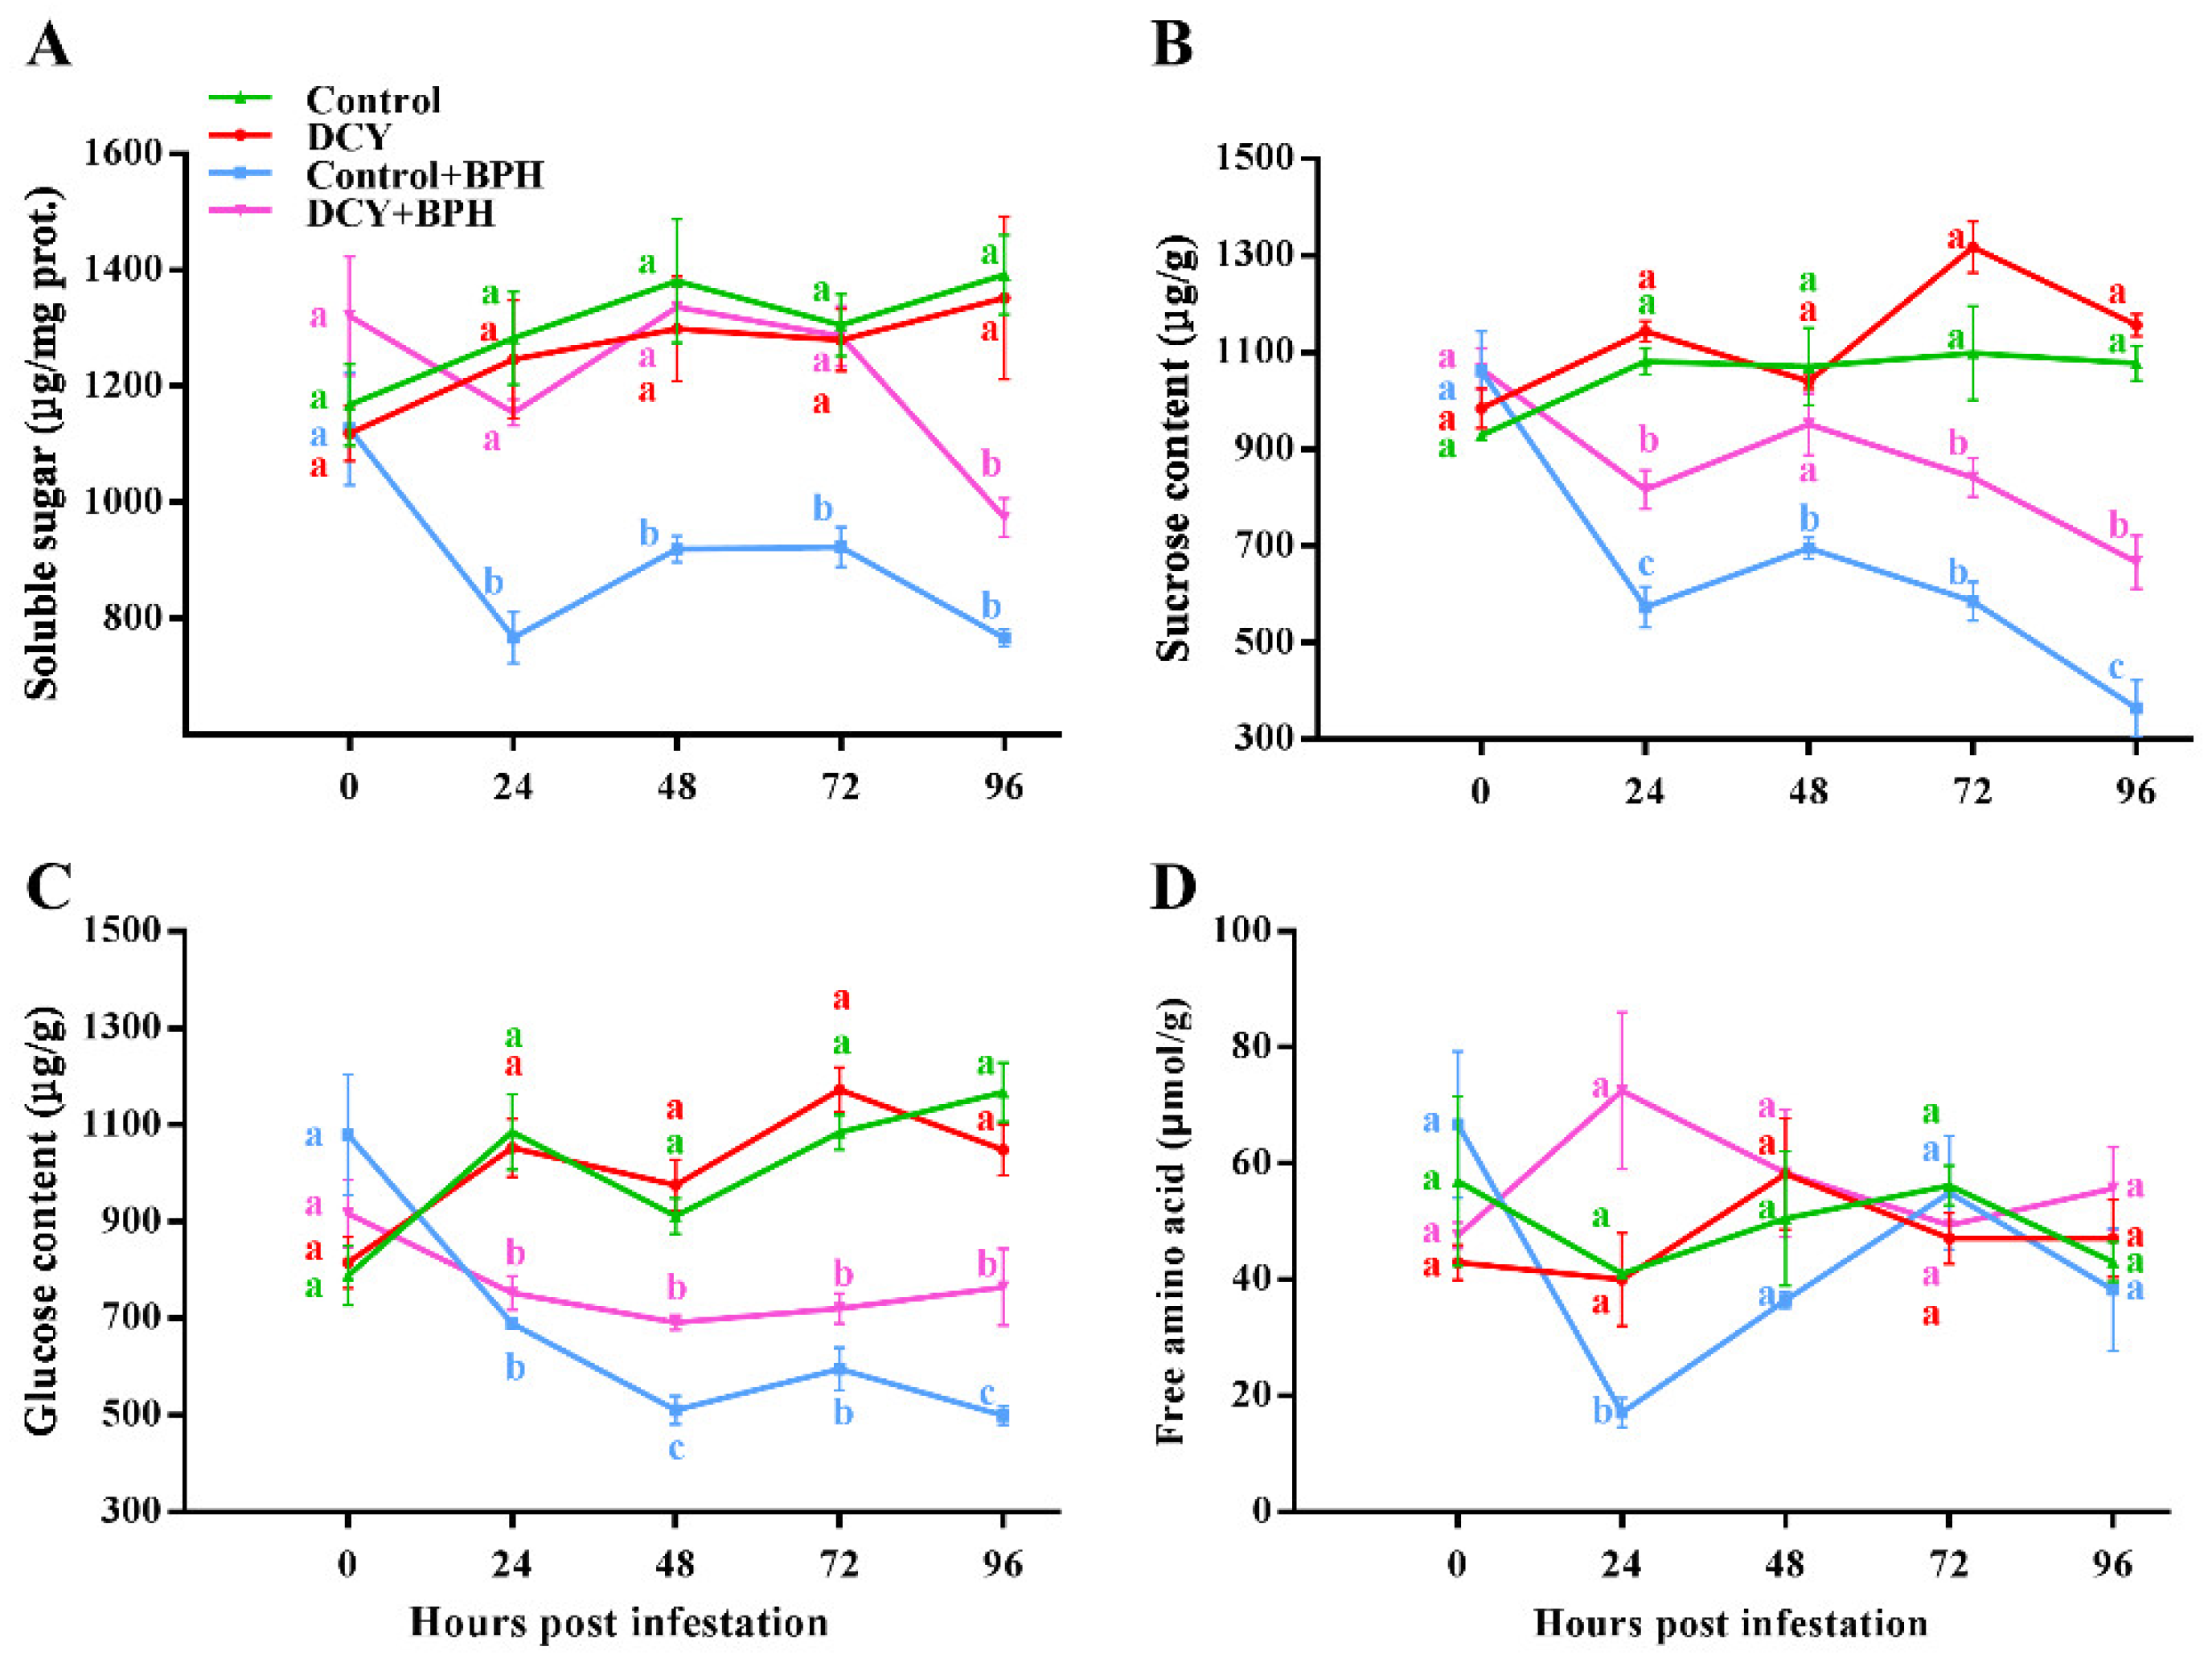
3.3. Responses of Nutrient Contents to BPH Infestation
3.4. Illumina Sequencing and Mapping of Reads
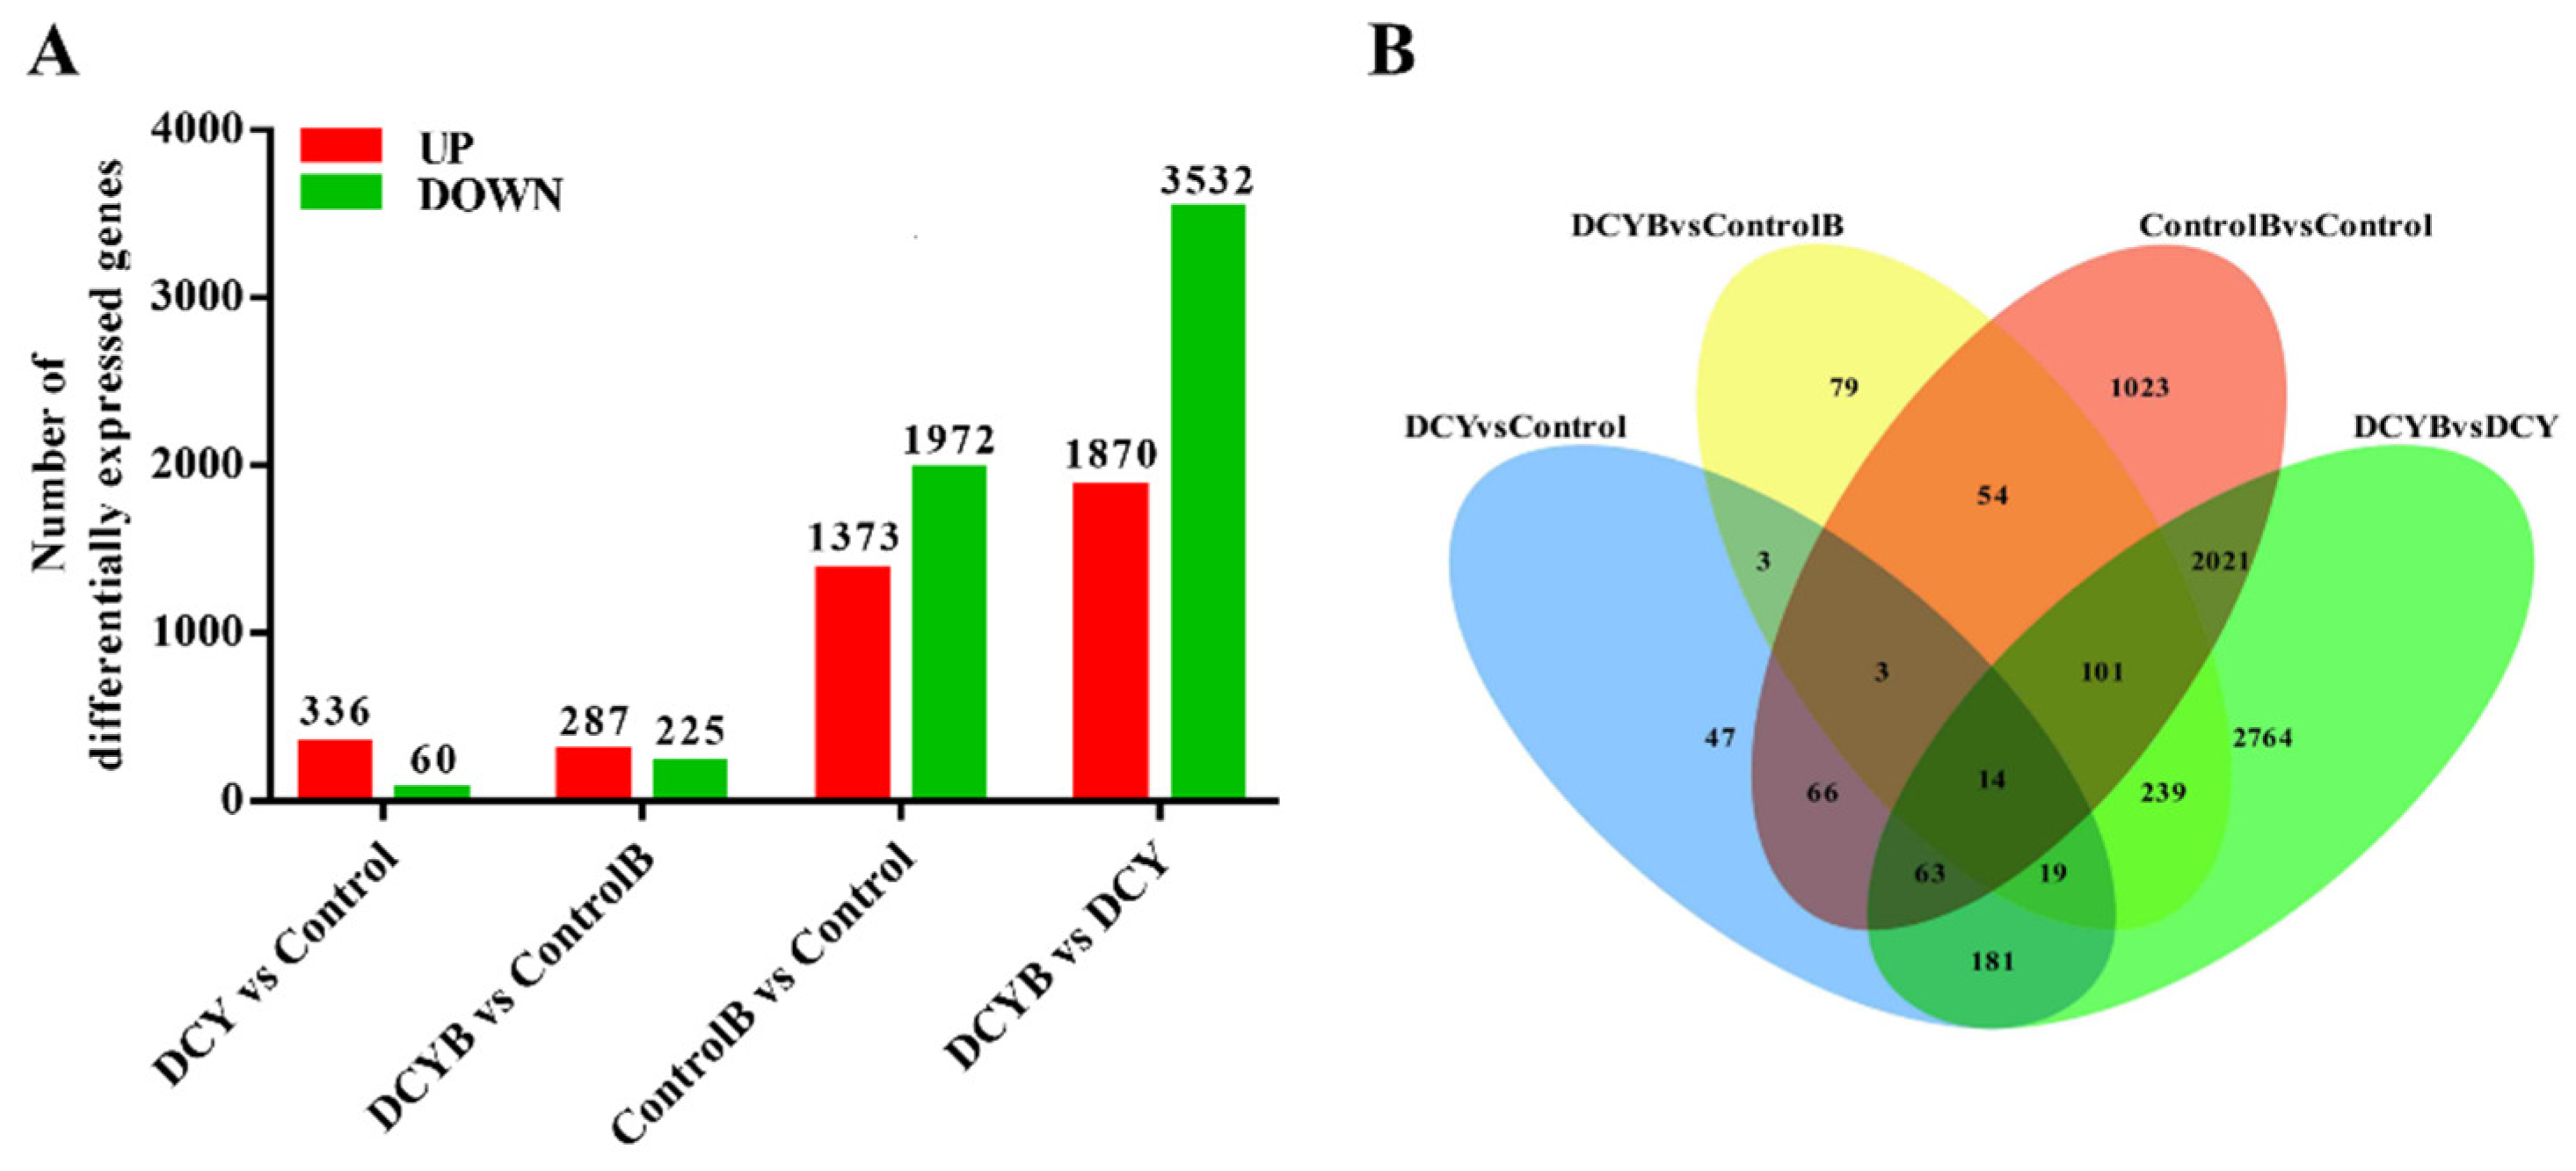
3.5. Transcriptome Analysis of Rice Treated with DCY in Response to BPH Infestation
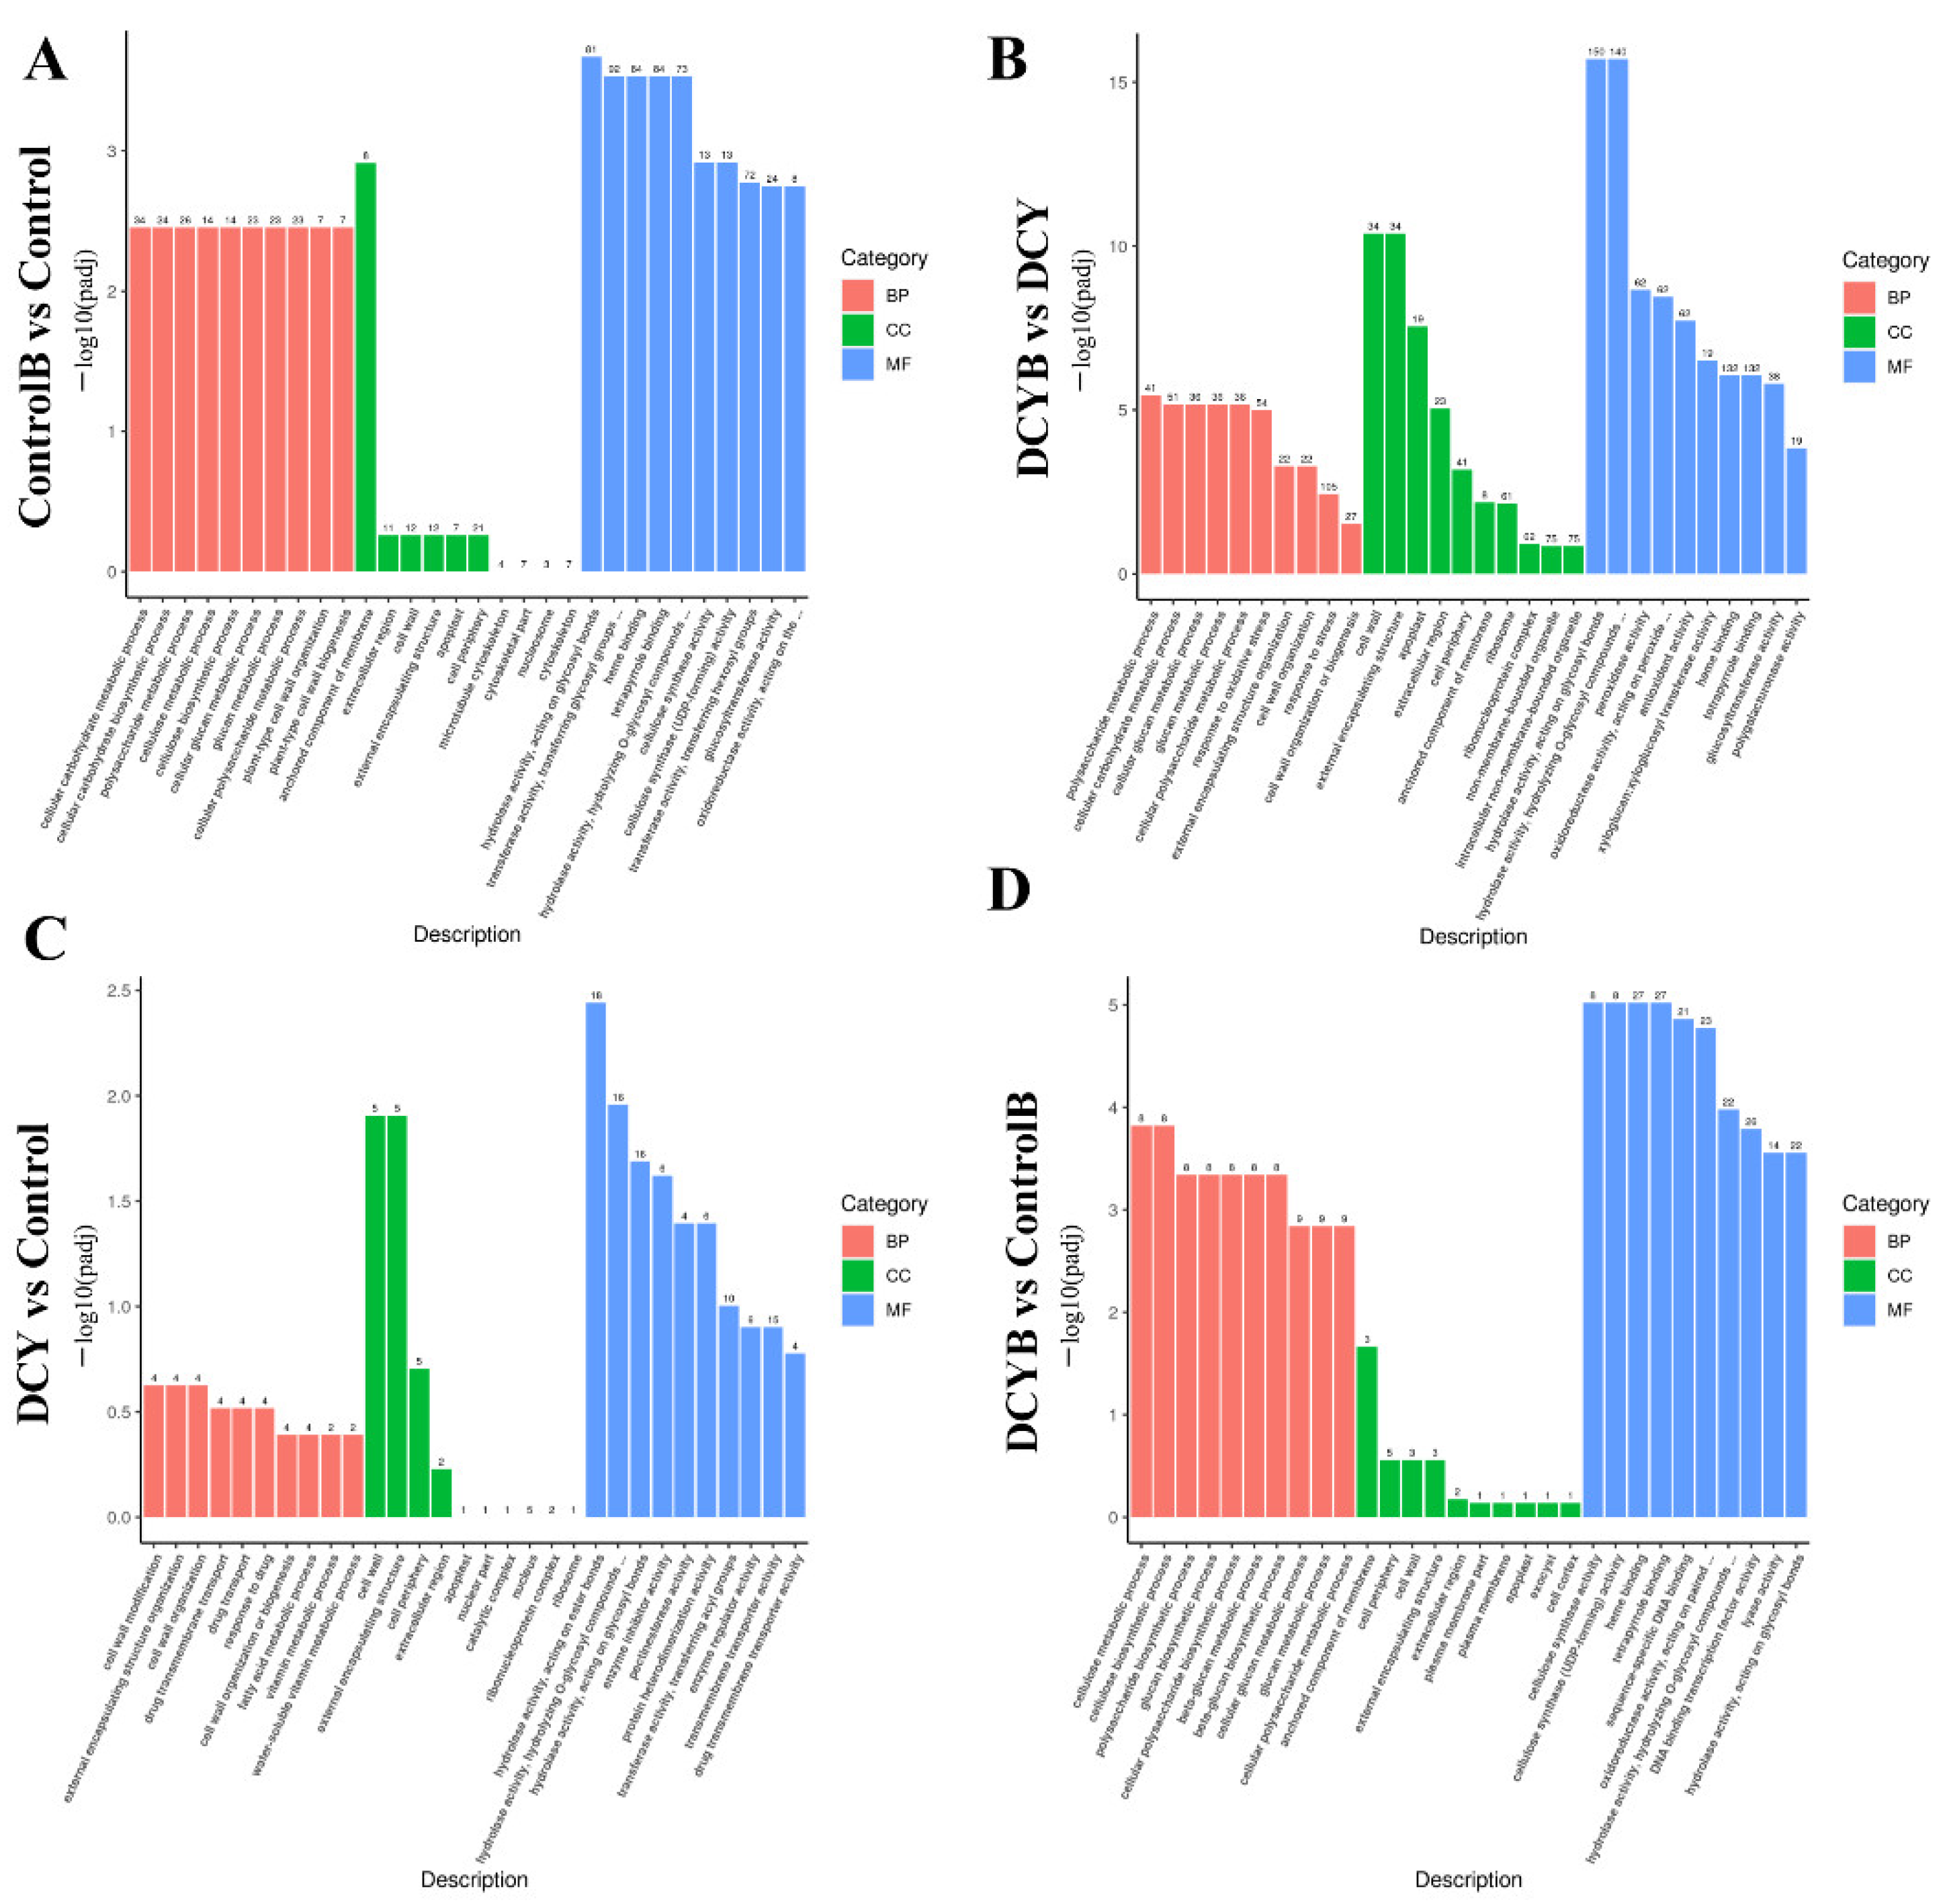
3.6. GO Function Annotation Analysis of DEGs
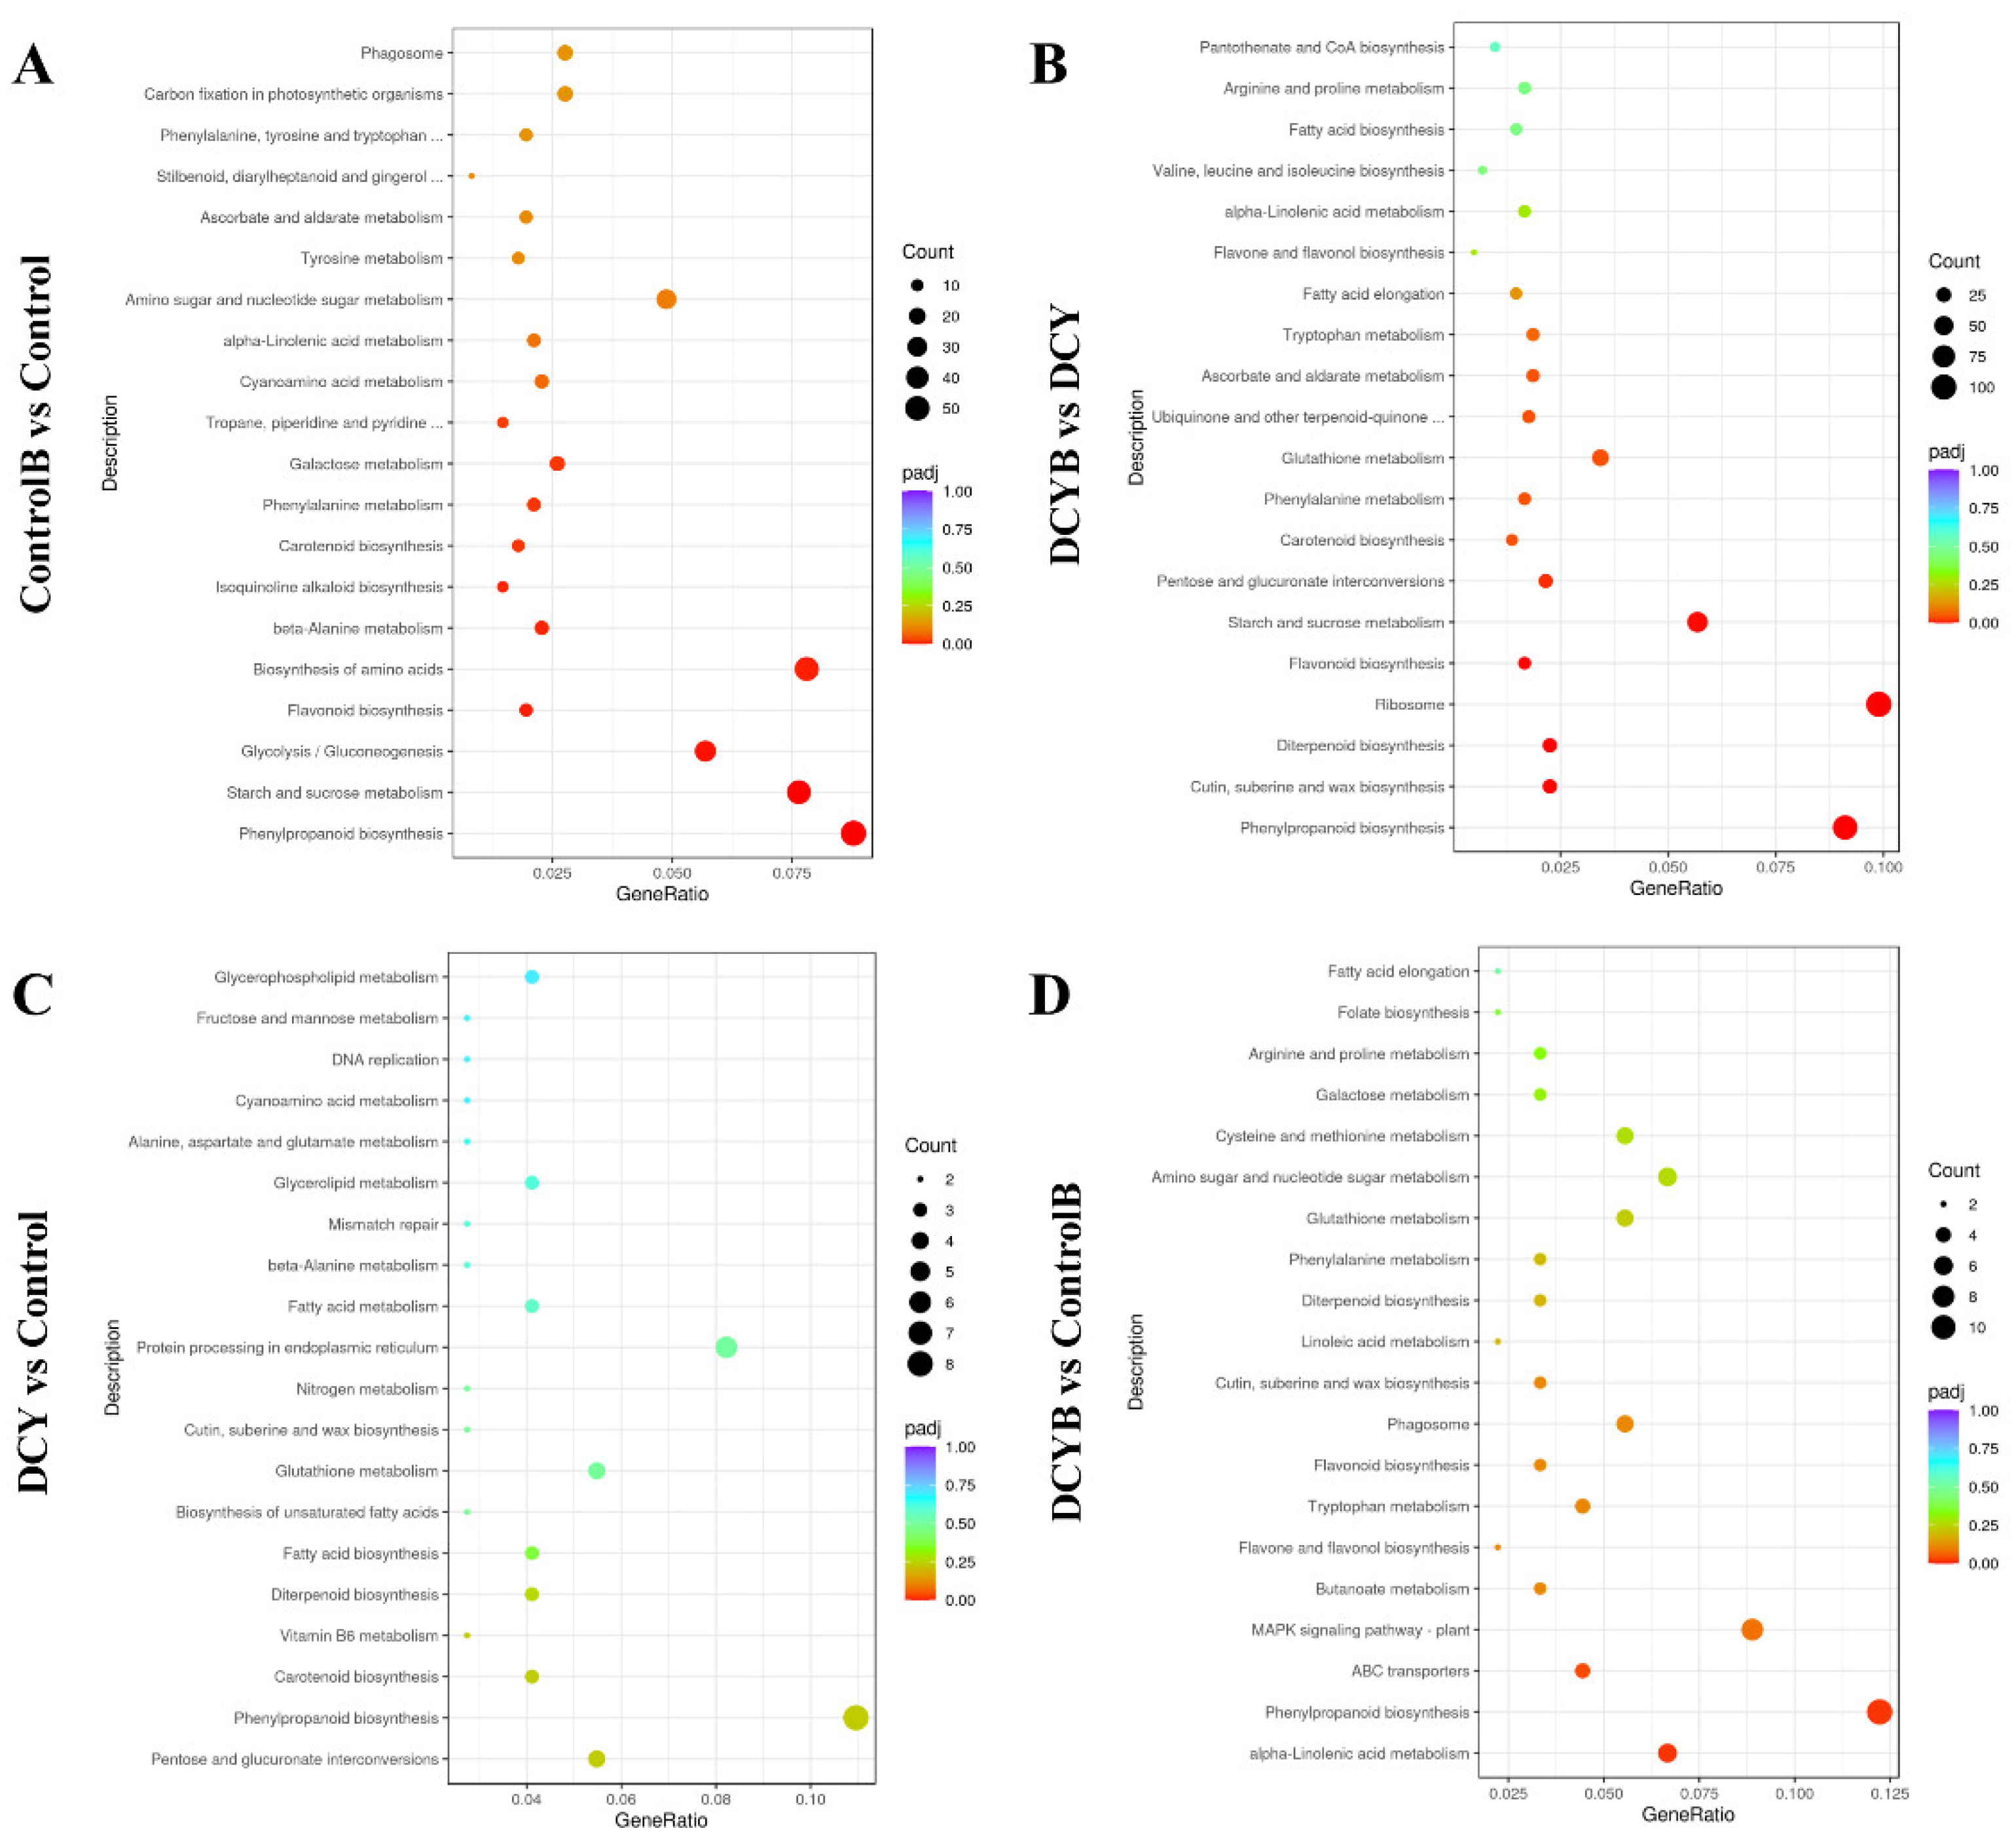
3.7. KEGG Pathway Enrichment Analysis of DEGs
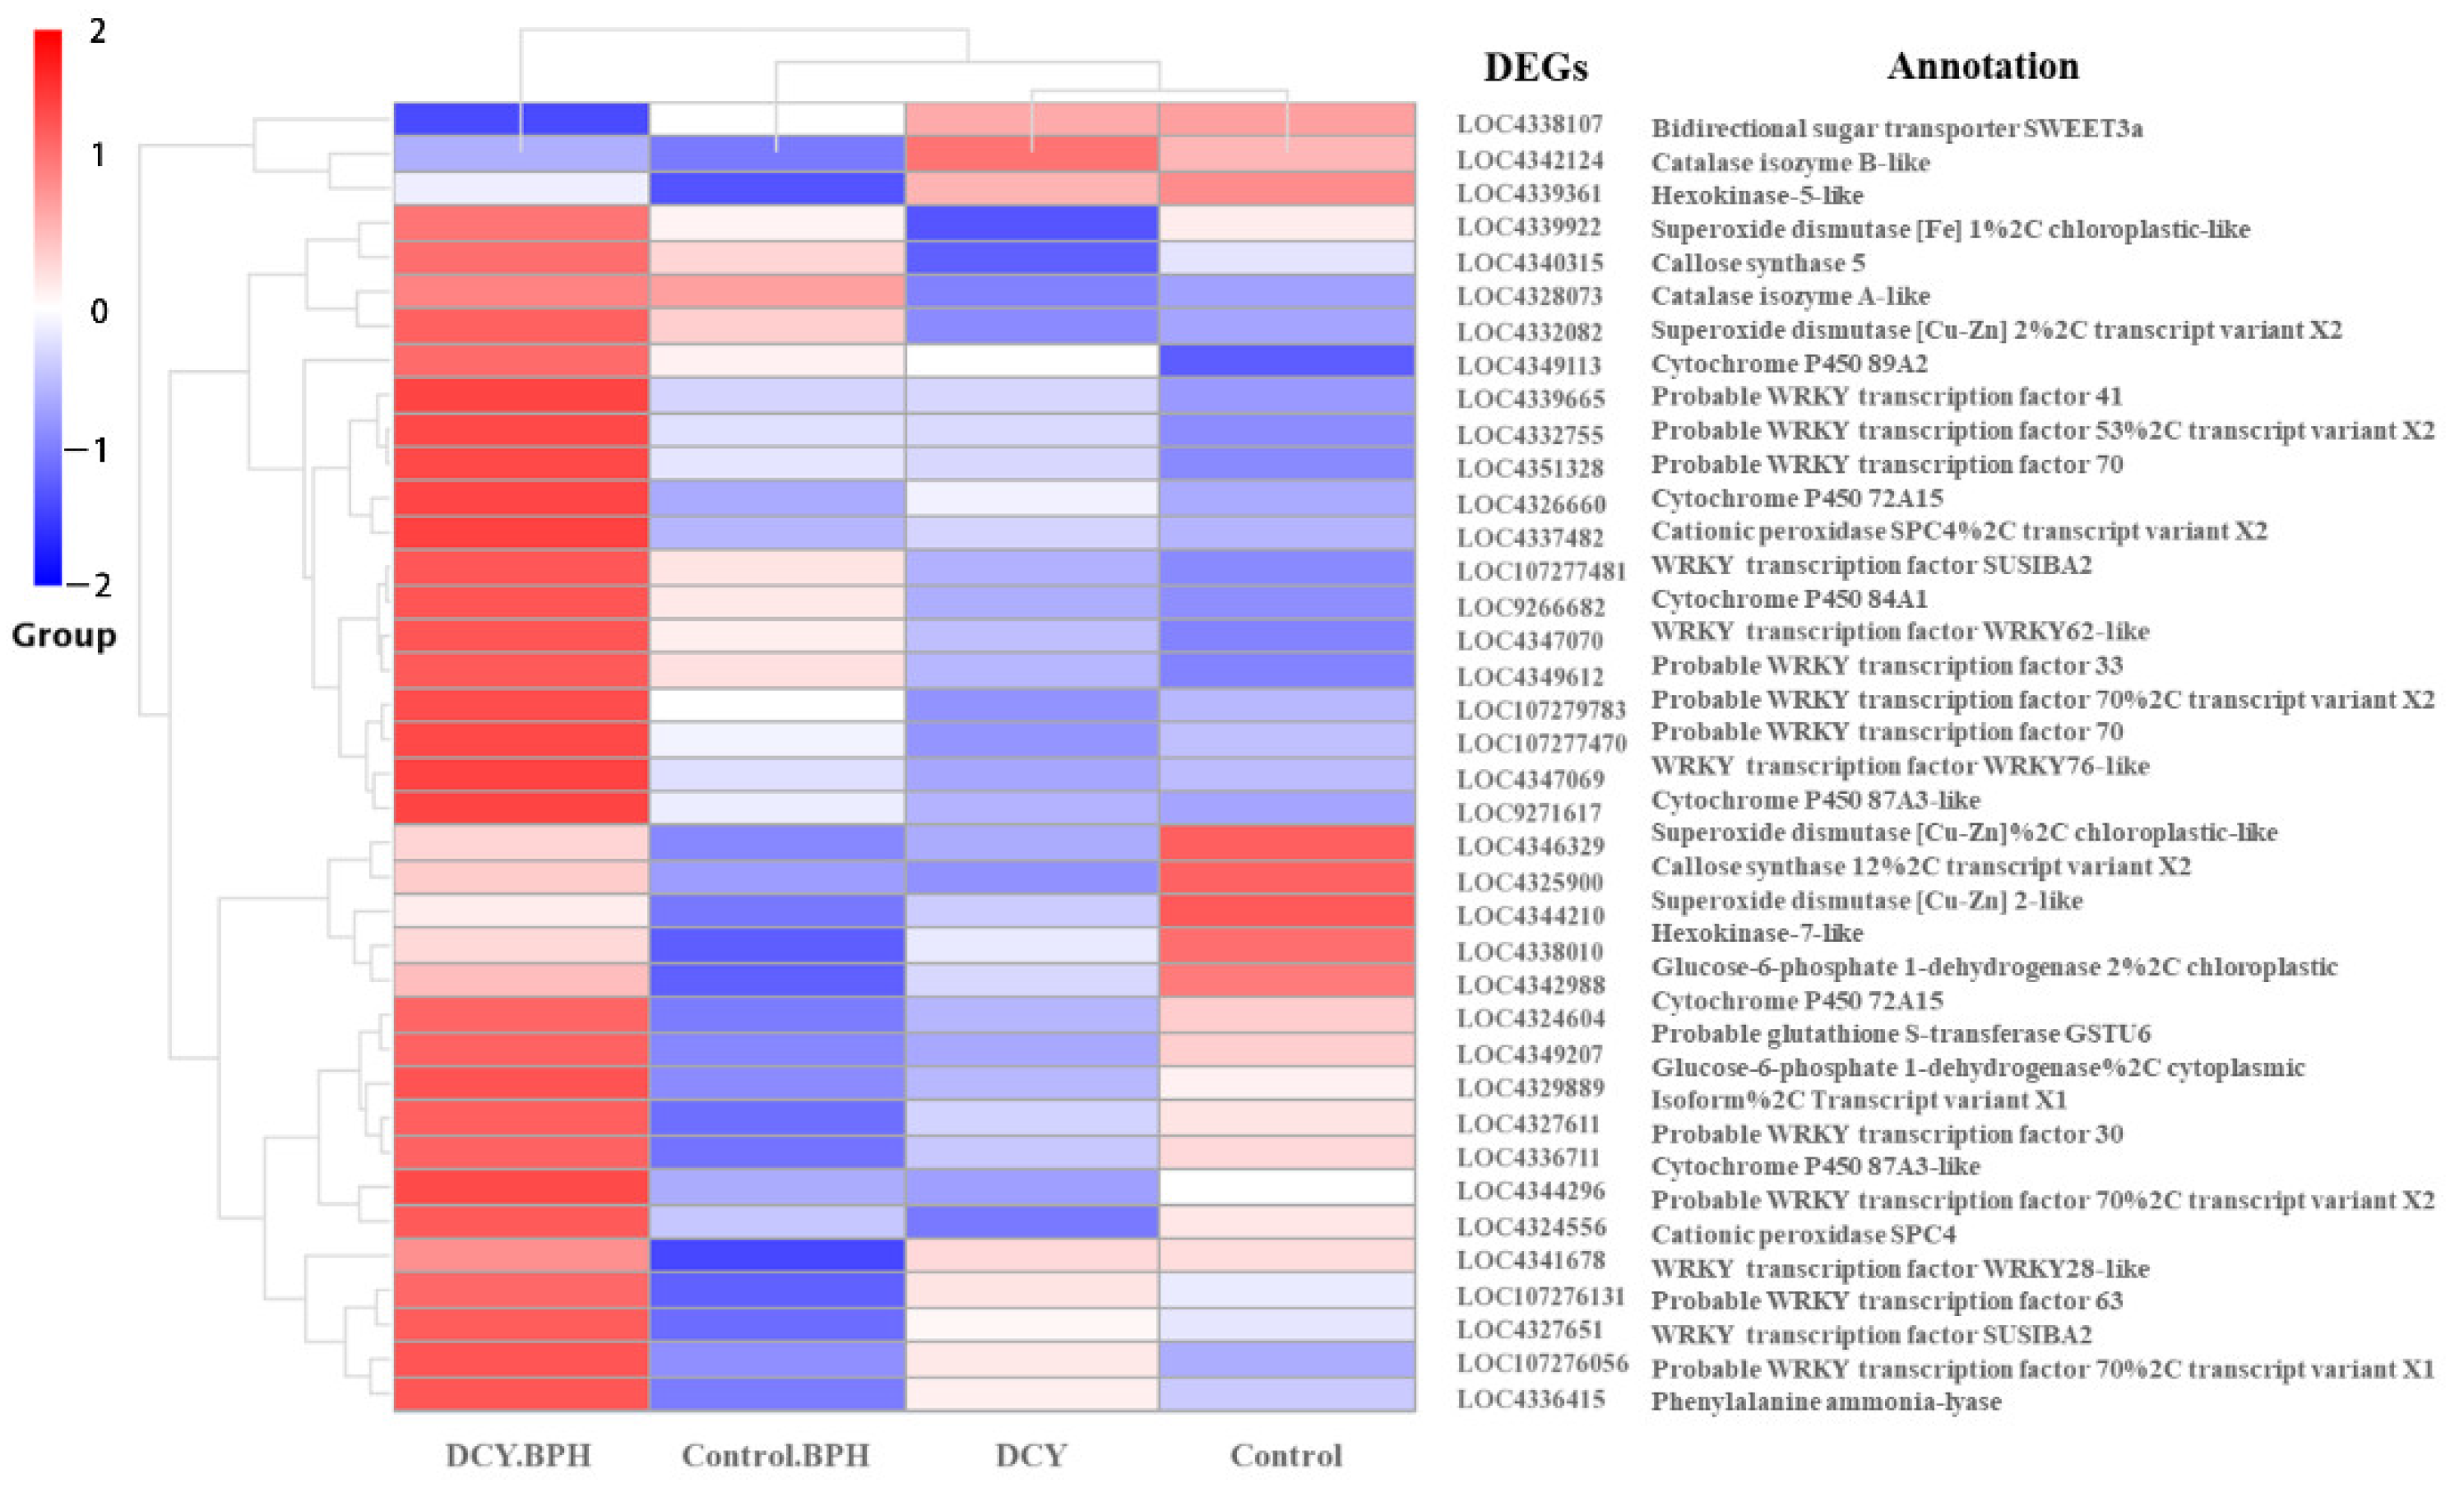
3.8. Representative Pathway DEGs Response to DCY and BPH Infestation in Rice
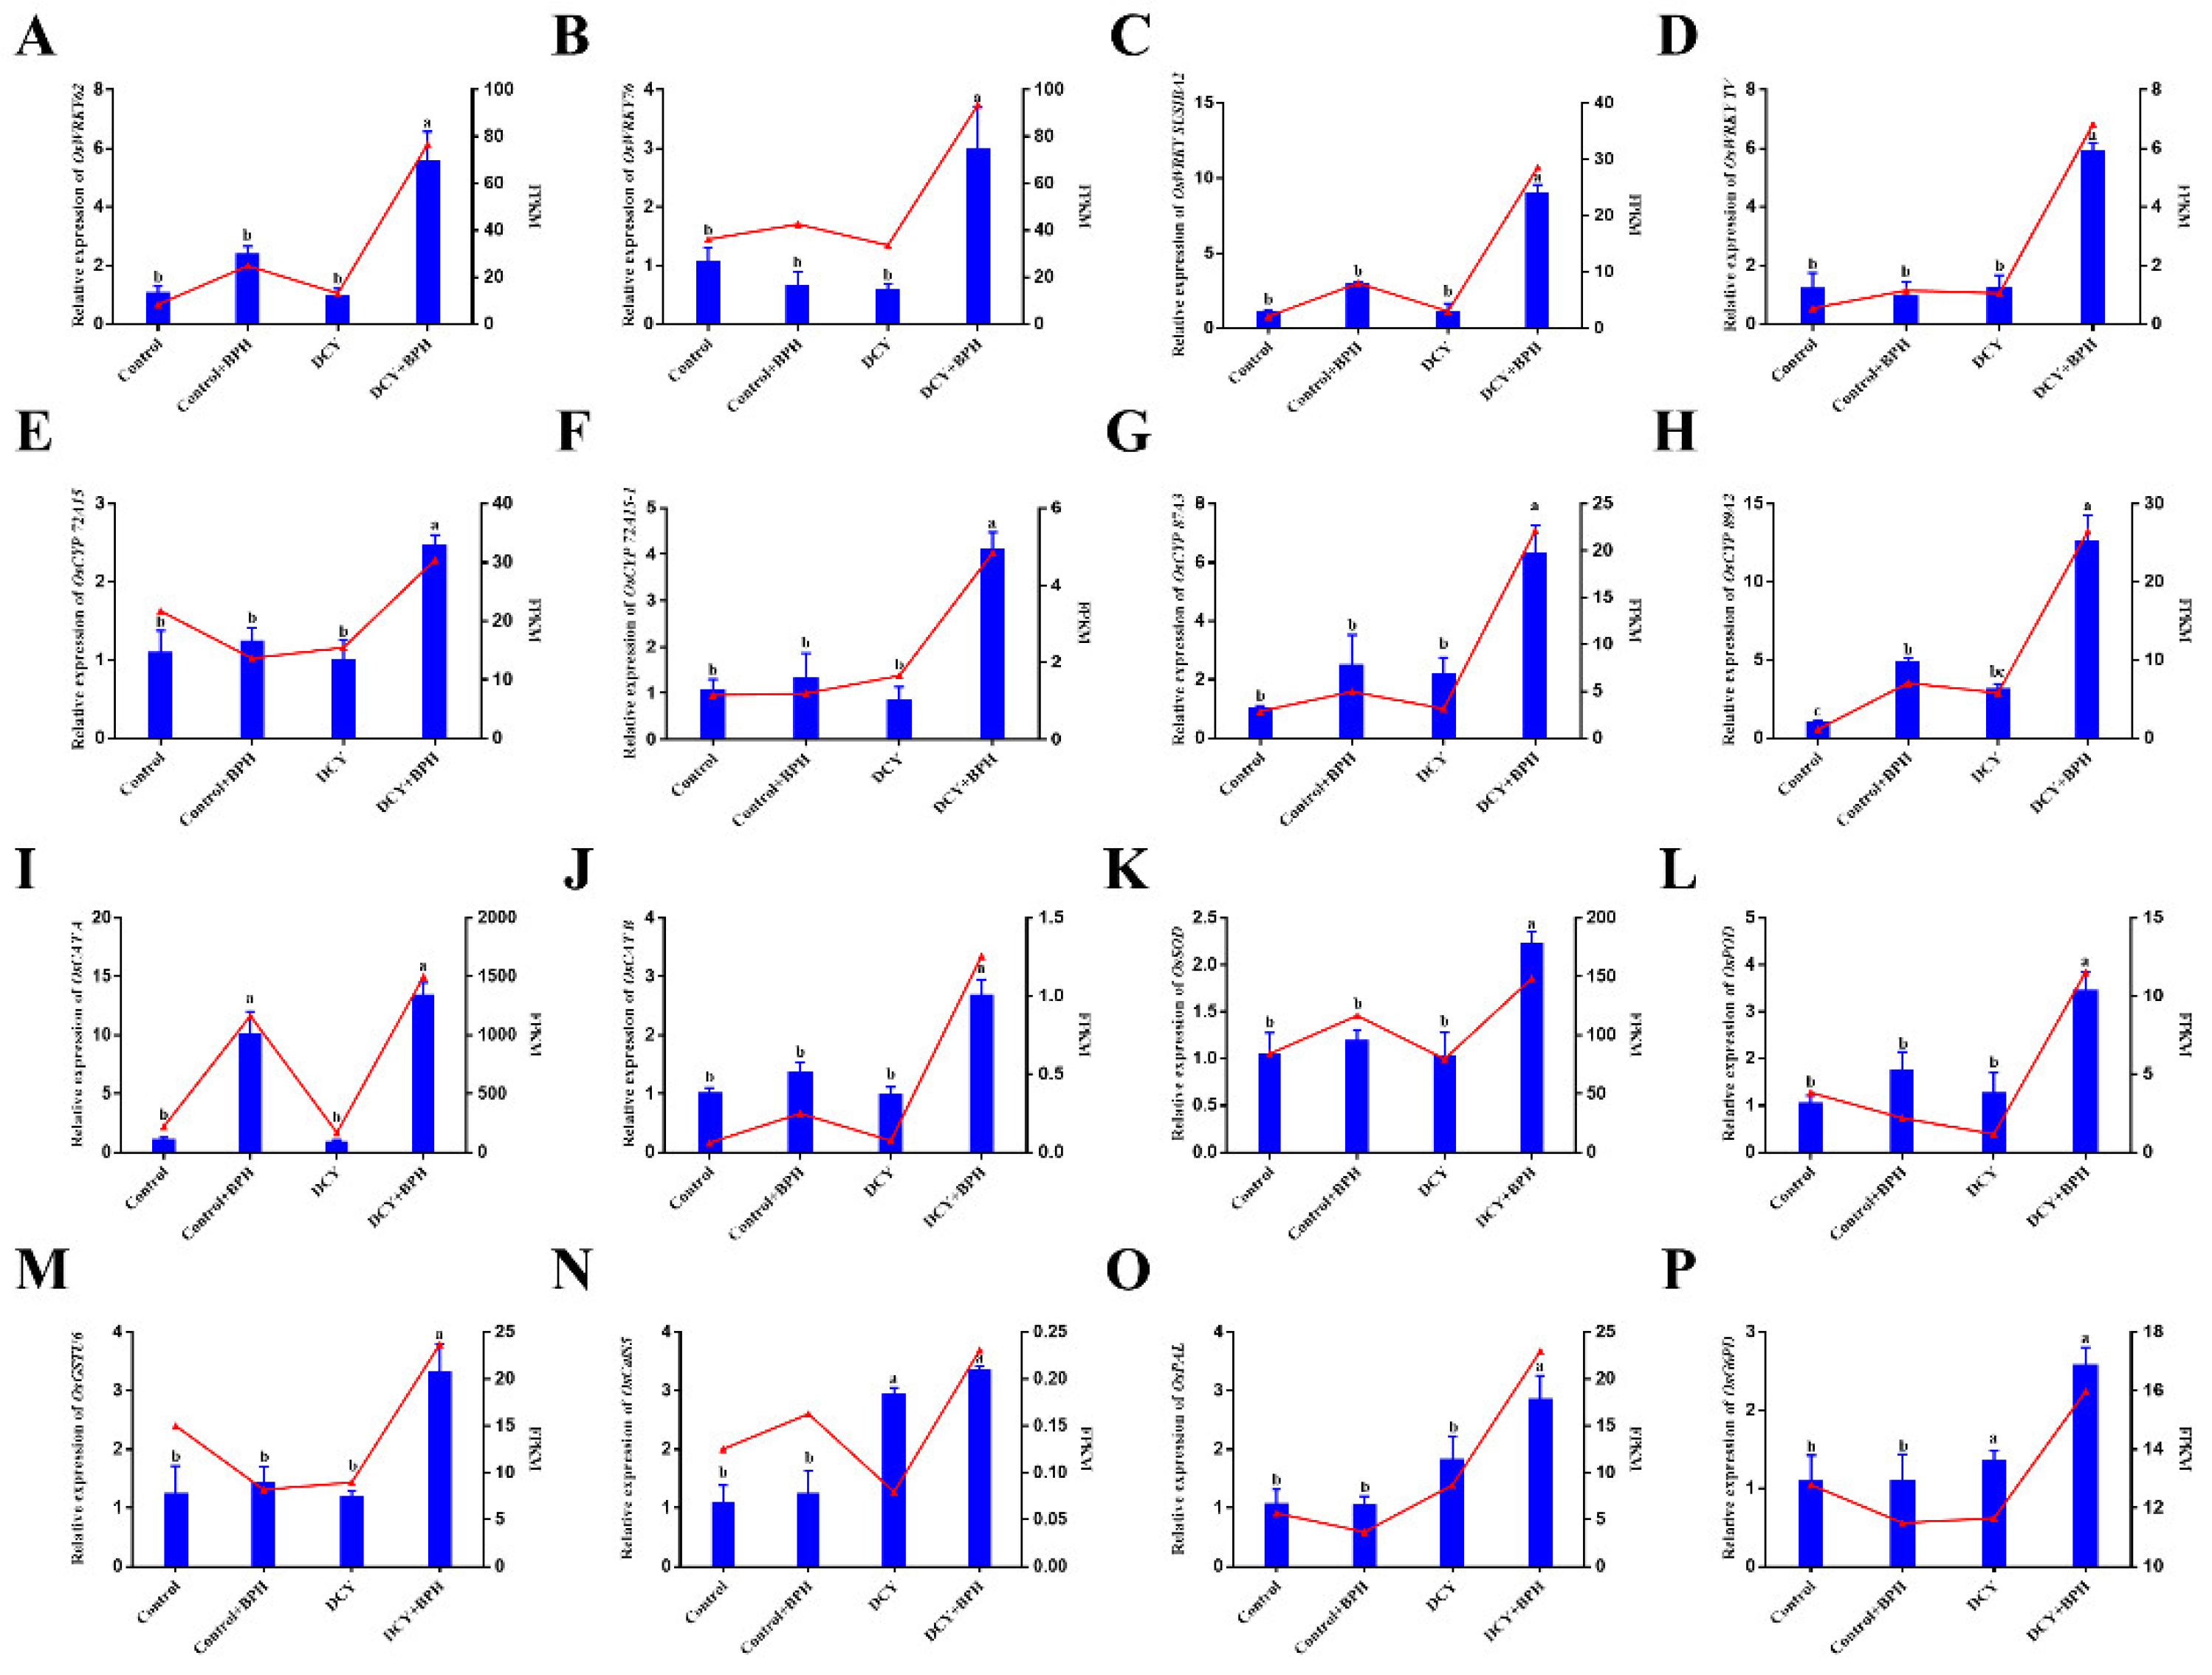
3.9. Validation of DEGs by qRT-PCR
4. Discussion
5. Conclusions
Supplementary Materials
Author Contributions
Funding
Data Availability Statement
Conflicts of Interest
References
- Wing, R.A.; Purugganan, M.D.; Zhang, Q. The rice genome revolution: From an ancient grain to Green Super Rice. Nat. Rev. Genet. 2018, 19, 505–517. [Google Scholar] [CrossRef] [PubMed]
- Fukagawa, N.K.; Ziska, L.H. Rice: Importance for global nutrition. J. Nutr. Sci. Vitaminol. 2019, 65, S2–S3. [Google Scholar] [CrossRef] [PubMed] [Green Version]
- Savary, S.; Willocquet, L.; Elazegui, F.A.; Castilla, N.P.; Teng, P.S. Rice pest constraints in tropical Asia: Quantification of yield losses due to rice pests in a range of production situations. Plant Dis. 2000, 84, 357–369. [Google Scholar] [CrossRef] [PubMed] [Green Version]
- Chen, H.; Lin, Y.; Zhang, Q. Review and prospect of transgenic rice research. Chin. Sci. Bull. 2009, 54, 4049–4068. [Google Scholar] [CrossRef]
- Ali, M.P.; Bari, M.N.; Haque, S.S.; Kabir, M.M.M.; Afrin, S.; Nowrin, F.; Islam, M.S.; Landis, D.A. Establishing next-generation pest control services in rice fields: Eco-agriculture. Sci. Rep. 2019, 9, 10180. [Google Scholar] [CrossRef] [Green Version]
- Li, Y.; Cheah, B.H.; Fang, Y.F.; Kuang, Y.H.; Lin, S.C.; Liao, C.T.; Huang, S.H.; Lin, F.Y.; Chuang, W.P. Transcriptomics identifies key defense mechanisms in rice resistant to both leaf-feeding and phloem feeding herbivores. BMC Plant Biol. 2021, 21, 306. [Google Scholar] [CrossRef]
- Sun, Z.; Shi, J.H.; Fan, T.; Wang, C.; Liu, L.; Jin, H.; Foba, C.N.; Wang, M.Q. The control of the brown planthopper by the rice Bph14 gene is affected by nitrogen. Pest Manag. Sci. 2020, 76, 3649–3656. [Google Scholar] [CrossRef]
- Huan, N.H.; Heong, K.L. Rice grassy stunt virus disease outbreak in the Mekong Delta. Int. Rice Res. Notes 2000, 25, 35–36. [Google Scholar]
- Wang, H.; Xu, D.; Pu, L.; Zhou, G. Southern rice black-streaked dwarf virus alters insect vectors’ host orientation preferences to enhance spread and increase rice ragged stunt virus co-infection. Phytopathology 2014, 104, 196–201. [Google Scholar] [CrossRef] [Green Version]
- Veres, A.; Wyckhuys, K.A.; Kiss, J.; Tóth, F.; Burgio, G.; Pons, X.; Avilla, C.; Vidal, S.; Razinger, J.; Bazok, R.; et al. An update of the Worldwide Integrated Assessment (WIA) on systemic pesticides. Part 4: Alternatives in major cropping systems. Environ. Sci. Pollut. Res. 2020, 27, 29867–29899. [Google Scholar] [CrossRef]
- Lengai, G.M.; Muthomi, J.W. Biopesticides and their role in sustainable agricultural production. J. Biosci. Med. 2018, 6, 7–41. [Google Scholar] [CrossRef]
- Rajput, V.S.; Jhala, J.; Acharya, V.S. Biopesticides and their mode of action against insect pests: A review. Int. J. Chem. Stud. 2020, 8, 2856–2862. [Google Scholar] [CrossRef]
- Samada, L.H.; Tambunan, U.S.F. Biopesticides as promising alternatives to chemical pesticides: A review of their current and future status. Online J. Biol. Sci. 2020, 20, 66–76. [Google Scholar] [CrossRef]
- Vurukonda, S.S.K.P.; Giovanardi, D.; Stefani, E. Plant growth promoting and biocontrol activity of Streptomyces spp. as endophytes. Int. J. Mol. Sci. 2018, 19, 952. [Google Scholar] [CrossRef] [Green Version]
- Yuntsen, H.; Yonehara, H.; Ui, H. Studies on a new antibiotic, angustmycin. I. J. Antibiot. 1954, 7, 113–115. [Google Scholar]
- Sakai, H.; Yuntsen, H.; Ishikawa, F. Studies on a new antibiotic, angustmycin. J. Antibiot. 1954, 7, 116–119. [Google Scholar]
- Ma, C.; Zhang, Y.; Gui, W.; Zhang, Q.; Xu, G.; Yang, G. Priming of rice seed with decoyinine enhances resistance against the brown planthopper Nilparvata lugens. Crop Prot. 2022, 157, 105970. [Google Scholar] [CrossRef]
- Shah, A.Z.; Ma, C.; Zhang, Y.; Zhang, Q.; Xu, G.; Yang, G. Decoyinine induced resistance in rice against small brown planthopper Laodelphax striatellus. Insects 2022, 13, 104. [Google Scholar] [CrossRef]
- Pineda, A.; Zheng, S.J.; van Loon, J.J.; Pieterse, C.M.; Dicke, M. Helping plants to deal with insects: The role of beneficial soil-borne microbes. Trends Plant Sci. 2010, 15, 507–514. [Google Scholar] [CrossRef]
- Yang, L.; Han, Y.; Li, P.; Li, F.; Ali, S.; Hou, M. Silicon amendment is involved in the induction of plant defense responses to a phloem feeder. Sci. Rep. 2017, 7, 4232. [Google Scholar] [CrossRef] [Green Version]
- Gill, S.S.; Tuteja, N. Reactive oxygen species and antioxidant machinery in abiotic stress tolerance in crop plants. Plant Physiol. Biochem. 2010, 48, 909–930. [Google Scholar] [CrossRef] [PubMed]
- Mittler, R. Oxidative stress, antioxidants and stress tolerance. Trends Plant Sci. 2002, 7, 405–410. [Google Scholar] [CrossRef] [PubMed]
- Yang, J.; Sun, X.Q.; Zhu-Salzman, K.; Qin, Q.M.; Feng, H.Q.; Kong, X.D.; Zhou, X.G.; Cai, Q.N. Host-induced gene silencing of brown planthopper glutathione S-transferase gene enhances rice resistance to sap-sucking insect pests. J. Pest Sci. 2021, 94, 769–781. [Google Scholar] [CrossRef]
- Han, Y.; Li, P.; Gong, S.; Yang, L.; Wen, L.; Hou, M. Defense responses in rice induced by silicon amendment against infestation by the leaf folder Cnaphalocrocis medinalis. PLoS ONE 2016, 11, e0153918. [Google Scholar] [CrossRef] [PubMed] [Green Version]
- Hao, P.; Liu, C.; Wang, Y.; Chen, R.; Tang, M.; Du, B.; Zhu, L.L.; He, G. Herbivore-induced callose deposition on the sieve plates of rice: An important mechanism for host resistance. Plant Physiol. 2008, 146, 1810–1820. [Google Scholar] [CrossRef] [Green Version]
- Dai, Z.; Tan, J.; Zhou, C.; Yang, X.; Yang, F.; Zhang, S.; Sun, S.C.; Miao, X.X.; Shi, Z. The OsmiR396–Os GRF 8–OsF3H-flavonoid pathway mediates resistance to the brown planthopper in rice (Oryza sativa). Plant Biotechnol. J. 2019, 17, 1657–1669. [Google Scholar] [CrossRef] [Green Version]
- Jayasimha, G.T.; Nalini, R.; Chinniah, C.; Muthamilan, M.; Mini, M.L. Evaluation of biochemical constituents in healthy and brown planthopper, Nilaparvata lugens (Stal.) (Hemiptera: Delphacidae) damaged rice plants. Curr. Biot. 2015, 9, 129–136. [Google Scholar]
- Li, H.; Zhou, Z.; Hua, H.; Ma, W. Comparative transcriptome analysis of defense response of rice to Nilaparvata lugens and Chilo suppressalis infestation. Int. J. Biol. Macromol. 2020, 163, 2270–2285. [Google Scholar] [CrossRef]
- Cai, K.; Gao, D.; Luo, S.; Zeng, R.; Yang, J.; Zhu, X. Physiological and cytological mechanisms of silicon-induced resistance in rice against blast disease. Physiol. Plantarum. 2008, 134, 324–333. [Google Scholar] [CrossRef]
- Uchiyama, M.; Mihara, M. Determination of malonaldehyde precursor in tissues by thiobarbituric acid test. Anal. Biochem. 1978, 86, 271–278. [Google Scholar] [CrossRef]
- Chai, X.S.; Hou, Q.X.; Luo, Q.; Zhu, J.Y. Rapid determination of hydrogen peroxide in the wood pulp bleaching streams by a dual-wavelength spectroscopic method. Anal. Chimica Acta 2004, 507, 281–284. [Google Scholar] [CrossRef]
- Liu, Y.K.; Xu, W.X.; Xu, J.J.; Zheng, S.R.; Yan, J.J.; Ding, Y.T.; Shen, B.; Tang, B. Brown planthopper infestations alter sugar metabolism in the rice plant as well as brown planthopper. Physiol. Entomol. 2021, 46, 167–178. [Google Scholar] [CrossRef]
- Dubey, R.S.; Rani, M. Salinity induced accumulation of free amino acids in germinating rice seeds differing in salt tolerance. J. Agro. Crop Sci. 1989, 163, 236–247. [Google Scholar] [CrossRef]
- Jones, D.L.; Blancaflor, E.B.; Kochian, L.V.; Gilroy, S. Spatial coordination of aluminium uptake, production of reactive oxygen species, callose production and wall rigidification in maize roots. Plant Cell Environ. 2006, 29, 1309–1318. [Google Scholar] [CrossRef]
- Liu, J.; Du, H.; Ding, X.; Zhou, Y.; Xie, P.; Wu, J. Mechanisms of callose deposition in rice regulated by exogenous abscisic acid and its involvement in rice resistance to Nilaparvata lugens Stål (Hemiptera: Delphacidae). Pest Manage. Sci. 2017, 73, 2559–2568. [Google Scholar] [CrossRef]
- Love, M.I.; Huber, W.; Anders, S. Moderated estimation of fold change and dispersion for RNA-seq data with DESeq2. Genome Biol. 2014, 15, 550. [Google Scholar] [CrossRef] [Green Version]
- Benjamini, Y.; Hochberg, Y. Controlling the false discovery rate: A practical and powerful approach to multiple testing. J. R. Stat. Soc. B 1995, 57, 289–300. [Google Scholar] [CrossRef]
- Kong, Z.; Zhao, D. Modulation of the fragrance of kam sweet rice by jasmonic acid and abscisic acid might involve the MYC2 and ABI5 transcription factors. J. Food Biochem. 2016, 40, 639–646. [Google Scholar] [CrossRef]
- Livak, K.J.; Schmittgen, T.D. Analysis of relative gene expression data using real-time quantitative PCR and the 2−ΔΔCT method. Methods 2001, 25, 402–408. [Google Scholar] [CrossRef]
- Zheng, X.; Zhu, L.; He, G. Genetic and molecular understanding of host rice resistance and Nilaparvata lugens adaptation. Curr. Opin. Insect Sci. 2021, 45, 14–20. [Google Scholar] [CrossRef]
- Yue, L.; Kang, K.; Zhang, W. Metabolic responses of brown planthoppers to IR56 resistant rice cultivar containing multiple resistance genes. J. Insect Physiol. 2019, 113, 67–76. [Google Scholar] [CrossRef] [PubMed]
- Vo, K.T.X.; Rahman, M.M.; Rahman, M.M.; Trinh, K.T.T.; Kim, S.T.; Jeon, J.S. Proteomics and metabolomics studies on the biotic stress responses of rice: An update. Rice 2021, 14, 30. [Google Scholar] [CrossRef] [PubMed]
- Smirnoff, N.; Arnaud, D. Hydrogen peroxide metabolism and functions in plants. New Phytol. 2019, 221, 1197–1214. [Google Scholar] [CrossRef] [PubMed] [Green Version]
- Solórzano, E.; Corpas, F.J.; González-Gordo, S.; Palma, J.M. Reactive oxygen species (ROS) metabolism and nitric oxide (NO) content in roots and shoots of rice (Oryza sativa L.) plants under arsenic-induced stress. Agronomy 2020, 10, 1014. [Google Scholar] [CrossRef]
- Sandhu, R.K.; Sarao, P.S.; Sharma, N. Antibiosis in wild rice accessions induced by Nilaparvata lugens (Stål) feeding. Phytoparasitica 2020, 48, 801–812. [Google Scholar] [CrossRef]
- Belete, T. Defense mechanisms of plants to insect pests: From morphological to biochemical approach. Trends Tech. Sci. Res. 2018, 2, 30–38. [Google Scholar] [CrossRef] [Green Version]
- Dixon, R.A.; Achnine, L.; Kota, P.; Liu, C.J.; Reddy, M.S.; Wang, L. The phenylpropanoid pathway and plant defence a genomics perspective. Mol. Plant Pathol. 2002, 3, 371–390. [Google Scholar] [CrossRef]
- Zhang, J.M.; Huang, G.Q.; Li, Y.; Zheng, Y.; Li, X.B. Cotton photosynthesis-related PSAK1 protein is involved in plant response to aphid attack. Mol. Bio. Rep. 2014, 41, 3191–3200. [Google Scholar] [CrossRef]
- Sōgawa, K. The rice brown planthopper: Feeding physiology and host plant interactions. Annu. Rev. Entomol. 1982, 27, 49–73. [Google Scholar] [CrossRef]
- Rashid, M.M.; Jahan, M.; Islam, K.S. Effects of nitrogen, phosphorous and potassium on host-choice behavior of brown planthopper, Nilaparvata lugens (Stål) on rice cultivar. J. Insect Behav. 2017, 30, 1–15. [Google Scholar] [CrossRef]
- Harun-Or-Rashid, M.; Kim, H.J.; Yeom, S.I.; Yu, H.A.; Manir, M.M.; Moon, S.S.; Kang, Y.J.; Chung, Y.R. Bacillus velezensis YC7010 enhances plant defenses against brown planthopper through transcriptomic and metabolic changes in rice. Front. Plant Sci. 2018, 9, 1904. [Google Scholar] [CrossRef] [Green Version]
- Liang, X.; Chen, X.; Li, C.; Fan, J.; Guo, Z. Metabolic and transcriptional alternations for defense by interfering OsWRKY62 and OsWRKY76 transcriptions in rice. Sci. Rep. 2017, 7, 2474. [Google Scholar] [CrossRef] [Green Version]
- Yokotani, N.; Sato, Y.; Tanabe, S.; Chujo, T.; Shimizu, T.; Okada, K.; Yamane, H.; Shimono, M.; Sugano, S.; Takatsuji, H.; et al. WRKY76 is a rice transcriptional repressor playing opposite roles in blast disease resistance and cold stress tolerance. J. Exp. Bot. 2013, 64, 5085–5097. [Google Scholar] [CrossRef]
- Tang, J.; Mei, E.; He, M.; Bu, Q.; Tian, X. Functions of OsWRKY24, OsWRKY70 and OsWRKY53 in regulating grain size in rice. Planta 2022, 255, 92. [Google Scholar] [CrossRef]
- Shen, H.; Liu, C.; Zhang, Y.; Meng, X.; Zhou, X.; Chu, C.; Wang, X. OsWRKY30 is activated by MAP kinases to confer drought tolerance in rice. Plant Mol. Biol. 2012, 80, 241–253. [Google Scholar] [CrossRef]
- Schweizer, F.; Bodenhausen, N.; Lassueur, S.; Masclaux, F.G.; Reymond, P. Differential contribution of transcription factors to Arabidopsis thaliana defense against Spodoptera littoralis. Front. Plant Sci. 2013, 4, 13. [Google Scholar] [CrossRef] [Green Version]
- Phukan, U.J.; Jeena, G.S.; Shukla, R.K. WRKY transcription factors: Molecular regulation and stress responses in plants. Front. Plant Sci. 2016, 7, 760. [Google Scholar] [CrossRef] [Green Version]
- Wang, H.; Hao, J.; Chen, X.; Hao, Z.; Wang, X.; Lou, Y.; Peng, Y.L.; Guo, Z. Overexpression of rice WRKY89 enhances ultraviolet B tolerance and disease resistance in rice plants. Plant Mol. Biol. 2007, 65, 799–815. [Google Scholar] [CrossRef]
- Kundu, P.; Vadassery, J. Role of WRKY transcription factors in plant defense against lepidopteran insect herbivores: An overview. J. Plant Biochem. Biotech. 2021, 30, 698–707. [Google Scholar] [CrossRef]
- Ye, M.; Glauser, G.; Lou, Y.; Erb, M.; Hu, L. Molecular dissection of early defense signaling underlying volatile-mediated defense regulation and herbivore resistance in rice. Plant Cell 2019, 31, 687–698. [Google Scholar] [CrossRef] [PubMed]


Publisher’s Note: MDPI stays neutral with regard to jurisdictional claims in published maps and institutional affiliations. |
© 2022 by the authors. Licensee MDPI, Basel, Switzerland. This article is an open access article distributed under the terms and conditions of the Creative Commons Attribution (CC BY) license (https://creativecommons.org/licenses/by/4.0/).
Share and Cite
Ma, C.; Gui, W.; Zhang, Y.; Shah, A.Z.; Xu, G.; Yang, G. Combined Physio-Biochemical and Transcriptome Analyses Illuminate the Resistance Response of Rice Priming with Decoyinine against Nilaparvata lugens. Agronomy 2022, 12, 3098. https://doi.org/10.3390/agronomy12123098
Ma C, Gui W, Zhang Y, Shah AZ, Xu G, Yang G. Combined Physio-Biochemical and Transcriptome Analyses Illuminate the Resistance Response of Rice Priming with Decoyinine against Nilaparvata lugens. Agronomy. 2022; 12(12):3098. https://doi.org/10.3390/agronomy12123098
Chicago/Turabian StyleMa, Chao, Wei Gui, Yuanyuan Zhang, Amir Zaman Shah, Gang Xu, and Guoqing Yang. 2022. "Combined Physio-Biochemical and Transcriptome Analyses Illuminate the Resistance Response of Rice Priming with Decoyinine against Nilaparvata lugens" Agronomy 12, no. 12: 3098. https://doi.org/10.3390/agronomy12123098