Article

Effects of Grazing Intensity on the Carbon, Nitrogen and Phosphorus Content, Stoichiometry and Storage of Plant Functional Groups in a Meadow Steppe

1
Institute of Agricultural Resources and Regional Planning, Chinese Academy of Agricultural Sciences, No. 12, Zhonguancun South Street, Haidian District, Beijing 100081, China
2
Beijing Digital Agriculture Rural Promotion Center, Building 3, No. 7 Beisha Beach, Chaoyang District, Beijing 100083, China
3
Institute of Grassland Science, Northeast Normal University, Changchun 130024, China
*
Author to whom correspondence should be addressed.
Agronomy 2022, 12(12), 3057; https://doi.org/10.3390/agronomy12123057
Submission received: 4 November 2022 / Revised: 24 November 2022 / Accepted: 30 November 2022 / Published: 2 December 2022

Abstract

:
Studies on the impacts of grazing on carbon, nitrogen, and phosphorus stoichiometry and storage are crucial for better understanding the nutrient cycles of grasslands ecosystems. Using a controlled grazing experimental platform in a meadow steppe ecosystem, the effects of different stocking rates (0.00, 0.23, 0.34, 0.46, 0.69, and 0.92 AU ha−1) on the carbon, nitrogen, and phosphorus contents of plant functional groups were explored. The major results were: (1) The carbon content of Gramineae Barnhart was significantly reduced by grazing intensity (p < 0.05), and the organic carbon content of Cyperaceae Rotundus was significantly higher than that of the other groups; the total nitrogen content of Cyperaceae and other groups and total phosphorus contents of Gramineae, Leguminosae Sp., Cyperaceae, and other groups all increased significantly with increasing grazing intensity (p < 0.05). (2) The carbon, nitrogen, and phosphorus storage amounts of Gramineae, Leguminosae, and Ranunculaceae L. decreased significantly with increasing grazing intensity. Heavy grazing reduced the carbon, nitrogen, and phosphorus storage amounts of Cyperaceae and other groups, while the carbon, nitrogen, and phosphorus storage amounts of Compositae were the largest under moderate grazing. (3) The nitrogen content of each functional group was highly significantly negatively correlated with the C/N ratio, and the phosphorus content was highly significantly negatively correlated with the C/P ratio. Grazing and foraging affected the growth of the different functional groups, which in turn affected their carbon, nitrogen, and phosphorus content, stoichiometry, and storage. Moderate grazing improved the nutrient utilization efficiency of grassland and is beneficial for promoting sustainable grassland development.

1. Introduction

Grassland is an important terrestrial ecosystem on the Earth’s surface. It is not only a large green ecological barrier and terrestrial carbon pool but also an important base for animal husbandry and food security. However, most global grassland ecosystems have suffered different degrees of degradation as a result of global warming and unreasonable human use, among which approximately 90% of natural grasslands in China have been degraded to different degrees [1]. Previous studies have shown that irrational grazing threatens the biodiversity and stability of grassland ecosystems and alters their structure and function [2,3,4], resulting in carbon and nitrogen loss [5,6,7] and directly affecting the carbon source/sink function of grasslands in Northern China under global change [8]. As the main utilization method of grasslands, grazing has a comprehensive and profound impact on these ecosystems and is one of the most critical biological driving factors of the grassland material cycle [9]. Grazing activities have important effects on elemental stoichiometry and stocks in all functional groups of the ecosystem [10,11]. Carbon, nitrogen, and phosphorus are key elements in biological growth and material circulation. The strong coupling between carbon, nitrogen, and phosphorus plays a regulatory role in plant growth [12,13], ecosystem material circulation, and energy flow. Ecological stoichiometry is the science of studying the chemical elements and their proportional relationships in the material cycle of ecological processes at multiple scales, such as the individual, population, community, and ecosystem scale [14,15].
In recent years, different results have been reported regarding the carbon, nitrogen, and phosphorus contents, stoichiometry, and reserves of grassland vegetation, mainly due to differences in grazing intensity, grazing time, and grassland type [13]. Han et al. showed that grazing increased the nitrogen and phosphorus content in aboveground tissues, and livestock feeding not only stimulated the regrowth of aboveground plant parts but also promoted the circulation of aboveground plant elements, leading to the transfer of nitrogen and phosphorus to young organs. Moreover, there was a synergistic relationship between nitrogen and phosphorus in plants, showing a significant positive correlation [16,17,18]. Additionally, grazing increased nitrogen levels without significant effects on phosphorus levels in a study of nearly half a century of continuous grazing of grassland in Yellowstone National Park, USA [19]. Wang et al. reported that grazing increased the carbon content of the degradation indicator plant Artemisia frigida Willd, decreased the carbon content of the dominant species Leymus chinensis Tzvel, and increased the total nitrogen content of plants in L. chinensis meadow steppe [20]. In a study of typical grassland in China, Zhang et al. found that the nitrogen and phosphorus contents of non-Gramineae plants were higher than those of Gramineae plants and the N/P ratios of Gramineae plants were higher than those of other non-Gramineae and other functional group plants, which may make them more favorable in the competition for ecosystem nutrients, water, heat, and other resources, being one of the reasons why Gramineae plants become the main dominant species of grasslands [21]. However, He et al. studied carbon, nitrogen, and phosphorus in a grassland in China and found that the leaf N/P ratios of Leguminosae were significantly higher than those of Gramineae and other groups and that it was greatly limited by phosphorus [22,23,24,25]. Under different grazing intensities, the variations in carbon, nitrogen, and phosphorus storage in different grassland components were significantly positively correlated with their corresponding biomass [26]. Chen et al. showed that grazing reduced plant carbon storage [27]. Bai et al. carried out a study on grassland transects in the Mongolian Plateau and found that grazing increased the phosphorus storage of roots in meadow steppe and typical steppe, and reduced the phosphorus storage of roots in desert steppe [25]. In contrast, Yan et al. found that heavy grazing reduced root phosphorus storage compared with the average grassland conditions worldwide after a meta-analysis of grasslands across the country [4].
Hulunbuir is a grassland ecosystem with a highly concentrated distribution and abundant biodiversity occurring in temperate meadow steppe in Inner Mongolia, China [28]. At present, studies on grazing disturbance mainly focus on sheep and yak, and there are very few studies on the impact of beef cattle grazing on grassland, and fewer studies on carbon, nitrogen, and phosphorus storage and their intrinsic relationships at the level of different functional groups of plants, which limits our ability to predict the response of key ecological processes to grazing. Although in the past few decades there have relevant studies on the structure, function, and soil carbon and nitrogen cycles of Hulunbuir meadow steppe, there are few studies on the effects of quantitative grazing on the nutrient content, stoichiometry, and storage of plant functional groups. Therefore, the main objectives of this study are: (1) to characterize the changes in carbon, nitrogen, and phosphorus stoichiometry and storage of plant functional groups under different grazing intensities in the Hulunbuir meadow steppe of Inner Mongolia and to clarify their relationships; and (2) to reveal the response mechanisms of carbon, nitrogen and phosphorus content, stoichiometry, and storage of plant functional groups to quantitative grazing in temperate meadow steppe to provide a theoretical basis and supporting data for adaptive management of grassland grazing systems, it is of great significance to maintain the stability of grassland ecosystem and promote the growth of livestock.

2. Materials and Methods

2.1. Study Site and Sampling

The study area is located in the Hulunbuir grassland in northeastern Inner Mongolia and is part of a long-term beef cattle grazing experimental platform of the National Field Scientific Observatory of Grassland Ecosystems, Chinese Academy of Agricultural Sciences (49°32′~49°34′ N, 119°94′~119°96′ E). It has a temperate semi-arid continental climate and an average altitude of approximately 670 m. The average annual precipitation is up to 400 mm, with more precipitation falling in July and August. The maximum temperature is 36 °C and the minimum is −48 °C, and the frost-free period is approximately 110 days. The soil in the experimental area is chernozem or dark chestnut soil, the grassland type is L. chinensis meadow steppe, composed mainly of the dominant species L. chinensis, Achnatherum sibiricum Keng, and Stipa baicalensis Roshev along with the companion species Bupleurum scorzonerifolium Willd and Cleistogenes squarrosa Keng. The main degradation indicator species include Artemisia frigida and Potentilla bifurca Linn.
The grazing experiment was established in 2009 according to a random block design. There were six levels of grazing intensity and three replications covering a total area of 90 ha, with each plot having an area of 5 ha. The cattle stocking rates for the different grazing intensities were 0.00, 0.23, 0.34, 0.46, 0.69, and 0.92 AU ha−1 (with 500 kg beef cattle corresponding to one standard animal unit (AU)) (Figure 1). Under the same conditions with regard to experimental plot area and grazing days, 250–300 kg of grazing beef cattle was used to control the implementation of different grazing intensities. The number of beef cattle used for the six grazing intensities was 0, 2, 3, 4, 6, and 8, and the total number of beef cattle was 69, and the treatments were termed no grazing (G0.00), lighter grazing (G0.23), light grazing (G0.34), moderate grazing (G0.46), heavy grazing (G0.69), and extremely heavy grazing (G0.92). The grazing experiment was started in 2009 and conducted for 120 days each year, from 1 June to 1 October, with 2021 being the 13th year of the grazing experiment. During this period, the grazing cattle were in the experimental area day and night and did not receive supplemental feed to ensure adequate water and salt supply. Samples for this study were taken in August 2021. The species composition of different functional groups under the different grazing treatments after more than ten years of grazing is shown in Table 1.

2.2. Sample Collection and Stoichiometry

The samples were collected in August, the peak growth period of forage grass in 2021. Five 1 m × 1 m random sample plots were set up in each treatment, and plants from different functional groups (Compositae, Gramineae, Cyperaceae, Ranunculaceae, Leguminosae, and other groups) were cut close to the ground. The plant samples were then dried at 85 °C to constant weight and weighed to obtain the biomass of the different functional groups. The biomass and proportion of functional groups found in the different treatments is shown in Table 2. The samples were then crushed (before crushing, the initial samples were obtained by three crushing methods, and then 1/4 of them were taken according to the quartering method for the second crushing and third crushing, after which the samples were sieved through 0.02 mm sieve and bottled for later use) and reserved for the determination of carbon, nitrogen, and phosphorus content. The carbon and nitrogen contents of the plant functional groups were determined by the potassium dichromate-concentrated sulfuric acid plus thermal oxidation method and by the Kjeldahl method, respectively. The total phosphorus content was determined by sulfuric acid–hydrogen peroxide digestion–molybdenum antimony anti-absorption spectrophotometry. Stoichiometry is calculated on the basis of mass.

2.3. Calculation and Statistics

Plant carbon, nitrogen, and phosphorus storage: Q d = B × S ÷ 1000
where Qd is the carbon, nitrogen, and phosphorus storage per unit area, g/m2; B is the plant biomass per unit area, g/m2; S is the plant organic carbon, total nitrogen, total phosphorus content, g/kg.
In this study, Microsoft Excel 2020 (Microsoft, Seattle, WA, USA) and SPSS 19 were used for data collation and statistical analysis, and Origin 2022 (OriginLab Ltd., Northampton, MA, USA) was used for data visualization. One-way ANOVA was used to analyze the content, stoichiometry, and storage characteristics of organic carbon, total nitrogen, and total phosphorus in the plant functional groups under different grazing intensities, and the LSD and Duncan tests were used for multiple comparisons. Pearson analysis was used for correlation analysis. The significance level was set as p < 0.05, and the extreme significance level was set as p < 0.001.

3. Results

3.1. Changes in the Nutrient Content of Plant Functional Groups

The contents of organic carbon, total nitrogen, and total phosphorus in the different plant functional groups showed different trends (Figure 2). The organic carbon content of Gramineae decreased significantly with increasing grazing intensity (p < 0.05), and the organic carbon content in G0.00 was significantly higher than that in G0.92 by approximately 10.69%. The organic carbon content of Cyperaceae was significantly higher than that of the other functional groups, the carbon content of Ranunculaceae and other groups was significantly lower than that of the other functional groups, and there was no significant difference between Gramineae, Compositae, and Leguminosae (p > 0.05). With the increase in grazing intensity, the total nitrogen content of Compositae, Cyperaceae, and other groups increased significantly (p < 0.05), and it was significantly higher in G0.92 than in G0.00, G0.23, G0.34, and G0.46. Compared with no grazing, the total nitrogen content of Compositae, Cyperaceae, and other groups under extremely heavy grazing increased by 18.66%, 36.83%, and 49.68%, respectively. The peak total nitrogen content of gramineous plants was 20.57 g/kg in G0.69, which was significantly higher than that in G0.00, G0.23, and G0.46. The total nitrogen content of legumes was significantly higher than that of the other functional groups, and the total nitrogen content of gramineous plants was the lowest. The total phosphorus content of Gramineae and Cyperaceae increased significantly with increasing grazing intensity (p < 0.05), and their content in G0.69 was significantly higher than those in G0.00, G0.23, G0.34, and G0.46. The phosphorus content in Leguminosae and other groups showed a decreasing then increasing trend, with the lowest values of both groups, 1.45 and 1.65 g/kg, observed in G0.34, which were significantly lower than those in G0.92. The total phosphorus content of Compositae and other groups was significantly higher than that of Gramineae, Ranunculaceae, and Cyperaceae. Overall, in the plant functional groups, the organic carbon content decreased and the total nitrogen and phosphorus contents increased with increasing grazing intensity.

3.2. Changes in the Stoichiometric Ratios of Plant Functional Groups

The stoichiometric ratios of different plant functional groups showed different trends (Figure 3). With the increase in grazing intensity, the C/N ratios of Gramineae (R2 = 0.85, p < 0.05), Compositae (R2 = 0.67, p < 0.05), Cyperaceae (R2 = 0.68, p < 0.05), and other groups (R2 = 0.81, p < 0.05) all showed a significant linear decrease, and the C/N ratios of Ranunculaceae (R2 = 0.67, p > 0.05) showed a binomial distribution, with the highest value of 23.49 in G0.46, which was significantly higher than that in G0.69 (p < 0.05).
The C/P ratios of Cyperaceae showed a significant linear decrease with increasing grazing intensity. The C/P ratios of Gramineae (R2 = 0.64, p > 0.05) and Cyperaceae in G0.00, G0.23, and G0.34 were significantly higher than those in G0.69 and G0.92. The C/P ratios of Leguminosae (R2 = 0.85, p > 0.05) and other groups (R2 = 0.79, p > 0.05) showed a binomial distribution with increasing grazing intensity, and their C/P ratios were the highest in G0.34, reaching 253.32 and 214.99, respectively, which were significantly higher than those in G0.69 and G0.92. The N/P ratios of Gramineae (R2 = 0.78, p < 0.05), Compositae (R2 = 0.74, p < 0.05), and other groups (R2 = 0.73, p < 0.05) showed a significant linear increase with increasing grazing intensity and were 1.25, 1.22, and 1.31 times in G0.92 that in G0.00, respectively, while the N/P ratios of Leguminosae (R2 = 0.78, p < 0.05) showed a significant linear decrease, and those of Cyperaceae were significantly higher in G0.34 than in G0.23.

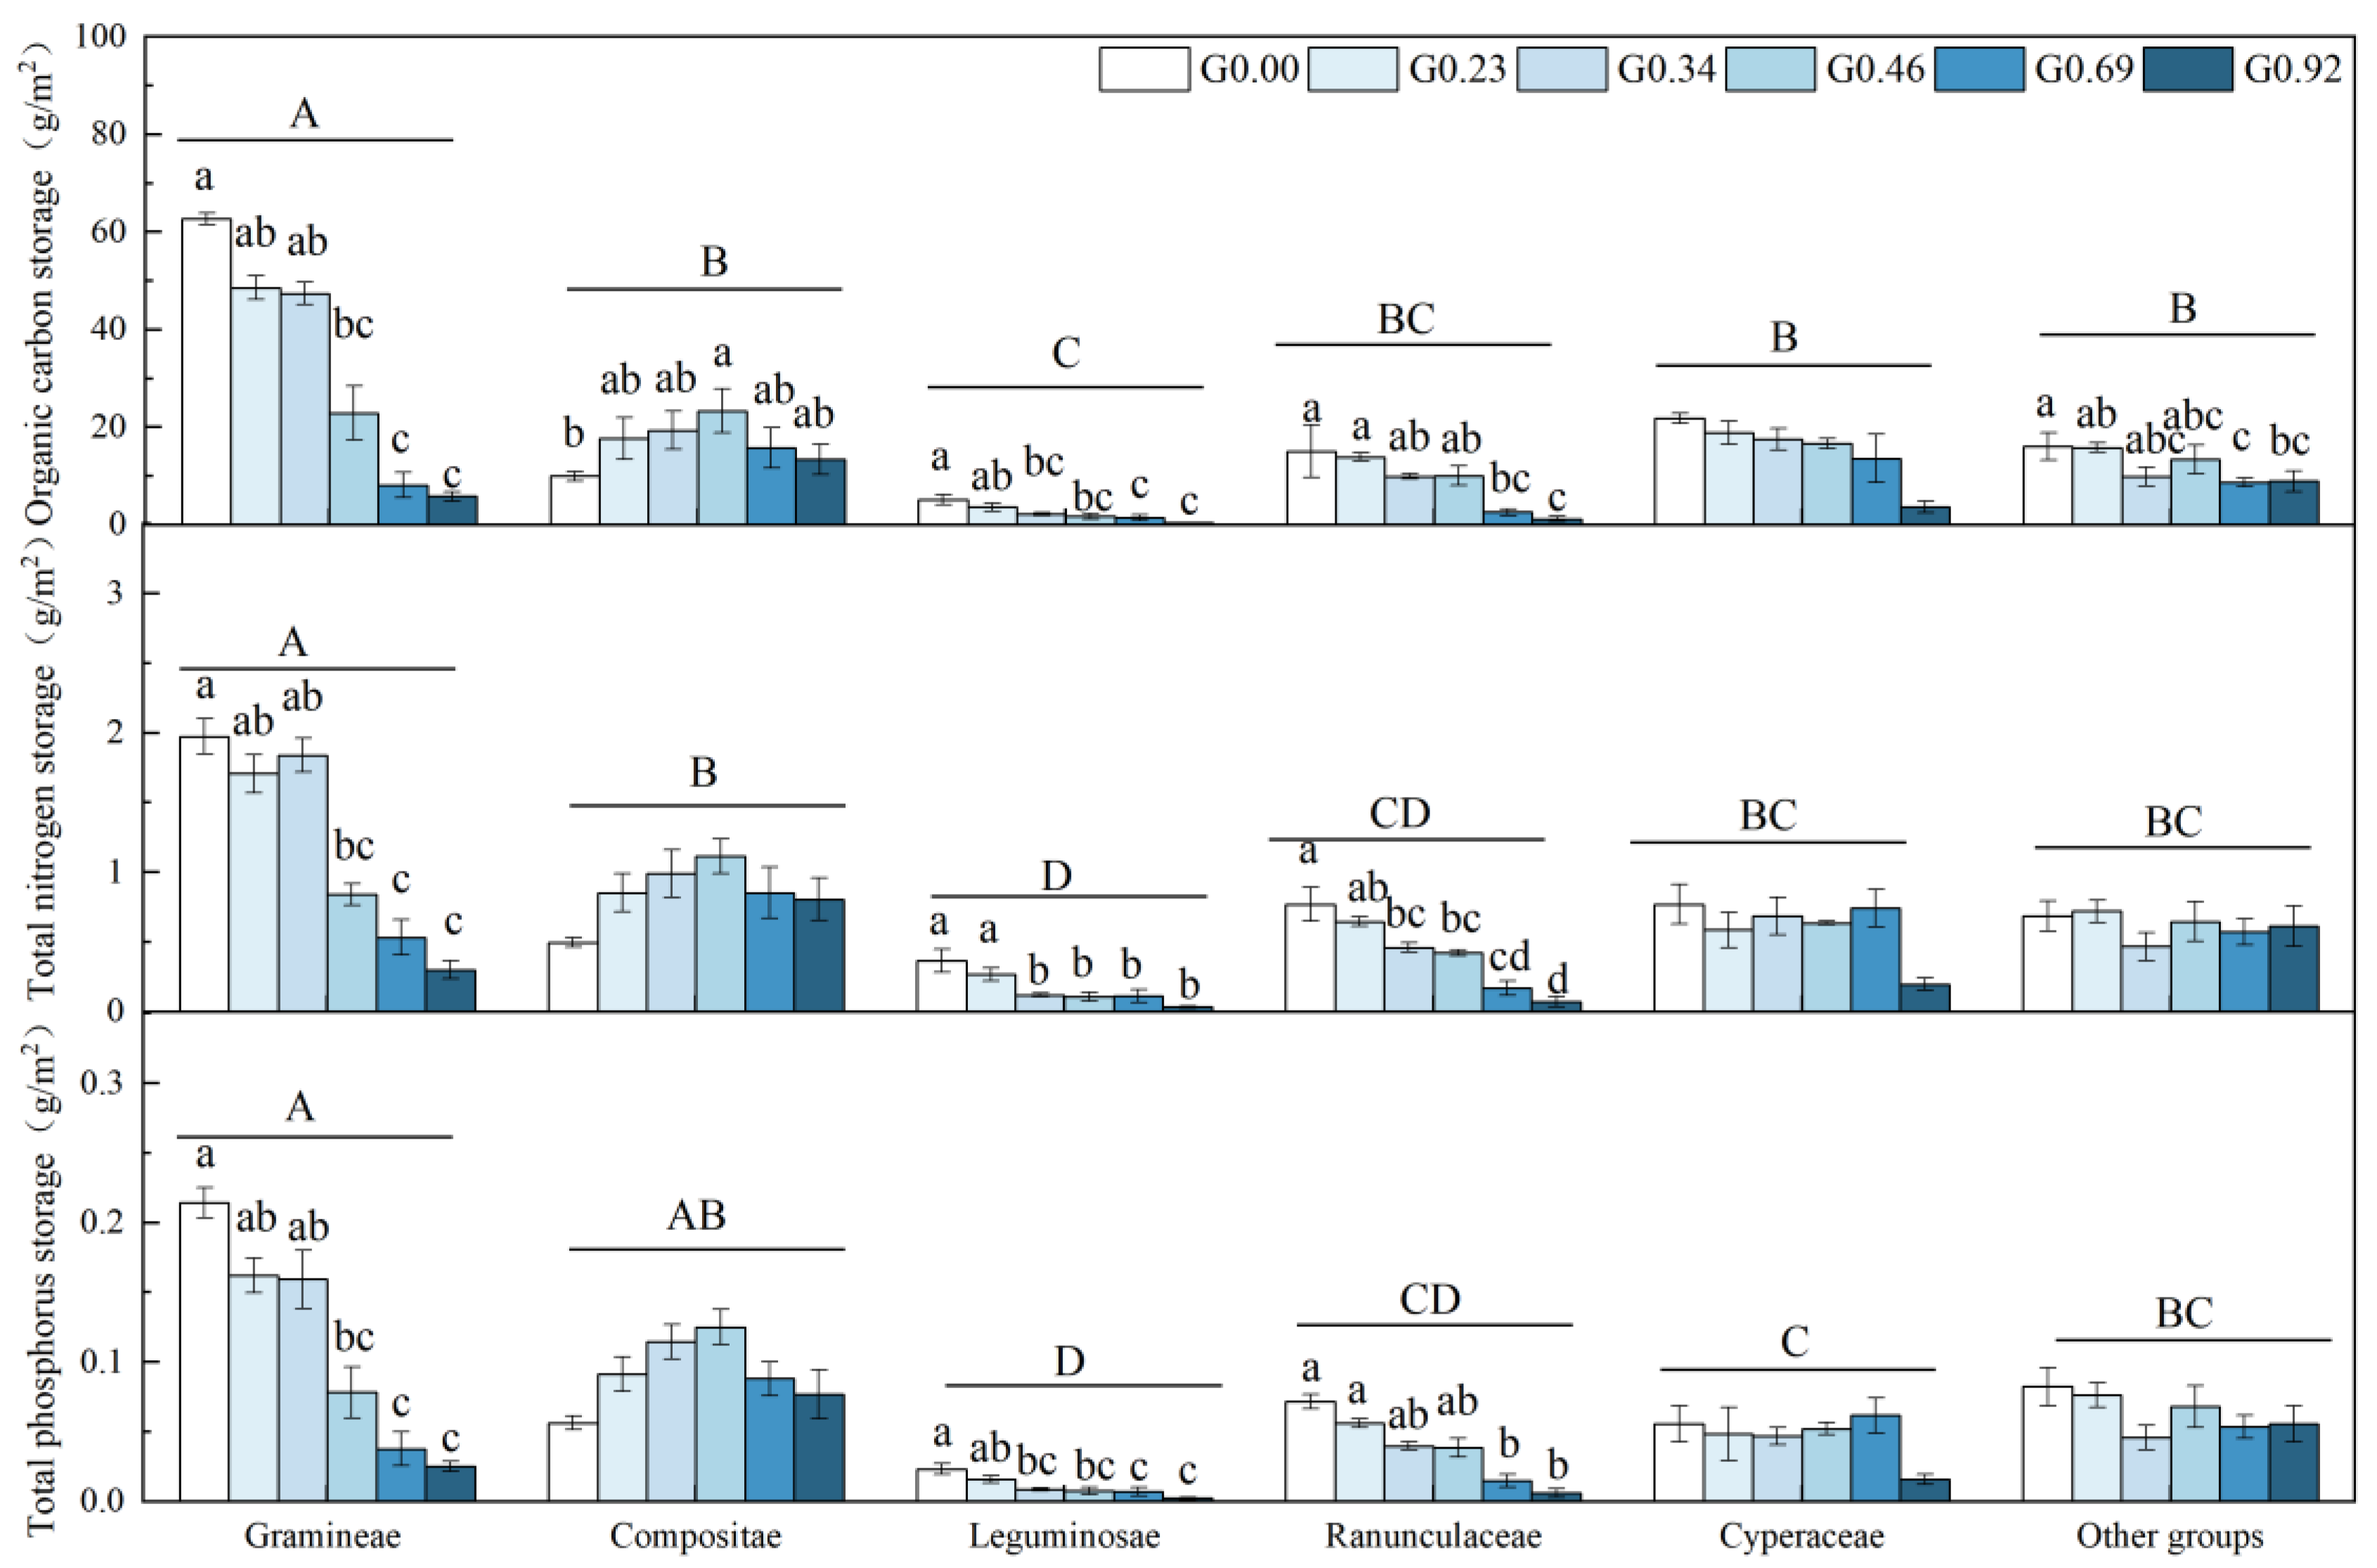
3.3. Changes in the Nutrient Storage of Plant Functional Groups

The organic carbon storage of Gramineae in G0.00 was significantly higher than that in G0.46, G0.69, and G0.92 (p < 0.05) (Figure 4). The organic carbon storage of Leguminosae, Ranunculaceae, and forbs in G0.00 was significantly higher than that in G0.69 and G0.92 (p < 0.05), compared with no grazing, the organic carbon storage in G0.92 decreased by 91.91%, 92.18%, and 44.74%, respectively. The organic carbon storage of Compositae showed a single-peak trend, reaching the peak of 23.32 g/m2 in G0.46, and this value was significantly higher than that under no grazing. Among the functional groups, the organic carbon storage of Gramineae was significantly higher than that of the other functional groups, and the carbon storage of Leguminosae was significantly lower than that of the other functional groups (p < 0.05).
The total nitrogen storage of Gramineae in G0.00, G0.23, and G0.34 was significantly higher (p < 0.05) than that in G0.69 and G0.92, and the nitrogen storage in G0.92 was 6.58 times higher than that in G0.00; the total nitrogen storage of Leguminosae in G0.00 and G0.23 was significantly higher than that in G0.34, G0.46, G0.69, and G0.92 (p < 0.05); the total nitrogen storage of Ranunculaceae under heavy grazing (G0.69 and G0.92) was significantly lower than those under no grazing (G0.00) and light grazing (G0.23) (p < 0.05). The total nitrogen storage of Gramineae was significantly higher than that of the other functional groups, while that of Leguminosae was significantly lower than that of the other functional groups (p < 0.05). The total phosphorus storage of Gramineae in G0.00, G0.23, and G0.34 was significantly higher than that in G0.69 and G0.92 (p < 0.05). The total phosphorus storage of Leguminosae and Ranunculaceae under heavy grazing (G0.69 and G0.92) was significantly lower than that under no grazing (G0.00) and light grazing (G0.23) (p < 0.05). The total phosphorus storage of Compositae showed a unimodal trend, reaching a peak of 0.13 g/m2 in G0.46. The total phosphorus storage of Gramineae and Compositae was significantly higher than that of Leguminosae, Ranunculaceae, and Cyperaceae.
In general, the organic carbon, total nitrogen, and total phosphorus reserves of Gramineae, Leguminosae, Ranunculaceae, and other groups decreased with increasing grazing intensity. The nutrient reserves of Compositae were the highest under moderate grazing and those of Cyperaceae decreased under extremely heavy grazing. The storage of organic carbon, total nitrogen, and total phosphorus in Gramineae, Leguminosae, and Ranunculaceae decreased with increasing grazing intensity. The nutrient storage of Compositae was the highest under moderate grazing.

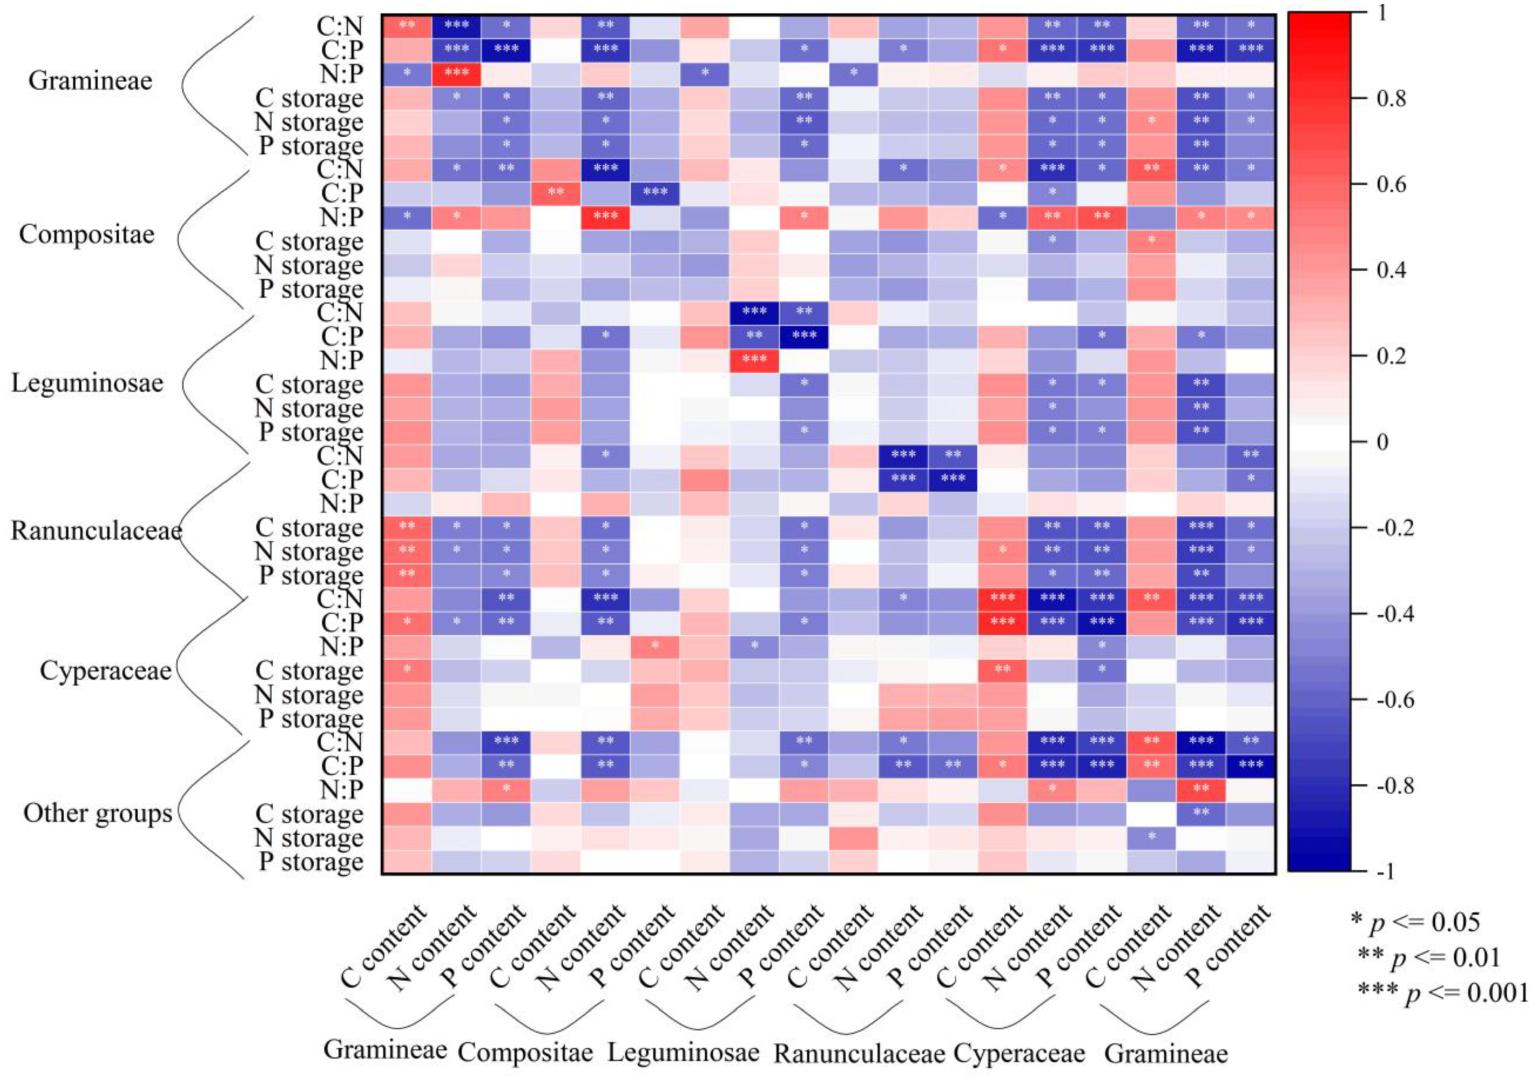
3.4. Correlation between Nutrient Content, Stoichiometry and Storage in Plant Functional Groups

The nitrogen content of Gramineae, Compositae, and Leguminosae was significantly negatively correlated with the C/N ratio and significantly positively correlated with the N/P ratio, while the phosphorus content was significantly negatively correlated with the C/P ratio (Figure 5). The nitrogen content of Ranunculaceae and other groups showed a highly significant negative correlation with the C/N and C/P ratios, and the phosphorus content showed a highly significant negative correlation with the C/P ratio. The carbon content of Cyperaceae showed a highly significant positive correlation with the C/N and C/P ratios, while the nitrogen and phosphorus contents showed a highly significant negative correlation with the C/N and C/P ratios.

4. Discussion

4.1. Effects of Grazing on the Nutrient Content of Different Plant Functional Groups

In this study, the carbon contents of the different plant functional groups in each grazing intensity from high to low followed the order Cyperaceae > Gramineae > Compositae > Leguminosae > Ranunculaceae > other groups, all of which were lower than the 450 g·kg−1 value reported for Inner Mongolia grassland [29], indicating that plants in this experimental area had a weak defense ability against grazing in general, although Cyperaceae had the strongest defense ability. The carbon content of Gramineae decreased significantly with increasing grazing intensity. The reason may be that with increasing grazing intensity, the Gramineae functional group, which was mainly composed of L. chinensis, was consumed by livestock and the carbon content in young leaves was low after grazing, resulting in a decrease in the carbon content in the functional groups [30]. The results of this experiment showed that the nitrogen content of Leguminosae was significantly higher than that of the other functional groups, mainly due to its stronger ability to acquire nitrogen in combination with nitrogen-fixing rhizobacteria as well as to its higher nitrogen utilization efficiency. Thus, compared with non-Leguminosae, Leguminosae had higher nitrogen contents [31,32,33]. The nitrogen and phosphorus contents of Gramineae were lower than those of the other functional groups of plants, which is consistent with the results of previous studies [21,34]. Due to interspecific specificity, plants of different functional groups have different nitrogen and phosphorus requirements, which also reflects the selective uptake of elements and the uneven distribution of elements in plants. Gramineae species have higher nutrient utilization and redistribution efficiency, resulting in lower nitrogen and phosphorus contents than other functional groups [35]. In addition, it has been shown that if the overall general environment is limited by nitrogen or phosphorus, the dominant species tend to be plants with lower nitrogen and phosphorus contents. Cyperaceae are the main plants of alpine meadows in the Qinghai-Tibet Plateau region, and Gramineae are the main plants of alpine grasslands and Inner Mongolia grasslands. In Inner Mongolia L. chinensis meadows, Gramineae have greater advantages in the competition for nutrients in grassland ecosystems due to their lower nitrogen and phosphorus contents [36]. The contents of nitrogen and phosphorus in the six functional groups of plants showed an upwards trend with increasing grazing intensity. The reason for this result is that grazing promotes nutrient recycling in the plants, and it increases excretion in cattle, which in turn increases the content of nitrogen and phosphorus in the soil. The physical and chemical properties of the soil also change after it is trampled by cattle. All these factors are responsible for the corresponding increase in the amount of nitrogen and phosphorus absorbed by plants [37,38].

4.2. Effects of Grazing on the Stoichiometry of Different Plant Functional Groups

The difference in stoichiometry among functional groups reflects the difference in nutrient limitation status among different plant taxa [39,40]. Plants usually have higher growth rates when they have lower C/N and C/P ratios, which explains that the decrease in C/N and C/P ratios with increasing grazing intensity in the six different functional groups was due to compensatory growth. This study showed that the C/N and C/P ratios of Gramineae were the highest among the functional groups, indicating that Gramineae had strong carbon assimilation ability, likely because grazing changed the community structure and species diversity composition [41]. The shorter the plant is, the less biomass is eaten by livestock. Koeleria macrantha and Cleistogenes squarrosa show stronger grazing tolerance than other Gramineae and become the main species during heavy grazing. Studies have shown that the aboveground C/N ratio of dominant species under no-grazing is higher than that of degradation indicator species such as Koeleria macrantha and Cleistogenes squarrosa under heavy grazing, which may also be the reason why C/N ratio of Gramineae decreases with grazing intensity [42]. The results of this experiment showed that plants of Gramineae, Compositae, Cyperaceae, Ranunculaceae, and other groups were limited by nitrogen, among which only Leguminosae and Cyperaceae under no grazing had N/P ratios higher than 12.6, while the N/P ratios of the remaining groups were lower than the average N/P ratios of grassland ecosystems in China, indicating that one of the main factors limiting plant growth in Hulunbuir grassland is nitrogen [43]. Leguminosae had a high nitrogen content and N/P ratio, which is consistent with the results of the study by Liu Minxia et al., but there was no significant difference in the N/P ratio among the different grazing intensities. Leguminosae were limited by phosphorus under light grazing, and the experimental results were the same as others. However, because the N/P ratio is affected by many factors, such as environmental ones, it is not possible to directly determine the limiting elements by simply relying on the value of the N/P ratios, and further in-depth studies are needed [44].

4.3. Effects of Grazing on the Nutrient Storage of Different Plant Functional Groups

The results of this experiment showed that the elemental stocks of the different functional groups of plants under each grazing intensity from high to low followed the order Gramineae > Compositae > other groups > Cyperaceae > Ranunculaceae > Leguminosae. The storage of organic carbon, total nitrogen, and total phosphorus in Gramineae, Leguminosae, Ranunculaceae, and other groups decreased with increasing grazing intensity [45,46]. Moderate grazing increased the carbon, nitrogen and phosphorus storage of Compositae plants, but the elemental stocks decreased significantly under overgrazing, indicating that moderate grazing contributes to the sustainable development of grassland ecology. The change in elemental reserves was caused by grazing, and the most direct change in grassland ecosystems caused by grazing is its aboveground biomass [3,47]. In this study, the organic carbon content decreased and the total nitrogen and phosphorus contents increased with increasing grazing intensity in the plant functional groups; however, the variation trend of the plant functional groups storage was different, and it was basically the same as that of biomass, which is consistent with the results of other studies; the reserves of carbon, nitrogen, and phosphorus in grassland plants were significantly positively correlated with the biomass. The plant storage was determined by the content and aboveground biomass, but the storage was less affected by the content, and these changes were closely related to the aboveground biomass changes [48]. With the increase in grazing intensity, the plants with good palatability in Gramineae and Leguminosae were preferentially foraged, resulting in a highly significant negative correlation between grazing intensity and biomass, which was consistent with the conclusion of Song Shanshan et al. that fence enclosure increased the aboveground biomass of Gramineae and Leguminosae [49]. However, the main plants of Compositae are mostly degradation indicator plants such as Artemisia, which have poor palatability, and because the dominant species are consumed during grazing, a good environment is provided for the growth of degradation indicator plants, reducing the competition among functional groups. Therefore, there was a significant positive correlation between grazing intensity and the biomass of Compositae. However, due to the limited food during extremely heavy grazing, the livestock no longer selectively fed, which led to a decrease in the biomass of Compositae under heavy grazing intensity [50,51].

5. Conclusions

The elemental contents of different functional groups showed different trends with grazing. When the grazing intensity increased, the organic carbon content of Gramineae significantly decreased, the total nitrogen and total phosphorus contents of Gramineae, Cyperaceae and other functional groups increased significantly, and the total nitrogen content of Composita and total phosphorus content of Leguminosae also increased significantly. Compared with no grazing, heavy grazing reduced the C/N and C/P ratios of the six functional groups. Gramineae, Compositae, Cyperaceae, Ranunculaceae, and other groups were limited by nitrogen under heavy grazing, while Leguminosae was limited by phosphorus under light grazing. The elemental storage of plants in the different functional groups under the different grazing intensity followed the order Gramineae > Compositae > other groups > Cyperaceae > Ranunculaceae > Leguminosae. The carbon, nitrogen and phosphorus storage of Gramineae, Leguminosae, and Ranunculaceae decreased significantly with increasing grazing intensity. Heavy grazing reduced the carbon, nitrogen and phosphorus storage of Cyperaceae and other groups of plants, and the carbon, nitrogen and phosphorus storage of Compositae was the highest under moderate grazing.

Author Contributions

Conceptualization, M.W. and R.Y.; methodology, M.W.; investigation, Y.Z., S.C. and C.Z.; data curation, M.W. and R.Y.; writing—original draft preparation, M.W.; writing—review and editing, M.W., Y.L., X.W. and R.Y.; and funding acquisition, R.Y. and X.X. All authors have read and agreed to the published version of the manuscript.

Funding

This work was funded by the National Natural Science Foundation of China (31971769, 32130070), the National Key Research and Development Program of China (2021YFF0703904, 2021YFD1300503), the Hulunbuir City “Science and Technology” Action Focus Special Project (2021hzzx03), the Fundamental Research Funds Central Nonprofit Scientific Institution (1610132021016), and the Special Funding for Modern Agricultural Technology Systems from the Chinese Ministry of Agriculture (CARS-34).

Data Availability Statement

Not applicable.

Acknowledgments

The authors thank the reviewers and editor for their insightful comments and constructive suggestions.

Conflicts of Interest

The authors declare no conflict of interest.

References

  1. Reed, M.S.; Stringer, L.C. Land degradation, desertification and climate change: Anticipating, assessing and adapting to future change. Taylor Fr. 2016, 10, 4324. [Google Scholar] [CrossRef]
  2. Olofsson, J.; Kitti, H.; Rautiainen, P.; Stark, S.; Oksanen, L. Effects of summer grazing by reindeer on composition of vegetation, productivity and nitrogen cycling. Ecography 2001, 24, 13–24. [Google Scholar] [CrossRef]
  3. Wang, S.P.; Duan, J.C.; Xu, G.P.; Wang, Y.F.; Zhang, Z.H.; Rui, Y.C.; Luo, C.Y.; Xu, B.B.; Zhu, X.X.; Chang, X.F.; et al. Effects of warming and grazing on soil N availability, species composition, and ANPP in an alpine meadow. Ecology 2012, 93, 2365–2376. [Google Scholar] [CrossRef] [PubMed]
  4. Yan, L.; Zhou, G.; Zhang, F. Effects of different grazing intensities on grassland production in China: A meta-analysis. PLoS ONE 2013, 8, e81466. [Google Scholar] [CrossRef] [PubMed] [Green Version]
  5. Liu, N.; Kan, H.M.; Yang, G.W.; Zhang, Y.J. Changes in plant, soil, and microbes in a typical steppe from simulated grazing: Explaining potential change in soil C. Ecol. Monogr. 2015, 85, 269–286. [Google Scholar] [CrossRef]
  6. Sterner, R.W.; Elser, J.J.; Vitousek, P. Ecological stoichiometry: The biology of elements from molecules to the biosphere. Princet. Univ. Press 2017, 2, 15. [Google Scholar] [CrossRef] [Green Version]
  7. Zhou, G.Y.; Zhou, X.H.; He, Y.G.; Shao, J.J.; Hu, Z.H.; Liu, R.Q.; Zhou, H.M.; Hosseinibai, S. Grazing intensity significantly affects belowground carbon and nitrogen cycling in grassland ecosystems: A meta-analysis. Global Chang. Biol. 2017, 23, 1167–1179. [Google Scholar] [CrossRef] [PubMed]
  8. Yu, R.P.; Zhang, W.P.; Yu, Y.C.; Yu, S.B.; Lambers, A.H.; Li, L. Linking shifts in species composition induced by grazing with root traits for phosphorus acquisition in a typical steppe in Inner Mongolia. Sci. Total Environ. 2020, 712, 136495. [Google Scholar] [CrossRef]
  9. Li, W.; Cao, W.X.; Wang, J.L.; Li, X.L.; Xu, C.L.; Shi, S.L. Effects of grazing regime on vegetation structure, productivity, soil quality, carbon and nitrogen storage of alpine meadow on the Qinghai-Tibetan Plateau. Ecol. Eng. 2017, 98, 123–133. [Google Scholar] [CrossRef]
  10. Stark, S.; Männistö, M.K.; Eskelinen, A. When do grazers accelerate or decelerate soil carbon and nitrogen cycling in tundra? A test of theory on grazing effects in fertile and infertile habitats. Oikos 2015, 124, 593–602. [Google Scholar] [CrossRef]
  11. Yang, X.J.; Huang, Z.Y.; Zhang, K.L.; Cornelissen, J.H.C.; Nardoto, G.B. C:N:P stoichiometry of Artemisia species and close relatives across northern China: Unravelling effects of climate, soil and taxonomy. J. Ecol. 2015, 103, 1020–1031. [Google Scholar] [CrossRef]
  12. Zheng, S.X.; Ren, H.Y.; Li, W.H.; Lan, Z.C.; Kytöviita, M.M. Scale-Dependent Effects of Grazing on Plant C: N: P Stoichiometry and Linkages to Ecosystem Functioning in the Inner Mongolia Grassland. PLoS ONE 2012, 7, e51750. [Google Scholar] [CrossRef] [PubMed]
  13. He, N.P.; Zhang, Y.H.; Yu, Q.; Cheng, Q.S.; Pan, Q.M.; Zhang, G.M.; Han, X.G. Grazing intensity impacts soil carbon and nitrogen storage of continental steppe. Ecosphere 2011, 2, art8. [Google Scholar] [CrossRef]
  14. Gusewell, S.; Koerselman, W.; Verhoeven, J.T.A. Biomass N: P ratios as indicators of nutrient limitation for plant populations in wetlands. Ecol. Appl. 2003, 13, 372–384. [Google Scholar] [CrossRef]
  15. Zeng, Y.L.; Fang, X.; Xiang, W.H.; Deng, X.W.; Peng, C.H. Stoichiometric and nutrient resorption characteristics of dominant tree species in subtropical Chinese forests. Ecol. Evol. 2017, 3, 3527. [Google Scholar] [CrossRef] [Green Version]
  16. Han, G.D.; Hao, X.Y.; Zhao, M.L.; Wang, M.J.; Ellert, B.H.; Willms, W.; Wang, M.J. Effect of grazing intensity on carbon and nitrogen in soil and vegetation in a meadow steppe in Inner Mongolia. Agric. Ecosyst. Environ. 2008, 125, 21–32. [Google Scholar] [CrossRef]
  17. Rui, Y.C.; Wang, S.P.; Xu, Z.H.; Wang, Y.F.; Chen, C.G.; Zhou, X.Q.; Kang, X.M.; Lu, S.B.; Hu, Y.G.; Lin, Q.Y.; et al. Warming and grazing affect soil labile carbon and nitrogen pools differently in an alpine meadow of the Qinghai–Tibet Plateau in China. J. Soils Sediments 2011, 11, 903–914. [Google Scholar] [CrossRef]
  18. Cease, A.J.; Elser, J.J.; Ford, C.F.; Hao, S.; Kang, L.; Harrison, J.F. Heavy livestock grazing promotes locust outbreaks by lowering plant nitrogen content. Science 2012, 335, 467–469. [Google Scholar] [CrossRef]
  19. Douglas, A.F. Ungulate and topographic control of nitrogen: Phosphorus stoichiometry in a temperate grassland; soils, plants and mineralization rates. Oikos 2008, 117, 591–601. [Google Scholar] [CrossRef]
  20. Wang, M.; Zhang, Y.; Li, R.Q.; Cao, J.; Xin, X.P.; Zhu, X.Y.; Yan, R.R. Response of carbon, nitrogen and phosphorus stoichiometry and storage of temperate meadow plants to grazing intensity. Soil Fert. Sci. China. 2022, 22, 201–212. [Google Scholar]
  21. Zhang, W.Y.; Fan, J.W.; Zhong, H.P.; Hu, Z.M.; Song, L.L.; Wang, N. Nitrogen and phosphorus stoichiometry of dominant plant functional groups in typical grasslands in China. Acta Agrestia Sin. 2010, 18, 503–509. [Google Scholar] [CrossRef]
  22. He, J.S.; Wang, L.; Flynn, D.F.B.; Wang, X.P.; Ma, W.H.; Fang, J.Y. Leaf nitrogen: Phosphorus stoichiometry across Chinese grassland biomes. Ecol. Lett. 2008, 155, 301–310. [Google Scholar] [CrossRef]
  23. Cao, J.; Yan, R.R.; Chen, X.Y.; Wang, X.; Yu, Q.; Zhang, Y.L.; Ning, C.; Hou, L.L.; Zhang, Y.J.; Xin, X.P. Grazing Affects the Ecological Stoichiometry of the Plant–Soil–Microbe System on the Hulunber Steppe, China. Sustainability 2019, 11, 5226. [Google Scholar] [CrossRef] [Green Version]
  24. Heyburn, J.; McKenzie, P.; Crawley, M.J.; Fornara, D.A. Effects of grassland management on plant C:N:P stoichiometry: Implications for soil element cycling and storage. Ecosphere 2017, 8, e01963. [Google Scholar] [CrossRef]
  25. Bai, Y.F.; Wu, J.G.; Clark, C.M.; Pan, Q.M.; Zhang, L.X.; Chen, S.P.; Wang, Q.B.; Han, X.G.; Brian, W. Grazing alters ecosystem functioning and C:N:P stoichiometry of grasslands along a regional precipitation gradient. J. Appl. Ecol. 2012, 49, 1204–1215. [Google Scholar] [CrossRef]
  26. Toohy, P.; Fenton, O.; Holden, N.M.; Humphereys, J. The effects of treading by two breeds of dairy cow with different live weights on soil physical properties, poaching damae and herbage production on a poorly drained clay-loam soil. J. Agric. Sci. 2015, 153, 1424–1436. [Google Scholar] [CrossRef] [PubMed] [Green Version]
  27. Chen, Y.P.; Li, Y.Q.; Zhao, X.Y.; Awada, T.; Shang, W.; Han, J.J. Effects of grazing exclusion on soil properties and on ecosystem carbon and nitrogen storage in a sandy rangeland of Inner Mongolia, Northern China. Environ. Manag. 2012, 50, 622–632. [Google Scholar] [CrossRef]
  28. Yan, R.R.; Tang, H.J.; Xin, X.P.; Chen, B.R.; Murray, P.J.; Yan, Y.C.; Wang, X.; Yang, G.X. Grazing intensity and driving factors affect soil nitrous oxide fluxes during the growing seasons in the Hulunber meadow steppe of China. Environ. Res. Lett. 2016, 11, 054004. [Google Scholar] [CrossRef] [Green Version]
  29. He, J.S.; Fang, J.Y.; Wang, Z.H.; Guo, D.L.; Flynn, D.F.B.; Geng, Z. Stoichiometry and Large-Scale Patterns of Leaf Carbon and Nitrogen in the Grassland Biomes of China. Oecologia 2006, 149, 115–122. [Google Scholar] [CrossRef]
  30. Li, X.l.; Liu, Z.; Ren, W.B.; Ding, Y.; Ji, L.; Guo, F.H.; Hou, X.Y. Linking nutrient strategies with plant size along a grazing gradient: Evidence from Leymus chinensis in a natural pasture. J. Integr. Agric. 2016, 15, 1132–1144. [Google Scholar] [CrossRef] [Green Version]
  31. Liu, M.X.; Zhu, K.J. Nitrogen and phosphorus stoichiometry of different functional groups of alpine meadows on the eastern edge of the Qinghai-Tibet Plateau. Chin. J. Grassland 2013, 35, 52–58. [Google Scholar]
  32. Jiang, L.L.; Wang, S.P.; Pang, Z.; Wang, C.S.; Kardol, P.; Zhou, X.Q.; Rui, Y.C.; Chun, L.Z.; Wang, Y.F.; Xu, X.L. Grazing modifies inorganic and organic nitrogen uptake by coexisting plant species in alpine grassland. Biol. Fert. Soils. 2016, 52, 211–221. [Google Scholar] [CrossRef]
  33. Yang, Z.A.; Zhu, Q.A.; Zhan, W.; Xu, Y.Y.; Zhu, E.X.; Gao, Y.H.; Li, S.Q.; Zheng, Q.Y.; Zhu, D.; He, Y.X.; et al. The linkage between vegetation and soil nutrients and their variation under different grazing intensities in an alpine meadow on the eastern Qinghai-Tibetan Plateau. Ecol. Eng. 2018, 110, 128–136. [Google Scholar] [CrossRef]
  34. Baron, V.S.; Dick, A.C.; Mapfumo, E.; MALHI, S.S.; Naeth, M.A.; Chanasyk, D.S. Grazing impacts on soil nitrogen and phosphorus under Parkland pastures. J. Range Manag. 2001, 54, 704–710. [Google Scholar] [CrossRef]
  35. Risch, A.C.; Schutz, M.; Vandegehuchte, M.L.; Van, D.P.W.H.; Duyts, H.; Raschein, U.; Gwiazdowicz, D.J.; Busse, M.D.; Page, D.D.S.; Zimmermann, S. Aboveground vertebrate and invertebrate herbivore impact on net N mineralization in subalpine grasslands. Ecology 2015, 96, 3312–3322. [Google Scholar] [CrossRef] [Green Version]
  36. Faghihinia, M.; Zou, Y.; Chen, Z.; Bai, Y.F.; Li, W.H.; Marrs, R.; Staddon, P. The response of grassland mycorrhizal fungal abundance to a range of long-term grazing intensities. Rhizosphereneth 2020, 13, 100178. [Google Scholar] [CrossRef]
  37. Li, Y.J.; Zhu, Y.; Zhao, J.N.; Li, G.; Wang, H.; Lai, X.; Yang, D.L. Effects of Rest Grazing on Organic Carbon Storage in Stipa grandis Steppe in Inner Mongolia, China. J. Integr. Agric. 2014, 13, 624–634. [Google Scholar] [CrossRef]
  38. Scogings, P.F.; Hjältén, J.; Skarpe, C. Does large herbivore removal affect secondary metabolites, nutrients and shoot length in woody species in semi-arid savannas? J. Arid. Environ. 2013, 88, 4–8. [Google Scholar] [CrossRef] [Green Version]
  39. Dybzinski, R.; Fargione, J.E.; Zak, D.R.; Fornara, D.; Tilman, D. Soil fertility increases with plant species diversity in a long-term biodiversity experiment. Oecologia 2008, 158, 85–93. [Google Scholar] [CrossRef]
  40. Reich, P.B.; Oleksyn, J. Global patterns of plant leaf N and P in relation to temperature and latitude. Proc. Natl. Acad. Sci. USA 2004, 101, 11001–11006. [Google Scholar] [CrossRef] [Green Version]
  41. Song, S.S.; Zhu, J.L.; Zheng, T.L.; Tang, Z.Y.; Zhang, F.; Ji, C.J.; Shen, Z.H.; Zhu, J.X. Long-term grazing exclusion reduces species diversity but increases community heterogeneity in an alpine grassland. Front. Ecol. Evol. 2020, 8, 66. [Google Scholar] [CrossRef] [Green Version]
  42. Xu, X.Y.; Zhang, W.Q.; Li, J.X.; Zhao, L.M.; Ulan, T.T.; Wan, Z.Q. Response of carbon and nitrogen contents of soil and dominant plants to grazing intensity in steppe of Stipa krylovii. Acta Agrestia Sin. 2022, 30, 2255–2263. [Google Scholar] [CrossRef]
  43. Stefan, L.; Michael, B.E.; Amir, M. Effects of grazing control on ecosystem recovery, biological productivity gains, and soil carbon sequestration in long-term degraded loess farmlands in the Northern Negev, Israel. Land Degrad. Dev. 2021, 32, 2580–2594. [Google Scholar] [CrossRef]
  44. Veldhuis, M.P.; Gommers, M.I.; Olff, H.; Berg, M.P. Spatial redistribution of nutrients by large herbivores and dung beetles in a savanna ecosystem. J. Ecol. 2018, 106, 422–433. [Google Scholar] [CrossRef] [Green Version]
  45. Poorter, H.; Niklas, K.J.; Reich, P.B.; Oleksyn, J.; Poot, P.; Mommer, L. Biomass allocation to leaves, stems and roots: Meta-analyses of interspecific variation and environmental control. New Phytol. 2012, 193, 30–50. [Google Scholar] [CrossRef] [PubMed]
  46. Desurmont, G.A.; Agrawal, A.A. Do plant defenses predict damage by an invasive herbivore? A comparative study of the viburnum leaf beetle. Ecol. Appl. 2014, 24, 759–769. [Google Scholar] [CrossRef] [PubMed]
  47. Hedin, L.O. Global organization of terrestrial plant nutrient interactions. Proc. Natl. Acad. Sci. USA 2004, 101, 10849–10850. [Google Scholar] [CrossRef] [Green Version]
  48. Dong, X.Y.; Fu, H.; Li, X.D.; Niu, D.C.; Guo, D.; Li, X.D. Effects of grazing and enclosure on biomass and carbon, nitrogen and phosphorus storage of typical steppe plants on the Loess Plateau. Acta Prata. Sin. 2010, 19, 175–184. [Google Scholar] [CrossRef]
  49. Song, S.S.; Zhang, J.S.; Zheng, T.L.; Zhang, F.; Zhu, J.X. Effects of fence closure on carbon storage in alpine meadow vegetation in Qinghai-Hebei. Prata. Sci. 2020, 37, 2414–2421. [Google Scholar] [CrossRef]
  50. Wang, S.L.; Hou, F.J. Short-term study on the yak dung seed bank on the Qinghai-Tibetan Plateau: Effects of grazing season, seed characteristics and forage preferences. Plant Soil 2021, 465, 367–383. [Google Scholar] [CrossRef]
  51. Fan, Y.J.; Hou, X.Y.; Shi, H.X.; Shi, S.L. Effects of grazing and fencing on carbon and nitrogen reserves in plants and soils of alpine meadow in the three headwater resource regions. Russ. J. Ecol. 2013, 44, 80–88. [Google Scholar] [CrossRef]
Figure 1. Diagram of different grazing intensities. Note: The upper letter is the “test plot number”, where W-west, M-middle, E-east; the lower numbers and letters are “livestock grazing intensity”.
Agronomy 12 03057 g001
Figure 2. Variation in the nutrient content of plant functional groups under different grazing intensities. Note: Lowercase letters represent significant differences between different grazing intensities, and uppercase letters represent significant differences between functional groups (p < 0.05).
Agronomy 12 03057 g002
Figure 3. Variation in C/N (af), C/P (gl) and N/P (mr) ratios of plant functional groups under different grazing intensities. Note: Lowercase letters represent significant differences between different grazing intensities (p < 0.05).
Agronomy 12 03057 g003
Figure 4. Variation in nutrient storage amounts of plant functional groups under different grazing intensities. Note: Lowercase letters represent significant differences between different grazing intensities, and uppercase letters represent significant differences between functional groups (p < 0.05).
Agronomy 12 03057 g004
Figure 5. Correlation between nutrient content, stoichiometry and storage in plant functional groups. * 0.01 < p ≤ 0.05, ** 0.001 < p ≤ 0.01, *** p ≤ 0.001.
Agronomy 12 03057 g005
Table 1. Changes in the species composition of functional groups under different grazing intensities.
Grazing IntensityGramineaeCompositaeLeguminosaeRanunculaceaeCyperaceaeOther Groups
G0.00Leymus chinensis,
Achnatherum sibiricum Keng,
Stipa baicalensis
Artemisia laciniata Linn, Artemisia dracunculu L., Serratula centauroides CassPulsatilla turczaninovii Kryl, Thalictrum squarrosum StephCarex duriuscula L.,
Carex pediformis
Astragalus melilotoides Pall,
Vicia amoena Fisch
Schizonepeta multifida Linn, Galium verum Linn, Potentilla bifurca
G0.23Leymus chinensis,
Achnatherum sibiricum,
Stipa baicalensis
Artemisia laciniata, Artemisia frigida, Heteropappus altaicus NovopokrPulsatilla turczaninovii, Thalictrum squarrosumCarex duriuscula,
Carex pediformis
Astragalus adsurgens Pall, Astragalus melilotoides, Vicia amoenaSchizonepeta multifida, Galium verum, Potentilla bifurca
G0.34Leymus chinensis,
Achnatherum sibiricum,
Stipa baicalensis
Artemisia laciniata, Artemisia dracunculus, Artemisia frigidaPulsatilla turczaninovii, Thalictrum squarrosumCarex duriuscula,
Carex pediformis
Astragalus adsurgens, Astragalus melilotoides, Vicia amoenaSchizonepeta multifida, Galium verum, Potentilla bifurca
G0.46Leymus chinensis,
Koeleria macrantha Schult,
Cleistogenes squarrosa
Artemisia laciniata, Artemisia frigidaPulsatilla turczaninovii, Thalictrum squarrosumCarex duriuscula,
Carex pediformis
Oxytropis myriophylla Pall, Astragalus adsurgens, Vicia amoenaSchizonepeta multifida, Galium verum, Potentilla tanacetifolia Willd
G0.69Koeleria macrantha,
Cleistogenes squarrosa
Artemisia laciniata, Artemisia frigidaPulsatilla turczaninovii, Thalictrum squarrosumCarex duriuscula,
Carex pediformis
Medicago falcata L., Oxytropis myriophylla, Astragalus adsurgensSchizonepeta multifida, Potentilla acaulis L., Potentilla bifurca
G0.92Koeleria macrantha,
Cleistogenes squarrosa
Artemisia laciniata, Artemisia frigidaPulsatilla turczaninovii, Thalictrum squarrosum, Thalictrum petaloideum LCarex duriusculaOxytropis myriophylla, Astragalus adsurgensSchizonepeta multifida, Potentilla acaulis, Gentiana squarrosa Ledeb
Table 2. Biomass and percentage of different functional groups.
Grazing IntensityG0.00G0.23G0.34G0.46G0.69G0.92
Gramineaebiomass
(g/m2)
164.41 ± 53.69 a135.91 ± 27.20 ab127.58 ± 16.78 ab61.69 ± 14.44 bc22.66 ± 7.32 c17.08 ± 3.62 c
Proportion
(%)
45.9541.6743.0824.8315.4417.31
CompositaeBiomass
(g/m2)
27.72 ± 1.55 b49.53 ± 12.11 ab58.83 ± 12.95 ab65.05 ± 12.77 a43.18 ± 11.07 ab39.07 ± 9.43 ab
Proportion
(%)
8.2715.2420.3827.4230.5938.72
LeguminosaeBiomass
(g/m2)
14.37 ± 3.05 a10.08 ± 2.09 ab5.87 ± 0.79 bc4.91 ± 1.67 bc3.97 ± 1.84 bc1.19 ± 0.20 c
Proportion
(%)
4.443.142.042.112.761.21
RanunculaceaeBiomass
(g/m2)
42.20 ± 13.64 a39.45 ± 1.83 a28.96 ± 0.76 a28.84 ± 5.53 a7.63 ± 2.25 b3.46 ± 1.63 b
Proportion
(%)
13.3112.289.9211.685.233.3
Cyperaceaebiomass
(g/m2)
53.19 ± 30.28 a43.20 ± 18.68 a44.90 ± 6.93 a44.91 ± 2.23 a38.20 ± 14.39 a10.14 ± 2.92 a
Proportion
(%)
14.7913.7815.2818.528.1710.13
other groupsbiomass
(g/m2)
45.78 ± 8.74 a44.61 ± 2.74 a27.88 ± 6.00 a37.80 ± 8.87 a24.88 ± 2.44 a27.26 ± 6.93 a
Proportion
(%)
13.2413.889.315.4617.8129.34
Note: Different letters indicate significant difference (p < 0.05), while same letters indicate no significant difference (p > 0.05).
Publisher’s Note: MDPI stays neutral with regard to jurisdictional claims in published maps and institutional affiliations.

