Article

Distribution of Heavy Metals and Organic Compounds: Contamination and Associated Risk Assessment in the Han River Watershed, South Korea

Han River Environment Research Center, National Institute of Environmental Research, 42, Dumulmeori-gil 68beon-gil, Yangseo-myeon, Yangpyeong-gun 12585, Gyeonggi-do, Republic of Korea
*
Author to whom correspondence should be addressed.
Agronomy 2022, 12(12), 3022; https://doi.org/10.3390/agronomy12123022
Submission received: 24 October 2022 / Revised: 23 November 2022 / Accepted: 28 November 2022 / Published: 29 November 2022

Abstract

:
Given water pollution increases in aquatic ecosystems resulting from industrialization and rapid urbanization, appropriate treatment strategies to alleviate water pollution are crucial. The spatiotemporal distribution, sources, and potential risk of heavy metals and organic compounds were determined in surface water from the Han River watershed (n = 100) in wet and dry seasons. The inductively coupled plasma mass spectrometer (Cr and As), mercury analyzer (Hg), and ultra-high performance liquid chromatography tandem mass spectrometer (organic compounds) were used to analyze the target compounds. Total concentration and detection frequency were in the order: Cr (2.375 µg/L, 100%) > As (1.339 µg/L, 100%) > Hg (0.007 µg/L, 100%) for heavy metals, and carbofuran (0.051 µg/L, 75%) > bisphenol A (0.040 µg/L, 47%) > quinoline (0.020 µg/L, 32%) for organic compounds. The target compounds showed the highest concentration in the area near industrial facilities. High concentrations and risk levels of all target compounds, except quinoline, were observed during the wet season. Principal component analysis indicated anthropogenic activities were the primary source of pollution. Cr showed the most prominent environmental impact in the wet season, suggesting its ecological risk. Additional monitoring is required for clear risk pollutant assessments in aquatic ecosystems to aid policy implementation.

1. Introduction

There has been a rise in the environmental levels of anthropogenic pollutants as a result of industrialization and rapid urbanization; this has resulted in increased awareness of aquatic ecosystem crisis caused by water pollutants [1,2,3,4].
Pollution of environmental matrices such as water, soil, and groundwater are primarily caused by heavy metals, pesticides, and hormone disruptors. These toxins are released as a result of anthropogenic and industrial activities such as emissions from coke furnace plants [5]. The appropriate treatment strategy must, therefore, be selected to restore these matrices without causing long-term damage to the existing environment.
Pollution by heavy metals (Cr, Ag, and Hg) is critical because of their potential toxicity to both the environment and humans [6,7]. Some metals are required as micronutrients to support the life processes of animals and plants, whereas others have no recognized physiological implications [8,9]. Metals are non-biodegradable and can accumulate in the human body, damaging the neurological system and internal organs [6,10]. They enter rivers in a variety of ways, including mine discharge, runoff, chemical weathering of rocks and soils, wet and dry fallout of air particulate matter [11,12,13], and discharge of untreated industrial effluents from mining sites [14].
Pesticides are also identified as hazardous water pollutants. These are employed to kill certain target organisms; however, they also pose unintended risks to non-target organisms, such as soil bacteria, birds, and humans [15]. Pesticides have been reported to cause cancer, chronic renal disease, male and female sterility, genotoxicity, and reproductive, physiological, neurological, behavioral, and endocrine defects [15,16]. In addition, owing to their widespread agricultural and non-agricultural applications, they have been detected in a variety of environmental matrices [17]. In particular, quinoline may have adverse effects on human health such as insomnia, abdominal discomfort, and cancer while carbofuran has relatively high toxicity among pesticides and causes irreversible neurological damage and developmental disorders in fetuses and children [18,19,20].
An endocrine-disrupting chemical (EDC), Bisphenol A (BPA), has been found in a number of aquatic habitats, including surface and groundwater, industrial effluents, landfill leachates, and stream water [21]. EDCs interact with the human endocrine system and dysregulate it by replicating or affecting the functioning of natural hormones, therefore posing major risks to human health [22]. In particular, BPA is extremely hazardous to aquatic and native flora and fauna [23]. It is a commonly used chemical in the manufacturing of epoxy resins and polycarbonate-based polymers [24]. The broad distribution of BPA in nature, including land, aquatic resources, and sediments, as well as human tissues, is caused by the direct or indirect discharge of industrial and domestic solid wastes and effluents into water resources or landfills. Furthermore, BPA being one of the most persistent organic chemicals, remains undegraded for decades after being released into water or soil [25].
The introduction of anthropogenic pollutants into water poses a potential threat to human health and the aquatic ecosystem [6,15]. The distribution characteristics of hazardous compounds have been reported to vary according to seasons and geographic locations, as assessed via multivariate statistical techniques, such as factor/principal component analysis (FA/PCA) and cluster analysis (CA) [26,27]. Traces of heavy metals, pesticides, and EDCs have been detected in surface water, drinking water, and sewage treatment plant effluents of India [9,16], China [6], Japan [28], Bangladesh [19,29], Romania [11], and Pakistan [30], indicating incomplete removal of these compounds in sewage treatment facilities. Therefore, to improve existing sewage treatment processes, alternative techniques such as biological treatment, and adsorption have been adopted [17,21,22,23].
Among the four major rivers in South Korea (Han, Nakdong, Gum, and Yeongsan), the distribution and risk assessment of three heavy metals were performed in the Nakdong river watershed [31], and only 11 heavy metal concentration studied were conducted in the Yeongsan River watershed [32]. Therefore, it is necessary to investigate not only the distribution of heavy metals, but also the risk assessment in the Han River watershed, the largest water source in South Korea.
Our study was conducted on twelve selective organic and inorganic compounds detected in the Han River watershed, the largest water source in South Korea. The study’s objectives were to: (1) analyze the spatiotemporal distribution patterns of the selected compounds, (2) explore their sources using multivariate statistics, and (3) assess the risk posed by these compounds on algae, invertebrates, and fish, using hazard quotient (HQ). The study’s results can be applied to increase water management efficiency to help protect water resources and prevent contamination of the environment caused by hazardous trace elements through water sources.

2. Materials and Methods

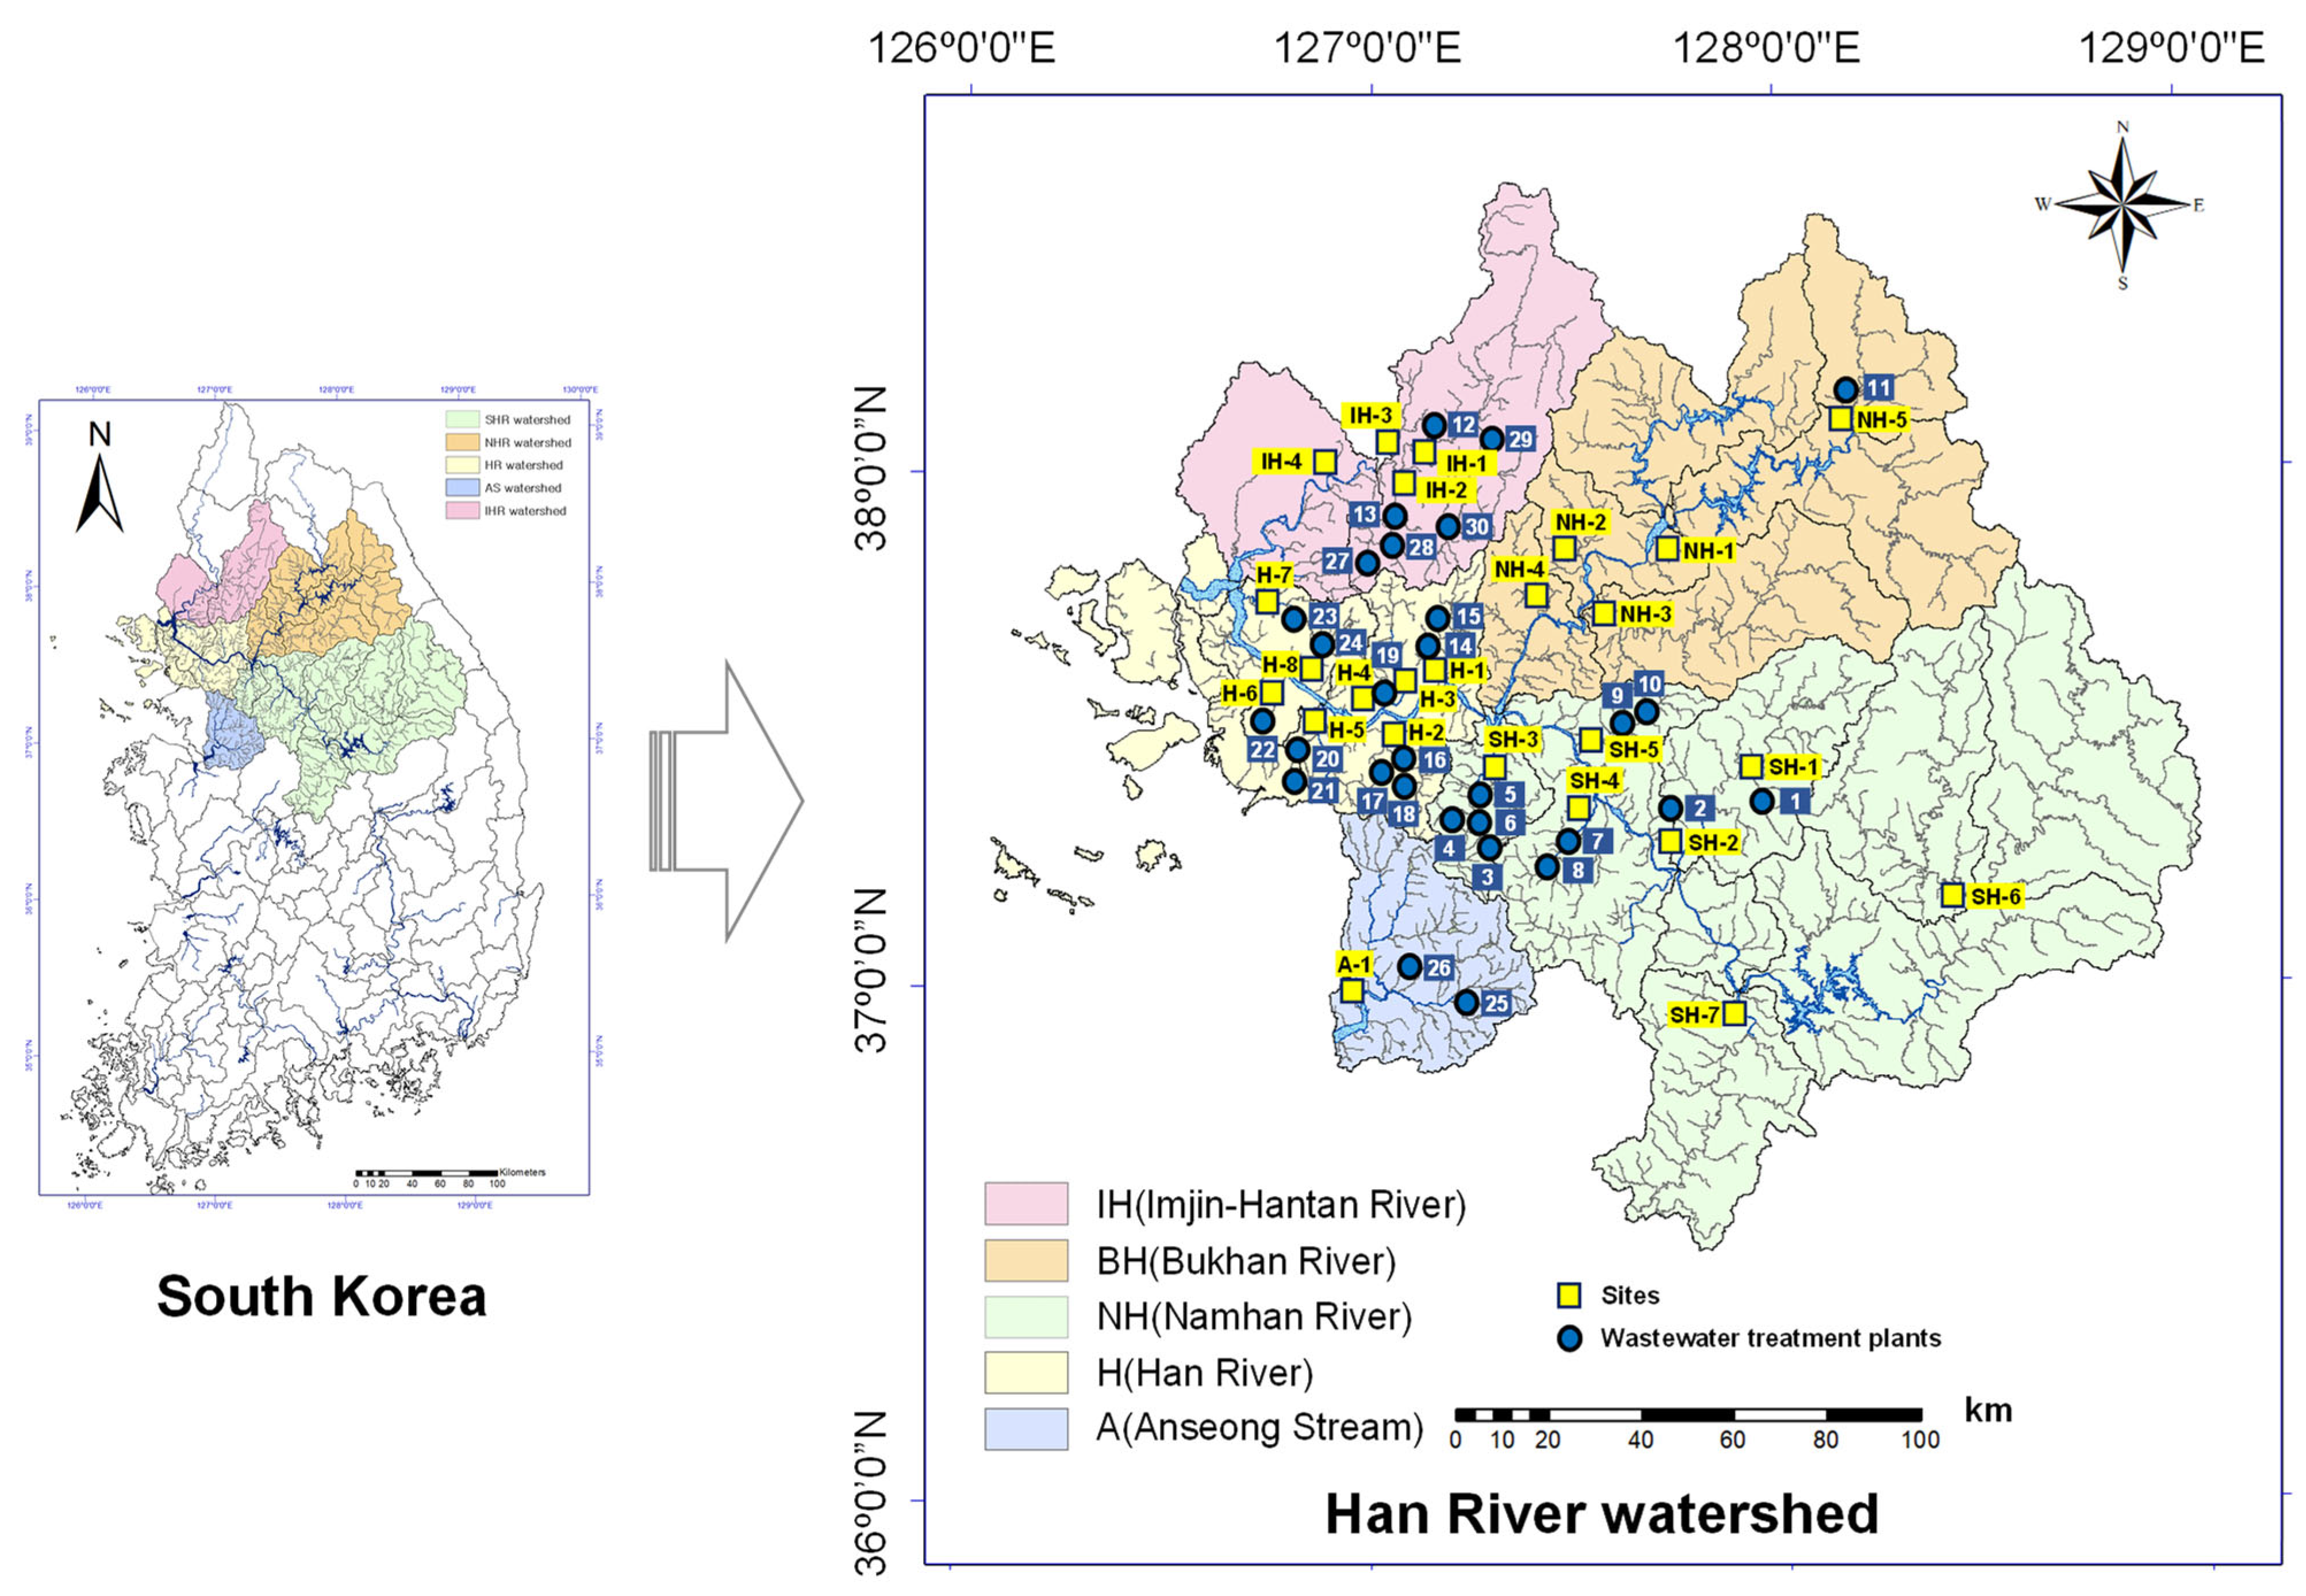
2.1. Description of the Study Area

This study focused on the Han River watershed, which is the largest watershed in Korea with an area of 26,219 km2 and provides drinking water to 26 million people residing in the surrounding area [33]. The Han River watershed is located in Seoul, the capital of Korea, which has a high population density, and Gyeonggi-do, where population inflow is steadily increasing. Based on its geographical characteristics, the Han River watershed is divided into five areas: the Nam Han River (NH), Buk Han River (BH), Han River (H), Imjin Hantan River (IH), and Ansancheon Stream (A). A constant and systematic assessment of river water quality is essential, as it may be largely affected by anthropogenic activities in industrial, densely populated, agricultural, and livestock areas. Representative points were selected for each of the five areas and the surface water samples were monitored four times in 2014 from 10 to 15 June, 7 August to 11 September, 8 to 16 October, and 29 October to 6 November. A total of 100 samples were obtained from 25 sites. A map of the Han River watershed and its collection sites are shown in Figure 1.

2.2. Chemicals, Sampling, and Analytical Procedure

Three heavy metals (Cr, As, and Hg) and nine organic compounds (aldicarb, methomyl, molinate, 2-methyl-4-chlorophenoxyacetic acid (MCPA), carbaryl, 2,4-dichlorophenoxyacetic acid (2,4-D), carbofuran, BPA, and quinoline) were selected. These target compounds were chosen based on their detection frequency in water in South Korea [34]. A multi-element standard (environmental calibration standard 5183-4688, Agilent, Santa Clara, CA, USA) was used for the heavy metal analysis. The analytical standard of nine organic compounds (purity > 99%) was obtained from Sigma-Aldrich Co. (St. Louis, MO, USA).
Water samples were collected in polypropylene bottles at 4, 6, 9, and 11 h from 25 sampling sites in the Han River watershed (Figure 1). Samples were collected from the center of the stream to obtain representative stream specimens. One part of the sample was immediately acidified with dilute nitric acid to adjust the pH to <2, and transported to the laboratory below 4 °C. Filters were used to remove suspended solids prior to analysis. To maintain the accuracy and precision of the analysis, procedural blanks, sample duplicates, and repeated experiments were performed to ensure quality control and detection. The concentrations of Cr and As were determined using inductively coupled plasma mass spectrometry (ICP-MS 7900, Agilent, Santa Clara, CA, USA), and the Hg concentration was determined using a mercury analyzer (Hydra IIAF Gold, Teledyne Leeman Labs, Hudson, NH, USA) (Table S1). The pesticides were subjected to solid phase extraction (SPE) and analyzed by ultra-high-performance liquid chromatography tandem mass spectrometry (UPLC-MS/MS, Agilent, Santa Clara, CA, USA) (Table S2).
The detection limits for Cr, As, Hg, aldicarb, methomyl, molinate, MCPA, carbaryl, 2,4-D, carbofuran, BPA, and quinoline were 0.02, 0.024, 0.00012, 0.003, 0.0018, 0.0014, 0.0011, 0.0027, 0.0017, 0.0012, 0.0015, and 0.0022 μg/L, respectively (Table S3). These data produced satisfactory results, with analytical errors ≤20% for each element. Linearity of the standard calibration (R2 > 0.99) and the equation of the target compounds are presented in Table S4.

2.3. Risk Assessment

A deterministic approach was used to compare environmental exposure and toxicity. In this approach, the risk quotient (RQ) is defined as the measured environmental concentration (MEC) divided by predicted no-effect concentration (PNEC) [35]. The aquatic risk assessment of the heavy metals (Cr, Ar, and Hg) and agrochemicals (molinate, carbofuran, and quinoline) was performed using the RQ method presented as Equation (1). Risk characterization was divided into four levels: negligible risk (RQ < 0.01), low risk (0.01 ≤ RQ < 0.1), medium risk (0.1 ≤ RQ < 1), and high risk (RQ ≥ 1) [4].
RQ = MEC / PNEC
where PNEC is the predicted no-effect concentration, and MEC is the mean concentration of heavy metals detected in the environment. According to Wang et al. [21] and ECJRC [35], the PNEC was calculated by dividing the hazardous concentration by the evaluation factor (AF = 5). Based on supporting evidence, such as multispecies data, non-native species, and the presence of field data, a five-point assessment factor was chosen. Laboratory toxicity data are more accurate because of the assessment components. The US EPA ECOTOX database [36] was used to acquire information on heavy metal toxicity, such as effective concentration (EC50) and lethal concentration (LC50), as indicated in the Supplementary Materials (Table S4).

2.4. Statistical Analysis

Mathematical calculations were performed using Microsoft Excel 2019 (Microsoft Co., Redmond, WA, USA). Multivariate statistical analyses, such as PCA and one-way analysis of variance (ANOVA), were carried out using the Statistical Package for the Social Sciences (SPSS 22, IBM Corp., Armonk, NY, USA) and Minitab 15 (Minitab Inc., State College, PA, USA). Significance was set at p ≤ 0.05 and 95% confidence intervals. Relevant figures were plotted using SigmaPlot 12.0 (Systat Inc., Point Richmond, CA, USA) and Microsoft PowerPoint 2019 (Microsoft Co., Redmond, WA, USA). ArcGIS 9.2 (ESRI, Redlands, CA, USA) was used for map plotting.

3. Results and Discussion

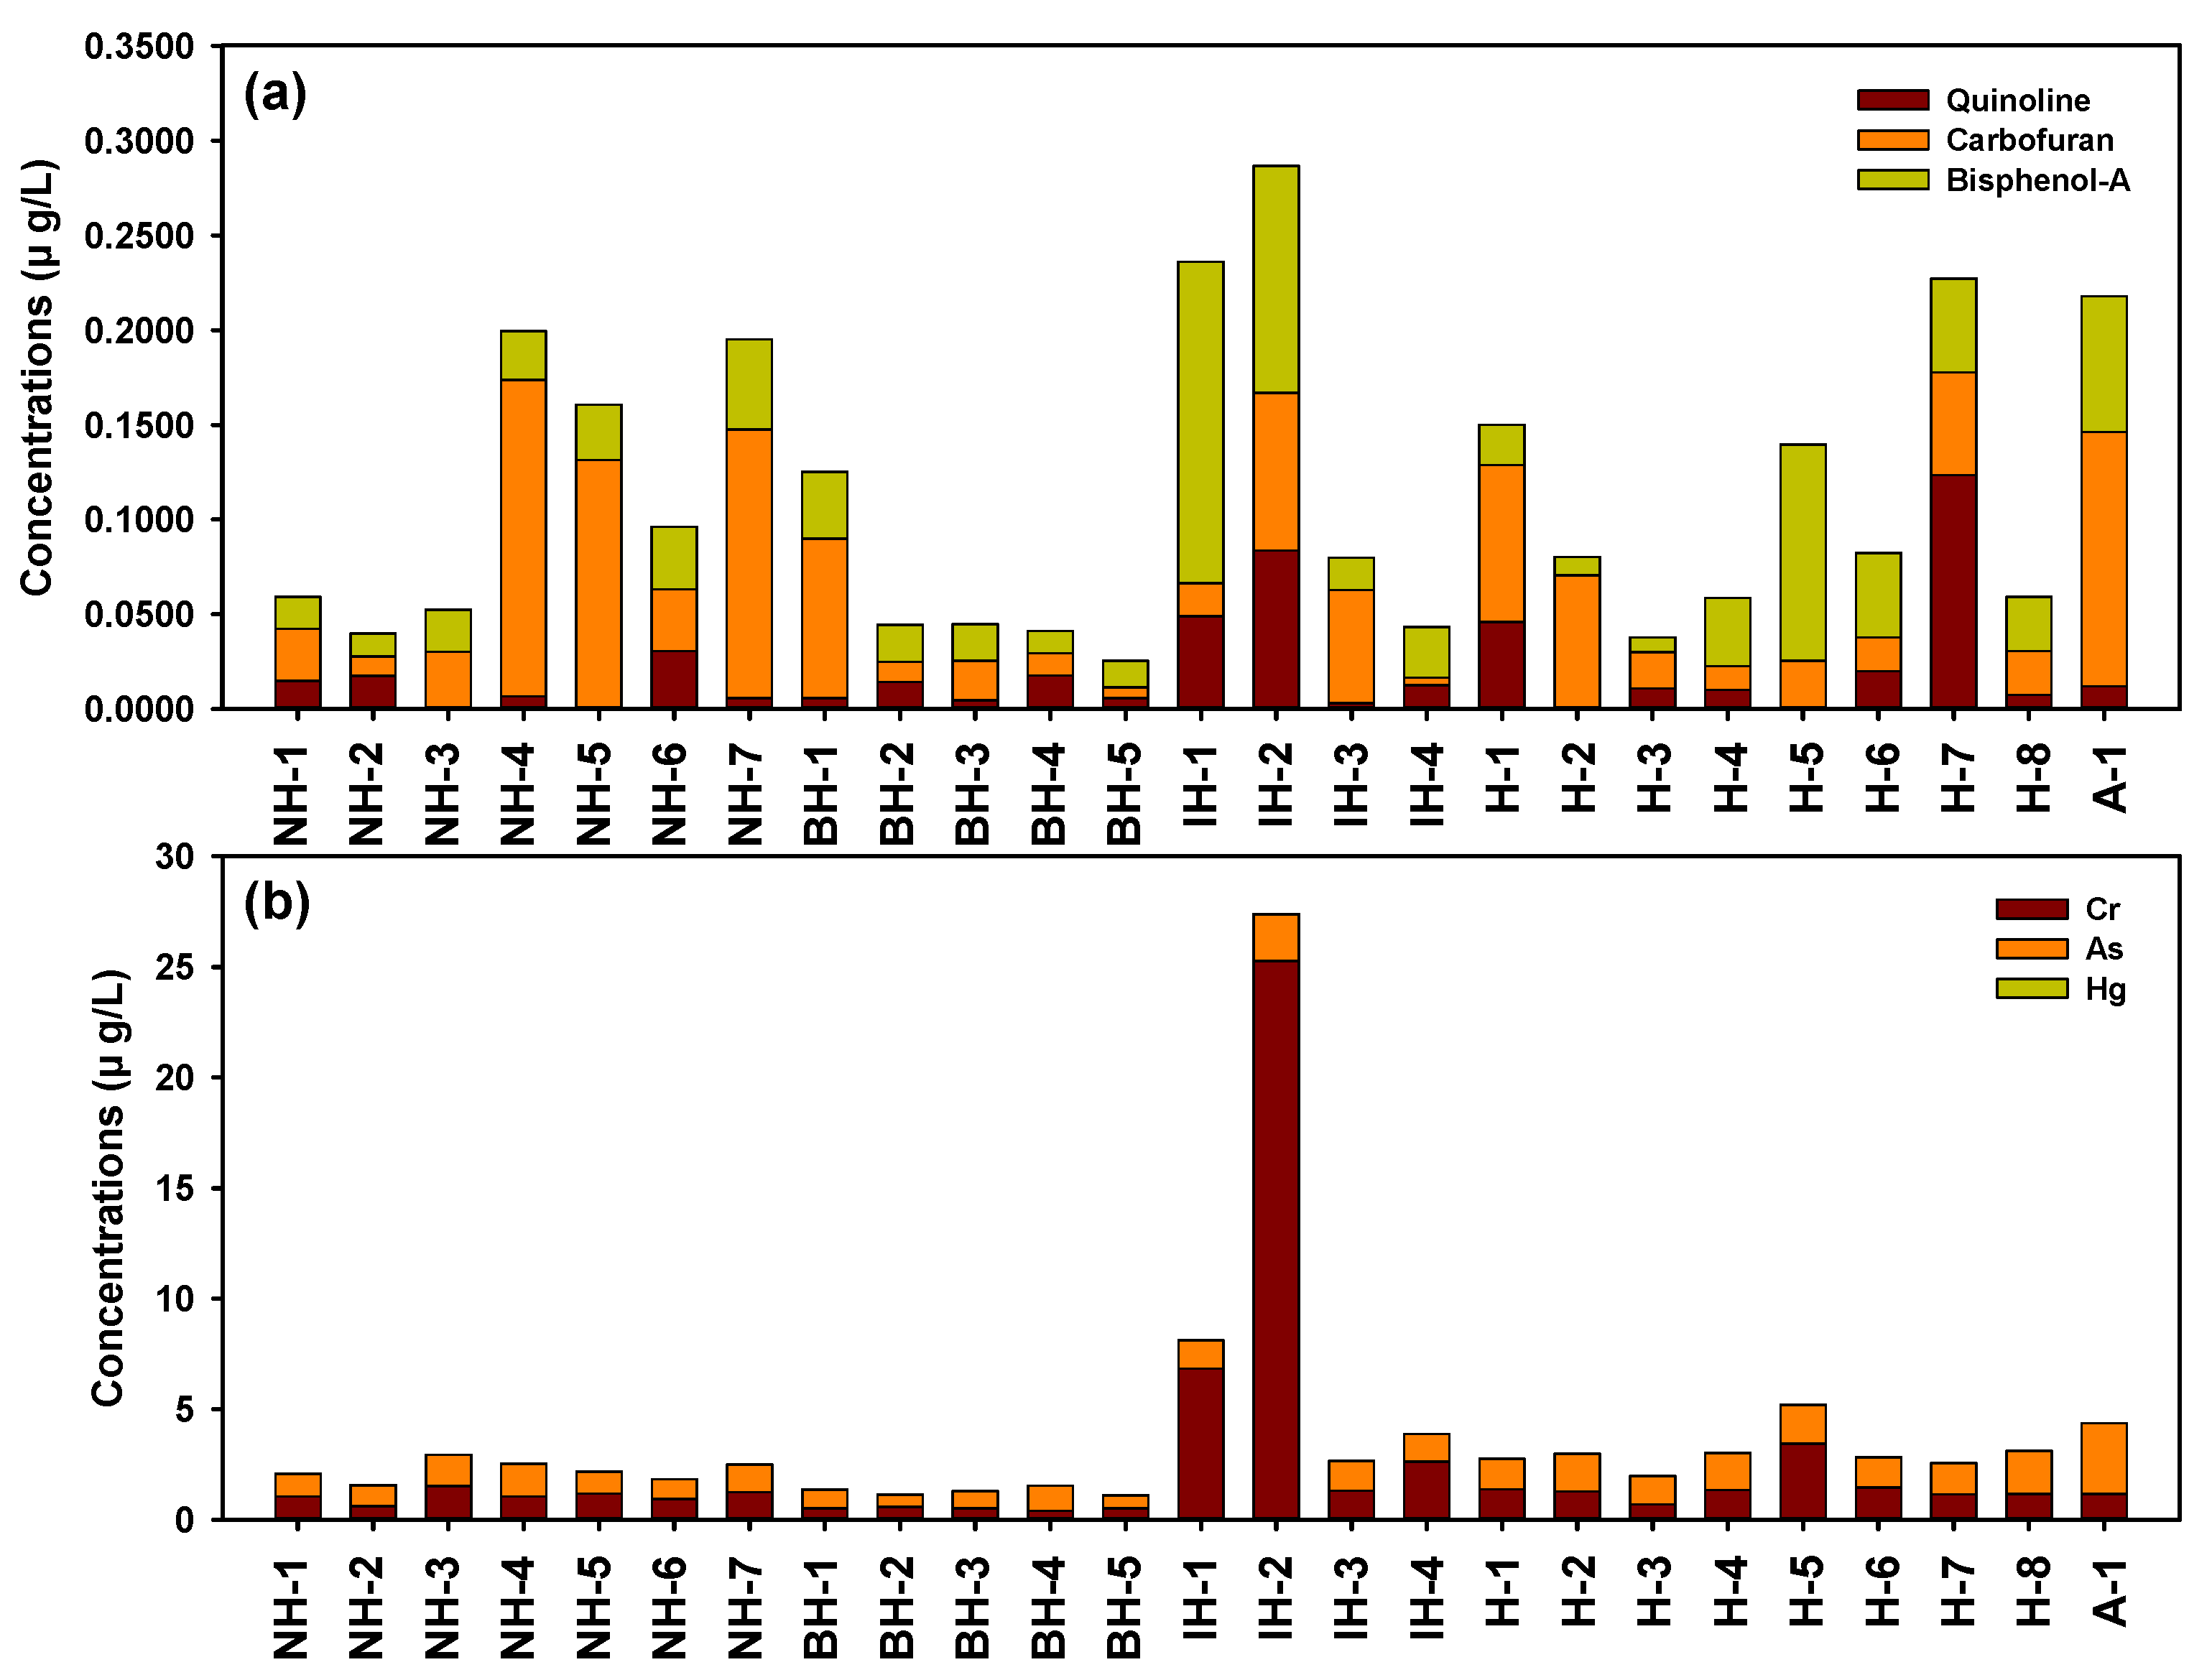
3.1. Spatiotemporal Distribution of Organic and Inorganic Compounds

The concentrations and detection frequency of the chosen heavy metals and organic compounds in the samples are shown in Table 1. The undetected compounds and those with a detection frequency < 10% were excluded from the results of this study. As shown in Table 1, the total concentrations of the analyzed metal and organic compound contents at the sample sites were ranked in the following order: Cr (2.375 μg/L, 100%) > As (1.339 μg/L, 100%) > Hg (0.007 μg/L, 100%), and carbofuran (0.051 μg/L, 75%) > bisphenol A (0.040 μg/L, 47%) > quinoline (0.020 μg/L, 32%).
Quantitative differentiation of the target compounds in the investigated sites was indicated by the spatiotemporal concentration-dependent distribution of the three heavy metals and three organic compounds. Figure 2 summarizes the target compound concentrations in the samples collected from the study area.
In addition, in the five groups according to the sampling location, the concentration of the organic compounds was in the order IH > A > NH > H > BH, and that of the heavy metals showed a trend of IH > A > H > NH > BH, as presented in Figure 3. Both the organic compounds and heavy metals were detected at the highest concentration at IH-2, attributed to nearby factory wastewater and non-point pollution sources. The IH-2 site area consists of Paddy fields (193 km2), Forested land (132 km2), and Cropland (203 km2), and there are three WTPs (total 110,000 × 103 m3/day) upstream of the IH-2.
In this study, the concentration of Cr varied from 0.120–42.220 μg/L, with a mean value of 2.375 μg/L (Table 1). The highest Cr concentration (25.268 μg/L) was recorded in IH-2, contributing 42.55% of all sites (Figure 2). In addition, the mean Cr concentration during the wet season (2.495 μg/L) was 1.1 times higher than that during the dry season (2.255 μg/L) (Figure 4a). It appears that Cr was introduced into a nearby river as a non-point source.
As a dietary supplement and necessary nutrient for humans, Cr (III) is frequently prescribed with vitamins. It is comparatively less harmful than As; however, it is toxic at high concentrations. It has been widely acknowledged that Cr (VI) may cause cancer in humans [37].
The concentration of As ranged from 0.120–5.580 μg/L, with a mean value of 1.339 μg/L (Table 1). The maximum distribution of the metal (9.54%) was observed in A-1 for all the selected sites (Figure 2). Additionally, the highest concentration of As contributed 9.54% (2.113 μg/L) of the total distribution of all sites. The mean As concentration in the wet season (2.055 μg/L) was 3.3 times higher than that in the dry season (0.623 μg/L) (Figure 4b). The concentration difference between the two seasons may be attributed to a higher influx impact of non-point sources during the wet season rainfall compared to that of the associated dilution effect [38].
The point sources of metal intrusion are typically industrialization, mining, and improper management of ores and fertilizers containing As [29,39]. The non-point sources comprise alterations in bedrock composition, intense rainfall, hydrolytic modification, and ecosystem change [1,40]. In its inorganic form, As can prove to be toxic to humans and cause a fatal disease, arsenicosis. It also has carcinogenic potential and has been reported to cause skin, lung, and bladder cancers [41].
Hg is a hazardous element that enters the environment as a result of both natural and anthropogenic activities [42]. Methyl-Hg (Me-Hg) is toxic and when consumed, is absorbed in the digestive tract at levels of 1–10%. The absorbed inorganic Hg comprises 7–15% of the ionic form, which quickly spreads to the blood and organs [43].
Hg compounds can harm the growing fetus, kidneys, and brain. Additionally, increased exposure to Hg can negatively impact neurological functioning and cause tremors, irritation, and changes in vision and hearing [42].
In this study area, the Hg concentration ranged between 0.001–0.045 μg/L, with a mean value of 0.007 μg/L (Table 1). The highest concentration of Hg (0.027 μg/L) was recorded in H-6 contributing 14.59% of all the sites and accounting for 0.2% of all metals (Figure 2). The Hg concentration was the highest at HR-6; however, the Hg levels recorded for all sites were at an overall low range and the site-based differences were insignificant. The mean Hg concentration in the wet season (0.009 μg/L) was 1.5 times higher than that in the dry season (0.006 μg/L) (Figure 4c).
At the IH-2, Cr was present at the highest concentration, followed by As and Hg. This may be because the Cheongsan Daejeon General Industrial Complex (188, 218 m2; textile product manufacturing) is located 500 m upstream of this point and neighbored by five gas stations, one auto repair station, Dongducheon General Industrial Complex (262, 160 m2, textile product manufacturing), Dongducheon 2 General Industrial Complex (186,228.7 m2, electrical equipment manufacturing) and Sangbongam General Industrial Complex (54, 521.6 m2). High metal concentrations in this area may be due to the location of the food manufacturing and electrical equipment manufacturing industries, and it was considered that point and non-point pollution sources acted in a complex way.
One of the recently identified pollutants is quinoline, a heterocyclic aromatic compound. It is frequently used in the pharmaceutical industry as an antibiotic, antimalarial, antibacterial, or antiseptic [44]. Quinoline and its derivatives contribute to environmental contamination owing to their poisonous, carcinogenic, and teratogenic properties. Quinoline can negatively impact the environment and also causes headaches, nausea, and insomnia in humans [45].
The measured concentration of quinoline in the river water ranged from 0.003–0.388 μg/L, with a mean value of 0.020 μg/L (Table 1). The maximum concentration of quinoline (24.48%, 0.124 μg/L) was observed in H-7 and accounted for 18.13% of all the river water organic compounds (Figure 2). The detection of quinoline in an aquatic environment is attributed to coal tar, petroleum, and industrial wastewater, which are considered anthropogenic sources [46,47].
Carbofuran is yet another pesticide used worldwide and is known for its toxicity, carcinogenicity, and mutagenicity [19,48]. Carbofuran-polluted soil and water systems may negatively affect people, animals, and microbes. Carbofuran in drinking water can cause irreversible neurological damage in living organisms, resulting in attention-deficit hyperactivity and developmental disorders in fetuses and children [19]. In addition, carbofuran is currently used for intentional poisoning; hence, it can be regarded as a new environmental toxin [48,49].
The concentration of carbofuran in the river water samples ranged from 0.002 to 0.560 μg/L, with a mean value of 0.051 μg/L (Table 1). NH-4 contributed 13.07% of the carbofuran of all sites, and carbofuran ranked the highest in terms of concentration (0.167 μg/L) in all the selected sites (Figure 2). Natural activities in the river basin as well as polluted waste could account for high carbofuran concentrations.
Polycarbonate plastics and epoxy resins are reported to account for 65% and 30% of BPA output, respectively. In addition, thermal paper, sulfides, insecticides, leather tanning agents, and electronic devices are identified as the principal end-uses of BPA [50]. BPA is an endocrine disruptor that interacts with a range of physiological receptors and negatively affects the immunological, circulatory, metabolic, neurological, and reproductive systems [51].
In our study samples, the concentration of BPA varied from 0.004–0.644 μg/L, with a mean value of 0.040 μg/L (Table 1). The maximum concentration of BPA (0.170 μg/L) was recorded in IH-1 accounting for 36.0% of the concentration all the selected organic compounds (Figure 2). The attribution of BPA in an aquatic environment from mineral fertilizers may be considered an anthropogenic source.
The highest cumulative total concentration of organic compounds was recorded in IH-2, and this was consistent with the trend of heavy metals, as shown in Figure 2, which may be attributed to nearby industrial facilities. The distributional trends of carbofuran and BPA were similar to those of the heavy metals, and relatively high concentrations were observed in the wet season; however, the opposite trend was observed for quinoline (Figure 4d,f). This may be attributed to its highly volatile nature.

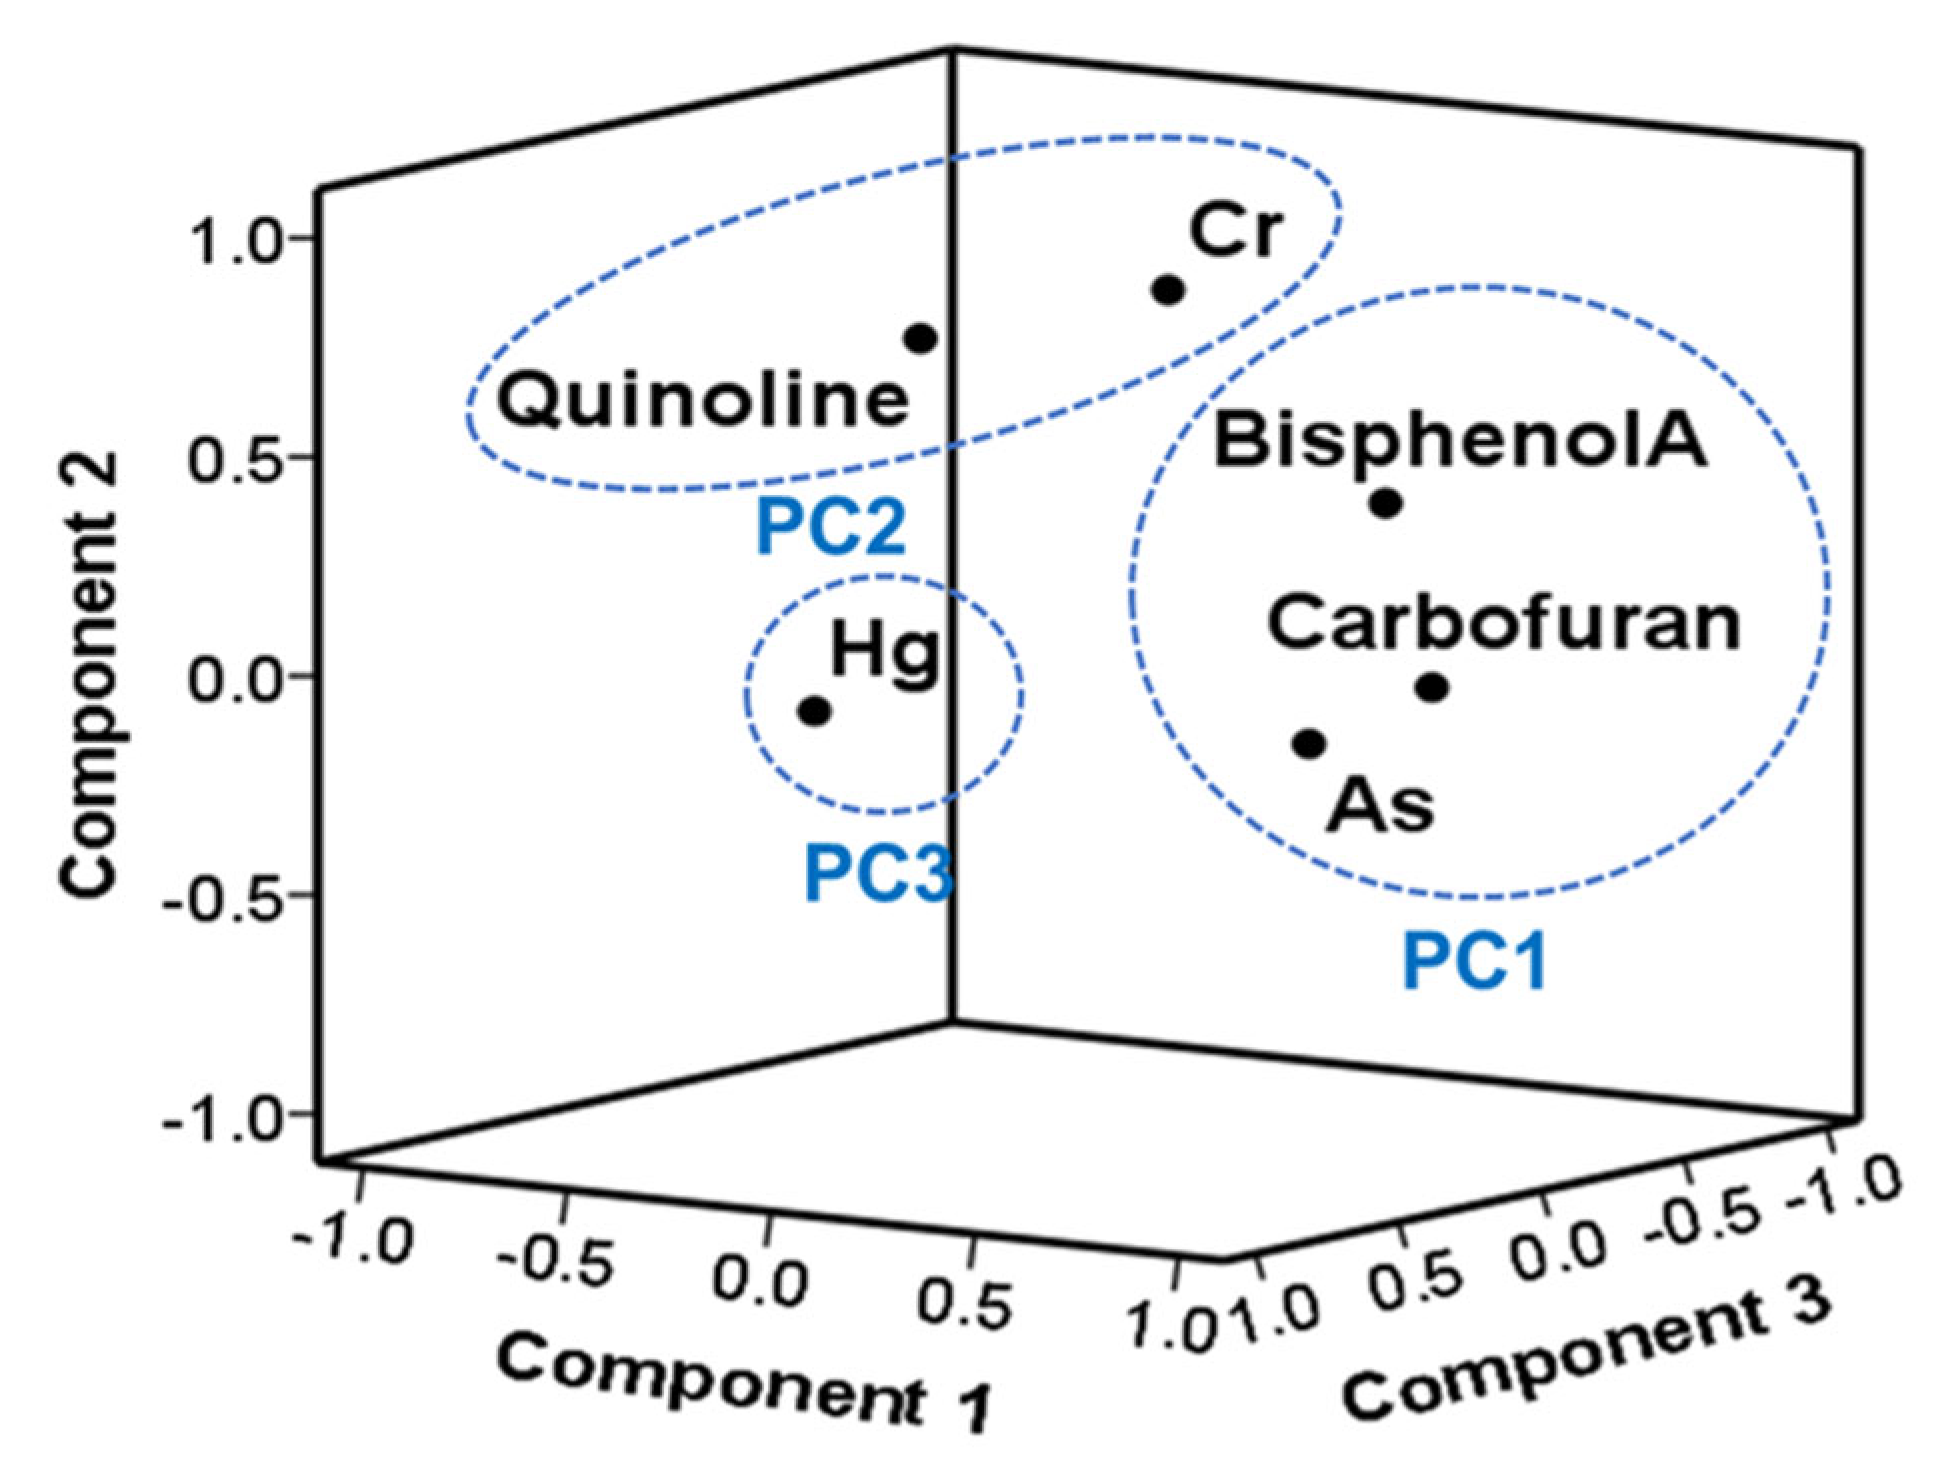
3.2. Factor and Principal Component Analysis (PCA)

PCA was used for composition analysis. Reducing the dimensionality of multivariate data and the associated issues is beneficial [52,53]. Limiting the number of unimportant parameters from monitoring stations provides information about the significant parameters that are present across the entire dataset [28,54].
The number of significant main components was determined according to the Kaiser criterion, with an eigenvalue > 1 [55] (Table 2).
In this study, as shown in Table 2, three principal components (PCs) were found to account for 72.9% of the system’s total variance, with PC1 comprising 32.2% of the variance with a high loading of As (r = 0.754), carbofuran (r = 0.744), and bisphenol-A (r = 0.713); PC2 comprising 22.8% of the variance with Cr (r = 0.870) and quinoline (r = 0.657), and PC3 accounting for 18.0% of the variance with Hg (r = 0.973). The loadings of the PCs for the first two components in this study explained 55.0% of the variation (Table 2 and Figure 5). Evaluating the relationships between the compositions of variables and their grouping patterns is helpful.
The results demonstrated the internal relationships between the metals and indicated that untreated industrial and municipal waste, as well as other geogenic activities, could be the possible sources of these elements [56], thus highlighting the role of anthropogenic and natural activities on heavy metal accumulation in the environment [31,57,58].

3.3. Potential Risk Assessment for Human Health

Figure 6 and Table S5 show the results of an ecotoxicological risk assessment estimating the utilization potential of the maximum MECs and PNECs of the three heavy metals (Cr, As, and Hg) and four organic compounds (molinate, quinoline, carbofuran, and bisphenol A) by aquatic organisms. Most of the RQ values of the target heavy metals and organic compounds were <1 in both wet and dry seasons. However, among the target substances, Cr showed the most prominent environmental impact with RQ > 1 in the wet season, demonstrating the potential risk of Cr on the ecological environment. In addition, the risk level for each substance was high during the wet season, except for quinoline. Changes in the RQ values of all substances in the wet and dry seasons followed various trends, with some substances (Hg, molinate, carbofuran, quinoline) having low RQ values, however, posing amplified risks at higher tropical levels, on bioaccumulation. RQ assessment should, therefore, not be neglected as a factor in gauging the environmental impacts of potential pollutants [2].
The major ecological risk to the Han River watershed was attributed to the high anthropogenic activity, as most of the surrounding land use is dedicated to residential, industrial, and agricultural development. Therefore, management of point (30 WTPs) and non-point pollutants is required. For a more comprehensive risk analysis, future monitoring programs, including biota and sediment samples, are needed to identify the seasonal distribution of target substances and synergistic interactions between these substances [3]. Comprehensive exposure assessments of different matrices can provide a better understanding of the availability of heavy metals and organic compounds in aquatic ecosystems. Ultimately, Cr can be considered as a heavy metal that requires the highest level of attention in the Han River watershed.

4. Conclusions

Twelve organic compounds (pesticides: aldicarb, carbaryl, carbofuran, methomyl, and molinate; herbicides: 2,4-D, MCPA; fungicides: quinoline; endocrine disrupting compound: BPA) and heavy metals (As, Cr, Hg) were investigated at 25 sites in the surface water of the Han River watershed. Of the twelve compounds, seven were detected, of which, one was found at a concentration < 10%, and therefore, excluded from the study. Heavy metals showed a detection frequency of 100% and a concentration range of 0.007–2.375 μg/L. The concentration and detection frequency of the organic compounds ranged from 0.020–0.051 μg/L and 32–75%, respectively. The concentration distribution of the compounds varied among the sites, and the highest concentration of both heavy metals and organic compounds was recorded in the IH area, while that in the BH area was the lowest. The detection concentrations of most compounds were higher in the wet season than in the dry season, which could be attributed to the inflow effect of non-point pollutants due to rainfall rather than the dilution effect. However, relatively low concentrations of highly volatile quinones were detected in the wet season, which may be due to changes in the chemical properties in response to high temperatures. In addition, three PCs were identified, which comprised 72.9% of the total variance, indicating that anthropogenic activities were the major contributors to pollution. Variances in the RQ values for the six compounds in the wet and dry seasons followed various trends. Cr had the most pronounced environmental impact in the wet season, with an RQ > 1, suggesting the potential risk of Cr accumulation on the ecology. Ultimately, Cr is the heavy metal that has received the highest interest in the Han River watershed. Therefore, this study concludes that anthropogenic activities contribute to the heavy metal contamination of the water environment.

Supplementary Materials

The following are available online at www.mdpi.com/article/10.3390/agronomy12123022/s1, Table S1: ICP-MS conditions, Table S2: Liquid chromatograph condition, Table S3: Method detection limit (MDL) for target compounds, Table S4: Linearity of calibration and equation of target compounds, Table S5: Aquatic toxicity data and PNEC values of target compounds on aquatic organisms.

Author Contributions

Conceptualization, J.K.I. and H.R.N.; methodology, H.R.N.; software, J.K.I.; validation, J.K.I. and H.R.N.; formal analysis, H.R.N.; investigation, H.R.N.; resources, T.K.; data curation, H.R.N. and S.H.K.; writing—original draft preparation, J.K.I.; writing—review and editing, J.K.I., H.R.N., T.K. and S.H.K.; visualization, J.K.I.; supervision, T.K.; project administration, H.R.N.; funding acquisition, H.R.N. All authors have read and agreed to the published version of the manuscript.

Funding

This research was supported by the National Institute of Environmental Research (NIER) [grant number NIER-2022-01-01-042], funded by the Ministry of Environment (MOE) and Environmental Fundamental Data Examination Project of Han River Basin Management Committee of the Republic of Korea.

Institutional Review Board Statement

Not applicable.

Informed Consent Statement

Not applicable.

Data Availability Statement

Not applicable.

Conflicts of Interest

The authors declare no conflict of interest.

References

  1. Dressing, S.; Meals, D.; Harcum, J.; Spooner, J. Overview of the Nonpoint Source Problem. In Monitoring and Evaluating Nonpoint Source Watershed Projects; U.S. Environmental Protection Agency: Washington, DC, USA, 2014. [Google Scholar]
  2. Gosset, A.; Durrieu, C.; Orias, F.; Bayard, R.; Perrodin, Y. Identification and assessment of ecotoxicological hazards attributable to pollutants in urban wet weather discharges. Environ. Sci. Process. Impacts 2017, 19, 1150–1168. [Google Scholar] [CrossRef] [PubMed]
  3. Singh, N.; Gupta, V.K.; Kumar, A.; Sharma, B. Synergistic effects of heavy metals and pesticides in living systems. Front. Chem. 2017, 5, 70. [Google Scholar] [CrossRef] [PubMed]
  4. Wee, S.Y.; Aris, A.Z.; Yusoff, F.M.; Praveena, S.M. Occurrence and risk assessment of multiclass endocrine disrupting compounds in an urban tropical river and a proposed risk management and monitoring framework. Sci. Total Environ. 2019, 671, 431–442. [Google Scholar] [CrossRef] [PubMed]
  5. Li, Y.; Gu, G.; Zhao, J.; Yu, H.; Qiu, Y.; Peng, Y. Treatment of coke-plant wastewater by biofilm systems for removal of organic compounds and nitrogen. Chemosphere 2003, 52, 997–1005. [Google Scholar] [CrossRef] [PubMed]
  6. Lee, C.S.; Li, X.-D.; Zhang, G.; Li, J.; Ding, A.-J.; Wang, T. Heavy metals and Pb isotopic composition of aerosols in urban and suburban areas of Hong Kong and Guangzhou, South China—Evidence of the long-range transport of air contaminants. Atmos. Environ. 2007, 41, 432–447. [Google Scholar] [CrossRef] [Green Version]
  7. Adams, R.; Osorio, F.G.; Cruz, J.Z. Water repellency in oil contaminated sandy and clayey soils. Int. J. Environ. Sci. Technol. 2008, 5, 445–454. [Google Scholar] [CrossRef] [Green Version]
  8. Kar, D.; Sur, P.; Mandai, S.; Saha, T.; Kole, R. Assessment of heavy metal pollution in surface water. Int. J. Environ. Sci. Technol. 2008, 5, 119–124. [Google Scholar] [CrossRef] [Green Version]
  9. Aktar, W.; Paramasivam, M.; Ganguly, M.; Purkait, S.; Sengupta, D. Assessment and occurrence of various heavy metals in surface water of Ganga river around Kolkata: A study for toxicity and ecological impact. Environ. Monit. Assess. 2010, 160, 207–213. [Google Scholar] [CrossRef]
  10. Lohani, M.B.; Singh, A.; Rupainwar, D.; Dhar, D. Seasonal variations of heavy metal contamination in river Gomti of Lucknow city region. Environ. Monit. Assess. 2008, 147, 253–263. [Google Scholar] [CrossRef]
  11. Macklin, M.G.; Brewer, P.A.; Balteanu, D.; Coulthard, T.J.; Driga, B.; Howard, A.J.; Zaharia, S. The long term fate and environmental significance of contaminant metals released by the January and March 2000 mining tailings dam failures in Maramureş County, upper Tisa Basin, Romania. Appl. Geochem. 2003, 18, 241–257. [Google Scholar] [CrossRef]
  12. Bird, G.; Brewer, P.A.; Macklin, M.G.; Balteanu, D.; Driga, B.; Serban, M.; Zaharia, S. The solid state partitioning of contaminant metals and As in river channel sediments of the mining affected Tisa drainage basin, northwestern Romania and eastern Hungary. Appl. Geochem. 2003, 18, 1583–1595. [Google Scholar] [CrossRef] [Green Version]
  13. Venugopal, T.; Giridharan, L.; Jayaprakash, M. Characterization and risk assessment studies of bed sediments of River Adyar-An application of speciation study. Int. J. Environ. Res. 2009, 3, 581–598. [Google Scholar]
  14. Singh, A.K.; Mondal, G.; Kumar, S.; Singh, T.; Tewary, B.; Sinha, A. Major ion chemistry, weathering processes and water quality assessment in upper catchment of Damodar River basin, India. Environ. Geol. 2008, 54, 745–758. [Google Scholar] [CrossRef]
  15. Devi, N.L.; Raha, P. Contamination of organochlorine pesticides (OCPs) in India. Bull. Environ. Sci. Res. 2013, 2, 9–14. [Google Scholar]
  16. Agrawal, A.; Pandey, R.; Sharma, B. Water pollution with special reference to pesticide contamination in India. J. Water Resour. Prot. 2010, 2, 432–448. [Google Scholar] [CrossRef] [Green Version]
  17. Zolgharnein, J.; Shahmoradi, A.; Ghasemi, J. Pesticides removal using conventional and low-cost adsorbents: A review. Clean–Soil Air Water 2011, 39, 1105–1119. [Google Scholar] [CrossRef]
  18. Padoley, K.; Mudliar, S.; Pandey, R. Heterocyclic nitrogenous pollutants in the environment and their treatment options–an overview. Bioresour. Technol. 2008, 99, 4029–4043. [Google Scholar] [CrossRef]
  19. Chowdhury, A.Z.; Jahan, S.A.; Islam, M.N.; Moniruzzaman, M.; Alam, M.K.; Zaman, M.A.; Karim, N.; Gan, S.H. Occurrence of organophosphorus and carbamate pesticide residues in surface water samples from the Rangpur district of Bangladesh. Bull. Environ. Contam. Toxicol. 2012, 89, 202–207. [Google Scholar] [CrossRef]
  20. Makehelwala, M.; Weerasooriya, R.; Jayaratne, L.; Dissanayake, C. Thermodynamics of carbofuran adsorption on pyrite. J. Chem. Thermodyn. 2012, 51, 1–7. [Google Scholar] [CrossRef]
  21. Wang, B.; Yu, G.; Huang, J.; Yu, Y.; Hu, H.; Wang, L. Tiered aquatic ecological risk assessment of organochlorine pesticides and their mixture in Jiangsu reach of Huaihe River, China. Environ. Monit. Assess. 2009, 157, 29–42. [Google Scholar] [CrossRef]
  22. Vieira, W.T.; de Farias, M.B.; Spaolonzi, M.P.; da Silva, M.G.C.; Vieira, M.G.A. Removal of endocrine disruptors in waters by adsorption, membrane filtration and biodegradation. A review. Environ. Chem. Lett. 2020, 18, 1113–1143. [Google Scholar] [CrossRef]
  23. Zhang, C.; Wang, X.; Ma, Z.; Luan, Z.; Wang, Y.; Wang, Z.; Wang, L. Removal of phenolic substances from wastewater by algae. A review. Environ. Chem. Lett. 2020, 18, 377–392. [Google Scholar] [CrossRef]
  24. Mu, X.; Qi, S.; Liu, J.; Yuan, L.; Huang, Y.; Xue, J.; Qian, L.; Wang, C.; Li, Y. Toxicity and behavioral response of zebrafish exposed to combined microplastic and bisphenol analogues. Environ. Chem. Lett. 2022, 20, 41–48. [Google Scholar] [CrossRef]
  25. Wang, X.; Qin, Y.; Zhu, L.; Tang, H. Nitrogen-doped reduced graphene oxide as a bifunctional material for removing bisphenols: Synergistic effect between adsorption and catalysis. Environ. Sci. Technol. 2015, 49, 6855–6864. [Google Scholar] [CrossRef] [PubMed]
  26. Im, J.-K.; Cho, Y.-C.; Noh, H.-R.; Yu, S.-J. Geographical Distribution and Risk Assessment of Volatile Organic Compounds in Tributaries of the Han River Watershed. Agronomy 2021, 11, 956. [Google Scholar] [CrossRef]
  27. Im, J.K.; Kim, S.; Kim, Y.S.; Noh, H.R.; Lee, Y.-M.; Yu, S.J. Characteristics and Sources of Selected Halocarbon and Hydrocarbon Volatile Organic Compounds in Surface Water of the Han River Basin. Water 2021, 13, 2568. [Google Scholar] [CrossRef]
  28. Shrestha, S.; Kazama, F. Assessment of surface water quality using multivariate statistical techniques: A case study of the Fuji river basin, Japan. Environ. Model. Softw. 2007, 22, 464–475. [Google Scholar] [CrossRef]
  29. Ahmed, M.K.; Baki, M.A.; Kundu, G.K.; Islam, S.; Islam, M.; Hossain, M. Human health risks from heavy metals in fish of Buriganga river, Bangladesh. SpringerPlus 2016, 5, 1697. [Google Scholar] [CrossRef] [Green Version]
  30. Muhammad, S.; Shah, M.T.; Khan, S. Health risk assessment of heavy metals and their source apportionment in drinking water of Kohistan region, northern Pakistan. Microchem. J. 2011, 98, 334–343. [Google Scholar] [CrossRef]
  31. Son, H.W.; Shim, S.H.; Oh, H.; Choi, J.H. An Assessment of Heavy Metal Contamination in the Nakdong River Around the Weir. Water 2021, 13, 684. [Google Scholar] [CrossRef]
  32. Kang, J.-H.; Lee, Y.S.; Ki, S.J.; Lee, Y.G.; Cha, S.M.; Cho, K.H.; Kim, J.H. Characteristics of wet and dry weather heavy metal discharges in the Yeongsan Watershed, Korea. Sci. Total Environ. 2009, 407, 3482–3493. [Google Scholar] [CrossRef]
  33. Ministry of Environment (MOE). Statistics of Waterworks 2015; Ministry of Environment: Sejong, Republic of Korea, 2015.
  34. National Institute of Environmental Research (NIER). Candidate List Analysis of Water and Water-Ecosystem Quality Criteria; National Institute of Environmental Research: Incheon, Republic of Korea, 2014. [Google Scholar]
  35. European Commission Joint Research Centre. Technical Guidance Document on Risk Assessment in support of Commission Directive 93/67/EEC on Risk Assessment for New Notified Substances, Commission Regulation (EC) No 1488/94 on Risk Assessment for Existing Substances, and Directive 98/8/EC of the European Parliament and of the Council Concerning the Placing of Biocidal Products on the Market; Ispra (IT): European Commission Joint Research Centre: Brussels, Belgium, 2003; Volume 20418. [Google Scholar]
  36. United States Environmental Protection Agency (US EPA). ECOTOX Databa, United States Environmental Protection Agency; U.S. Environmental Protection Agency: Washington, DC, USA, 2020. Available online: http://dfpub.epa.gov/ecotox/ (accessed on 11 June 2022).
  37. American Water Works Association (AWWA). Chromium in Drinking Water: A Technical Information Primer; American Water Works Association: Denver, CO, USA, 2013. [Google Scholar]
  38. Li, Y.; Ma, L.; Abuduwaili, J.; Li, Y. Spatiotemporal distributions of fluoride and arsenic in rivers with the role of mining industry and related human health risk assessments in Kyrgyzstan. Expo. Health 2022, 14, 49–62. [Google Scholar] [CrossRef]
  39. Fu, J.; Zhao, C.; Luo, Y.; Liu, C.; Kyzas, G.Z.; Luo, Y.; Zhao, D.; An, S.; Zhu, H. Heavy metals in surface sediments of the Jialu River, China: Their relations to environmental factors. J. Hazard. Mater. 2014, 270, 102–109. [Google Scholar] [CrossRef]
  40. Smedley, P.L.; Kinniburgh, D.G. Source and behaviour of arsenic in natural waters. In United Nations Synthesis Report on Arsenic in Drinking Water; World Health Organization: Geneva, Switzerland, 2001; pp. 1–61. Available online: http://www.who.int/water_sanitation_health/dwq/arsenicun1.pdf (accessed on 5 August 2022).
  41. Genchi, G.; Lauria, G.; Catalano, A.; Carocci, A.; Sinicropi, M.S. Arsenic: A Review on a Great Health Issue Worldwide. Appl. Sci. 2022, 12, 6184. [Google Scholar] [CrossRef]
  42. Myagkaya, I.; Lazareva, E.; Gustaitis, M.; Kirichenko, I.; Saryg-ool, B.Y. Mercury in Soils and Air in Areas with Anthropogenic Dispersion Halos and High Natural Geochemical Background. Ecol. Ind. Russ. 2022, 26, 44–50. [Google Scholar] [CrossRef]
  43. Abass, K.; Huusko, A.; Knutsen, H.; Nieminen, P.; Myllynen, P.; Meltzer, H.; Vahakangas, K.; Rautio, A. Quantitative estimation of mercury intake by toxicokinetic modelling based on total mercury levels in humans. Environ. Int. 2018, 114, 1–11. [Google Scholar] [CrossRef]
  44. Abid, M.F.; Alwan, G.M.; Abdul-Ridha, L.A. Study on catalytic wet air oxidation process for phenol degradation in synthetic wastewater using trickle bed reactor. Arab. J. Sci. Eng. 2016, 41, 2659–2670. [Google Scholar] [CrossRef]
  45. Gosu, V.; Gurjar, B.R.; Zhang, T.C.; Surampalli, R.Y. Oxidative degradation of quinoline using nanoscale zero-valent iron supported by granular activated carbon. J. Environ. Eng. 2016, 142, 04015047. [Google Scholar] [CrossRef]
  46. Wang, L.; Wang, Y.; Li, H.; Zhu, Y.; Liu, R. Occurrence, source apportionment and source-specific risk assessment of antibiotics in a typical tributary of the Yellow River basin. J. Environ. Manag. 2022, 305, 114382. [Google Scholar] [CrossRef]
  47. Wang, K.; Su, Z.; Reguyal, F.; Bian, R.; Li, W.; Yu, H.; Sun, Y.; Zhuang, Y.; Shang, W. Seasonal occurrence of multiple classes of antibiotics in East China rivers and their association with suspended particulate matter. Sci. Total Environ. 2022, 853, 158579. [Google Scholar] [CrossRef]
  48. Bermúdez-Couso, A.; Fernández-Calviño, D.; Pateiro-Moure, M.; Nóvoa-Muñoz, J.C.; Simal-Gándara, J.; Arias-Estévez, M. Adsorption and desorption kinetics of carbofuran in acid soils. J. Hazard. Mater. 2011, 190, 159–167. [Google Scholar] [CrossRef] [PubMed]
  49. Chen, J.-Q.; Hu, Z.-J.; Ji, R. Removal of carbofuran from aqueous solution by orange peel. Desalination Water Treat. 2012, 49, 106–114. [Google Scholar] [CrossRef]
  50. Liu, J.; Zhang, L.; Lu, G.; Jiang, R.; Yan, Z.; Li, Y. Occurrence, toxicity and ecological risk of Bisphenol A analogues in aquatic environment–A review. Ecotoxicol. Environ. Saf. 2021, 208, 111481. [Google Scholar] [CrossRef] [PubMed]
  51. Tarafdar, A.; Sirohi, R.; Balakumaran, P.A.; Reshmy, R.; Madhavan, A.; Sindhu, R.; Binod, P.; Kumar, Y.; Kumar, D.; Sim, S.J. The hazardous threat of Bisphenol A: Toxicity, detection and remediation. J. Hazard. Mater. 2022, 423, 127097. [Google Scholar] [CrossRef] [PubMed]
  52. Johnson, R.A.; Wichern, D.W. Applied Multivariate Statistical Analysis; Prentice Hall: Hoboken, NJ, USA, 1992; pp. 299–336. [Google Scholar]
  53. Petersen, W.; Bertino, L.; Callies, U.; Zorita, E. Process identification by principal component analysis of river water-quality data. Ecol. Model. 2001, 138, 193–213. [Google Scholar] [CrossRef]
  54. Helena, B.; Pardo, R.; Vega, M.; Barrado, E.; Fernandez, J.M.; Fernandez, L. Temporal evolution of groundwater composition in an alluvial aquifer (Pisuerga River, Spain) by principal component analysis. Water Res. 2000, 34, 807–816. [Google Scholar] [CrossRef]
  55. Kaiser, H.F. The application of electronic computers to factor analysis. Educ. Psychol. Meas. 1960, 20, 141–151. [Google Scholar] [CrossRef]
  56. Mohiuddin, K.; Ogawa, Y.; Zakir, H.; Otomo, K.; Shikazono, N. Heavy metals contamination in water and sediments of an urban river in a developing country. Int. J. Environ. Sci. Technol. 2011, 8, 723–736. [Google Scholar] [CrossRef] [Green Version]
  57. Shi, C.; He, H.; Xia, Z.; Gan, H.; Xue, Q.; Cui, Z.; Chen, J. Heavy metals and Pb isotopes in a marine sediment core record environmental changes and anthropogenic activities in the Pearl River Delta over a century. Sci. Total Environ. 2022, 814, 151934. [Google Scholar] [CrossRef]
  58. Iordache, A.M.; Nechita, C.; Zgavarogea, R.; Voica, C.; Varlam, M.; Ionete, R.E. Accumulation and ecotoxicological risk assessment of heavy metals in surface sediments of the Olt River, Romania. Sci. Rep. 2022, 12, 880. [Google Scholar] [CrossRef]
Figure 1. Description of study area and sampling sites in the Han River watershed.
Agronomy 12 03022 g001
Figure 2. Mean concentration of (a) heavy metals and (b) organic compounds in the Han River watershed.
Agronomy 12 03022 g002
Figure 3. Concentrations and detection frequencies of (a) heavy metal and (b) organic compounds in five areas of the Han River watershed.
Agronomy 12 03022 g003
Figure 4. Wet and dry season variation of target compounds (a) Cr, (b) As, (c) Hg, (d) quinoline, (e) carbofuran, (f) bisphenol-A in the Han River watershed.
Agronomy 12 03022 g004
Figure 5. Component plot in rotated space of the Han River watershed.
Agronomy 12 03022 g005
Figure 6. Wet and dry season risk quotients for target compounds in the Han River watershed.
Agronomy 12 03022 g006
Table 1. Summary statistics for target compounds detected in tributaries of the Han River watershed.
ClassificationMean
Conc.
(µg/L)
Min
Conc.
(µg/L)
Max
Conc.
(µg/L)
Frequency
Detected
(%)
Cr2.3750.12042.220100
As1.3390.1205.580100
Hg0.0070.0010.045100
AldicabNDNDNDND
MethomylNDNDNDND
Molinate0.0010.0020.0305
MCPANDNDNDND
CarbarylNDNDNDND
2,4-DNDNDNDND
Carbofuran0.0510.0020.56075
Bisphenol A0.0400.0040.64447
Quinoline0.0200.0030.38832
Table 2. Principal component analysis of three components with the corresponding loading of target compounds of the study area.
VariablesPC 1PC 2PC 3
As0.754−0.0830.303
Carbofuran0.744−0.020−0.141
Bisphenol A0.7130.415−0.023
Cr0.2480.8700.074
Quinoline−0.4900.657−0.112
Hg0.0100.0130.973
Eigenvalues1.9311.3681.077
% of Variance32.18322.80017.950
Cumulative variance %32.18354.98272.933
* Rotation method: varimax with Kaiser normalization (the significance of Kaier–Meyer–Olkin (KMO) and Bartlett’s sphericity test was < 0.001).
Publisher’s Note: MDPI stays neutral with regard to jurisdictional claims in published maps and institutional affiliations.

