Article

Wheat and Faba Bean Intercropping Together with Nitrogen Modulation Is a Good Option for Balancing the Trade-Off Relationship between Grain Yield and Quality in the Southwest of China

1
College of Horticulture and Landscape, Yunnan Agricultural University, Kunming 650201, China
2
College of Resources and Environment, Yunnan Agricultural University, Kunming 650201, China
3
Department of President Office, Yunnan Open University, Kunming 650599, China
*
Author to whom correspondence should be addressed.
These authors contributed equally to this work.
Agronomy 2022, 12(12), 2984; https://doi.org/10.3390/agronomy12122984
Submission received: 11 October 2022 / Revised: 22 November 2022 / Accepted: 22 November 2022 / Published: 28 November 2022

Abstract

:
Cereal and legume intercropping could improve cereal yield, but the role of intercropping in grain quality still lacks a full understanding. A two-year bi-factorial trial was conducted to investigate the role of two planting patterns (mono-cropped wheat (MW) and intercropped wheat+faba bean (IW)) and four nitrogen (N) fertilization levels (N0, no N fertilizer applied to both wheat and faba bean; N1, 90 and 45 kg N ha–1 applied to wheat and faba bean; N2, 180 and 90 kg N ha–1 applied to wheat and faba bean; N3, 270 and 135 kg N ha–1 applied to wheat and faba bean), as well as their interaction on the productivity of wheat grain yield (GY) and quality. The results showed that intercropping increased both the yields of wheat grain protein and amino acids (AAs) relative to MW in both years. No difference in Aas content between IW and MW was found but the 9% grain protein content (GPC) of IW was higher than that of MW in 2020. By contrast, wheat gliadin content was increased by 8–14% when wheat was intercropped with faba bean in both years, and some AAs fractions including essential and non-essential AAs were increased under N0 and N1 levels but declined at the N3 level. This means that intercropping increased the grain quality either for protein and AAs content or for fractions. There was no negative relationship between GPC and GY in the present study, and intercropping tended to increase GPC with increasing GY. In conclusion, wheat and faba bean mainly affected GPC and fractions rather than AAs, and intercropping presented a potential to improve both wheat quality and yield concurrently. Modulated N rates benefitted the stimulation of intercropping advantages in terms of grain yield and quality in the southwest of China and similar regions.

1. Introduction

Traditional planting patterns including intercropping, relay intercropping, and rotation are normally linked with yield increase and sustainability of the agriculture system [1,2,3]. Legume-based intercropping, a worldwide planting method, always presents increased crop yield and drives higher crude protein yields due to the nitrogen (N) biological fixation of legumes [4,5,6]. Frequently, improved cereal nutrient was observed because of N and phosphorus (P) transfer from the legume to cereal during their co-growing period in cereal-legume intercropping systems [7], and resulted in better cereal feed/forage quality [8,9,10]. Thus, the early research argued that the increased protein content of cereals was a result of N fertilization and was linked with legume intercropping [11,12]. Actually, other non-legume-based intercropping was also a benefit for crops yield and quality [13,14].
Protein content and fractions are important for evaluating and determining wheat grain values [15]. Many researchers highlighted the positive effect of cereal and legume intercropping on grain protein content (GPC) [5,16,17], but few studies focused on the effect of intercropping on protein fractions. The content of amino acids (AAs), especially essential amino acids (EAAs), is important to reflect protein quality, but major staple foods including wheat have limited amounts of EAAs for humans [18]. The enhancement of breeding techniques and N topdressing time modulation resulted in improved protein quality [19,20]; however, little attention has focused on the role of planting pattern in grain AAs content and factions.
Wheat and faba bean intercropping, as a typical legume-based intercropping pattern, is widely distributed in many countries either for food or for forage [21]. Tosti and Guiducci observed that wheat temporarily intercropped with faba bean improved both wheat grain yield and protein content [22]. However, De Stefanis et al. found that durum wheat gluten quality, total protein concentration, and monomeric and polymeric protein amounts were significantly increased but wheat grain yield was decreased when durum wheat was temporary intercropped with faba bean [23]. Similarly, wheat temporarily intercropped with clover induced a higher wheat grain protein content but lower grain yield [24]. In fact, a negative relationship or trade-off relationship between the grain yield (GY) and GPC was constantly observed in most cereal grains [25,26], but intercropping was a good strategy to reducing the risk of impairing winter wheat yield and protein content [27].
In the southwest of China, wheat and faba bean had a long co-growing period; thus, the interspecific interaction in this pattern was different from that of wheat temporarily intercropped with faba bean [21]. A previous study illustrated that wheat and faba bean intercropping could increase wheat yield but decrease faba bean yield, and the intercropping yield advantage was decreased with N input [28]. However, there is a lack of comprehensive assessment on the effect of intercropping on grain quality, especially on the content and fractions of wheat protein and AAs, which are tightly related to N input. We hypothesize that wheat and faba bean intercropping could improve wheat grain yield and maintain gain quality simultaneously, and the effect of intercropping on grain quality would vary with N input. Here, we present a two-year field experiment to test the hypothesis: (i) qualifying the effect of intercropping on wheat grain protein and amino acids under different N input conditions, and (ii) identifying the impact of intercropping on the relationship between GY and quality.

2. Material and Methods

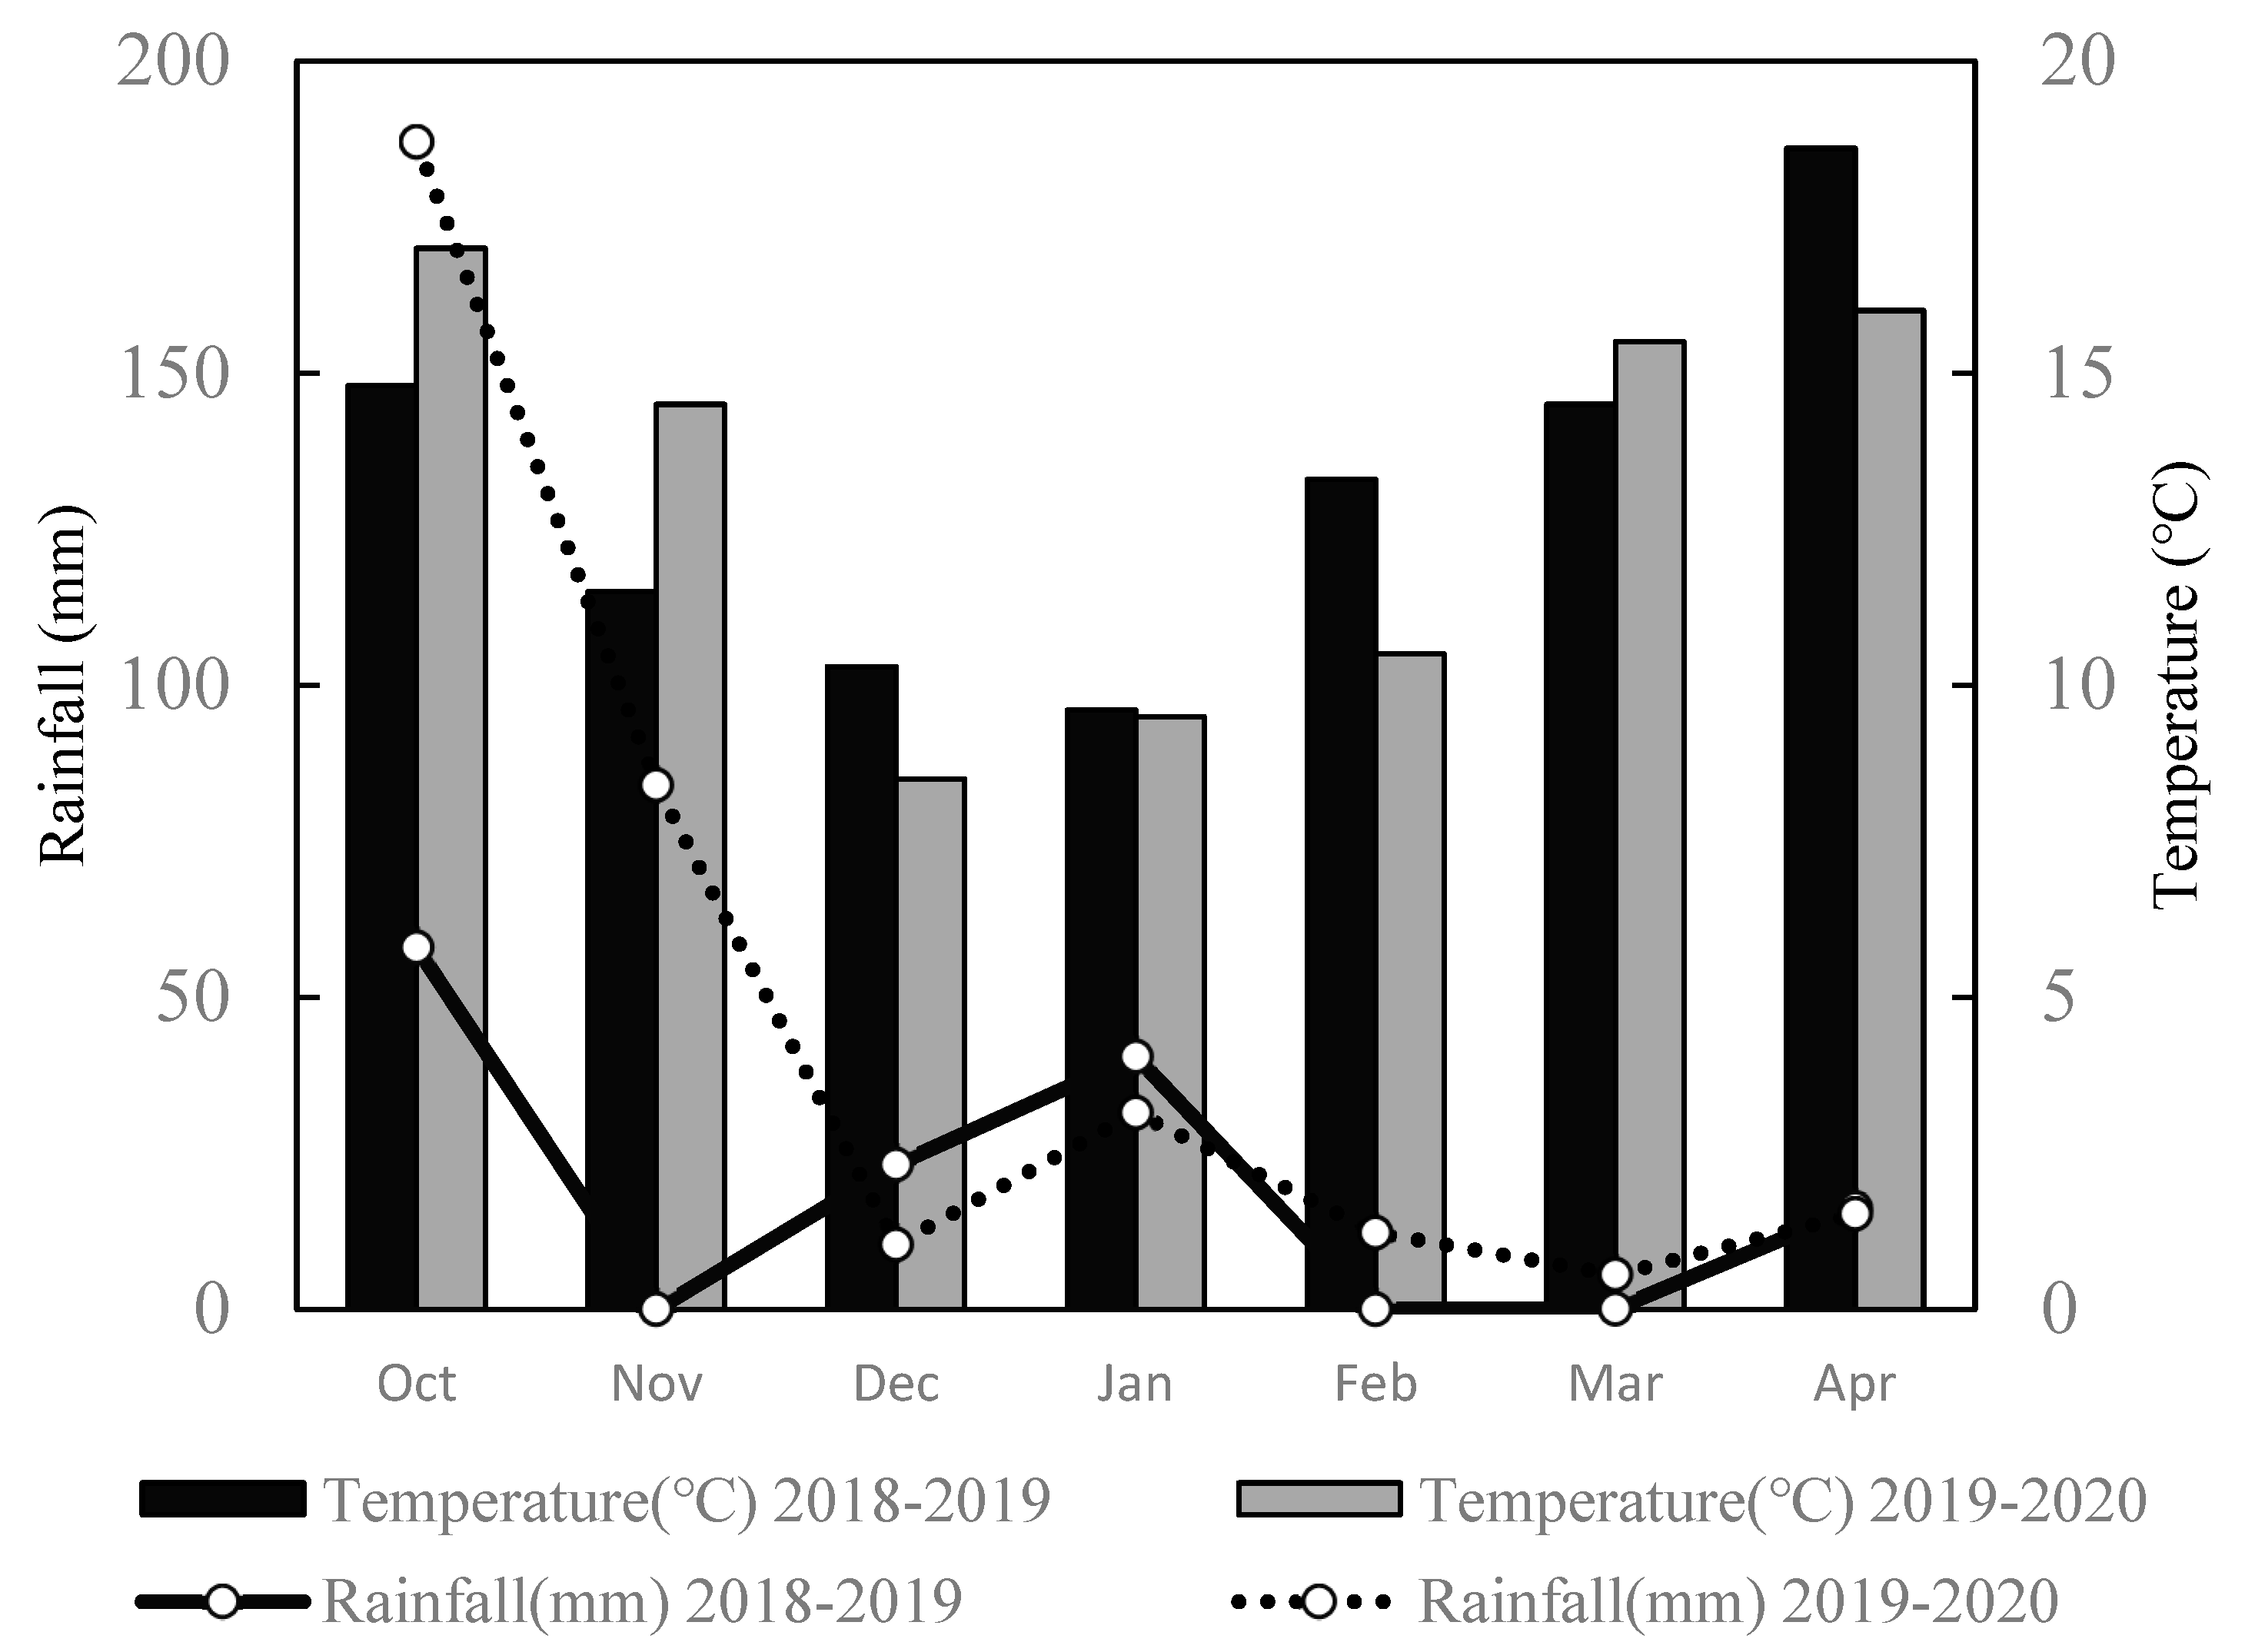
2.1. Experimental Site and Growing Conditions

The present study was based on the data collected during 2018/2019 and 2019/2020 cropping seasons in the existing wheat and faba bean intercropping experiment, which was established in 2014. The field experiment was conducted at the Yunnan Agricultural University research station, located in Xundian (23°32′ N, 103°13′ E), Yunnan Province, northwest China. The climate in this region is characterized by a unimodal rainfall pattern with a rainy season from June to September and mean annual rainfall of 1040 mm, and the mean annual air temperature is 14.7 °C. The average monthly temperatures and monthly precipitation amounts during the experiment of 2018/2019 and 2019/2020 are shown in Figure 1. The monoculture corn was planted from May to September for many years before the wheat and faba bean intercropping experiment was established. The soil type in this region is called red soil (Ferralic Cambisol, FAO, 2006) with a bulk density of 1.38 g cm−3, and the content of clay, silt, and sand was 34%, 52%, and 14%, respectively, at a soil depth of 0–30 cm. At the beginning of the multi-year field experiment in 2014, the soil properties were as follows: SOC 12 g kg−1, total N 1.14g kg−1, total P 0.98g kg−1, total K 24.25 g kg−1, available N (NaOH hydrolyzed) 80 mg kg−1, Olsen P 17 mg kg−1, exchangeable K 146 mg kg−1, and pH 7.2 (1:2.5 soil: water). The soil total N and available N contents in each treatment were changed during 2018/2019 and 2019/2020 cropping seasons as compared to the beginning of the field experiment in 2014 due to continuous wheat and faba bean intercropping and different N application rates (data shown in Supplementary Table).

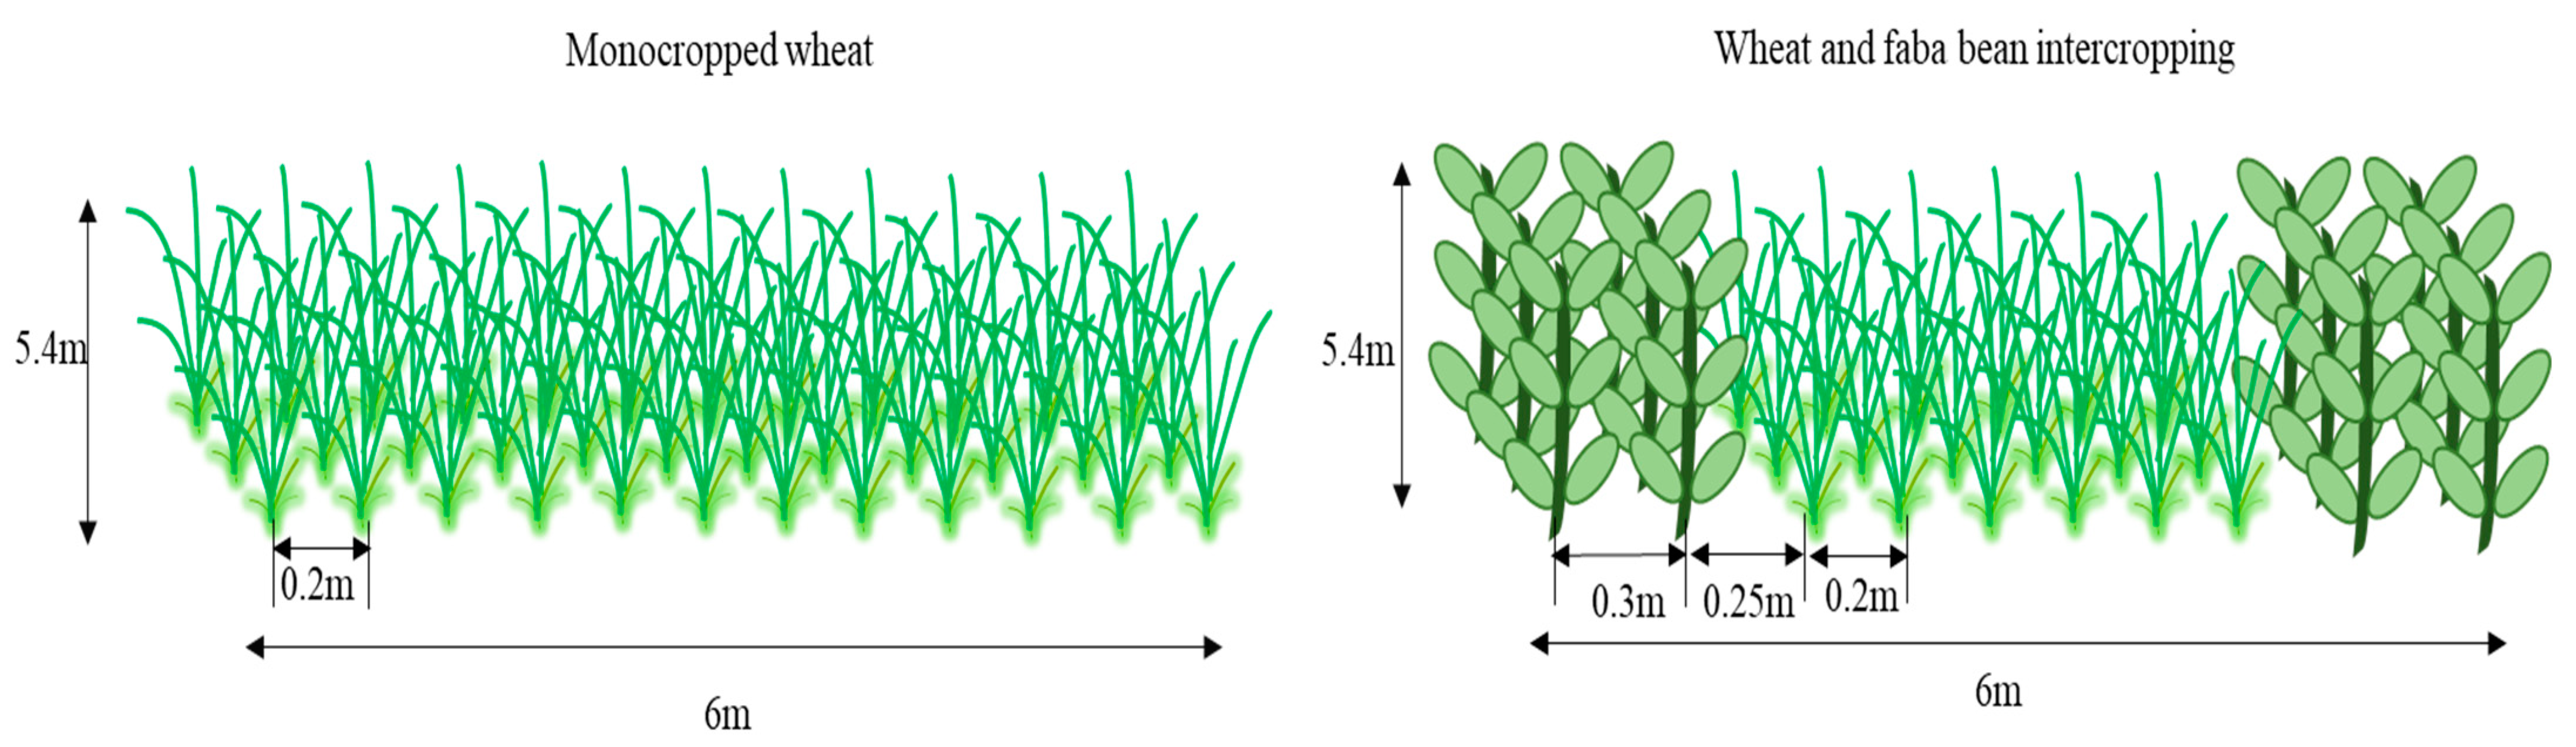
2.2. Experimental Design

The field experiment was a randomized block design with two factors and three replicates [28]. Factor A was planting patterns (mono-cropped wheat (MW) and intercropped wheat+faba bean (IW)), and factor B was N levels (0 kg N ha–1 (N0), 90 kg N ha–1(N1), 180 kg N ha–1(N2), and 270 kg N ha–1 (N3) for wheat; 0 kg N ha–1 (N0), 45 kg N ha–1(N1), 90 kg N ha–1(N2), and 135 kg N ha–1 (N3) for faba bean). In total, the field experiments consisted of 24 plots with eight treatments, and each plot area was 5.4 m × 6.0 m = 32.4 m2. There were 0.5 m spacings between each plot and 1.0 m spacings between adjacent blocks to avoid water and nutrient interference. The row space of wheat was 0.2 m with a seeding rate at 180 kg ha−1, whereas the faba bean row spacing was 0.3 m and the plant-to-plant spacing was 0.1 m in the present study. The strip intercropping of six rows of wheat intercropped with two rows of faba bean was used in this study based on local farmers practice; thus, there were three strips in each intercropping plot including 18 rows of wheat and six rows of faba bean [28]. The plant density of intercropped wheat and faba bean was identical to that of mono-cropped under the same area, and the row space between wheat and faba bean was 0.25 m in each intercropped plot. Detailed information of a given intercropping plot can be seen in Figure 2.

2.3. Field Experiment Management

The local varieties of Yunmai 52 for wheat (Triticum aestivum L.) and Yuxi Dalidou for faba bean (Vicia faba L.) were used in the present study since 2014, and the faba bean seed was non-inoculated rhizobium. Wheat and faba bean were sown on the same date normally on 20–30 October with a sowing depth of 10 cm and were harvested in the next year on 10–20 April. After both plants were harvested, all straws were removed from the field and each plot retained fallow from May to September since 2014. The implementation of other crop managements including irrigation and the use of pesticides was according to local farmers’ practice.
Urea as N fertilizer was used in the present study. For wheat, one half of the total N application rate for each given treatment was applied as basal fertilizer before sowing by hand, and another half N fertilizer as a topdressing was applied at the wheat elongation stage. For faba bean, all N fertilizers for each treatment were applied as a basal fertilizer before sowing. Amounts of 90 kg P2O5 ha–1 (calcium superphosphate) and 90 kg K2O ha–1 (potassium chloride) for each crop were applied as base fertilizers according to local farming practices. In each intercropping plot, topdressing N was only evenly applied to wheat rows by hand.

2.4. Data Collection and Analyses

At maturity, inter- and mono-cropped wheat grains of each whole plot were collected and determined after the grain seeds were fully air-dried during 2018/2019 and 2019/2020 growing seasons, and the experiment of 2019 and 2020 represented two years of experiments, respectively. The wheat grain crude protein; protein fraction contents including albumin, globulin, gliadin, and glutelin; amino acids fraction content were determined in both years.
GPC was calculated by multiplying the grain N content with a conversion factor of 5.83 for wheat [29]. Grain N content was analyzed by the Kjeldahl method after the sample digestion with H2SO4-H2O2. Protein fractions albumin, globulin, gliadin, and glutelin were sequentially extracted from 1 g of wheat grain powder [30,31]. In brief, sequential extraction of albumin and gliadin fractions from the wheat grain sample were carried out by using distilled water and 2% NaCl, followed by extraction with 70% ethanol to obtain the gliadin fraction. The glutelin fraction was extracted from the residue by using 0.05 M NaOH. Protein content was determined using the modified Lowry method of Markwell et al. [32].
Amino acids (AAs) were identified and quantified by a high-performance liquid chromatographer (Agilent 1100) coupled to a DAD detector and a post-column derivatization device. The chromatograph column used was a C18 (250 × 4.6 mm ID) from Thermo Fisher, and the column was operated at a temperature of 40 °C. The chromatograph conditions were set as follows: ultraviolet detector 360 nm; flowrate 1.0 mL min−1; the mobile phase consisted of A = 0.5 M sodium acetate (for HPLC analysis, Sigma Chemical CO., St. Louis, MO, USA) and B = 50% (v/v) methanol (Sigma Chemical Co., St. Louis, MO, USA) in water, and the injection volume was 10 μL for all samples. Wheat grain powder was hydrolytic and derivatized before HPLC analysis. Briefly, (1) sample hydrolysis: grain powder was hydrolytic for 24 h at 110 °C in 6M hydrochloric acid; (2) post-column derivatization: the derivatization was performed from a solution containing sodium hydroxide (6 mol L–1), sodium bicarbonate pH 9.0 (0.5 mol L–1), and DNFB. A deviation solution was mixed in a buffer of phosphoric acid pH 7.0 and filtered with a 0.22 μm membrane before HPLC analysis. The identification of amino acids was carried out by comparing retention times of standards and quantification in analytical curves constructed for each amino acid.
The sum content of seventeen AAs was the total AAs (TAAs) content. The seventeen measured AAs were divided into essential amino acids (EAAs) and non-essential amino acid (NEAAs). EAAs are essential for humans and animals but cannot be synthesized in the human body, including Thr, Val, Met, Ile, Leu, Phe, and Lys; NEAAs are non-essential as being synthesized in the human or animal body, including Asp, Ser, Glu, Gly, Ala, Cys, Tyr, His, Arg, and Pro [33].
Protein and TAAs yields represent the yield of protein and/or TAA that can be harvested per unit area of crops [34], which was calculated by protein and AAs content multiplied by each plot grain yield, respectively, in this study.

2.5. Statistic Analysis

A two-way analysis of variance (ANOVA) was performed using the MIXED procedure with SPSS software (IBM SPSS Statistics Version 19.0) to test for significant differences among treatments. Planting patterns and N levels were considered as the fixed factors, and replication was considered the random factor. Significant differences among treatments at each year were investigated using Duncan’s multiple range post hoc test when the F-value was significant (p ≤ 0.05). Linear and quadratic models were used to simulate the relationship among grain yield, grain protein content, and grain AAs content in this study.

3. Results

3.1. Mono- and Inter-Cropped Wheat Grain Protein Content and Yield under Different N Levels

Both the GPC and protein yield were not influenced by the interaction of N levels and planting patterns in the two-year field experiments. Likewise, N levels and planting patterns also had no impact on wheat GPC in the experiment of 2019. However, wheat GPC was increased by 9% when wheat was intercropped with faba bean relative to MW in the experiment of 2020 (Table 1). Similarly, wheat protein yield was increased by 28% and 32% in 2019 and 2020, respectively, when wheat was intercropped with faba bean. In addition, increased protein yield was found with increasing N levels in both years (Table 1).

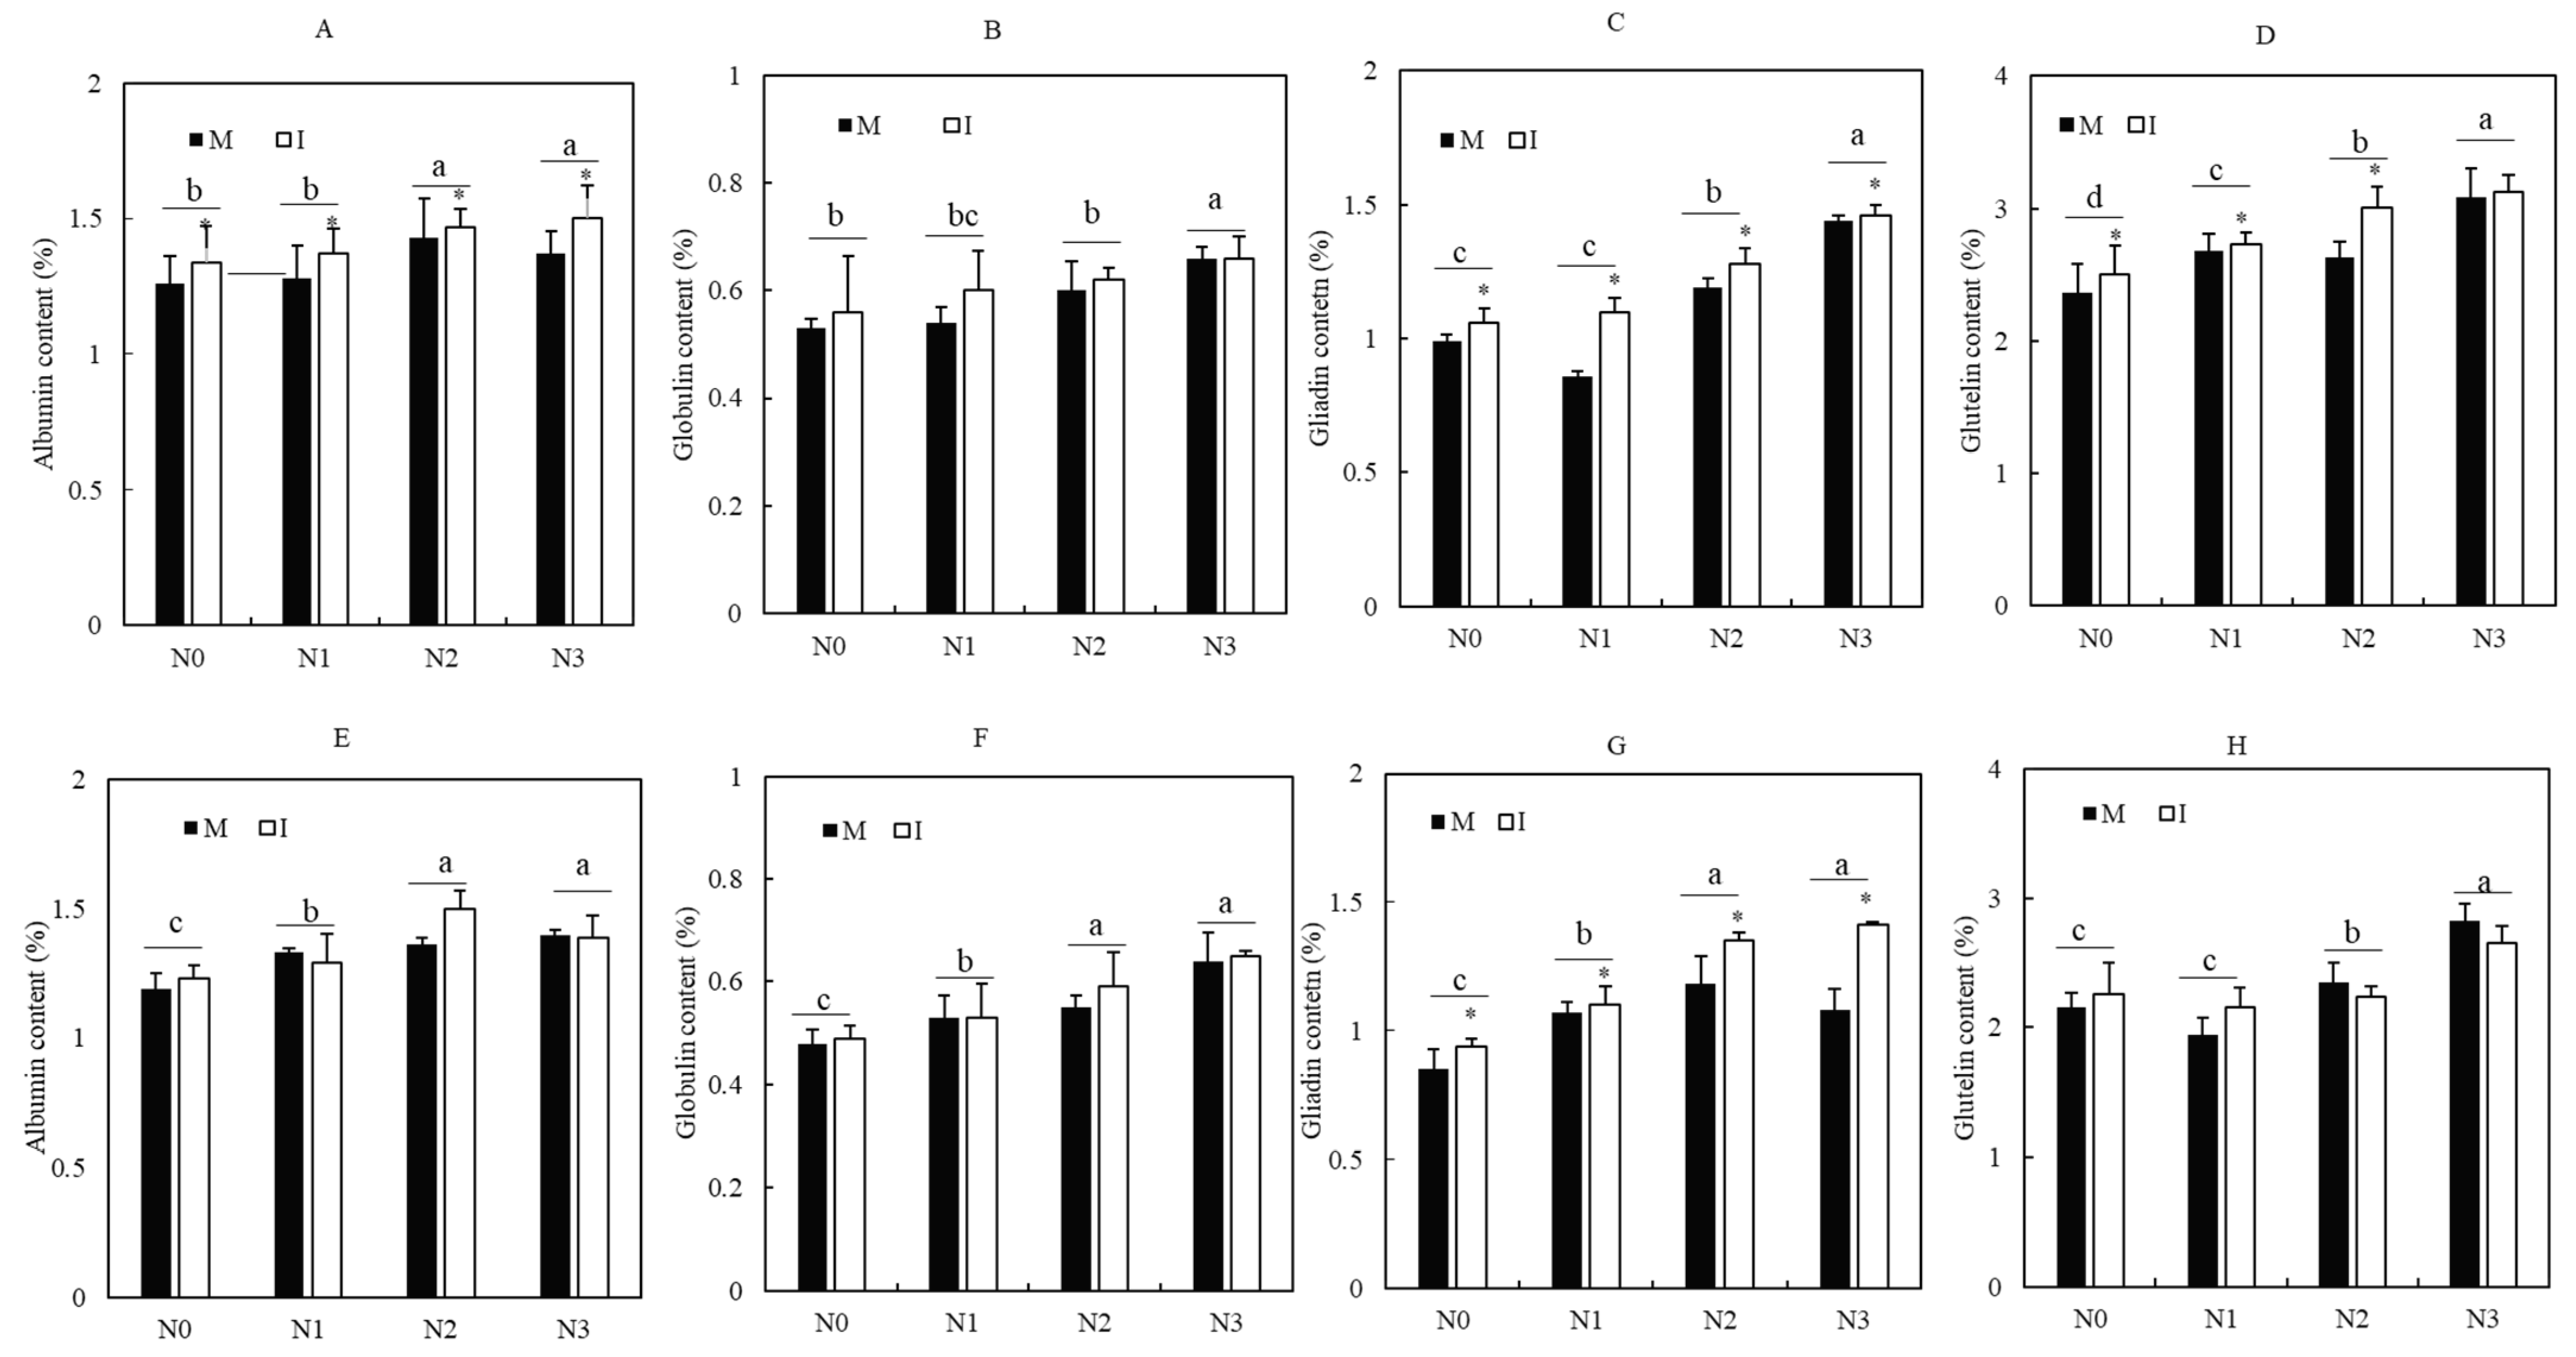
3.2. Mono- and Inter-Cropped Wheat Grain Protein Composition under Different N Levels

Four protein fraction contents including albumin, globulin, gliadin, and glutelin were influenced by N levels, and protein fraction contents were frequently affected by the planting pattern, but they were not influenced by the interaction of N levels and planting patterns (Table 2). In 2019, the increased contents of albumin, gliadin, and glutelin in IW grain were observed as compared to MW, and the increase was 9%, 9%, and 5%, respectively. In 2020, only the increased content of gliadin in IW grain was observed relative to MW, and the increase was 14%. In addition, all four protein fractions were increased with increasing N levels (Figure 3).

3.3. Mono- and Inter-Cropped Wheat Grain Amino Acids Content and Yield under Different N Levels

Planting patterns had no impact on grain TAAs content in neither year, but TAAs content was influenced by N levels and the interaction of N levels and planting patterns (Table 1). The TAAs content in IW grain was increased by 33% relative to MW at the N1 level in 2019, and wheat grain TAAs content was increased by 7% under N0 and N1 levels when wheat was intercropped with faba bean as compared to MW in 2020. However, wheat grain TAAs content was decreased by 10% and 14% under the N3 level in the experiment of 2019 and 2020, respectively, as compared to MW. Regardless of N levels, the grain TAAs yield was increased by 17–19% when wheat was intercropped with faba bean, whereas no difference in grain TAAs yield between IW and MW was found under the N3 level, due to the interaction between N levels and planting patterns. By contrast, the TAAs yield of IW grain was increased by 35% and 60% under N0 and N1 levels, respectively, in comparison with MW in 2019; the TAAs yield of IW grain was increased by 80%, 27%, and 25% under N0, N1, and N2 levels, respectively, in comparison with MW in 2020 (Table 1).

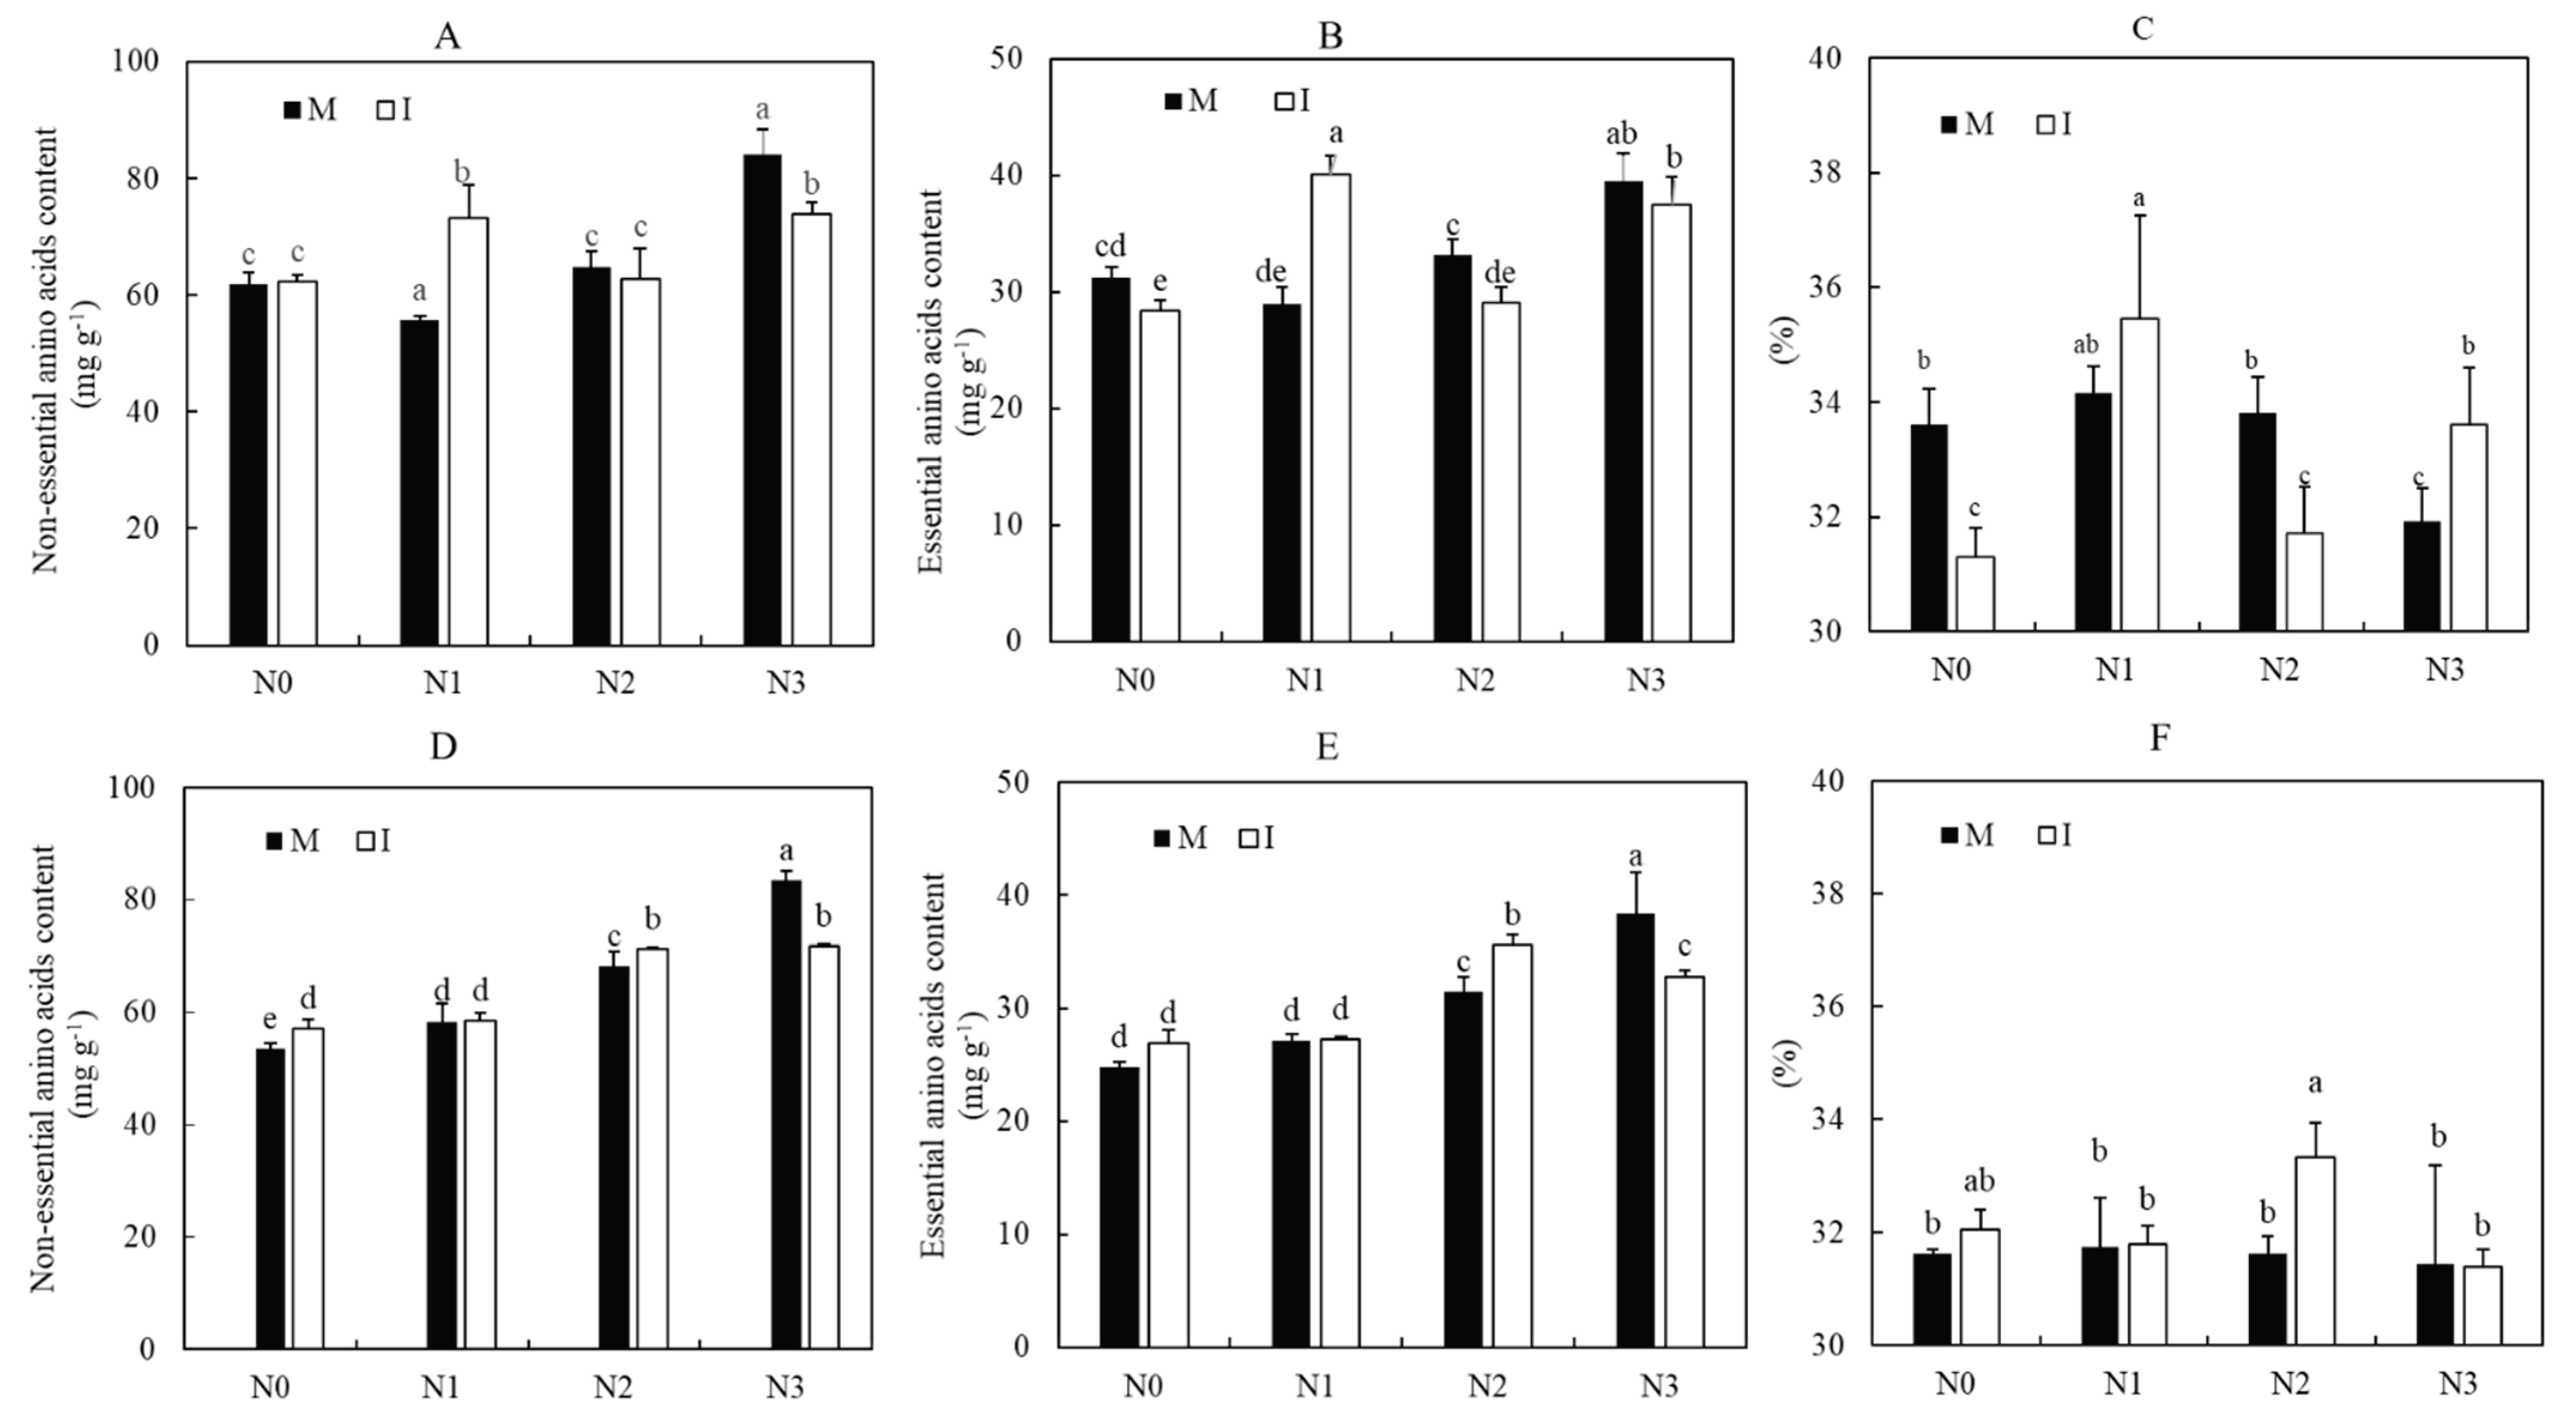
3.4. Mono- and Inter-Cropped Wheat Grain NEAAs and EAAs Content under Different N Levels

The content of NEAAs and EAAs and the ratio of EAAs and TAAs were not influenced by planting patterns but were affected by N levels and N levels × planting patterns in both years (Table 3). When compared to MW, IW NEAAs content was decreased by 12% and 14% under the N3 level in 2019 and 2020, respectively (Figure 4). By contrast, the NEAAs content of IW was 31% higher than that of MW under the N1 level in 2019; the NEAAs contents of IW were 7% and 5% higher than those of MW under N0 and N2 levels, respectively, in 2020 (Figure 4). Similarly, the IW EAAs content was decreased by 14% at the N3 level in 2020 and was decreased by 9% and 12% at N0 and N2 levels in 2019 as compared to the corresponding MW, respectively. However, grain EAAs was increased by 39% at the N1 level in 2019 and increased by 13% at the N2 level in 2020 when wheat was intercropped with faba bean. As a result, EAAs/TAAs of IW at N0 and N2 levels were decreased by 7% and 6%, respectively, and the EAAs/TAAs of IW at the N3 level was increased by 5% when compared to MW in 2019. In all, we did not find any difference in EAAs/TAAs between MW and IW regardless of N levels (Figure 4).

3.5. Mono- and Inter-Cropped Wheat Grain AAs Fraction Content under Different N Levels

The AAs fraction contents including eight EAAs fractions and nine NEAAs fractions were detected in the present study, and they were seldom influenced by planting patterns but were frequently affected by N levels and N levels × planting patterns according to the two-year experiment (Table 4 and Table 5). Under N0 and N1 levels, only Met (2019) and Val (2020) contents in IW grain were lower than those in MW; for the other EAAs fractions, wheat and faba bean intercropping either had no impact on EAAs contents or increased EAAs contents. By contrast, under the N3 level, half of the EAAs fraction contents in IW grain were decreased as compared to MW. In the experiment of 2019, Thr, Val, Phe, and Lys contents in the IW grain were decreased by 12%, 40%, 7%, and 9% relative to MW; Val, Met, His, and Lys were decreased by 31%, 28%, 13%, and 26% when compared to MW in the experiment of 2020. On average, the contents of His and Phe in IW grain were higher than those in MW, but the Lys content in IW grain was lower than that in MW in 2019 regardless of N levels. Similarly, no difference in fraction content of EAAs between IW and MW was found except for the His content in IW grain that was higher than that in MW in 2020 (Table 4).
Wheat and faba bean intercropping nearly had no impact on NEAAs fraction contents except for Asp, Pro, Glu, and Tyr in the two-year experiments. Only Asp, Arg, and Cys contents in IW grain at the N0 level and Cys content at the N1 level in 2019 decreased as compared to MW, and the other NEAAs fraction contents in IW grain were either equal to or higher than those in MW. Likewise, only decreased Asp and Ala contents in IW grain in 2019 and decreased Cys in IW grain in 2020 were observed as compared to MW at the N2 level. By contrast, half of the NEAAs fraction contents in IW grain were decreased in comparison with MW at the N3 level. In all, wheat grain Asp content in 2019 and Gln content in 2020 were decreased when wheat was intercropped with faba bean regardless of N levels, and a similar or higher content for other NEAAs fractions in IW grain was observed relative to MW (Table 5).

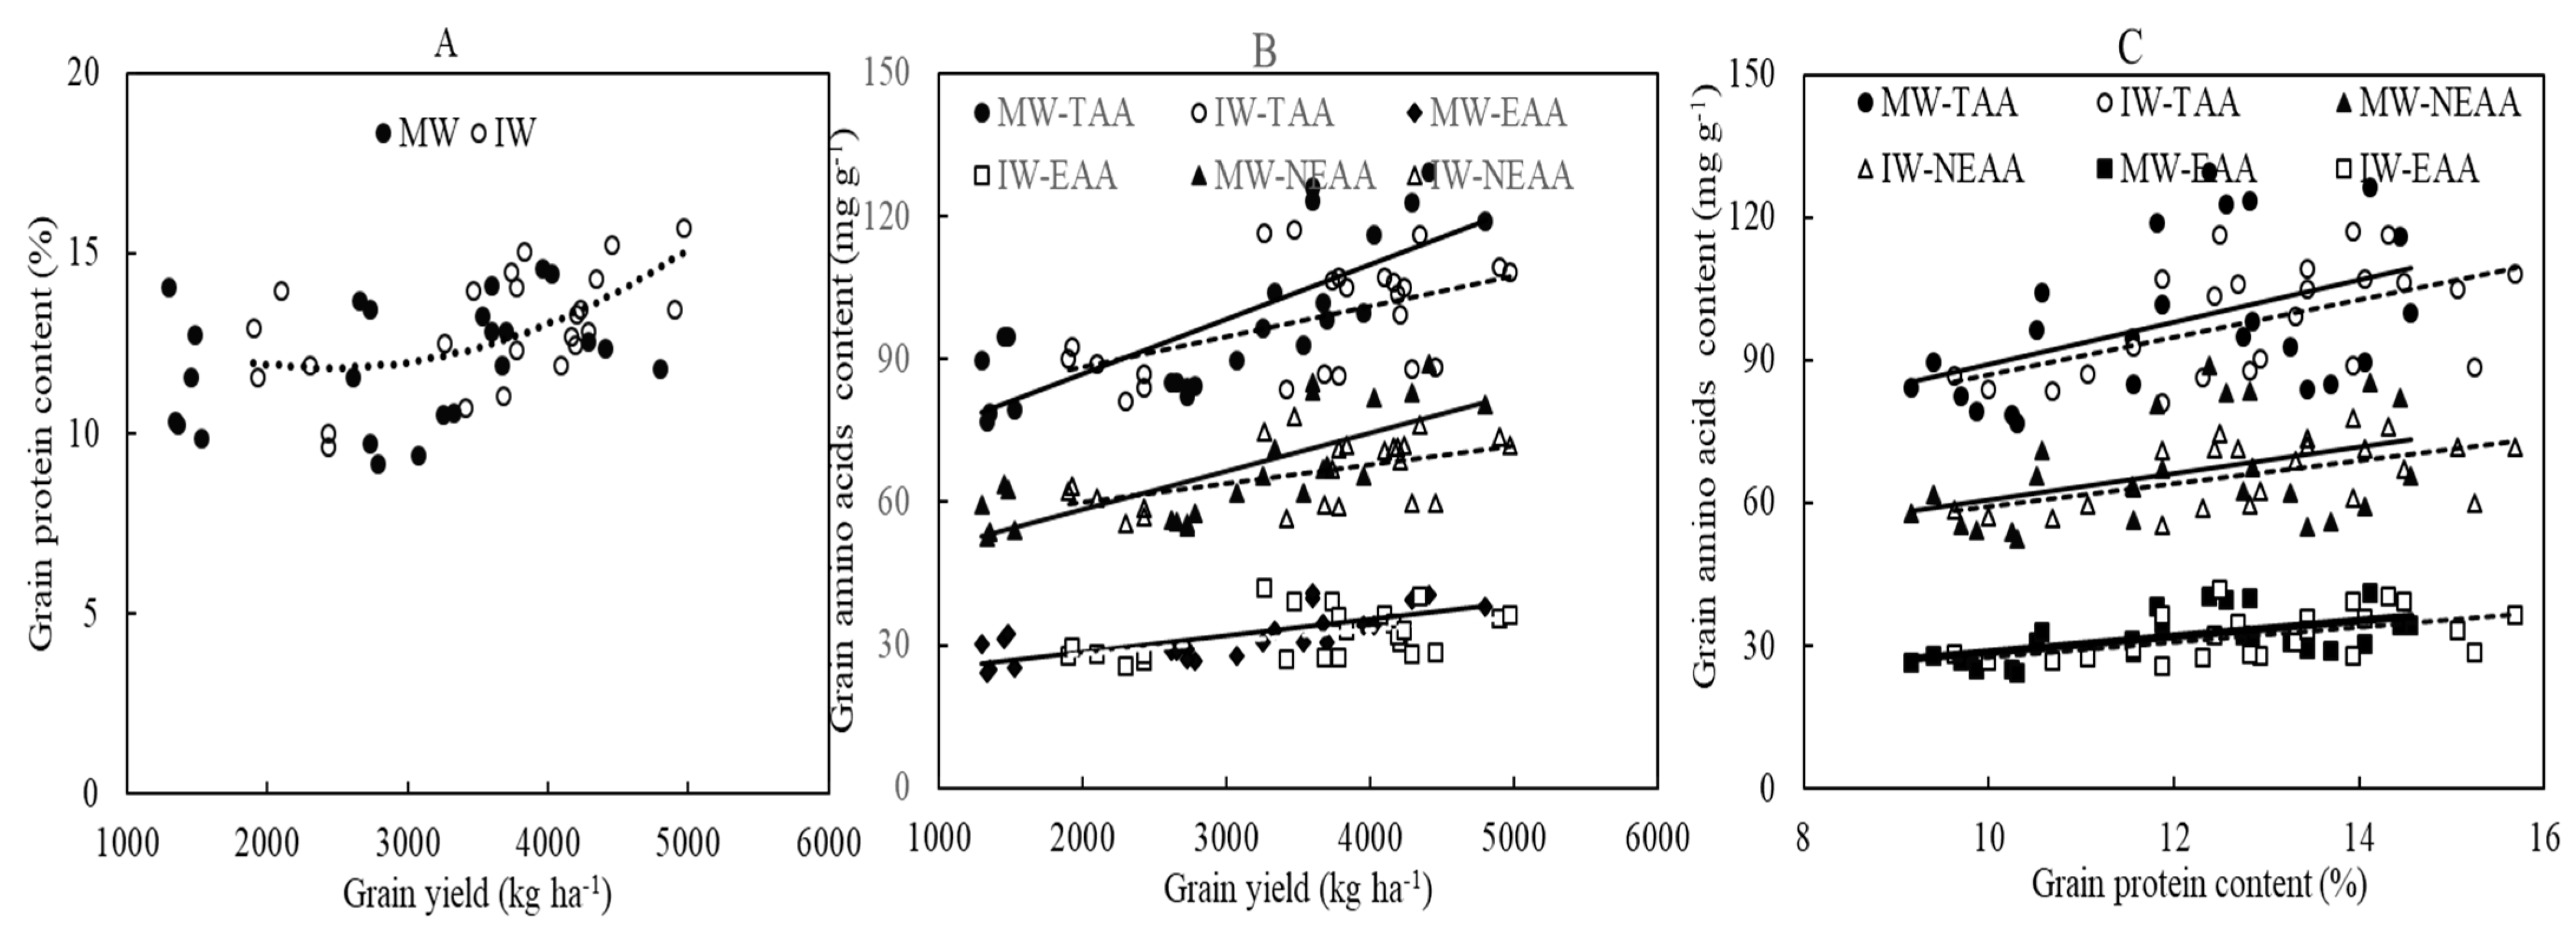
3.6. Co-Relationship of Between Grain Yield, Grain Protein Content, and Amino Acids Content for Mono- and Inter-Cropped Wheat

No relationship between GY and GPC was found for MW, but a quadratic regression was fitted to the relationship between GY and GPC in IW. A positive relationship between GY and AAs content including TAAs, NEAAs, and EAAs was presented, and the AAs content was positively related to GPC (Figure 5).

4. Discussion

4.1. Effect of Cereal and Legume Intercropping on Grain Protein Content

GPC is an important index to reflect wheat quality; thus, it is of importance to simultaneously achieve high GPC and GY in wheat practice [35]. The present findings are in accordance with a previous study [17] that wheat and faba bean intercropping could simultaneously achieve both high GY and GPC because increased GPC in 2020 and increased protein yield in both years were found, and the intercropping effect was not influenced by N rates (Table 1). Yet, it was noted that GY and N uptake in intercropping depended on the maximum plant height, canopy, radiation use efficiency, interspecies interaction, the period of co-growing season, and so on [36]. Hence, conflict results of the effect of intercropping on GY and GPC were presented in different cereal-legume intercropping systems [22,36]. The wheat N uptake ability from flowering to maturity was one of the main reasons for the high GPC [37] and the N remobilization process was a potential target for improving the quality of wheat grain [20]. Recent studies found that wheat and faba bean intercropping stimulated wheat N uptake during mid- and late- growth stages and induced more N to shift from straws to grain due to intercropping up-regulating the key N assimilation enzyme activity and gene expression during the reproductive growth stages [38,39]. Thus, it could partly explain the reason for intercropping increasing GPC in the present study. Some temporary legume-based intercropping patterns were adopted in many regions due to overcoming some problems including technical and competition in intercropping, and in such conditions, legumes usually improved soil N availability for cereal and finally changed cereal GY and GPC [23,40]. In the present study, we observed that continuous intercropping increased soil N availability especially under low-N-input conditions (Supplementary Table); thus, we could not distinguish the role of the long- and short-term intercropping in improved GPC and GY.
In the present study, increased gliadins in both years and increased glutenins in 2019 were found due to wheat intercropped with faba bean (Figure 3). Gliadins and glutenins content determined the bread-making characteristics of wheat [41], because they play an important role in dough rheology [42]. These results in the present study meant that intercropping could alter the end-use of wheat quality, and more studies are needed to elucidate the mechanism of intercropping modulating protein fractions and their role related to wheat grain quality.
The present finding is partly in accordance with the results of a global meta-analysis that split N had a greater effect on wheat yield and protein content in less fertile soils and at high N rates [43], because GPC was increased by N input in 2020 but was not influenced by N rate in 2019 at the current situation (Table 1). Thus, N management is still a good strategy to improve GPC in the southwest of China. In a previous study, we found that wheat and faba bean had potential to save N input but still maintain wheat grain yield [21]; however, according to the present study, we could not ascertain whether decreased N input in intercropping would affect wheat GPC. This suggests that both GY and GPC should be taken into account when establishing an optimal N rate in the cereal and legume intercropping system.

4.2. Effect of Cereal and Legume Intercropping on Grain Amino Acids Content

In the present study, we found that the effect of intercropping on AAs content including NEAAs and EAAs was dependent on N levels, because some EAAs and NEAAs fractions declined due to intercropping when N was overused (N3 level), but some AAs fractions increased when wheat was intercropped with faba bean at low N levels (N0 and N1 level) (Table 4 and Table 5). Taken together, the effect of intercropping on GPC was not affected by N rates in the present study, but it seems that wheat N input should not exceed 180 kg ha−1 in intercropping, because intercropping declined wheat AAs content at the N3 level (Table 1). Actually, wheat protein quality is not only dependent on the protein content but also related to the balance of AAs [44]. However, few studies have focused on intercropping on cereal AAs content. Thus, the findings in the present study suggest that modulating N rates should be imperative to wheat grain quality in the legume-based intercropping system.
High NEAAs, especially high Pro and Glu content, were found in the present study (Table 5), which is in accordance with a previous study [45], whereas NEAAs such as Pro and Glu have a low nutritional value; thus, improvement in EAAs is more important for wheat grain quality. In the present study, it seems that intercropping did not modulate the ratio of EAAs to NEAAs, though there was year’s variation (Figure 4), and intercropping had a greater impact on wheat grain protein rather than AAs. These findings should be linked with N remobilization and protein production during grain development. Still, more work on AAs and protein synthesis in intercropping could fully understand the findings.

4.3. Cereal and Legume Intercropping Modulated the Relationship between Grain Yield and Quality

The present study supports a previous study that when agronomic practices were given consideration, there was no trade-off between GY and quality [46], because we found steady GPC (10–15%) with increasing GY for MW, and GPC tended to increase with increasing GY for IW (Figure 5). Actually, wheat GPC content was largely dependent on post-anthesis N uptake [26]. Hence, the shift in the enhanced wheat N from the leaves and the stem to the grain and the stimulated wheat growth rate during the wheat mid-growing season [39,47] should be responsible for the changed correlation between GY and GPC in intercropping. The rainfall and temperature during 2018/2019 and 2019/2020 growing seasons were different (Figure 1), which might induce the effect of intercropping and N levels on GPC, which was different year by year in the present study (Table 1). However, the intercropping yield advantage was stable in the two-year field experiment (Table 1); thus, we thought that grain quality might be more sensitive to temperature and rainfall than grain yield. Hence, no relationship between GY and GPC was found for MW in the present study, but more work should still be conducted in the future to ascertain the correlation between GY and GPC under the current situation.
An early study from Eppendorfer found that correlations between AAs and N content within a variety were similar [48]. However, the correlation between wheat, maize, and soybean GPC and AAs presented a high variation [45,49]. In the present study, linear regression equations were established and significant correlations were found both between AAs and GCP and between AAs and GY for mono- and inter-cropped wheat grain (Figure 5), but we did not analyze the relationship between each AA and GPC and GY. According to our findings, intercropping either increased or decreased some specific AAs content, and intercropping affected the contents of TAAs, EAAs, and NEAAs in wheat grain under different N levels; hence, it could deduce the relationship between GPC and the given AA, which should change due to intercropping.

5. Conclusions

Higher protein yield and AAs yield were obtained when wheat was intercropped with faba bean. Intercropping mainly increased wheat GPC rather than AAs content because intercropping had no impact on AAs content regardless of N levels, but the 9% GPC of IW was higher than that of MW in 2020. Wheat gliadin content was increased on average by 8–14% when intercropped with faba bean. Similarly, some EAAs and NEAAs fraction contents were increased due to intercropping under N0 and N1 levels, but IW presented lower contents of EAAs and NEAAs fractions at the N3 level relative to MW. There was no trade-off relationship between GPC and GY according to regression analysis in the present study, and intercropping was a good option for simultaneously achieving both high GY and GPC. Hence, wheat and faba bean intercropping presented a potential to improve both wheat grain quality and yield, and modulated N rates were important to maximize the intercropping advantage in terms of grain quality. We suggest that the wheat N application rate should not exceed 180 kg ha−1 to achieve both intercropping yield and quality advantages in the southwest of China and similar regions.

Supplementary Materials

The following supporting information can be downloaded at: https://www.mdpi.com/article/10.3390/agronomy12122984/s1, Table S1: Soil total nitrogen and available nitrogen contents in the each treatment at soil depths of 0–20cm before the start of the experiment of 2018–2019.

Author Contributions

Conceptualization, J.X. and Y.Z.; methodology, Y.D. and L.T.; formal analysis, Y.-a.Z., J.H. and Z.Y.; investigation, Y.-a.Z., J.H., Z.Y., D.Z., H.L., X.W.; writing—original draft preparation, Y.-a.Z.; writing—review and editing, J.H.; funding acquisition, J.X. All authors have read and agreed to the published version of the manuscript.

Funding

This work was supported by the National Natural Science Foundation of China (32060718 and 31760611) and the Yunnan Agricultural Foundation Joint Project (2018FG001-071).

Data Availability Statement

Not applicable.

Acknowledgments

We thank LetPub (www.letpub.com) for its linguistic assistance during the preparation of this manuscript.

Conflicts of Interest

The authors declare no conflict of interest.

References

  1. Beillouin, D.; Ben-Ari, T.; Makowski, D. Evidence map of crop diversification strategies at the global scale. Environ. Res. Lett. 2020, 15, 19601. [Google Scholar] [CrossRef]
  2. Martin-Guay, M.; Paquette, A.; Dupras, J.; Rivest, D. The new green revolution: Sustainable intensification of agriculture by intercropping. Sci. Total Environ. 2018, 615, 767–772. [Google Scholar] [CrossRef] [PubMed]
  3. Raseduzzaman, M.; Jensen, E.S. Does intercropping enhances yield stability in arable crop production? Ameta-analysis. Eur. J. Agron. 2017, 91, 25–33. [Google Scholar] [CrossRef]
  4. Aydemir, S.K.; Kızılşimşek, M. Assessing yield and feed quality of intercropped sorghum and soybean in different planting patterns and in different ecologies. Int. J. Environ. Sci. Technol. 2019, 16, 5141–5146. [Google Scholar] [CrossRef]
  5. Ullah, M.A.; Hussain, N.; Schmeisky, H.; Rasheed, M.; Anwar, M.; Rana, A.S. Foder quality improvement through intercropping and fertilizer applicaiton. Pak. J. Agri. Sci. 2018, 55, 549–554. [Google Scholar]
  6. Zhang, J.; Yin, B.; Xie, Y.; Li, J.; Yang, Z.; Zhang, G. Legume-cereal intercropping improves forage yield, quality and degradability. PLoS ONE 2015, 10, e0144813. [Google Scholar] [CrossRef] [PubMed]
  7. Li, C.; Dong, Y.; Li, H.; Shen, J.; Zhang, F. Shift from complementarity to facilitation on P uptake by intercropped wheat neighboring with faba bean when available soil P is depleted. Sci. Rep. 2016, 6, 18663. [Google Scholar] [CrossRef] [PubMed] [Green Version]
  8. Belel, M.D.; Halim, R.A.; Rafii, M.Y.; Saud, H.M. Intercropping of orn with some selected legumes for improved forage production: A review. J. Agr. Sci. 2014, 6, 44. [Google Scholar]
  9. Lepse, L.; Sandra, D.; Zeipina, S.; Domínguez-Perles, R.; Eduardo, A.S. Evaluation of vegetable-faba bean (Vicia faba L.) intercropping under Latvian agro-ecological conditions. J. Sci. Food Agr. 2017, 97, 4334–4342. [Google Scholar] [CrossRef] [PubMed]
  10. Salem, A.K.; Fadia, M.; Sultan, F.M.; El-Douby, K.A. Effect of intercropping cowpea (Vigna unguiculata L.) with teosinte (Zea mexicana Schrad) on forage yield productivity and its quality. Egypt J. Agron. 2019, 41, 183–196. [Google Scholar] [CrossRef]
  11. Putnam, D.H.; Herbert, S.J.; Vargas, A. Intercropped corn-soyabean density studies. II. Yield composition and protein. Exp. Agric. 1986, 22, 373–381. [Google Scholar] [CrossRef]
  12. Abdel Magid, H.M.; Ghoneim, M.F.; Rabie, R.K.; Sabrah, R.E. Productivity of wheat and alfalfa under intercropping. Exp. Agr. 1991, 27, 391–395. [Google Scholar] [CrossRef]
  13. Wen, B.; Zhang, X.; Ren, S.; Duan, Y.; Zhang, Y.; Zhu, X.; Wang, Y.; Ma, Y.; Fan, W. Characteristics of soil nutrients, heavy metals and tea quality in different intercropping patterns. Agroforest Syst. 2019, 94, 1–12. [Google Scholar] [CrossRef]
  14. Qiao, X.; Chen, X.; Lei, J.; Sai, L.; Xue, L. Apricot-based agroforestry system in Southern Xinjiang Province of China: Influence on yield and quality of intercropping wheat. Agroforest Syst. 2020, 94, 477–485. [Google Scholar] [CrossRef] [Green Version]
  15. Gafurova, D.A.; Tursunkhodzhaev, P.M.; Kasymova, T.D.; Yuldashev, P.K. Fractional and amino-acid composition of wheat grain cultivated in Uzbekistan. Chem. Nat. Compd. 2002, 38, 462–465. [Google Scholar] [CrossRef]
  16. Stoltz, E.; Nadeau, E. Effects of intercropping on yield, weed incidence, forage quality and soil residual N in organically grown forage maize (Zea mays L.) and faba bean (Vicia faba L.). Field Crop Res. 2014, 169, 21–29. [Google Scholar] [CrossRef]
  17. Mthembu, B.E.; Everson, T.M.; Everson, C.S. Intercropping for enhancement and provisioning of ecosystem services in smallholder, rural farming systems in KwaZulu-Natal Province, South Africa: A review. J. Crop Improv. 2018, 33, 145–176. [Google Scholar] [CrossRef]
  18. Wenefrida, I.; Utomo, H.S.; Blanche, S.B.; Linscombe, S.D. Enhancing essential amino acids and health benefit components in grain crops for improved nutritional values. Recent Pat. DNA Gene Seq. 2009, 3, 219–225. [Google Scholar] [CrossRef] [PubMed]
  19. Uauy, C.; Brevis, J.C.; Dubcovsky, J. The high protein content gene Gpc-B1 accelerates senescence and has pleiotropic effects on protein content in wheat. J. Exp. Bot. 2006, 57, 2785–2794. [Google Scholar] [CrossRef] [PubMed]
  20. Zhong, Y.; Xu, D.; Hebelstrup, K.H.; Yang, D.; Cai, J.; Wang, X.; Zhou, Q.; Cao, W.; Dai, T.; Jiang, D. Nitrogen topdressing timing modifies free amino acids profiles and storage protein gene expression in wheat grain. BMC Plant Biol. 2018, 18, 353. [Google Scholar] [CrossRef]
  21. Xiao, J.; Yin, X.; Ren, J.; Zhang, M.; Tang, L.; Zheng, Y. Complementation drives higher growth rate and yield of wheat and saves nitrogen fertilizer in wheat and faba bean intercropping. Field Crop Res. 2018, 221, 119–129. [Google Scholar] [CrossRef]
  22. Tosti, G.; Guiducci, M. Durum wheat–faba bean temporary intercropping: Effects on nitrogen supply and wheat quality. Europ. J. Agron. 2010, 33, 157–165. [Google Scholar] [CrossRef]
  23. De Stefanis, E.; Sgrulletta, D.; Pucciarmati, S.; Ciccoritti, R.; Quarant, F. Influence of durum wheat-faba bean intercrop on specific quality traits of organic durum wheat. Biol. Agric. Hortic. 2016, 33, 28–29. [Google Scholar] [CrossRef]
  24. Pellegrini, F.; Carlesi, S.; Nardi, G.; Bàrberi, P. Wheat–clover temporary intercropping under Mediterranean conditions affects wheat biomass, plant nitrogen dynamics and grain quality. Eur. J. Agron. 2021, 130, 126347. [Google Scholar] [CrossRef]
  25. Tari, A. The effects of different deficit irrigation strategies on yield, quality, and water-use efficiencies of wheat under semi-arid conditions. Agric. Water Manag. 2016, 167, 1–10. [Google Scholar] [CrossRef]
  26. Sieling, K.; Kage, H. Apparent fertilizer N recovery and the relationship between grain yield and grain protein concentration of different winter wheat varieties in a long-term field trial. Eur. J. Agron. 2021, 124, 126246. [Google Scholar] [CrossRef]
  27. Vrignon-Brenas, S.; Celette, F.; Piquet-Pissaloux, A.; Corre-Hellou, G.; David, C. Intercropping strategies of white clover with organic wheat to improve the trade-off between wheat yield, protein content and the provision of ecological services by white clover. Field Crop Res. 2018, 224, 160–169. [Google Scholar] [CrossRef]
  28. Xiao, J.; Zhu, Y.; Bai, W.; Liu, Z.; Tang, L.; Zheng, Y. Yield performance and optimal nitrogen and phosphorus application rates in wheat and faba bean intercropping. J. Integr. Agr. 2021, 20, 3012–3025. [Google Scholar] [CrossRef]
  29. Berecz, K.; Simon-Sarkadi, L.; Ragasits, I.; Hoffmann, S. Comparison of protein quality and mineral element concentrations in grain of spelt (Triticum spelta L.) and common wheat (Triticum aestivum L.). Arch. Agron. Soil Sci. 2001, 47, 389–398. [Google Scholar] [CrossRef]
  30. Triboi, E.; Martre, P.; Triboi-Blondel, A. Environmentally-induced changes in protein composition in developing grains of wheat are related to changes in total protein content. J. Exp. Bot. 2003, 54, 1731–1742. [Google Scholar] [CrossRef] [PubMed]
  31. Adebiyi, A.P.; Aluko, R.E. Functional properties of protein fractions obtained from commercial yellow field pea (Pisum sativum L.) seed protein isolate. Food Chem. 2011, 128, 902–908. [Google Scholar] [CrossRef]
  32. Markwell, M.A.K.; Haas, S.M.; Bieher, I.I.; Tonbert, N.E. A modification of the Lowry procedure to simplify protein determination in membrane and lipoprotein samples. Ann. Biochem. 1978, 117, 136. [Google Scholar] [CrossRef] [PubMed]
  33. Wu, G. Amino acids: Metabolism, functions, and nutrition. Amino Acids 2009, 37, 1–17. [Google Scholar] [CrossRef]
  34. Metho, L.; Taylor, J.; Hammes, P.S.; Randal, P.G. Effects of cultivar and soil fertility on grain protein yield, grain protein content, flour yield and breadmaking quality of wheat. J. Sci. Food Agric. 1999, 79, 1823–1831. [Google Scholar] [CrossRef]
  35. Ma, J.; Xiao, Y.; Hou, L.; He, Y. Combining protein content and grain yield by genetic dissection in bread wheat under low-input management. Foods 2021, 10, 1058. [Google Scholar] [CrossRef] [PubMed]
  36. Baumann, D.T.; Bastiaans, L.; Goudriaan, J.; van Laar, H.H.; Kropff, M.J. Analysing crop yield and plant quality in an intercropping system using an eco-physiological model for interplant competition. Agr. Syst. 2002, 73, 173–203. [Google Scholar] [CrossRef]
  37. Rozbicki, J.; Ceglińska, A.; Gozdowski, D.; Jakubczak, M.; Cacak-Pietrzak, G.; Madry, W.; Golba, J.; Piechocinski, M.; Sobczynski, G.; Studnicki, M.; et al. Influence of the cultivar, environment and management on the grain yield and bread-making quality in winter wheat. J. Cereal Sci. 2015, 61, 126–132. [Google Scholar] [CrossRef]
  38. Liu, Z.; Wu, X.; Tang, L.; Zheng, Y.; Li, H.; Pan, H.; Zhu, D.; Wang, J.; Huang, S.; Qin, X.; et al. Dynamics of N acquisition and accumulation and its interspecific N competition in a wheat-faba bean intercropping system. J. Plant Nutr. Fertil. 2020, 26, 1284–1294. (In Chinese) [Google Scholar]
  39. Liu, Z.; Zhu, Y.; Dong, Y.; Tang, L.; Zheng, Y.; Xiao, J. Interspecies interaction for nitrogen use efficiency via up-regulated glutamine and glutamate synthase under wheat-faba bean intercropping. Field Crop Res. 2021, 274, 108324. [Google Scholar] [CrossRef]
  40. Marcello, G.; Giacomo, T.; Beatrice, F.; Paolo, B. Sustainable management of nitrogen nutrition in winter wheat through temporary intercropping with legumes. Agron. Sustain. Dev. 2018, 38, 31. [Google Scholar]
  41. Malik, A.H.; Kuktaite, R.; Johansson, E. Combined effect of genetic and environmental factors on the accumulation of proteins in the wheat grain and their relationship to bread-making quality. J. Cereal Sci. 2013, 57, 170–174. [Google Scholar] [CrossRef]
  42. Barak, S.; Mudgil, D.; Khatkar, B.S. Biochemical and functional properties of wheat gliadins: A review. Crit. Rev. Food Sci. Nutr. 2015, 55, 357–368. [Google Scholar] [CrossRef]
  43. Hu, C.; Sadras, V.O.; Lu, G.; Zhang, P.; Han, Y.; Liu, L.; Xie, J.; Yang, X.; Zhang, S. A global meta-analysis of split nitrogen application for improved wheat yield and grain protein content. Soil Till. Res. 2021, 213, 105111. [Google Scholar] [CrossRef]
  44. Jiang, X.; Wu, P.; Tian, J. Genetic analysis of amino acid content in wheat grain. J. Genet. 2014, 93, 451–458. [Google Scholar] [CrossRef]
  45. Hassan, A.E.; Heneidak, S.; Gowayed, S. Comparative studies of some Triticum species by grain protein and amino acids analyses. J. Agron. 2007, 6, 286–293. [Google Scholar]
  46. Anderson, W.K.; Shackley, B.J.; Sawkins, D. Grain yield and quality: Does there have to be a trade-off? Euphytica 1997, 100, 183–188. [Google Scholar] [CrossRef]
  47. Xiao, J.; Dong, Y.; Yin, X.; Ren, J.; Tang, L.; Zheng, Y. Wheat growth is stimulated by interspecific competition after faba bean attains its maximum growth rate. Crop Sci. 2018, 58, 1–14. [Google Scholar] [CrossRef]
  48. Eppendorfer, W.H. Effects of nitrogen, phosphorus and potassium on amino acid composition and on relationships between nitrogen and amino acids in wheat and oat grain. J. Sci. Food Agr. 1978, 29, 995–1001. [Google Scholar] [CrossRef]
  49. Sriperm, N.; Pesti, G.M.; Tillman, P.B. The distribution of crude protein and amino acid content in maize grain and soybean meal. Anim. Feed Sci. Tech. 2010, 159, 131–137. [Google Scholar] [CrossRef]
Figure 1. The monthly average temperature and rainfall during experiments of 2018–2019 and 2019–2020.
Agronomy 12 02984 g001
Figure 2. Diagram of the planting pattern for wheat and faba bean intercropping and mono-cropped wheat in the field experiment.
Agronomy 12 02984 g002
Figure 3. Grain protein fraction content between IW and MW under different N levels. MW, mono-cropped wheat; IW, intercropping wheat. (AD) Albumin, globulin, gliadin, and glutelin content of IW and MW in 2019, respectively; (EH) albumin, globulin, gliadin, and glutelin content of IW and MW in 2020, respectively. Different letters represent significant differences among different N levels (p < 0.05); * represents significant differences between IW and MW (p < 0.05). Each bar in the figures is the mean value (n = 3), and error bars represent the standard error.
Agronomy 12 02984 g003
Figure 4. Essential amino acids, non-essential amino acids, and the ratio of essential amino acids to total amino acids between IW and MW under different N levels. (A,D) Essential amino acids in 2019 and 2020, respectively; (B,E) non-essential amino acids in 2019 and 2020, respectively; (C,F) ratio of essential amino acids to total amino acids in 2019 and 2020, respectively. MW, mono-cropped wheat; IW, intercropping wheat; different letters represent significant differences among all treatments. Each bar in the figures is the mean value (n = 3), and error bars represent standard error.
Agronomy 12 02984 g004
Figure 5. Relationship analysis among grain yield, grain protein content, and grain amino acids fraction. (A) Relationship between grain yields and grain protein content. In panel A, grain yield as a function of grain protein content for IW (y = 5 × 10−7x2 − 0.0025x + 14.833, R² = 0.3228, p = 0.017, n = 24); (B) relationship between grain yields and grain amino acids fraction. In panel B, grain yield as a function of MW-TAA (y = 0.0115x + 63.997, R² = 0.5679, p = 0.00, n = 24), IW−TAA (y = 0.0065x + 75.28, R² = 0.2636, p = 0.01, n = 24), MW-NEAA (y = 0.0081x + 42.344, R² = 0.5676, p =0.000, n = 24), IW-NEAA (y = 0.004x + 51.937, R² = 0.2774, p = 0.008, n = 24), MW-EAA (y = 0.0034x + 21.653, R² = 0.5219, p = 0.00, n = 24), and IW-EAA (y = 0.0025x + 23.343, R² = 0.2135, p = 0.023, n = 24). (C) Relationship between grain protein content and grain amino acids fraction. In panel C, grain yield as a function of MW-TAA (y = 4.435x + 44.956, R² = 0.2079, p = 0.025, n = 24), IW-TAA (y = 3.9529x + 47.562, R² = 0.2924, p = 0.006, n = 24), MW-NEAA(y = 2.7833x + 32.919, R² = 0.1662, p = 0.048, n = 24), IW-NEAA (y = 2.4028x + 35.344, R² = 0.2968, p = 0.006, n = 24), MW-EAA (y = 1.6517x + 12.038, R² = 0.2976, p = 0.006, n = 24), and IW-EAA (y = 1.5501x + 12.218, R² = 0.2506, p = 0.013, n = 24). MW, mono-cropped wheat; IW, intercropping wheat. TAA, NEAA, and EAA: total amino acids, non-essential amino acids, and essential amino acids, respectively. The dot-dashed line and solid line represent linear regressions for IW and MW, respectively.
Agronomy 12 02984 g005
Table 1. The protein and total amino acids content and yield for inter- and mono-cropped wheat grain under different N levels.
N LevelsPlanting Patterns2019202020192020
(NL)(PP)GYProtein ContentProtein YieldGYProtein ContentProtein YieldTAAs ContentTAAs YieldTAAs ContentTAAs Yield
t ha−1%g m−2t ha−1%g m−2mg g−1g m−2mg g−1g m−2
N0 1.69 d13 a2.17 d1.90 c10 c1.97 d92 c1.55 d 81 d 1.56 d
N1 3.08 c13 a4.11 c3.24 b10 c3.41 c99 b3.10 c86 c2.78 c
N2 4.02 b14 a5.45 b3.72 a12 b4.53 b95 bc3.81 b103 b 3.85 b
N3 4.62 a13 a6.19 a3.92 a14 a5.37 a117 a5.41 a113 a4.41 a
.
MW3.08 b13 a 3.92 b2.86 b11 b3.30 b100 a3.20 b96 a 2.88 b
IW3.63 a14 a5.04 a 3.53 a12 a4.34 a 102 a3.74 a95 a3.42 a
N0MW1.41 a13 a1.80 a 1.41 a10 a1.43 a93 c1.32 e78 e1.11 e
IW1.98 a13 a2.54 a2.39 a11 a2.50 a91 cd1.79 d84 d2.01 d
N1MW2.67 a13 a3.44 a2.87 a9 a2.70 a85 d2.26 c85 d2.45 c
IW3.49 a14 a4.78 a3.63 a11 a 4.12 a113 b3.95 b86 d3.11 b
N2MW3.72 a13 a4.94 a3.43 a11 a3.90 a98 bc3.66 b100 c3.42 b
IW4.32 a14 a5.97 a4.01 a13 a5.15 a92 cd3.96 b107 b4.29 a
N3MW4.50 a12 a5.51 a3.74 a14 a5.17 a124 a5.56 a122 a4.56 a
IW4.74 a14 a6.87 a4.09 a14 a5.56 a111 b5.26 a105 bc4.27 a
Sig
NL ***ns************************
PP ***ns**********ns***ns***
NL × PP nsnsnsnsnsns************
MW, mono-cropped wheat; IW, inter-cropped wheat; GY, grain yield; TAA, total amino acid. In each column, different letters represent significant differences among treatments at the 0.05 level according to Duncan’s multiple range test. * and *** represent significant differences at 0.05 and 0.001 levels, respectively. ns represents no significant difference.
Table 2. Two-way ANOVA analysis of grain protein composition for inter- and mono-cropped wheat under different N levels.
20192020
AlbuminGlobulinGliadinGlutelinAlbuminGlobulinGliadinGlutelin
N levels (NL)*********************
Planting patterns(PP)*ns***nsns***ns
NL×PPnsnsnsNsnsns**ns
In each column, *, **, and *** represent significant differences at 0.05, 0.01, and 0.001 levels, respectively. ns represents no significant difference.
Table 3. Two-way ANOVA analysis of non-essential amino acids and essential amino acids for inter- and mono-cropped wheat under different N levels.
2019 2020
NEAAsEAAsEAAs/TAAsNEAAsEAAsEAAs/TAAs
N levels (NL)*****************
Planting patterns (PP)nsnsnsnsnsns
NL × PP*****************
In each column, ** and *** represent significant differences at 0.01 and 0.001 levels, respectively. ns represents no significant difference.
Table 4. The fraction content of each essential amino acids in grain for inter- and mono-cropped wheat grain under different N levels.
N Levels (NL)Planting Patterns (PP)20192020
ThrValMetIleLeuPheHisLysThrValMetIleLeuPheHisLys
%
N0MW3.45 d0.94 b 7.98 c 3.45 d6.13 d 4.43 e 2.20 c 2.70 a 2.86 a0.16 e5.56 c3.34 a5.39 a 4.58 a 1.37 d1.50 c
IW3.51 cd0.80 bc5.59 e3.54 d 6.26 d 4.68 e 2.04 c 1.96 c 3.21 a0.50 cd5.72 c3.36 a5.97 a4.29 a1.92 c1.94 b
N1MW3.44 d0.65 cd6.70 d3.45 d6.14 d4.38 e1.84 d2.33 b 3.23 a0.53 cd6.21 bc3.26 a5.91 a4.46 a1.53 d1.96 b
IW4.38 a 1.24 a10.80 a4.20 abc8.40 a6.00 c2.43 b2.68 a 3.34 a0.38 d5.48 c3.44 a6.06 a4.81 a1.88 c1.84 b
N2MW3.86 bc0.65 cd7.98 c3.88 bc7.23 bc5.39 d1.73 d2.46 ab3.63 a0.72 b7.20 b3.57 a7.05 a5.13 a2.33 b1.85 b
IW3.69 cde 0.49 e5.70 e3.70 cd6.66 cd5.16 d1.85 d1.84 c 3.69 a0.94 a9.67 a3.83 a7.25 a5.13 a2.55 a2.52 a
N3MW4.51 a0.92 b9.05 b4.70 a8.47 a7.20 a2.45 b2.17 b 4.20 a0.96 a9.39 a4.58 a7.78 a6.24 a2.60 a2.65 a
IW3.98 b0.55 de9.21 b4.33 ab7.99 ab6.70 b2.69 a1.99 c 3.95 a0.66 bc6.74 b4.14 a7.26 a5.88 a2.25 b1.94 b
N0 3.48 c 0.87 a6.79 b3.49 b6.20 c 4.55 c 2.12 b 2.33 b 3.04 c0.33 c 5.64 b3.35 b 5.68 b4.43 c 1.65 b1.72 c
N1 3.91 b0.95 a8.75 a3.82 b7.27 b5.19 b2.14 b2.50 a3.28 c0.45 b5.84 b3.35 b5.99 b4.63 c1.70 b1.90 b
N2 3.78 b0.57 c6.84 b3.79 b6.95 b5.28 b1.79 c2.15 c3.66 b0.83 a8.44 a3.70 b7.15 a5.13 b2.44 a2.19 a
N3 4.25 a0.73 b9.13 a4.51 a8.23 a6.95 a 2.57 a2.08 c4.07 a0.81 a8.06 a4.36 a7.52 a6.06 a2.43 a2.29 a
MW3.82 a 0.79 a7.93 a 3.87 a6.99 a5.35 b 2.06 b 2.41 a 3.48 a 0.59 a7.09 a3.68 a6.53 a5.10 a 1.96 b1.99 a
IW3.89 a0.77 a7.82 a3.94 a7.33 a5.64 a2.25 a2.12 b3.55 a0.62 a6.90 a3.69 a6.63 a5.03 a2.15 a2.06 a
Sig
NL × PP **********************ns******nsnsns******
NL ************************************************
PP NsnsnsNsns*******nsnsnsnsnsns***ns
MW, mono-cropped wheat; IW, intercropping wheat. Values with different letters are significantly different among the N levels, planting pattern, and interaction of N levels and planting pattern according to Duncan’s multiple range test (two-way ANOVA, p < 0.05). *, p < 0.05; ***, p < 0.001; ns, no significance.
Table 5. The fraction content of each non-essential amino acids in grain for inter- and mono-cropped wheat grain under different N levels.
N Levels (NL)Planting Patterns (PP)20192020
AspGluSerArgGlyProAlaCysTyrAspGluSerArgGlyProAlaCysTyr
N0MW5.81 ab 26.30 de4.47 ef 5.14 bc 3.24a 9.22 c 5.33 abc1.07 a1.22 b4.03 d22.64d 4.08 a4.27 e2.80 e9.81 a3.72c 1.32a 0.87 c
IW4.87 cd26.56 cde4.50 ef4.59 ef3.23 a10.83 b 5.39 ab1.09 a1.17 b4.67 bc24.09 cd4.44 a4.73 d 3.07 d9.55 a4.16bc 1.03b 1.30 b
N1MW5.16 bcd21.98 e4.20 f4.59 c3.20 a9.34 c5.03 bc 1.13 a1.10 b4.54 bc24.96 c4.38 a4.77 cd3.09 d10.27a 4.26 bc0.77 bc1.27 b
IW6.03 ab32.97 b5.87 ab5.49 ab3.58 a11.35 b 6.01 a0.47 c1.42 b4.45 c24.60 cd4.34 a4.92 cd 3.24 cd10.31 a3.88 c1.42a 1.28 b
N2MW6.15 a25.79 de5.11 cd5.13 bc3.61 a11.79 b 5.78 a0.21 d1.36 b4.60 bc31.56 b4.97 a5.22 bc3.39 c11.43 a4.63 b0.98 b1.30 b
IW4.36 d 27.66 cd4.81 de5.07 cd3.45 a11.16 b4.42 d0.70 b1.14 b6.27 a32.50 b4.92 a5.09 bcd3.49 bc11.72 a5.60 ab0.42 d1.20 b
N3MW5.53 abc 38.36 a6.10 a 5.82 a4.20 a16.50 a5.42 ab0.50 c1.76 a6.42 a38.62 a5.59 a6.19 a 4.19 a14.40 a5.82 a0.76 bc1.52 a
IW5.24 abcd31.40 bc 5.45 bc5.63 bc3.93 a15.50 a4.67 cd0.59 bc 1.43 b4.97 b32.23 b5.36a 5.47 b3.72 b13.32 a4.64 b0.57cd 1.46 a
N0 5.34 a 26.43 b4.48 c 3.24 b3.24 c 10.03 c5.36 a 1.08 a1.20 b 4.35 b23.36 d 4.26 c4.50 d 2.94 d9.68 c3.94 b1.17 a1.09 c
N1 5.60 a27.48 b5.04 b3.20 b3.39 bc10.34 c5.52 a0.80 b1.26 b4.49 b24.78 c4.36 c4.84 c3.17 c10.29 c 4.07 b1.09 a1.27 b
N2 5.26 a26.73 b4.96 b3.61 b3.53 b11.48 b5.10 a0.45 c1.25 b5.43 a32.03 b4.95 b5.15 b3.44 b11.58 b5.12 a0.70 b1.25 b
N3 5.39 a34.88 a 5.77 a4.20 a 4.06 a16.00 a 5.05 a0.55 c 1.60 a5.69 a 35.42 a5.48 a 5.83 a3.95 a 13.86 a5.23 a 0.66 b1.49 a
MW5.66 a28.11 a4.97 a 5.17 a3.56 a 11.71 b5.39 a 0.73 a1.36 a 4.90 b29.45 a 4.76 a5.11 a 3.37 a11.48 a 4.61 a0.96 a1.24 b
IW5.13 b 29.65 a 5.16 a5.19 a 3.55 a12.21 a 5.12 a0.71 a 1.29 a5.09 a 28.36 b4.77 a 5.05 a3.38 a 11.23 a4.57 a 0.86 a1.31 a
Sig
NL × PP **********ns****************ns******ns*********
NL Ns***************ns********************************
PP *nsnsnsns*nsNsns**nsnsnsnsnsns*
MW, mono-cropped wheat; IW, intercropping wheat. Values with different letters are significantly different among the N levels, planting pattern, and interaction of N levels and planting pattern according to Duncan’s multiple range test (two-way ANOVA, p < 0.05). *, p < 0.05; **, p < 0.01; ***, p < 0.001; ns, no significance.
Publisher’s Note: MDPI stays neutral with regard to jurisdictional claims in published maps and institutional affiliations.

