Article

Biochar-Compost Additions Have Strong Short-Term Effects on Carbon and Nitrogen Emissions from an Agricultural Soil

by
Regine Maier
1,2,*,
Gerhard Soja
3,4,
Wolfgang Friesl-Hanl
3,5,
Sophie Zechmeister-Boltenstern
5,
Kerstin Michel
1,
Michael Tatzber
1,6 and
Barbara Kitzler
1,*
1
Department for Soil Ecology, Federal Research and Training Centre for Forests, Natural Hazards and Landscape, Seckendorff-Gudent-Weg 8, 1131 Vienna, Austria
2
ETH Zürich, Universitätstrasse 2, 8092 Zürich, Switzerland
3
AIT—Austrian Institute of Technology GmbH, Konrad Lorenz-Str. 24, 3430 Tulln, Austria
4
Institute for Chemical and Energy Engineering, University of Natural Resources and Life Sciences, Muthgasse 107/I, 1190 Vienna, Austria
5
Institute for Soil Science, University of Natural Resources and Life Sciences, Peter-Jordan-Strasse 82, 1180 Vienna, Austria
6
Department of Forest Protection, Federal Research and Training Centre for Forests, Natural Hazards and Landscape, Seckendorff-Gudent-Weg 8, 1131 Vienna, Austria
*
Authors to whom correspondence should be addressed.
Agronomy 2022, 12(12), 2959; https://doi.org/10.3390/agronomy12122959
Submission received: 15 October 2022 / Revised: 21 November 2022 / Accepted: 22 November 2022 / Published: 25 November 2022

Abstract

:
Biochar (BC) application to agricultural soils has become a promising strategy for mitigation of soil-borne greenhouse gas (GHG) emissions, i.e., carbon dioxide (CO2), methane (CH4), and nitrous oxide (N2O), but little is known about the effects on nitric oxide (NO) and dinitrogen (N2) fluxes. We conducted a short-term field experiment to evaluate the effects of BC with compost and additional fertilizer on different soil GHG fluxes. Application of 1% BC-compost showed no significant effect on CH4 and CO2 fluxes but lowered NO and N2O fluxes compared to the control without BC-compost. The addition of N to BC-compost (0.5% BC-compost + 175 kg N) showed a small mitigation potential for CH4 whereas N2O and NO fluxes significantly increased for one week after the application. The N2:N2O ratio shifted towards N2O production after the application of N-enriched BC-compost. During storage of pure N-enriched BC-compost, high gaseous losses in the form of NO (71.2 ± 2 µg N g−1 h−1), N2O (1319 ± 101 µg N g−1 h−1), and N2 (337.8 ± 93 µg N g−1 h−1) were measured. Approximately 31% of applied N was lost in gaseous form even in the presence of BC. To avoid this, an optimized strategy to balance easily available N from compost and fertilizer with the amount of BC should be developed.

1. Introduction

Greenhouse gases change the Earth’s climate by absorbing and releasing radiative energy in the lower atmosphere. Anthropogenic GHG emissions have increased since the pre-industrial era and are now higher than ever before [1]. Carbon dioxide (CO2) emissions contribute most to global warming, although other greenhouse gases such as methane (CH4) or nitrous oxide (N2O) remain in the atmosphere for decades and affect the climate [2]. The main processes of soil CO2 fluxes are root and microbial respiration [3]. N2O, a potent and long-lived GHG can be either produced or consumed by different processes in the soil (autotrophic or heterotrophic nitrification, chemodenitrification, nitrifier-denitrification, denitrification, co-denitrification, ammonification) [4]. The amount of N2O produced depends largely on management, fertilization, crops, soil properties such as (texture, available carbon, pH, microbial activity, temperature, and water content e.g., [5]. CH4 is the second most important GHG after CO2. Two basic microbial processes control soil-borne CH4 emissions: (a) methane production by methanogenic archaea under strictly anoxic conditions (e.g., in waterlogged soils or at greater soil depth or in anoxic microsites) and (b) methane oxidation (consumption of methane) by methanotrophic bacteria that require oxygen or by nitrite-dependent anaerobic oxidation of methane [6]. As a result of biotic and abiotic processes, NO is both produced and consumed in soils. The main processes involved are microbial nitrification, denitrification and chemo-denitrification. The final step of denitrification, i.e., the production of dinitrogen (N2) by reduction of N2O, closes the global N cycle and consumes N2O.
Agriculture is the main source of anthropogenic non-CO2 GHG emissions, i.e., CH4 and N2O, accounting for 56% of total emissions worldwide [1]. Reducing these emissions represents an important mitigation potential for agricultural production systems in relation to climate change.
Biochar (BC) is a product of heating biomass to temperatures above 250 °C. This process, known as pyrolysis, produces a carbon-rich product [7]. It was shown that biochar generally decreases soil acidity, increases buffering capacity, dissolved and total organic carbon, CEC, available nutrients, water retention, porosity and surface area, and aggregate stability; and decreases soil density and nitrate leaching [7,8]. The amendment of BC on agricultural soils may have the potential to mitigate climate change due to carbon (C) storage and reduction of GHG emissions. Woolf et al. [9] estimated the potential to reduce net emissions of CH4, CO2, and N2O emissions by a maximum of 1.8 Pg CO2-C equivalent per year. However, the potential for GHG mitigation is strongly dependent on e.g., the soil type, the feedstock material, the ratio of BC, the pyrolysis temperature, the number of soil additives (compost or mineral fertilizer), and the predominant environmental conditions [10,11]. Furthermore, the effect of biochar may diminish over time as biochar ages in the soil [12,13] but the initial mitigation effect can be significant, and repeated applications can maintain mitigation benefits [14].
Recent studies have demonstrated CH4 oxidation and CH4 production after BC application [15,16]. Karhu et al. [16] reported an increase in CH4 uptake, due to increased soil aeration and reduced soil moisture fluctuations. In contrast, Kammann et al. [15] found no change in CH4 oxidation. Van Zwieten et al. [17] concluded that the positive effects of BC addition on net CH4 uptake can only be ensured with large active methanotrophic communities. It was reported that the effects of BC on CH4 emissions are often contradictory, and the underlying mechanisms are not yet fully understood [18,19].
Biochar plays an important role in controlling soil N2O emissions although biotic and abiotic mechanisms remain elusive [20]. Emissions of N2O from soils can be influenced by changes in the soil’s physical, chemical, and biological properties [20,21]. These changes could affect N mineralization/immobilization, turnover, and nitrification/denitrification in soils [17]. Although the influence of BC on N2O emissions is one of the most discussed topics in BC research, most of the studies are conducted in the laboratory, and field trials are rare [10].
So far, only a few studies have investigated the effects of BC application on NO fluxes. Nelissen et al. [22] hypothesized that the most likely mechanisms for reducing NO emissions after BC application are biotic N immobilization, stimulated ammonia (NH3) volatilization, and non-electrostatic sorption of ammonium (NH4+). Obia et al. [23] concluded that BC application increases pH and could therefore decrease NH3 volatilization [24], and NO suppression was associated with less chemical decomposition from nitrite to NO. Since agricultural soils are an important source of NO emissions [25], the mitigation potential of BC on these emissions is of high interest and needs to be investigated.
According to our current knowledge, there are to date no direct studies to assess the impact of BC on the final step of denitrification, i.e., the production of dinitrogen (N2) by reducing N2O, although it is of high economic and environmental importance as it removes reactive nitrogen from ecosystems, closes the global N cycle and consumes N2O. This is partly due to methodological difficulties caused by the huge atmospheric N2 background [26,27]. Using the acetylene inhibition method, Ameloot et al. [28] investigated N2O reduction mechanisms in intact and disturbed soil cores. They could not detect a reduction of the N2O/(N2O+N2) ratio, which is why they suspect that BC did not promote the reduction of N2O to N2. In order to assess the effects of BC on the denitrification process, further datasets on N2 losses from BC-treated soils are required.
Composting is the biological decomposition and stabilization of organic substrates derived by plants or animals, under thermophilic conditions (above 45 °C). These temperatures ensure pathogen inactivation and seed destruction. The result of this process is a humus-like, stable substrate that can be applied to soils as organic fertilizer or for soil amelioration [29]. Furthermore, compost provides nutrients and soil organic carbon (SOC) for the soil ecosystem [30]. Positive effects on physical, chemical, and biological properties can be observed after compost application, e.g., improvement of soil structure and increase of soil fertility. Feedstock material, compost maturity, and quality can significantly influence these effects [31]. Mixing BC and compost offers several advantages. Nutrient-poor materials are often used as feedstock for BC production. Plant nutrients derived from nutrient-rich compost feedstock can enrich BC. A source of N is essential for BC to be an effective soil conditioner. Recent studies have investigated the synergistic effects of BC as a soil additive and N fertilization. Nitrogen use efficiency could be improved by BC addition while the less stable C fraction of BC may cause N immobilization [32]. In addition, BC-compost amendments are a promising tool to sequester carbon in soils while at the same time improving soil fertility [33]. However, the effects of the BC-compost on GHG emissions in agricultural soils are largely unexplored.
A topic that has not yet been studied to a large extent is the gaseous loss of nitrogen (N2O, NO, and N2) during the storage of pure biochar or BC-compost mixtures. The only study we are aware of is by Spokas et al. [34] who investigated CO2, CH4, and N2O emissions from pure biochar but found no significant fluxes. However, Spokas et al. [34] studied pure biochar that was not treated with organic additives or mineral fertilizer after production.
Here, we conducted a field study over six months to investigate the effects of BC-compost application to agricultural soil on soil GHG emissions. The main objectives of this study were (I) to quantify soil GHGs (CH4, CO2, N2O) and NO fluxes after the application of BC-compost and BC-compost with mineral fertilizer compared to a control without BC-compost and (II) to quantify N losses through denitrification. We hypothesized that (i) soil GHG emissions, especially N2O, will decrease after BC-compost application but increase after N-enriched BC-compost application, (ii) carbon and nitrogen in microbial biomass increase due to the addition of organic material through BC-compost mixtures, and (iii) the application of BC-compost does not promote the final step in denitrification.

2. Materials and Methods

2.1. Study Site and Experimental Design

The field site was located in South-Eastern Styria close to Kaindorf, Austria (47°11′33.288″ N, 15°54′38.936″ E, 373 m above sea level (a.s.l.)). The prevailing climate is temperate with a mean annual air temperature of 8.8 °C and an average annual precipitation of 800 mm. Climate data (temperature and precipitation) was supplied by ZAMG (Zentralanstalt für Meteorologie und Geodynamik, Hohe Warte, Vienna). The field was managed by a local farmer who performed an alternating crop rotation of two years grassland followed by two years of maize, i.e., in 2013 and 2014 maize was cultivated with winter barley as a winter cover crop. During the cultivation of grassland, 180 and 200 kg N ha−1 yr−1 were applied in form of biogas slurry.
The soil type is a gleyic Cambisol [35] with a pH of 6.2 and an organic carbon content (Corg) of 2.1%. The field experiment was set up in 2013 and consisted of twelve plots with four different replicated treatments in an area of 13 × 43 m. Each plot had a size of 6 × 4.5 m and a protection row of 1 m in width. Table 1 shows codes and application rates of BC-compost and mineral fertilizer for the treatments in 2013, i.e., T1, T2, and T3, and in 2014, i.e., T1 and T2.
In 2013, no GHG measurements and soil samplings were done. The following field experiment, including all GHG measurements and lab analyses, was only conducted in 2014. Measurements started on 23 April 2014 and were carried out, seven times in total, until 24 September 2014. Due to heavy rainfalls in Spring 2014, planting and application of BC-compost were postponed until the end of May. On 22 May 2014, BC-compost was applied to the field and, at the same time, the previous soil cover crop (winter barley, Hordeum vulgare L.) was incorporated to a soil depth of approx. 15 cm by using a rotary harrow. Two hours before the second gas sampling (23 May 2014), maize (Zea mays L.) was sown.
In 2014 (22 May), treatment T1 received 1% of BC-compost and for treatment T2, BC-compost was enriched with 175 kg N ha−1. One percent of BC-compost (T1) corresponds to 2 kg of dry matter per m2, i.e., for treatment T2 1 kg of N-enriched BC-compost was applied. Soil additives at T1 and T2 were incorporated into the soil with a rotary harrow at a depth of 15 cm. In addition, control plots (K) and T3 were harrowed as well to ensure the same conditions at all treatments. At all treatments, winter cover crops were incorporated on the same day. On 30 July 2014, weed was removed by hand and on 28 October 2014, maize was harvested. All GHG measurements and soil samplings (23 April, 23 May, 30 May, 27 June, 29 July, 27 August, and 24 September) were carried out in subplots of 3 × 2 m with a 1 m protection row to avoid erosion from other treatments.
Fiber sludge and cereal husks were feedstock material for the biochar. Pyrolysis was carried out in a Pyreg-reactor for 20 minutes at 550 °C. Biochar-compost was produced in the factory “Sonnenerde” (www.sonnenerde.at, accessed on 15 October 2022). After cooling, BC was mixed with compost produced from municipal green waste at a 50/50 ratio (w/w). Biochar was then moisturized with water for treatment T1 (2013 and 2014) and with ammonium sulfate for treatment T2 (2013 and 2014) and T3 (only 2013). BC-compost was incubated for two weeks before it was applied to the soil. After incubation, we conducted GHG measurements and took samples of the pure BC-compost for treatment T1 and T2.

2.2. Greenhouse and Nitrogen Gas Flux Measurements

2.2.1. Methane, Carbon Dioxide, Nitrous Oxide

The closed chamber technique was used for the determination of CH4, CO2, and N2O [36]. Three gas chambers were placed permanently on each plot, i.e., thirty-six chambers in total and nine chambers per treatment. No plants were included in the chambers. A gas chamber consisted of a PVC-tube (diameter: 200 mm; height: 130 mm; area: 0.0314 m²; inside net volume = 1.88 L) which was pressed 30 mm into the soil. Shortly before manual gas sampling started, chambers were covered with gas-tight lids. Each lid had an opening on top with a rubber septum to draw gas samples with a glass syringe. Before starting gas sampling, the atmosphere inside the chamber was mixed by flushing three times with a glass-syringe. Afterwards, 25 mL of gas was taken from each chamber and injected into 20 ml pre-evacuated glass vials at intervals of 0, 5, 10 and 20 min. Gas samples were stored at 4 °C and measured with a gas chromatograph (GC) within one week. Greenhouse gas fluxes were analyzed with a GC (Agilent 6890 N, Santa Clara, CA, USA) connected to an Agilent G1888 Network Headspace Sampler. Nitrous oxide concentrations were detected with a 63Ni-electron-capture-detector (ECD) using N2 as carrier gas. Carbon dioxide and CH4 concentrations were detected by a flame ionization detector (FID) including a methanizer, and helium was used as carrier gas. Detector temperatures were set at 350 °C and 250 °C, respectively. After each batch of 36 samples, gas standards of CH4, CO2, and N2O were analyzed using 1, 2, and 4 ppm CH4, 250, 500, and 1000 ppm CO2 and 0.5, 1, and 2.5 ppm N2O standard gas (LINDE, Munich, Germany). Fluxes from each chamber were calculated by the linear increase or decrease of gas concentration over time. The criteria for a valid single flux measurement being distinguished from zero was an R2 > 0.7 [37] and a value above the detection limit of ±2.52 µg CH4-C m−2 h−1 and of ±0.53 µg N2O-N m−2 h−1 [38]. The hourly GHG flux was calculated as described in Equation (1) according to Metcalfe et al. [39]:
G H G   f l u x = Δ C / Δ t × 273.15 / T a i r + 273.15 × p / 1000 × M / 22.41 × V / A
where GHG flux is the hourly flux of the respective GHG, ΔCt is the concentration change (ppm for CO2, ppb for CH4, and N2O) over time (h), Tair is air temperature (°C), p is atmospheric pressure (Pa), M is molecular weight (g), 22.41 is the molar volume of an ideal gas at Standard Temperature and Pressure (1 mol−1), V is the chamber volume (m3) and A the chamber area (m2). The term (Tair + 273.15) is used for the conversion of air temperature from degree Celsius to Kelvin. For the calculation of CO2 and CH4 fluxes, M is 12.01 g and units are mg CO2-C h−1 m−2 and μg CH4-C h−1 m−2, respectively. For the calculation of N2O flux, M is 28.02 g and units are μg N2O-N h−1 m−2. Plot replicates were summarized as one plot mean and used for further analysis.
In addition, GHG fluxes from pure BC-compost were also measured. Gas sampling was carried out on 23 April 2014 at the BC-production site. For this purpose, three gas chambers were placed on each pile of BC-compost-type (one for T1 and one for T2) which had a height of 0.5 m. Gas samples were taken and analyzed as described above.

2.2.2. Nitric Oxide Fluxes

Nitric oxide fluxes were measured seven times at monthly intervals from April to September 2014. From each plot, two intact soil cores were taken from the uppermost 5 cm soil layer. Soil cores were taken with stainless steel cylinders (diameter: 72 mm; height: 50 mm) by pushing them down to 5 cm soil depth. The cylinders were excavated, then closed with stainless steel lids and Parafilm. In the laboratory, soil cores were weighed and divided into two runs, each run containing one soil core from each plot. A fully automated laboratory measuring system was used to determine NO fluxes. It consists of 13 adapted Kilner jars, which served as test chambers in a temperature-controlled incubator connected to an NOx and a CO2 analyzer. Twelve chambers were used for the incubation of soil cores and one chamber served as a reference. NO fluxes were analyzed with a chemo-luminescence NO analyzer (HORIBA APNA-360, Kyoto, Japan). Carbon dioxide was detected with an infrared CO2 analyzer (WMA-2, PP-Systems, Amesbury, MA, USA). The measuring time for each test chamber was six minutes and four minutes for the reference chamber. Flux rates of CO2 and NO were calculated according to Schindlbacher [40]. Additionally, NO fluxes from pure BC-compost mixtures were determined by filling 10 g of each BC-compost treatment into three soil cylinders. Pre-measurements of soil cores filled with pure BC-compost already indicated high NO fluxes. Therefore, we reduced the amount to 10 g BC-compost per soil cylinder. Measurements were carried out as described above.

2.2.3. Dinitrogen Fluxes

For comparison of dinitrogen fluxes from soils after BC-compost amendment, we decided to focus on the two treatments that received fresh BC-compost in 2014 and compare it with the control. Therefore, we incubated three disturbed soil cores from each plot of treatment K, T1, and T2, and three replicates per treatment. Soil samples were taken on 23 May 2014. For simultaneous flux measurement of N2 and N2O, we followed the approach of Butterbach-Bahl [41] and used the helium gas-flow core method. Briefly, six soil cores, i.e., three cores with soil and 3 with sand, with a diameter of 5.5 cm and a height of 4 cm were placed in an air-tight vessel and purged with an N2-free gas mixture (80 vol% He 6.0, 20 vol% O2 5.0; Linde, Munich, Germany) for two days to replace soil air. Fluxes of N2 and N2O were derived from the subsequent increase in the N2 and N2O concentrations in the headspace above the soil cores. A gas chromatograph (6890 GC, Agilent Technologies, Palo Alto, CA, USA) equipped with a pulsed discharge He ionization detector (PDHID; Vici AG, Schenkon, Switzerland) and a micro-electron capture detector (µECD; Agilent Technologies, Palo Alto, CA, USA) was used to determine N2 and N2O. Measurements were carried out at 24 °C at 23% and 50% water-filled pore space (WFPS), respectively. Dinitrogen fluxes were also determined from pure BC-compost mixtures of treatments T1 and T2 by filling 10 g of each BC-compost into six soil cylinders. Pure BC-compost mixtures were incubated at 20 °C and measurements were carried out as described above.

2.3. Soil Analysis

For analysis of N cycle compounds, soil samples were taken simultaneously to gas samplings, in total seven times. Five soil samples were taken from each plot with a soil corer (diameter of 5 cm) from the first 10 cm of the soil profile close to the gas chambers. Soil samples were homogenized and sieved with a 2 mm mesh-sized sieve. Sieved soil samples were immediately used for the determination of the gravimetrical water content. Ten grams of sieved soil samples were air-dried for determination of pH and C:N ratio. The remaining soils were frozen at −20 °C. For pH measurement air-dried and 2 mm sieved soil was mixed with 0.01 M CaCl2 solution at a 1:5 ratio [42]. After shaking briefly and incubating for one hour, pH was determined manually with a pH meter (UNILAB, ph 330i, Weilheim, Germany). According to ÖNORM L1080 [43], organic C and total N were determined by dry combustion at a temperature of 1250 °C using an elemental analyser (LECO TruMac, LECO Corp., St. Joseph, MI, USA). Concentrations of NH4+ and NO3 were determined by colorimetric methods described in Hood-Nowotny et al. [44]. Samples were analyzed at 660 nm (NH4+) and 540 nm (NO3) wavelength using a microplate spectrophotometer (µQuant, BioTek Instruments, Bad Friedrichshall, Germany). For NO3 concentration determination of BC-compost mixtures, a dilution series was established. Therefore, extracts of non-fertilized BC compost were diluted up to a hundredfold, and fertilized BC compost up to a thousandfold.
For the determination of microbial biomass carbon (Cmic) and nitrogen (Nmic) a modified version of the Chloroform Extraction Method was used [45]. Microbial biomass C and Nmic were determined by using a total organic carbon (Corg) analyzer (TOC-L CSH/CSN, Shimadzu, Kyoto, Japan) including a total nitrogen unit (TNM-L, Shimadzu, Kyoto, Japan). At each gas sampling event, soil temperature was measured in the upper soil layer with a digital thermometer (HANNA Instruments Inc., Woonsocket, RI, USA).

2.4. Data Analysis

Statistical analyses were performed using R version 3.2.2 (The R Project, 2015). For data exploration, the approach described by Zuur et al. [46] was applied. The reported results of GHG data and soil analysis were arithmetic means of replicates per plot. Shapiro-Wilk-Test was used to check for normal distribution and the Levene-Test to confirm the homogeneity of variances. Prior to statistical analysis, gas flux data were log-transformed to achieve assumptions for repeated measures and one-way analysis of variances (ANOVA). Soil chemical data were analyzed separately by one-way ANOVA for each sampling with treatment as a fixed effect. Student Newman-Keuls Tests (SNK) were performed when results showed any significance among treatments. Relationships between all variables were investigated using Pearson correlation analysis. For all analyses p < 0.05 was considered significant.

3. Results

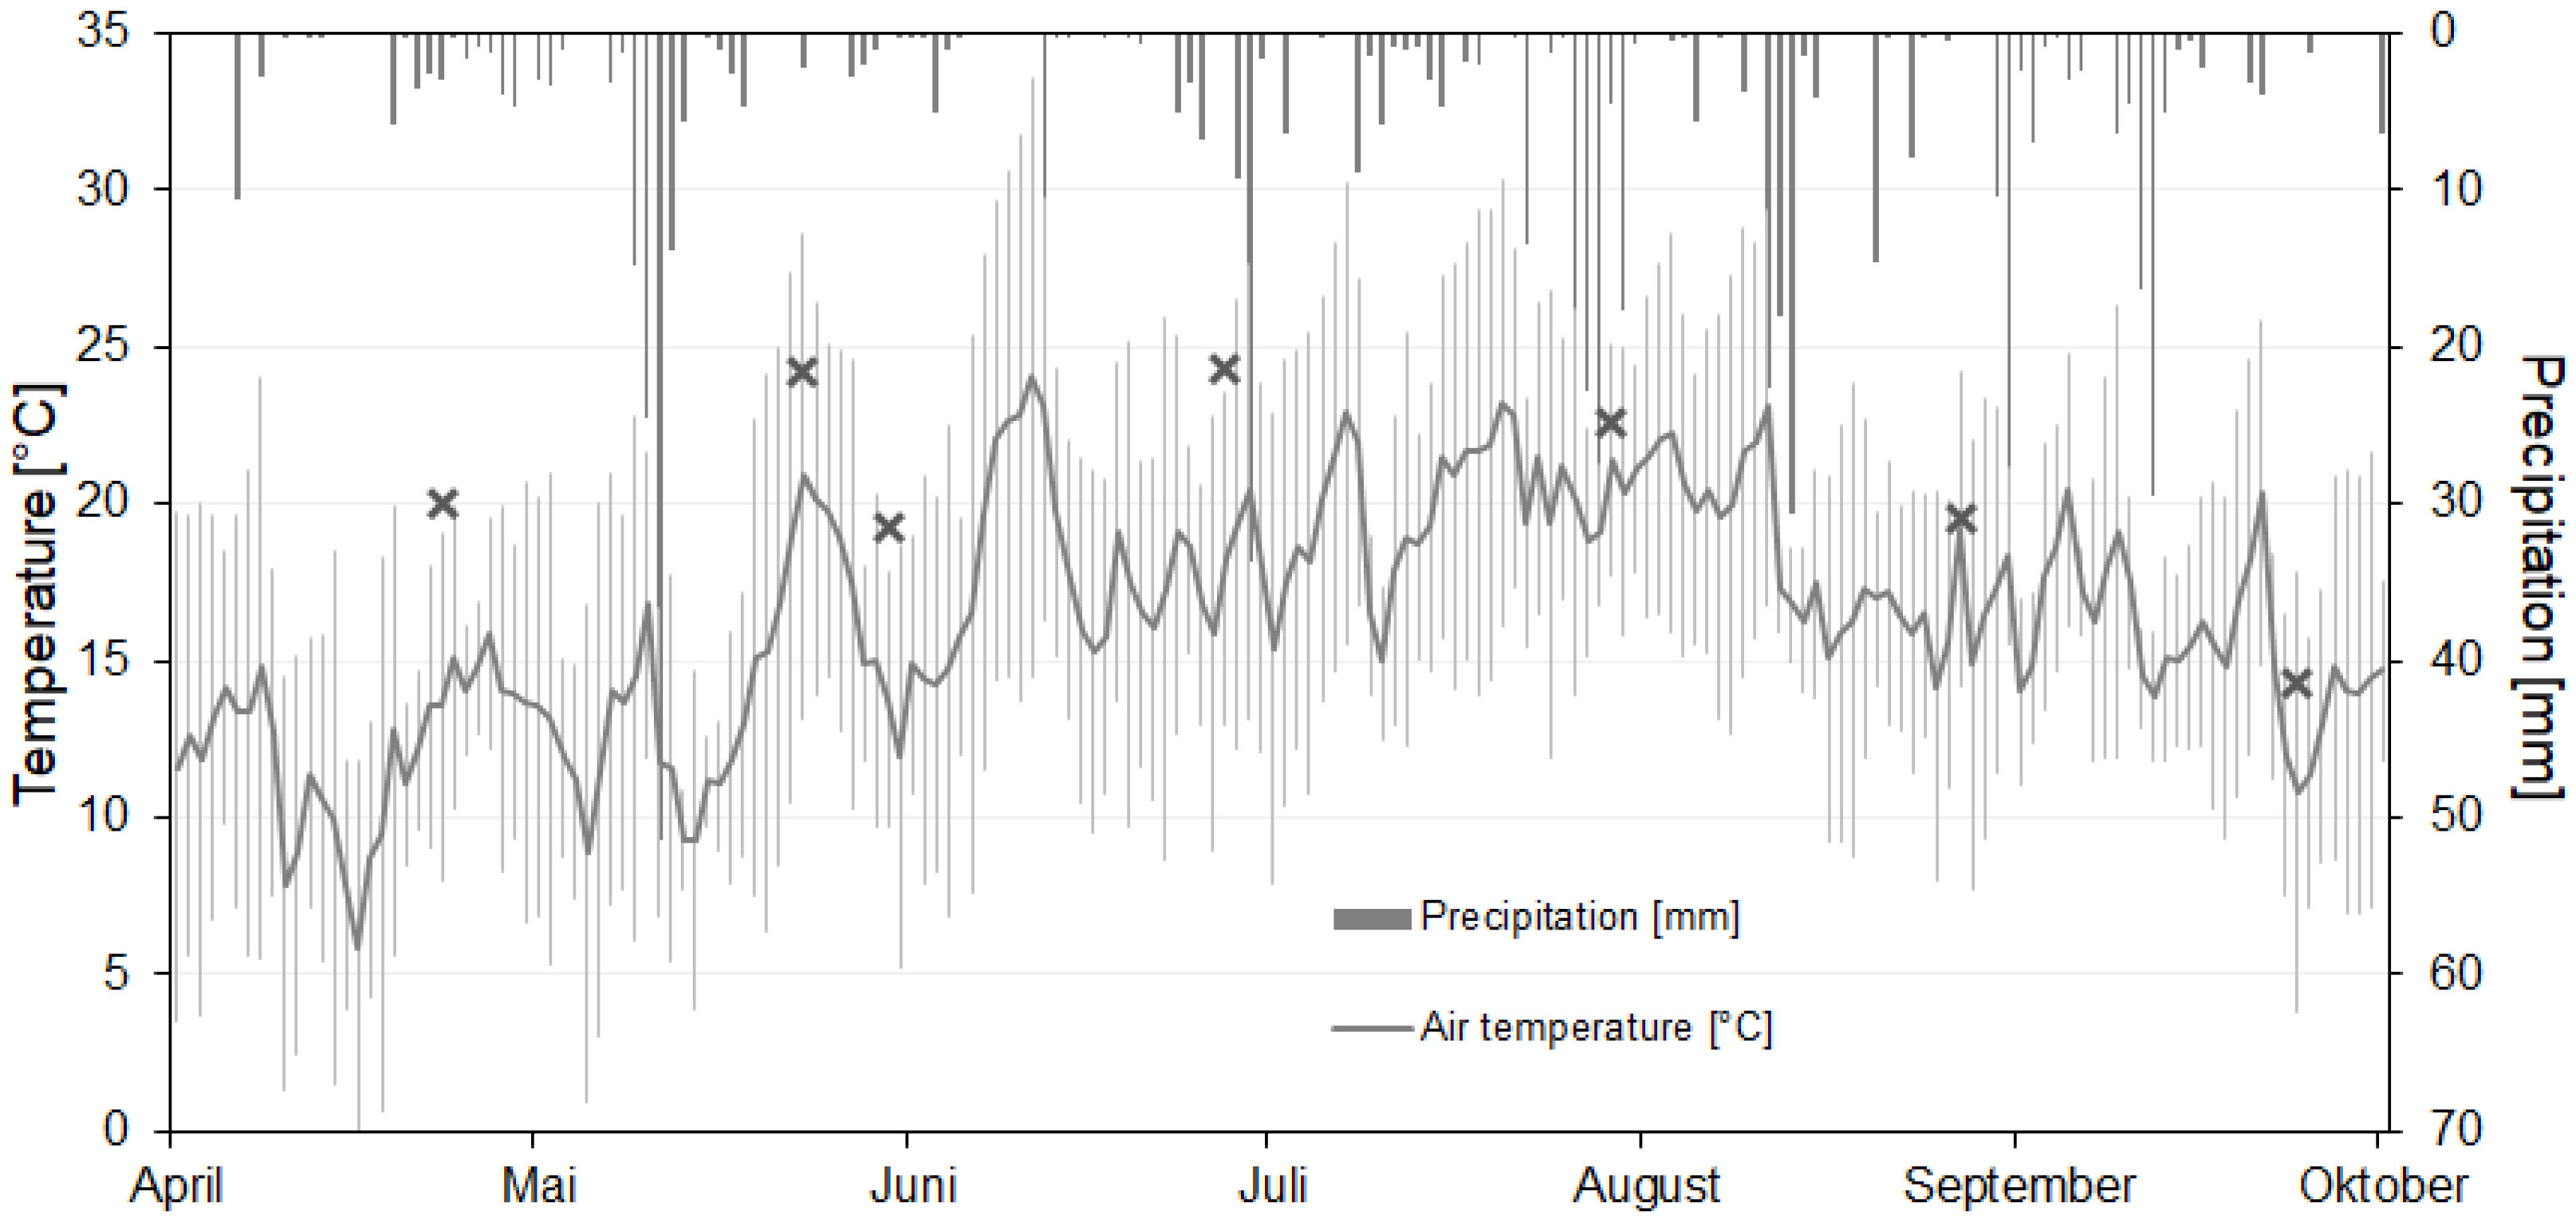
3.1. Meteorological Data and Yields 2014

The field experiment covered the growing season of 2014 and lasted from April to September. Figure 1 shows an average air temperature (°C) and precipitation (mm) measured at the weather station Gleisdorf (47° 06′ 56″ N, 15° 42′ 29″ E) near the field site.
Plant development was delayed due to the late sowing of maize. Yield measurements are summarized in Table S1. The highest yields were observed at treatment T1 (1% BC-compost in 2014) while yields at T2 (0.5% BC-compost + 175 kg N ha−1 in 2014) were considerably lower.

3.2. Analyses of Pure BC Compost Mixtures

Pure BC-compost used for treatment T1 and T2 in 2014 showed distinct results. Enrichment of BC-compost with ammonium sulfate used for T2, tripled NH4+ concentrations and increased NO3 concentrations about 30-fold from 104.8 ± 2.5 µg dw to 3 mg N g1 dw. BC-compost used for T1, had higher Cmic and Nmic values compared to N-enriched BC-compost. Furthermore, addition of N resulted in slightly lower pH and a narrower C:N ratio (Table 2).
The addition of ammonium sulfate to BC-compost (T2) resulted in a significant increase of all measured gas fluxes (Table 2). The effect on N-gases (N2O, NO and N2) was much higher compared to C-gases (CH4, CO2). Only nine times more CH4 and two times more CO2 were emitted from pure BC-compost mixture used for T2. In contrast, almost 400, 230, and 14 times more N2O, NO and N2 were emitted, respectively. Thus, over the incubation time and storage of two weeks after the BC-compost production, approximately 31% of the mineral fertilizer applied to BC-compost used for T2 were already lost as N2O (44.3 kg N2O-N ha−1), NO (2.6 kg NO-N ha−1), and N2 (11.3 kg N2-N ha−1). In comparison, only 0.12 kg N2O-N ha−1, 0.07 kg NO-N ha−1, and 0.8 kg N2-N ha−1 were lost from BC-compost used for T1 during the same period.

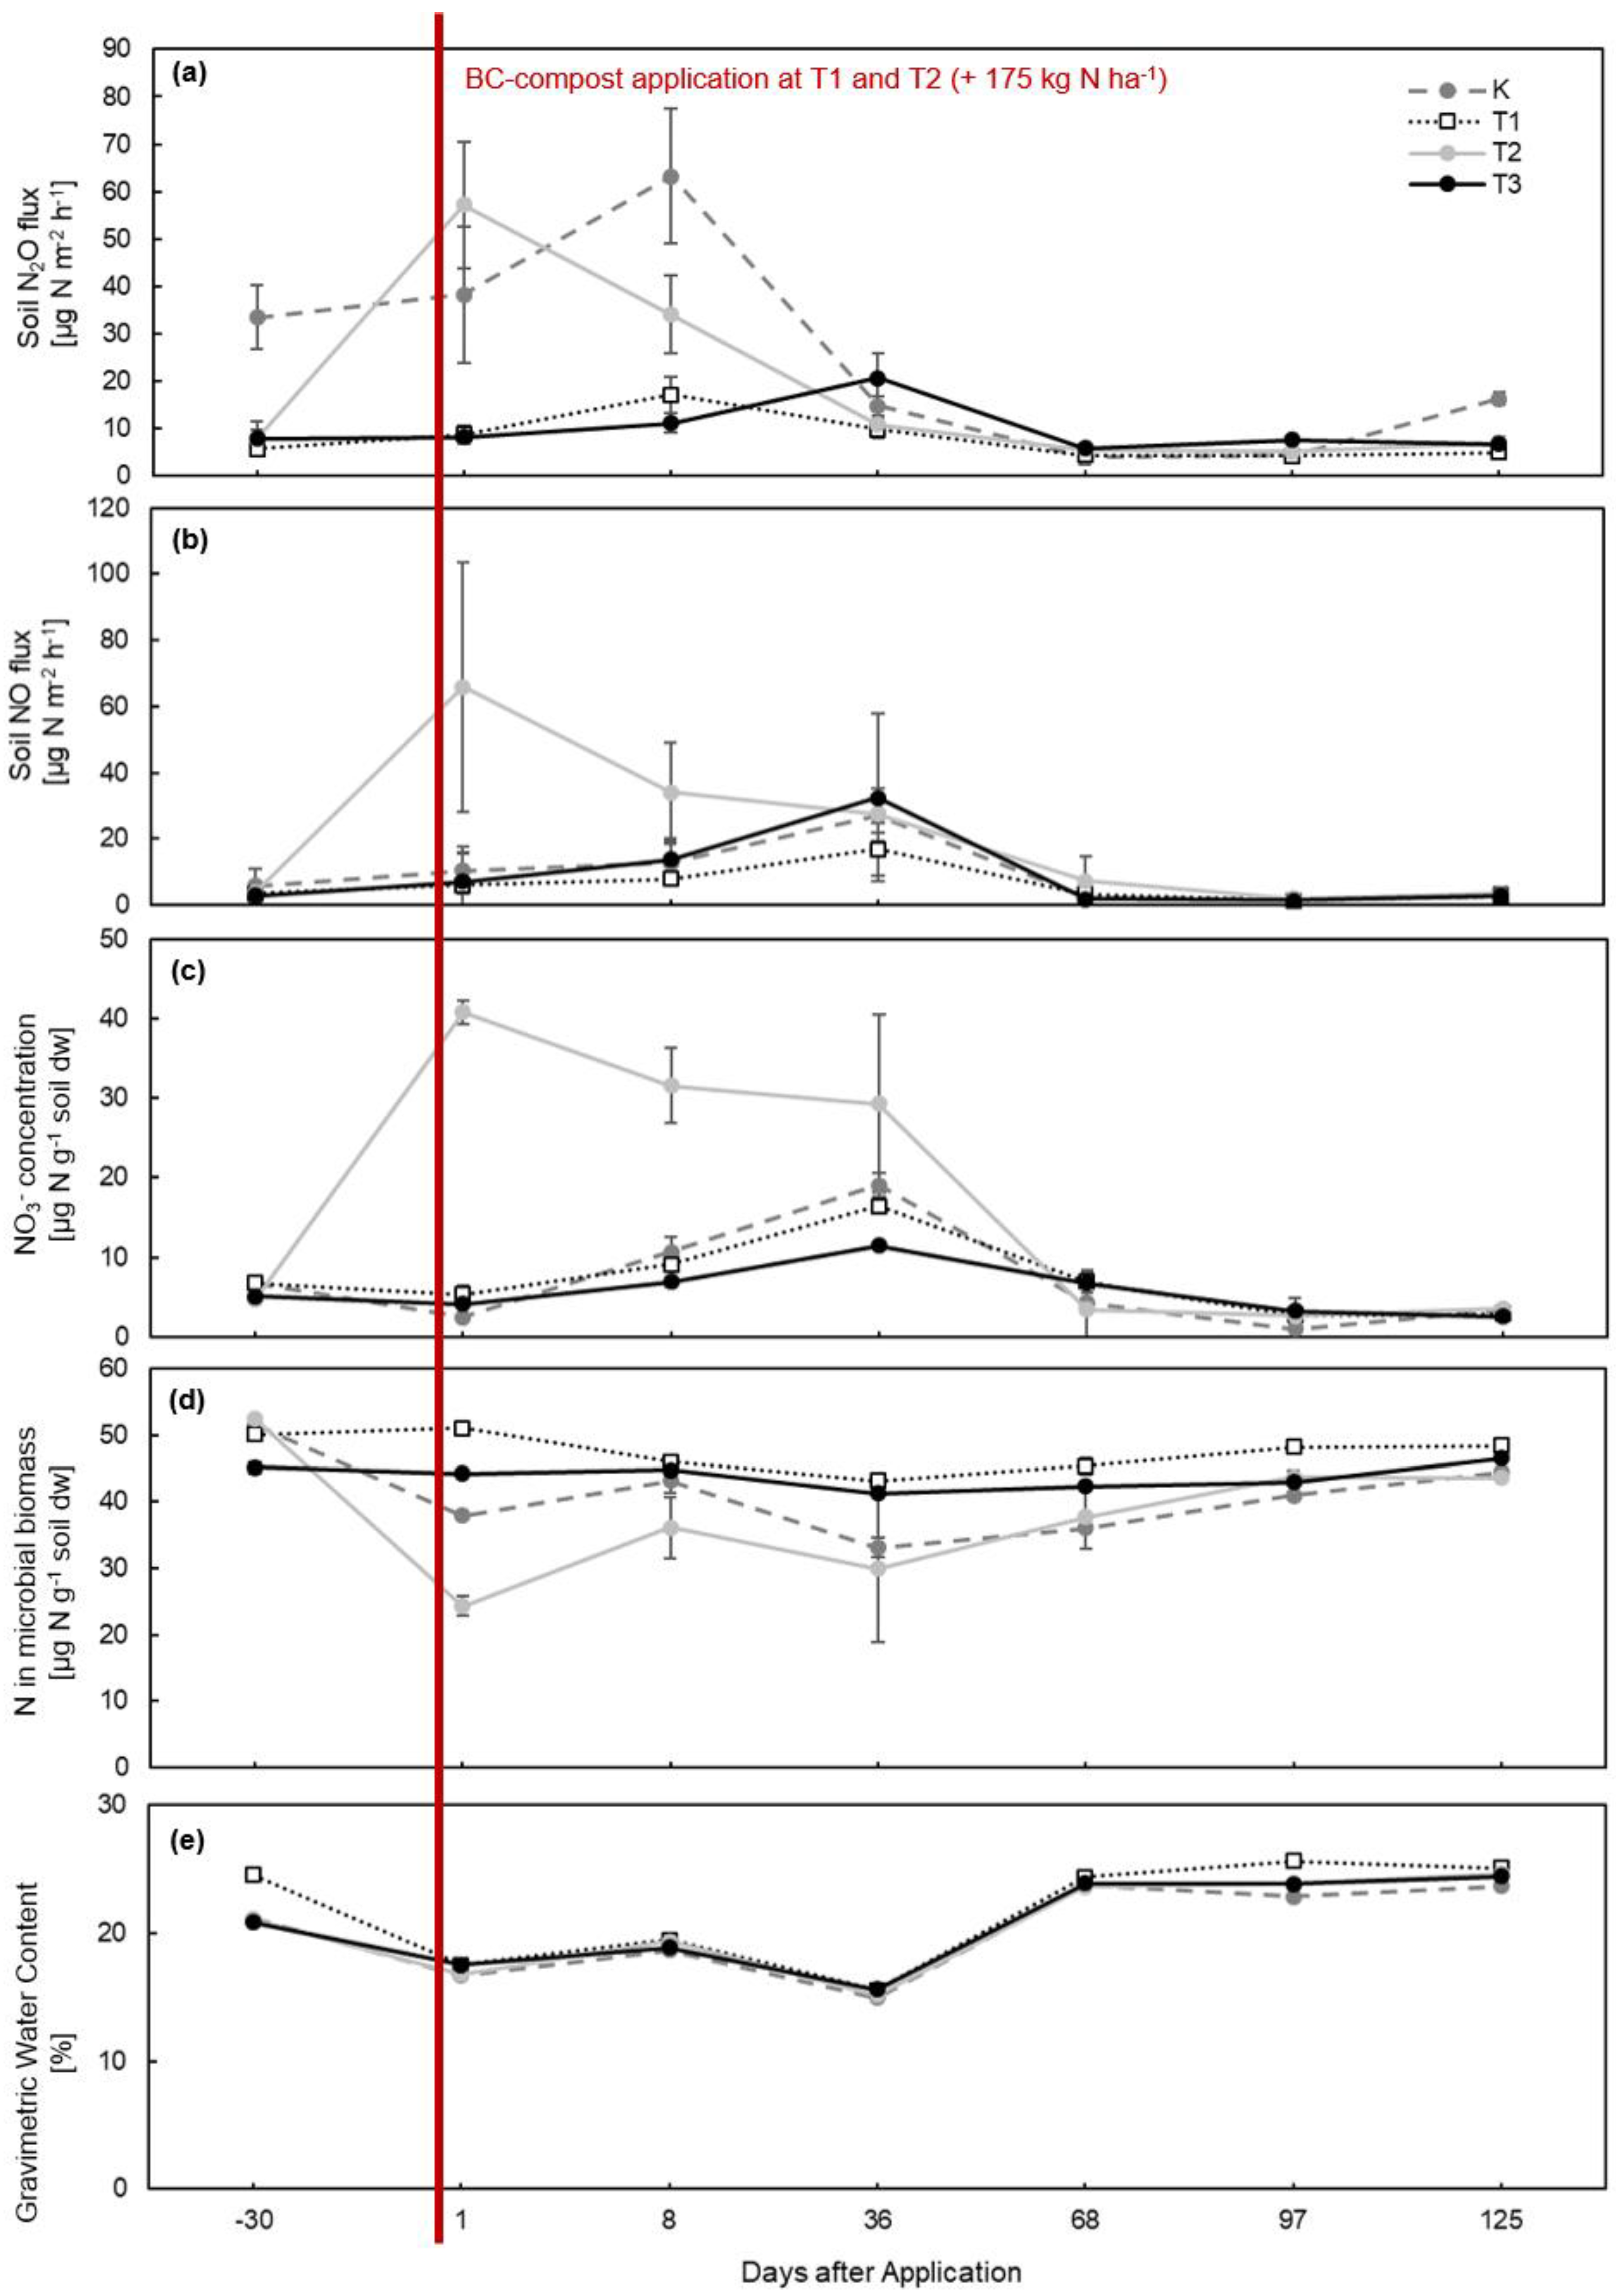
3.3. Soil GHG Emissions

During the field experiment both CH4 production and CH4 uptake could be observed. Methane fluxes varied between −202 and 356 µg CH4-C m−2 h−1 with a high spatial variability, especially at the beginning of the field experiment and within a week after BC-compost application (Figure S1). From the end of June (36 DAA) mean CH4 fluxes of all BC-compost treatments levelled off at about 22 µg CH4-C m−2 h−1. At the end of the growing season (155 days), cumulative CH4 emissions were highest at T3 and lowest at T2 (Table 3). However, repeated measures ANOVA showed no significant influence of factor “treatment” on CH4 fluxes.
During the field experiment, CO2 fluxes ranged from 19 to 339 mg CO2-C m−2 h−1, while CO2 emissions at control plots (K) tended to be slightly higher compared to all BC-compost treatments (Figure S2). Highest CO2 emissions were measured 68 DAA from all treatments. Afterwards, emissions levelled off. Overall, cumulative CO2 fluxes (155 days) varied between 2.40 ± 0.95 t CO2-C ha−1 (T3) and 2.92 ± 1.25 t CO2-C ha−1 (T1; Table 3).
Both nitrous oxide uptake and N2O production could be observed, while N2O production dominated (Figure 2a). Fluxes varied between −20 and 286 µg N2O-N m−2 h−1. Thirty days before BC-compost application (−30 DAA), N2O fluxes on control plots were four times higher compared to the BC-compost treatments. For T1, T2, and T3 mean N2O fluxes did not differ significantly (p > 0.05). One day after the application of BC-compost (1 DAA) and incorporation of the winter cover, N2O emissions increased in all treatments. At T2 emissions increased from 7.8 ± 3.8 to 38.3 ± 14.4 µg N2O-N m−2 h−1, but at K, T1, and T3 the increase was not significant. One week after BC-compost application (8 DAA), N2O fluxes at K more than doubled, although with high variation. N2O emissions decreased at T2 by 25 µg N2O-N m−2 h−1 on average but were still higher compared to treatment T1 and T3. A positive correlation was observed for N2O fluxes and NO3 content at treatment T2 (r = 0.92, p < 0.01) and T3 (r = 0.81, p < 0.05). Overall, cumulative N2O emissions (155 days) were highest at K with 0.60 ± 0.48 kg N2O-N ha−1 and lowest at T1 with 0.21 ± 0.11 kg N2O-N ha−1 (Table 3).
Nitric oxide emissions from the field experiment ranged from 0.45 to 100 µg NO-N m−2 h−1 (Figure 2b). Emissions of NO at T1 were continuously lower compared to control plots. After the application (1 DAA) of N-enriched BC-compost at treatment T2, a significant increase of about 60 µg NO-N m−2 h−1 was observed. One week after BC-compost application (8 DAA), NO fluxes at T2 decreased by 50%, but were still significantly (p < 0.05) higher compared to the other treatments. By the end of the vegetation period, NO fluxes flattened and no significant differences among the treatments were observed. NO fluxes from all treatments showed a negative correlation (r = −0.84, p < 0.001) with soil water content and a positive correlation (r = 0.81, p < 0.001) with NO3 content. Furthermore, NO fluxes at T2 correlated with Nmic (r = −0.86, p < 0.05). Overall, cumulative NO fluxes (155 days) were highest at T2 with 0.43 ± 0.16 kg NO-N ha−1 and lowest at T1 (Table 3).

3.4. Soil Analysis

Soil pH, organic carbon (Corg), total nitrogen (Ntot), and the C:N ratio (Table 4) were determined 30 days before (−30 DAA) and after application (mean: +1 to +125 DAA) of BC-compost at T1 and T2. The pH was only measured at −30 and +1 DAA. All parameters did not vary significantly before the application of the BC-composts. Soil organic carbon content was highest at T1 followed by T2 after the application of BC-compost. The application of 1% BC-compost (T1) increased the C:N ratio from 11.2 to 13.9 and after the application of 0.5% BC-compost and additional N fertilizer (T2), from 10.1 to 11. Soil properties from T3, where BC-compost was applied one year ago, but not in 2014, did not vary significantly from the control (K), but was slightly higher.
Over the entire sampling period, ammonium (NH4+) concentrations varied between 8 and 27 µg NH4+-N g−1 dw in all treatments. The highest concentrations were observed during the first sampling. However, NH4+ concentrations levelled off and no significant differences could be observed (Figure S3).
One day after the application (1 DAA) of N-enriched BC-compost at T2, NO3 concentration increased significantly from 4.7 ± 2.5 µg NO3-N g−1 dw to 40.8 ± 8.1 µg NO3-N g−1 dw (Figure 2c).
In treatment K, T1, and T3, NO3 concentrations increased continuously until June. Two months after BC-compost application (68 DAA), NO3 contents levelled off in all treatments and varied between 2 and 8 µg NO3-N g−1 dw. With one-way ANOVA, a significant effect of treatment T2 on NO3 concentrations was observed (p < 0.05) for the week after BC-compost application (8 DAA). Microbial biomass C remained almost constant throughout the experiment at all treatments, but Cmic was always higher at T1 and T3 compared to K and T2 (Figure S4). In April (−30 DAA), Nmic content of about 50 µg g−1 dw was observed at all treatments (Figure 2d). The biochar-compost application showed almost no effect for treatment T1 (1 DAA). One day after the application of 0.5% N-enriched BC-compost, Nmic content at treatment T2 dropped significantly by 50% (p < 0.05) compared to the first sampling and by 36% (p < 0.05) compared to K on the same day. Nmic increased within one week from 24 to 36 µg g−1 dw but remained lower for almost two months compared to the other treatments (68 DAA).

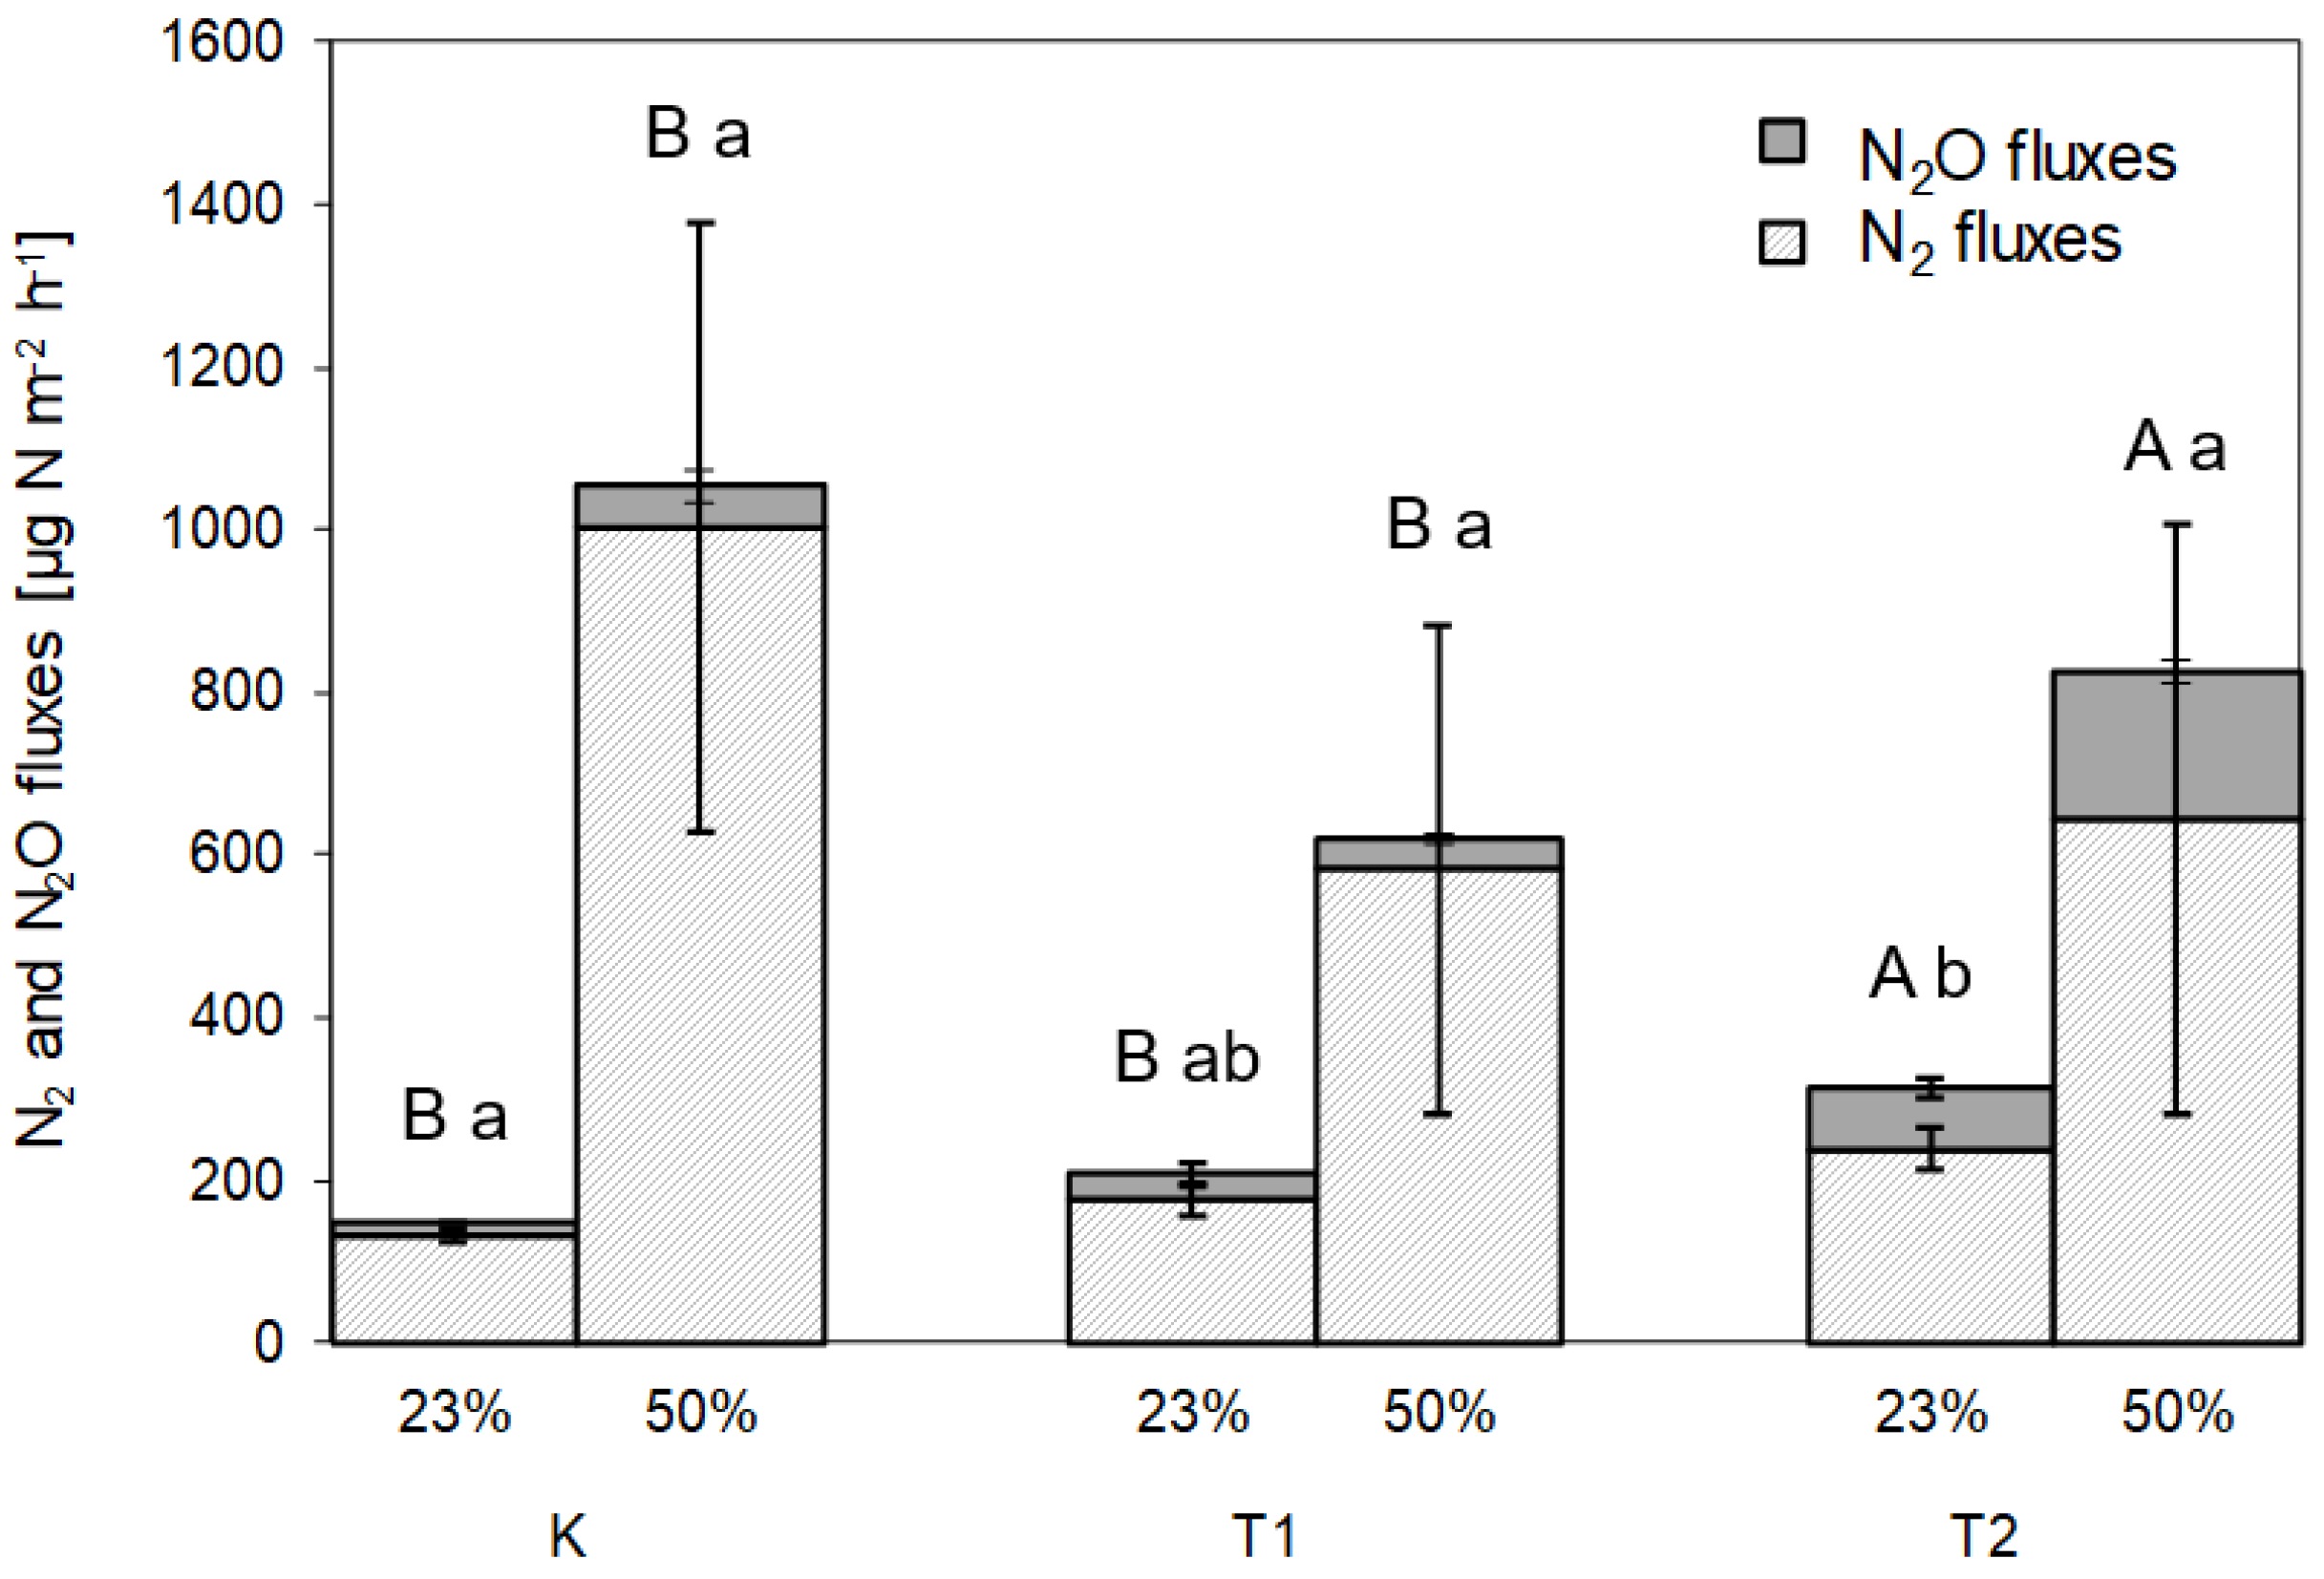
3.5. Dinitrogen Fluxes

Simultaneous measurements of N2 and N2O fluxes using the Helium gas-flow core technique yielded N2 fluxes in the range of 132 ± 7 µg N m2 h1 at 23% WFPS to 1003 ± 376 µg N m2 h1 at 50% WFPS. Gaseous N losses as N2O were always lower (16 ± 1.3 to 182 ± 13 µg N m2 h1) compared to N2 fluxes. An increase in WFPS to 50% (saturated soil) increased N2 fluxes at all treatments, while the increase in N2 production was more pronounced in the K samples compared to the two BC-compost treatments (Figure 3). The simultaneously measured N2O fluxes from N-enriched BC-compost samples (T2) were significantly higher at both WFPS levels than at K and T1, which is consistent with the results of the field measurements.
N2:N2O emission ratios were similar for all treatments before the application of BC-compost mixtures at T1 and T2 and varied between 8.1 and 9.8 (data not shown). The ratio increased to 38.3 ± 50 (K) and 14.8 ± 12.9 (T1) but decreased at T2 under saturated soil conditions to 3.3 ± 2.8. After the application of additionally fertilized with BC-compost (T2), the ratio decreased to 3.3 ± 0.4 even at low WFPS. Since soil temperature did not significantly influence the N2:N2O ratio and soil, the WFPS only varied between 15 and 25% during the whole vegetation period, and we used an N2:N2O ratio of 8.15 and 9.65, based on the measurements in April and May 2014, to calculate the N2 losses for the five-month period. A rough estimation of total N losses in form of N2 resulted in 4.9 and 2 kg N ha−1 for treatment K and T1, respectively.

4. Discussion

4.1. Effects of BC-Compost Application on C-Gases

The variability of CH4 fluxes between chambers was high, and we measured both CH4 uptake rates, but in the majority of sampling events, we measured CH4 emissions. Methane consumption in an N-fertilized and frequently ploughed soil is usually minimal or non-existent. Soil cultivation and tillage affect soil structure, inhibit CH4 oxidation, and can destroy niches for the methanotrophic community [47]. Application of BC may have the potential to affect net CH4 fluxes. On the one hand, BC had promoted CH4 oxidation [16], but on the other hand, nil impact or CH4 production had been observed [15,48]. One day after the application of BC-compost (1 DAA) to our agricultural soil, we observed two different effects on CH4 fluxes: an increase at T1 and a decrease at T2 compared to K. We expected a decrease in CH4 emissions at T1 due to increased soil porosity after BC application, which was observed in several studies [16,49]. In contrast, CH4 fluxes increased at T1. In our experiment, BC was mixed with green waste compost before application. According to Le Mer and Roger [50], the incorporation of organic matter increases CH4 emissions. Therefore, it may have reduced or even prevented the positive effect of BC on CH4 fluxes. In addition, soil cover crops were incorporated into the soil when BC-compost was applied, which may explain higher CH4 fluxes at K and T3. At T2, applied BC-compost was enriched with 175 kg N ha−1 in form of ammonium sulfate. Chemical N fertilizers affect CH4 emissions, but the mechanisms are complex and sometimes contradictory. For example, ammonium-based fertilization can reduce CH4 emissions by stimulating the activity and growth of methanotrophs [19]. Sulfate as an electron acceptor can decrease CH4 production due to bacterial competition unfavourable to methanogens [50]. Although our CH4 fluxes did not differ significantly between treatments and were highly variable within the replicates, the use of N-enriched BC-compost promoted CH4 consumption by around 30%. This high-fertilization effect on methanotrophs had also been observed on cultivated, fertilized (150 kg N ha−1) loamy-sandy soil in Germany [51].
In various studies, soil water content influenced CH4 emissions. Yu et al. [52] observed a potential of BC to promote CH4 oxidation at low soil moisture levels (35–60% WPFS). In this study, we measured the highest CH4 fluxes in all treatments up to June at water contents between 15 and 19%. This supports theories on soil properties and BC application that influence CH4 fluxes more than soil water content [15,16].
In this study, we measured lower CO2 emissions from BC-compost-treated soils compared to the control. Biochar has the potential to suppress CO2 emissions from soils [34,49], it either has no significant impact on CO2 fluxes [48] or it may even increase CO2 emissions [53]. A reduction in CO2 emissions could be explained by BC reducing mineralization rates and stabilizing soil organic C [34]. Observed increases in CO2 after BC addition can be attributed to the mineralization of labile BC compounds via biotic or abiotic means [53]. Thomazini et al. [54] found a significant impact of BC addition on CO2 emissions, but after the correction of CO2 release from BC alone, no significant change was observed. In this study, CO2 emissions from pure BC-compost were not subtracted from total CO2 fluxes. Nevertheless, CO2 fluxes on BC-compost plots decreased compared to control plots (1 DAA). This is in contrast to other studies that found short-term increases in soil respiration after BC amendment [55,56], which are due to the rapid mineralization of organic material (switchgrass). As C mineralization at BC-compost plots was already significantly lower in April (−30 DAA), we suspect that BC-compost application from 2013 still influenced C mineralization. A similar effect was observed by Case et al. [57], who found the suppression of CO2 emissions two years after BC-compost application. Combined effects of reduced enzymatic activity, sorption of soil-derived CO2 on the surface of BC, or increased carbon-use efficiency due to soil microbial co-location due to agglomeration of soil organic matter on the surface of BC may explain this reduction. CO2 emissions of all treatments peaked in July (68 DAA) due to favourable soil moisture conditions. This can be explained by an increase in root respiration due to matured plants and the release of adsorbed and protected soluble organic compounds from the surface and pores of BC [58]. Overall, cumulative CO2 fluxes (155 days) from the field site show no significant differences between treatments. Neither BC-compost nor N-enriched BC-compost had a significant potential to reduce CO2 emissions. Rather, these observations suggest that BC-induced negative priming played a role in soil C metabolism, otherwise the compost fraction of the BC-compost mixture would have significantly increased CO2 emissions [59]. However, this is consistent with several other studies where BC amendment at very low rates (up to 20 t ha−1) showed no effects on soil respiration [16,48,49].

4.2. Effects of BC-Compost Application on N-Gases

In general, we have measured highly variable N2O emissions during the vegetation period (155 days), especially at the beginning of this study. The highest fluxes were observed on control plots in spring (−30 DAA and 1 DAA) and started to increase again in late September. The application of 1% BC-compost at T1 (no extra N added) reduced cumulative N2O fluxes compared to the other treatments (Table 3). We assume that N2O temporarily increased after bare soil cultivation and incorporation of crop residues, as assumed by Baggs et al. [5]. At our site, BC-compost could reduce these high N2O emissions caused by cultivation. As N2O emissions from BC-compost plots were lower compared to K in April and the end of September, we assume that the application of BC-compost at our site has a strong mitigation potential, especially during periods when the crops cannot retain excess nitrogen from the soil. Field ageing of BC and its effect on long-term mitigation of N2O emission could have had an effect in this respect. This assumption is, however, in contrast to the recently published meta-analysis by Borchard et al. [12] who summarized that the N2O mitigation potential of BC is highest for freshly added BC and that the effect decreased within one year of BC ageing in the soil.
The mitigation potential of BC on N2O fluxes is one of the most discussed topics in BC research in recent years. Although most results have originated from incubation studies, some field studies also found a decrease in N2O fluxes after BC application [17]. However, nitrous oxide fluxes increased significantly at T2 1 DAA compared to the other treatments. A fertilizer effect on N2O fluxes is well-known, although NO3 fertilizers have a stronger influence than NH4+ fertilizers [4]. We have measured a rate of 13.2 mg N2O-N m−2 h−1 from pure N-enriched BC-compost resulting in cumulative losses of 44.3 kg N2O-N ha−1 after an incubation and storage time of two weeks. So far, only Spokas et al. [34] investigated N2O fluxes derived from pure BC in a laboratory incubation experiment, but —in contrast to our study—could not find any detectable amounts of N2O. Furthermore, NO3 concentration of our fertilized BC-compost was above 3 mg g−1 dw. We suggest that the application of a high dose of NH4+ fertilizer stimulates both nitrification and denitrification. After the application of BC-compost to soil, N2O fluxes decreased rapidly. Since July (68 DAA), N2O emissions levelled off in all treatments, indicating that mineral N was either depleted, taken up by plants, or leached [20]. We found a positive correlation between N2O fluxes and NO3 concentrations at T2 which supports our theory that NH4+ fertilizer is rapidly nitrified.
Overall, cumulative N2O emissions over the whole vegetation period of 155 days were very low compared to several other studies [60]. Important N2O peak emissions after irrigation or soil re-wetting might be missed when using static chambers with a low measuring frequency (weeks to months; Barton et al. [61].
In our study, lowest cumulative NO fluxes (0.13 kg N ha−1; 155 days) were observed at T1. In April (−30 DAA), NO fluxes were very low in all treatments. One day after the application of BC-compost at T1 and T2, fluxes at T2 increased significantly compared to the other treatments. To our current knowledge, only three studies have investigated the application of BC on nitric oxide fluxes so far [22,23,62]. All authors found a reduction potential for NO emissions from BC-treated soils but identified different mechanisms behind it. Obia et al. [23] proposed a suppression of NO emissions due to an increase in pH and thus the prevention of chemical decomposition from NO2 to NO. Nelissen et al. [22] explained the decrease in NO fluxes after BC amendment with the lower substrate availability for nitrification and denitrification, while Xiang et al. [62] concluded that a BC-induced NO reduction is mainly due to denitrification. Nelissen et al. [22] also observed the highest NO emissions one day after the application of BC fertilized with NH4+. Rapid increases in NO emissions are usually observed after fertilization. Until July (68 DAA) NO fluxes at T2 levelled off, assuming that NH4+ fertilizer was no longer available [63]. At T1, NO fluxes increased steadily, with a peak 68 DAA. Since nitrification is controlled not only by the availability of NH4+ [63] but also by easily degradable organic N [64], we assume that nitrification was delayed and inhibited due to the 50:50 mixing ratio of BC-compost. NO fluxes at the other treatments increased to the same extent up to 36 DAA. As NO emissions are very sensitive to changes in soil moisture and temperature [65], we suspect that these factors were responsible for this increase in NO fluxes at K and T3. Statistical analysis showed a negative correlation (p < 0.05) between NO fluxes and soil water content for all treatments. This is in line with other studies [40,66] which show that nitrification dominates at a water-filled pore space (WFPS) between 30 and 60%. Furthermore, NO fluxes and NO3 concentrations correlated positively among all treatments. In contrast to Nelissen et al. [22], we found high NO3 concentrations (3 mg N g−1 dw) from pure N-enriched BC-compost and thus high NO3 concentrations (40 µg N g−1 dw) after N-enriched BC-compost application at T2 (1 DAA). During incubation and storage of two weeks after BC-compost production, approximately 2.6 kg NO-N ha−1 were lost. It seems therefore that the addition of NH4+ fertilizer to BC-compost accelerated nitrification rates, whereas BC-compost without fertilizer slowed down nitrification. This supports the theory that nitrification is strongly controlled by NH4+ fertilizer and easily decomposable organic N [57]. Apparently, the application of BC-compost in our study had the potential to reduce NO fluxes, while the addition of NH4+ fertilizer to BC-compost stimulated nitrification and led to higher gaseous losses in form of NO at T2 compared to T1.

4.3. Effects of BC-Compost Application on Soil Microbial Biomass

In our field trial, the addition of 1% BC-compost (T1) increased Cmic, although not significantly. Since BC was mixed with compost at a 50/50 (w/w) ratio, a high amount of organic matter was introduced into the soil. The sorption of organic compounds on BC surfaces could enhance the growth and activity of microorganisms [67]. Another reason for increased microbial biomass could be the easily decomposable C fraction of BC [68]. Since Cmic was always higher at T1 and T3 and partly higher at T2 than K, we suspect that organic C might have been released from BC during chloroform-fumigation-extraction because C mineralization was lower at BC-compost plots, as suggested by Ameloot et al. [69]. Application of additional N fertilizer to BC-compost (T2) significantly reduced Nmic by 50% (1 DAA). A meta-analysis by Treseder [70] showed a decrease of 15% in microbial biomass under N fertilization. Discharge of additional ions through fertilizer in soils could become toxic for microorganisms. Since Cmic and Nmic of pure N-enriched BC-compost were significantly lower compared to BC-compost, we assume that additional N-based fertilizer inhibited microbial growth. Birk et al. [71] even suggested that mineral and organic fertilizers affect soil microbial biomass of the soil more than BC application, which may apply in our case with low BC application rates.

4.4. Effects of BC-Compost on Denitrification

According to our current state of knowledge, this study is the first to investigate the effects of BC-compost on direct N2 fluxes. The use of the helium gas flow core method for direct estimation of N2 fluxes has several advantages: Neither an additional label (e.g., 15N) nor an inhibitor needs to be introduced into the soil. This enables a sensitive direct method for the measurement of N2 [27]. We measured N2 and N2O fluxes simultaneously at two different WFPS levels (23% and 50%) with the highest fluxes observed at higher soil moisture levels. In our study, the application of BC-compost reduced N2 losses only under water-saturated soil conditions. Even in additionally fertilized BC-compost mixtures (T2), N2 losses were lower compared to the control but significant amounts of N in the form of N2O were lost compared to the other treatments. This can be attributed to a 0.3 lower pH, in T2, which can trigger N2O formation [72]. In drier soils this effect was not observed; here N2 fluxes were slightly higher but not significant. Another possible explanation could be, that the addition of biochar improved the abundance of soil proteobacteria. As most of the ammonia-oxidizing bacteria including nitrogen-fixing bacteria, ammonia-oxidizing bacteria, nitrifying bacteria, and denitrifying bacteria belong to proteobacteria, nitrogen recycling [73]) and hence also the fluxes of N2O can be changed.
The N2:N2O ratio (38 ± 50) at 50% WFPS at K was higher compared to the BC-compost treatments, indicating that more N2 than N2O was produced. Even wider N2:N2O ratios were found in an agricultural soil in Uzbekistan (5–200; [74]) and in a beech forest in Southern Germany (up to 600; [26]). Since denitrification is a process influenced by many factors, e.g., soil NO3 concentrations, availability of easily degradable C, or soil moisture content, a high variability of N2 fluxes is expected [75]. However, amendment of BC-compost showed a potential to reduce N losses as N2, especially at high soil water contents. High N2O and N2 losses with increasing WFPS can be attributed to impeding gas diffusivity [76]. Therefore, the positive BC effect can be valuable for soils under humid conditions or with high groundwater levels.
To our surprise, pure N-enriched BC-compost showed high gaseous losses not only in the form of NO (230 times higher) and N2O (380 times) but also in form of N2 (14 times more). As far as we know, there are no studies in which N2O, NO, or N2 production from pure BC-compost mixtures was measured. During the incubation and storage of two weeks after the BC-production approximately 31% of applied mineral fertilizer N was lost in form of NO, N2O and N2. We assume that the existing soil microbial community was not adapted to the high N availability, as we concluded from the lower microbial biomass. Obviously, this over-fertilization led to excess gaseous N losses.

5. Conclusions

The introduction of organic additives in form of compost to BC is an effective climate change mitigation strategy as it reduced gaseous N losses. However, an N enrichment of BC-compost with ammonium sulfate led to high short-term N emissions (N2O, NO, and N2), reduced microbial biomass, and showed only a small mitigation potential for CH4 fluxes. In order to assess the effects of BC on nitrification and denitrification processes, further studies of N2 and NO losses from BC-treated soils are required to further improve our understanding of the mitigation potential of BC amendments in agricultural soils.
Although additional N fertilizer promoted CH4 consumption, it must be taken into account that high losses of NO, N2O, and N2 occurred during the storage of N-enriched BC-compost and after application. Therefore, we suggest that further research is needed to develop optimized ratios of BC-compost and supplemental mineral N to ensure adequate agricultural usage in the future.

Supplementary Materials

The following supporting information can be downloaded at: https://www.mdpi.com/article/10.3390/agronomy12122959/s1, Table S1: Maize yields in 2014. Treatments are control (K) and three BC-compost treatments (T1, T2 and T3). For application rates of BC-compost and mineral fertilizer see Table 1. Figure S1: Mean soil CH4 fluxes during the field experiment in 2014. Error bars represent standard error of mean; n = 3. K—control without BC-compost; T1—1% BC-compost; T2—0.5% BC-compost + 175 kg N ha−1; T3—no fresh BC-compost during this field trial. Figure S2: Mean soil CO2 fluxes during the field experiment in 2014. Error bars represent standard error of mean; n = 3. K—control without BC-compost; T1—1% BC-compost; T2—0.5% BC-compost + 175 kg N ha−1; T3—no fresh BC-compost during this field trial. Figure S3: Mean ammonium (NH4+) concentrations during the field experiment in 2014. Error bars represent standard error of mean; n = 3. K—control without BC-compost; T1—1% BC-compost; T2—0.5% BC-compost + 175 kg N ha−1; T3—no fresh BC-compost during this field trial. Figure S4: Mean C concentrations in the microbial biomass during the field experiment in 2014. Error bars represent standard error of mean; n = 3. K—control without BC-compost; T1—1% BC-compost; T2—0.5% BC-compost + 175 kg N ha−1; T3—no fresh BC-compost during this field trial.

Author Contributions

Conceptualization, R.M., B.K., W.F.-H. and G.S.; methodology, B.K.; investigation, R.M.; data curation, R.M.; writing—original draft preparation, R.M.; writing—review and editing, B.K., G.S., K.M., M.T. and S.Z.-B.; visualization, R.M.; supervision, B.K.; project administration, B.K.; funding acquisition, G.S. and W.F.-H. All authors have read and agreed to the published version of the manuscript.

Funding

This research was funded by FFG project 836538 (“NAWARO-SAN”). We acknowledge the EU program EJP SOIL (No 862695) for co-funding the update and revision of the manuscript.

Institutional Review Board Statement

Not applicable.

Informed Consent Statement

Not applicable.

Data Availability Statement

Not applicable.

Acknowledgments

We would like to thank Brigitte Schraufstädter, Michaela Djordjevic, Raffaela Wettl, and Eugenie Fink for assistance with laboratory analysis. Furthermore, we would also like to thank Gerald Dunst for providing biochar-compost for this experiment. We gratefully acknowledge Johann Höfler for his helpful cooperation during fieldwork.

Conflicts of Interest

The authors declare no conflict of interest.

References

  1. IPCC. The Physical Science Basis. In Working Group I Contribution to the Fifth Assessment Report of the Intergovernmental Panel on Climate Change; Cambridge University Press: Cambridge, UK, 2013. [Google Scholar]
  2. Montzka, S.A.; Dlugokencky, E.J.; Butler, J.H. Non—CO2 Greenhouse Gases and Climate Change. Nature 2011, 476, 43–50. [Google Scholar] [CrossRef] [PubMed]
  3. Hibbard, K.A.; Law, B.E.; Reichstein, M.; Sulzman, J. An Analysis of Soil Respiration across Northern Hemisphere Temperate Ecosystems. Biogeochemistry 2005, 73, 29–70. [Google Scholar] [CrossRef]
  4. Butterbach-Bahl, K.; Baggs, E.M.; Dannenmann, M.; Kiese, R.; Zechmeister-Boltenstern, S. Nitrous Oxide Emissions from Soils: How Well Do We Understand the Processes and Their Controls? Philos. Trans. R. Soc. B Biol. Sci. 2013, 368, 20130122. [Google Scholar] [CrossRef] [PubMed]
  5. Baggs, E.M. Soil Microbial Sources of Nitrous Oxide: Recent Advances in Knowledge, Emerging Challenges and Future Direction. Curr. Opin. Environ. Sustain. 2011, 3, 321–327. [Google Scholar] [CrossRef]
  6. Ettwig, K.F.; Shima, S.; Van De Pas-Schoonen, K.T.; Kahnt, J.; Medema, M.H.; Op Den Camp, H.J.M.; Jetten, M.S.M.; Strous, M. Denitrifying Bacteria Anaerobically Oxidize Methane in the Absence of Archaea. Environ. Microbiol. 2008, 10, 3164–3173. [Google Scholar] [CrossRef] [PubMed]
  7. Lehmann, J.; Joseph, S. Biochar for Environmental Management: Science, Technology and Implementation, 2nd ed.; Routledge: London, UK, 2015. [Google Scholar] [CrossRef]
  8. El-Naggar, A.; Lee, S.S.; Rinklebe, J.; Farooq, M.; Song, H.; Sarmah, A.K.; Zimmerman, A.R.; Ahmad, M.; Shaheen, S.M.; Ok, Y.S. Biochar Application to Low Fertility Soils: A Review of Current Status, and Future Prospects. Geoderma 2019, 337, 536–554. [Google Scholar] [CrossRef]
  9. Woolf, D.; Amonette, J.E.; Street-Perrott, F.A.; Lehmann, J.; Joseph, S. Sustainable Biochar to Mitigate Global Climate Change. Nat. Commun. 2010, 1, 56. [Google Scholar] [CrossRef] [Green Version]
  10. Kammann, C.; Ippolito, J.; Hagemann, N.; Borchard, N.; Cayuela, M.L.; Estavillo, J.M.; Fuertes-Mendizabal, T.; Jeffery, S.; Kern, J.; Novak, J.; et al. Biochar as a Tool to Reduce the Agricultural Greenhouse-Gas Burden—Knowns, Unknowns and Future Research Needs. J. Environ. Eng. Landsc. Manag. 2017, 25, 114–139. [Google Scholar] [CrossRef] [Green Version]
  11. Weldon, S.; Rasse, D.P.; Budai, A.; Tomic, O.; Dörsch, P. The Effect of a Biochar Temperature Series on Denitrification: Which Biochar Properties Matter? Soil Biol. Biochem. 2019, 135, 173–183. [Google Scholar] [CrossRef]
  12. Borchard, N.; Schirrmann, M.; Cayuela, M.L.; Kammann, C.; Wrage-Mönnig, N.; Estavillo, J.M.; Fuertes-Mendizábal, T.; Sigua, G.; Spokas, K.; Ippolito, J.A.; et al. Biochar, Soil and Land-Use Interactions That Reduce Nitrate Leaching and N2O Emissions: A Meta-Analysis. Sci. Total Environ. 2019, 651, 2354–2364. [Google Scholar] [CrossRef]
  13. Zhang, Q.; Xiao, J.; Xue, J.; Zhang, L. Quantifying the Effects of Biochar Application on Greenhouse Gas Emissions from Agricultural Soils: A Global Meta-Analysis. Sustainability 2020, 12, 3436. [Google Scholar] [CrossRef] [Green Version]
  14. Joseph, S.; Cowie, A.L.; Van Zwieten, L.; Bolan, N.; Budai, A.; Buss, W.; Cayuela, M.L.; Graber, E.R.; Ippolito, J.A.; Kuzyakov, Y.; et al. How Biochar Works, and When It Doesn’t: A Review of Mechanisms Controlling Soil and Plant Responses to Biochar. GCB Bioenergy 2021, 13, 1731–1764. [Google Scholar] [CrossRef]
  15. Kammann, C.; Ratering, S.; Eckhard, C.; Müller, C. Biochar and Hydrochar Effects on Greenhouse Gas (Carbon Dioxide, Nitrous Oxide, and Methane) Fluxes from Soils. J. Environ. Qual. 2012, 41, 1052–1066. [Google Scholar] [CrossRef] [PubMed]
  16. Karhu, K.; Mattila, T.; Bergström, I.; Regina, K. Biochar Addition to Agricultural Soil Increased CH4 Uptake and Water Holding Capacity—Results from a Short-Term Pilot Field Study. Agric. Ecosyst. Environ. 2011, 140, 309–313. [Google Scholar] [CrossRef]
  17. Van Zwieten, L.; Kammann, C.; Cayuela, M.L.; Singh, B.P.; Joseph, S.; Kimber, K.; Donne, S.; Clough, T.; Spokas, K. Biochar Effects on Nitrous Oxide and Methane Emissions from Soil. Biochar Environ. Manag. 2015, 487–518. [Google Scholar] [CrossRef]
  18. Song, X.; Pan, G.; Zhang, C.; Zhang, L.; Wang, H. Effects of Biochar Application on Fluxes of Three Biogenic Greenhouse Gases: A Meta-analysis. Ecosyst. Health Sustain. 2016, 2, e01202. [Google Scholar] [CrossRef] [Green Version]
  19. Jeffery, S.; Verheijen, F.; Kammann, C.; Abalos, D. Biochar Effects on Methane Emissions from Soils: A Meta-Analysis. Soil Biol. Biochem. 2016, 101, 251–258. [Google Scholar] [CrossRef]
  20. Cayuela, M.L.; Sánchez-Monedero, M.A.; Roig, A.; Hanley, K.; Enders, A.; Lehmann, J. Biochar and Denitrification in Soils: When, How Much and Why Does Biochar Reduce N2O Emissions? Sci. Rep. 2013, 3, 1732. [Google Scholar] [CrossRef] [Green Version]
  21. Clough, T.J.; Condron, L.M.; Kammann, C.; Müller, C. A Review of Biochar and Soil Nitrogen Dynamics. Agronomy 2013, 3, 275–293. [Google Scholar] [CrossRef]
  22. Nelissen, V.; Saha, B.K.; Ruysschaert, G.; Boeckx, P. Effect of Different Biochar and Fertilizer Types on N2O and NO Emissions. Soil Biol. Biochem. 2014, 70, 244–255. [Google Scholar] [CrossRef]
  23. Obia, A.; Cornelissen, G.; Mulder, J.; Dörsch, P. Effect of Soil PH Increase by Biochar on NO, N2O and N2 Production during Denitrification in Acid Soils. PLoS ONE 2015, 10, e0138781. [Google Scholar] [CrossRef] [PubMed] [Green Version]
  24. Panday, D.; Mikha, M.; Maharjan, B. Coal Char Affects Soil PH to Reduce Ammonia Volatilization from Sandy Loam Soil. Agrosyst. Geosci. Environ. 2020, 3, e20123. [Google Scholar] [CrossRef]
  25. Davidson, E.A.; Kingerlee, W. A Global Inventory of Nitric Oxide Emissions from Soils. Nutr. Cycl. Agroecosyst. 1997, 48, 37–50. [Google Scholar] [CrossRef]
  26. Dannenmann, M.; Butterbach-Bahl, K.; Gasche, R.; Willibald, G.; Papen, H. Dinitrogen Emissions and the N2:N2O Emission Ratio of a Rendzic Leptosol as Influenced by PH and Forest Thinning. Soil Biol. Biochem. 2008, 40, 2317–2323. [Google Scholar] [CrossRef]
  27. Friedl, J.; Cardenas, L.M.; Clough, T.J.; Dannenmann, M.; Hu, C.; Scheer, C. Measuring Denitrification and the N2O:(N2O+N2) Emission Ratio from Terrestrial Soils. Curr. Opin. Environ. Sustain. 2020, 47, 61–71. [Google Scholar] [CrossRef]
  28. Ameloot, N.; Maenhout, P.; De Neve, S.; Sleutel, S. Biochar-Induced N2O Emission Reductions after Field Incorporation in a Loam Soil. Geoderma 2016, 267, 10–16. [Google Scholar] [CrossRef]
  29. Haug, R.T. Composting Systems, Thermodynamic Fundamentals, Kinetics of Inactivation, Feed Conditioning, Aeration Requirements and Odour Management. In The Practical Handbook of Compost Engineering, 1st ed.; Routledge: London, UK, 1993. [Google Scholar] [CrossRef]
  30. Steiner, C.; Sánchez-Monedero, M.; Kammann, C. Biochar as an Additive to Compost and Growing Media. In Biochar for Environmental Management: Science, Technology and Implementation; Routledge: London, UK, 2015; pp. 715–735. ISBN 978-0-415-70415-1. [Google Scholar]
  31. Fischer, D.; Glaser, B. Synergisms between Compost and Biochar for Sustainable Soil Amelioration. In Management of Organic Waste; InTech: Rijeka, Croatia, 2012; ISBN 978-953-307-925-7. [Google Scholar]
  32. Steiner, C. Soil Charcoal Amendments Maintain Soil Fertility and Establish Carbon Sink-Research and Prospects. In Soil Ecology Research Developments; Nova Science Publishers Inc.: Hauppauge, NY, USA, 2007. [Google Scholar]
  33. Paustian, K.; Lehmann, J.; Ogle, S.; Reay, D.; Robertson, G.P.; Smith, P. Climate-Smart Soils. Nature 2016, 532, 49–57. [Google Scholar] [CrossRef] [PubMed] [Green Version]
  34. Spokas, K.A.; Koskinen, W.C.; Baker, J.M.; Reicosky, D.C. Impacts of Woodchip Biochar Additions on Greenhouse Gas Production and Sorption/Degradation of Two Herbicides in a Minnesota Soil. Chemosphere 2009, 77, 574–581. [Google Scholar] [CrossRef]
  35. WRB; IUSS; Schád, P.; van Huyssteen, C.; Micheli, E. World Reference Base for Soil Resources 2014, Update 2015; IUSS Working Group WRB: Pavia, Italy, 2015; ISBN E-ISBN 978-92-5-108370-3. [Google Scholar]
  36. Collier, S.; Ruark, M.; Oates, L.; Jokela, W.; Dell, C. Measurement of Greenhouse Gas Flux from Agricultural Soils Using Static Chambers. J. Vis. Exp. 2014, 90, e52110. [Google Scholar] [CrossRef] [Green Version]
  37. Alm, J.; Shurpali, N.; Tuittila, E.-S.; Laurila, T.; Maljanen, M.; Saarnio, S.; Minkkinen, K. Methods for Determining Emission Factors for the Use of Peat and Peatlands—Flux Measurements and Modelling. BOREAL Environ. Res. 2007, 12, 85–100. [Google Scholar]
  38. Parkin, T.B.; Venterea, R.T.; Hargreaves, S.K. Calculating the Detection Limits of Chamber-Based Soil Greenhouse Gas Flux Measurements. J. Environ. Qual. 2012, 41, 705–715. [Google Scholar] [CrossRef] [PubMed] [Green Version]
  39. Metcalfe, D.B.; Meir, P.; Aragão, L.E.O.C.; Malhi, Y.; da Costa, A.C.L.; Braga, A.; Gonçalves, P.H.L.; de Athaydes, J.; de Almeida, S.S.; Williams, M. Factors Controlling Spatio-Temporal Variation in Carbon Dioxide Efflux from Surface Litter, Roots, and Soil Organic Matter at Four Rain Forest Sites in the Eastern Amazon. J. Geophys. Res. Biogeosci. 2007, 112. [Google Scholar] [CrossRef] [Green Version]
  40. Schindlbacher, A.; Zechmeister-Boltenstern, S.; Butterbach-Bahl, K. Effects of Soil Moisture and Temperature on NO, NO2, and N2O Emissions from European Forest Soils. J. Geophys. Res. Atmos. 2004, 109. [Google Scholar] [CrossRef]
  41. Butterbach-Bahl, K.; Willibald, G.; Papen, H. Soil Core Method for Direct Simultaneous Determination of N2 and N2O Emissions from Forest Soils. Plant Soil 2002, 240, 105–116. [Google Scholar] [CrossRef]
  42. ÖNORM L 1083; Chemische Bodenuntersuchungen—Bestimmung der Acidität. Austrian Standards: Wien, Austria, 2006.
  43. ÖNORM L 1080; Chemical Analyses of Soils—Determination of Organic Carbon by Dry Combustion with and without Consideration of Carbonates. Austrian Standards: Wien, Austria, 2006.
  44. Hood-Nowotny, R.; Umana, N.H.-N.; Inselbacher, E.; Oswald-Lachouani, P.; Wanek, W. Alternative Methods for Measuring Inorganic, Organic, and Total Dissolved Nitrogen in Soil. Soil Sci. Soc. Am. J. 2010, 74, 1018–1027. [Google Scholar] [CrossRef]
  45. Schinner, F.; Sonnleitner, R. Methoden Der Bodenmikrobiologie Und -Biochemie. In Bodenökologie: Mikrobiologie und Bodenenzymatik Band I: Grundlagen, Klima, Vegetation und Bodentyp; Springer: Berlin/Heidelberg, Germany, 1996; pp. 237–259. ISBN 978-3-642-80175-4. [Google Scholar]
  46. Zuur, A.F.; Ieno, E.N.; Elphick, C.S. A Protocol for Data Exploration to Avoid Common Statistical Problems. Methods Ecol. Evol. 2010, 1, 3–14. [Google Scholar] [CrossRef]
  47. Boeckx, P.; Van Cleemput, O. Estimates of N2O and CH4 Fluxes from Agricultural Lands in Various Regions in Europe. Nutr. Cycl. Agroecosyst. 2001, 60, 35–47. [Google Scholar] [CrossRef]
  48. Zhang, A.; Bian, R.; Pan, G.; Cui, L.; Hussain, Q.; Li, L.; Zheng, J.; Zheng, J.; Zhang, X.; Han, X.; et al. Effects of Biochar Amendment on Soil Quality, Crop Yield and Greenhouse Gas Emission in a Chinese Rice Paddy: A Field Study of 2 Consecutive Rice Growing Cycles. Field Crops Res. 2012, 127, 153–160. [Google Scholar] [CrossRef]
  49. Case, S.D.C.; McNamara, N.P.; Reay, D.S.; Whitaker, J. The Effect of Biochar Addition on N2O and CO2 Emissions from a Sandy Loam Soil—The Role of Soil Aeration. Soil Biol. Biochem. 2012, 51, 125–134. [Google Scholar] [CrossRef]
  50. Le Mer, J.; Roger, P. Production, Oxidation, Emission and Consumption of Methane by Soils: A Review. Eur. J. Soil Biol. 2001, 37, 25–50. [Google Scholar] [CrossRef]
  51. Hellebrand, H.J.; Kern, J.; Scholz, V. Long-Term Studies on Greenhouse Gas Fluxes during Cultivation of Energy Crops on Sandy Soils. Atmos. Environ. 2003, 37, 1635–1644. [Google Scholar] [CrossRef]
  52. Yu, L.; Tang, J.; Zhang, R.; Wu, Q.; Gong, M. Effects of Biochar Application on Soil Methane Emission at Different Soil Moisture Levels. Biol. Fertil. Soils 2013, 49, 119–128. [Google Scholar] [CrossRef]
  53. Zimmerman, A.R.; Gao, B.; Ahn, M.-Y. Positive and Negative Carbon Mineralization Priming Effects among a Variety of Biochar-Amended Soils. Soil Biol. Biochem. 2011, 43, 1169–1179. [Google Scholar] [CrossRef]
  54. Thomazini, A.; Spokas, K.; Hall, K.; Ippolito, J.; Lentz, R.; Novak, J. GHG Impacts of Biochar: Predictability for the Same Biochar. Agric. Ecosyst. Environ. 2015, 207, 183–191. [Google Scholar] [CrossRef]
  55. Novak, J.; Busscher, W.; Laird, D.; Ahmedna, M.; Watts, D.W.; Niandou, M. Impact of Biochar Amendment on Fertility of a Southeastern Coastal Plain Soil. Soil Sci. 2009, 174. [Google Scholar] [CrossRef] [Green Version]
  56. Luo, Y.; Durenkamp, M.; Nobili, M.D.; Lin, Q.; Brookes, P.C. Short Term Soil Priming Effects and the Mineralisation of Biochar Following Its Incorporation to Soils of Different pH. Soil Biol. Biochem. 2011, 43, 2304–2314. [Google Scholar] [CrossRef]
  57. Case, S.D.C.; McNamara, N.P.; Reay, D.S.; Whitaker, J. Can Biochar Reduce Soil Greenhouse Gas Emissions from a Miscanthus Bioenergy Crop? GCB Bioenergy 2014, 6, 76–89. [Google Scholar] [CrossRef] [Green Version]
  58. Zimmermann, M.; Bird, M.I.; Wurster, C.; Saiz, G.; Goodrick, I.; Barta, J.; Capek, P.; Santruckova, H.; Smernik, R. Rapid Degradation of Pyrogenic Carbon. Glob. Change Biol. 2012, 18, 3306–3316. [Google Scholar] [CrossRef]
  59. Shah, A.; Lamers, M.; Streck, T. N2O and CO2 Emissions from South German Arable Soil after Amendment of Manures and Composts. Environ. Earth Sci. 2016, 75, 427. [Google Scholar] [CrossRef]
  60. Tallec, T.; Brut, A.; Joly, L.; Dumelié, N.; Serça, D.; Mordelet, P.; Claverie, N.; Legain, D.; Barrié, J.; Decarpenterie, T.; et al. N2O Flux Measurements over an Irrigated Maize Crop: A Comparison of Three Methods. Agric. For. Meteorol. 2019, 264, 56–72. [Google Scholar] [CrossRef]
  61. Barton, L.; Wolf, B.; Rowlings, D.; Scheer, C.; Kiese, R.; Grace, P.; Stefanova, K.; Butterbach-Bahl, K. Sampling Frequency Affects Estimates of Annual Nitrous Oxide Fluxes. Sci. Rep. 2015, 5, 15912. [Google Scholar] [CrossRef] [PubMed] [Green Version]
  62. Xiang, J.; Liu, D.; Ding, W.; Yuan, J.; Lin, Y. Effects of Biochar on Nitrous Oxide and Nitric Oxide Emissions from Paddy Field during the Wheat Growth Season. J. Clean. Prod. 2015, 104, 52–58. [Google Scholar] [CrossRef]
  63. Ludwig, J.; Meixner, F.X.; Vogel, B.; Förstner, J. Soil-Air Exchange of Nitric Oxide: An Overview of Processes, Environmental Factors, and Modeling Studies. Biogeochemistry 2001, 52, 225–257. [Google Scholar] [CrossRef]
  64. Conrad, R. Microbiological and Biochemical Background of Production and Consumption of NO and N2O in Soil. In Trace Gas Exchange in Forest Ecosystems; Gasche, R., Papen, H., Rennenberg, H., Eds.; Springer: Dordrecht, The Netherlands, 2002; pp. 3–33. ISBN 978-94-015-9856-9. [Google Scholar]
  65. Pilegaard, K. Processes Regulating Nitric Oxide Emissions from Soils. Philos. Trans. R. Soc. B Biol. Sci. 2013, 368, 20130126. [Google Scholar] [CrossRef] [Green Version]
  66. Medinets, S.; Skiba, U.; Rennenberg, H.; Butterbach-Bahl, K. A Review of Soil NO Transformation: Associated Processes and Possible Physiological Significance on Organisms. Soil Biol. Biochem. 2015, 80, 92–117. [Google Scholar] [CrossRef] [Green Version]
  67. Ameloot, N.; Graber, E.R.; Verheijen, F.G.A.; De Neve, S. Interactions between Biochar Stability and Soil Organisms: Review and Research Needs. Eur. J. Soil Sci. 2013, 64, 379–390. [Google Scholar] [CrossRef]
  68. Lehmann, J.; Rillig, M.C.; Thies, J.; Masiello, C.A.; Hockaday, W.C.; Crowley, D. Biochar Effects on Soil Biota—A Review. Soil Biol. Biochem. 2011, 43, 1812–1836. [Google Scholar] [CrossRef]
  69. Ameloot, N.; De Neve, S.; Jegajeevagan, K.; Yildiz, G.; Buchan, D.; Funkuin, Y.N.; Prins, W.; Bouckaert, L.; Sleutel, S. Short-Term CO2 and N2O Emissions and Microbial Properties of Biochar Amended Sandy Loam Soils. Soil Biol. Biochem. 2013, 57, 401–410. [Google Scholar] [CrossRef]
  70. Treseder, K.K. Nitrogen Additions and Microbial Biomass: A Meta-Analysis of Ecosystem Studies. Ecol. Lett. 2008, 11, 1111–1120. [Google Scholar] [CrossRef]
  71. Birk, J.; Steiner, C.; Teixeira, W.; Zech, W.; Glaser, B. Microbial Response to Charcoal Amendments and Fertilization of a Highly Weathered Tropical Soil. In Amazonian Dark Earths: Wim Sombroek’s Vision; Springer: Dortrecht, The Netherlands, 2008; pp. 309–324. ISBN 978-1-4020-9030-1. [Google Scholar]
  72. Cuhel, J.; Simek, M.; Laughlin, R.J.; Bru, D.; Chèneby, D.; Watson, C.J.; Philippot, L. Insights into the Effect of Soil PH on N2O and N2 Emissions and Denitrifier Community Size and Activity. Appl. Environ. Microbiol. 2010, 76, 1870–1878. [Google Scholar] [CrossRef] [Green Version]
  73. Zhang, H.; Ullah, F.; Ahmad, R.; Ali Shah, S.U.; Khan, A.; Adnan, M. Response of Soil Proteobacteria to Biochar Amendment in Sustainable Agriculture- A Mini Review. J. Soil Plant Environ. 2022, 1, 16–30. [Google Scholar] [CrossRef]
  74. Scheer, C.; Wassmann, R.; Butterbach-Bahl, K.; Lamers, J.P.A.; Martius, C. The Relationship between N2O, NO, and N2 Fluxes from Fertilized and Irrigated Dryland Soils of the Aral Sea Basin, Uzbekistan. Plant Soil 2008, 314, 273. [Google Scholar] [CrossRef]
  75. Weier, K.L.; Doran, J.W.; Power, J.F.; Walters, D.T. Denitrification and the Dinitrogen/Nitrous Oxide Ratio as Affected by Soil Water, Available Carbon, and Nitrate. Soil Sci. Soc. Am. J. 1993, 57, 66–72. [Google Scholar] [CrossRef] [Green Version]
  76. Fiedler, S.R.; Augustin, J.; Wrage-Mönnig, N.; Jurasinski, G.; Gusovius, B.; Glatzel, S. Potential Short-Term Losses of N2O and N2 from High Concentrations of Biogas Digestate in Arable Soils. Soil 2017, 3, 161–176. [Google Scholar] [CrossRef]
Figure 1. Average air temperature (°C) including the range (light grey bars) and precipitation data (mm) from April to September 2014 measured at weather station Gleisdorf by Zentralanstalt für Meterologie und Geodynamik (ZAMG). Bold crosses indicate measured soil temperature (°C) at Kaindorf on sampling dates.
Agronomy 12 02959 g001
Figure 2. Mean soil N2O emissions (a), soil NO emissions (b), NO3 concentration (c), N in microbial biomass (d), and gravimetric soil water content (e) during the field experiment in 2014 (155 days). The red line indicates biochar-compost application at T1 and T2 (+175 kg N ha−1); soil was also disturbed at K and T3. Error bars represent the standard error of mean; n = 3 (a), n = 6 (b), n = 3 (ce). K—control without BC-compost; T1—1% BC-compost; T—0.5% BC-compost + 175 kg N ha−1; T3—no fresh BC-compost during this field trial.
Agronomy 12 02959 g002
Figure 3. Mean N2 and N2O fluxes at 23% and 50% water-filled pore space (WFPS) at 24 °C. Error bars represent the standard error of mean; n = 3. Capital letters show significance levels for N2O fluxes and lowercase letters for N2 fluxes. The same letters are not significantly different at p < 0.05.
Agronomy 12 02959 g003
Table 1. Codes and application rates of BC-compost and mineral fertilizer in 30 April 2013 and 22 May 2014.
CodeTreatments 2013Treatments 2014
KNo BC-compost + 350 kg N ha−1-
T11% BC-compost +1% BC-compost
T20.5% BC-compost + 175 kg N ha−1+0.5% BC-compost + 175 kg N ha−1
T31% BC-compost + 350 kg N ha−1-
Note: “+… kg N ha−1” indicates N fertilization with ammonium sulfate. Nitrogen was added during the production of the BC-compost mixture (for T2 in 2013 and 2014; for T3 only in 2013) or directly applied to the field (for K only in 2013).
Table 2. Properties and gas fluxes from the two pure BC-compost mixtures before application to the field in 2014. BC-compost used for T2 was enriched with ammonium sulfate.
PropertiesBC-Compost Used for T1BC-Compost Used for T2
Corg 1 [mg g−1]133.5 ± 10.493.9 ± 6.2
Ntot 2 [mg g−1]4.4 ± 0.15.6 ± 0.3
C:N30.5 ± 1.816.7 ± 0.3
pH7.6 ± 0.07.3 ± 0.0
NH4+ [μg N g−1 dw]14.9 ± 0.442.8 ± 4.9
NO3 [μg N g−1 dw]105 ± 4.23020 ± 108
Cmic [µg g−1 dw]1567 ± 35844 ± 102
Nmic [µg g−1 dw]184 ± 5.187.5 ± 61
EC 3 [mS cm−1]2.531.7
CEC 4 [mmolc kg−1]222665
Gas fluxes from pure BC-compost
CH4 [μg C g−1 h−1]0.02 ± 0.01 a0.17 ± 0.03 b
CO2 [mg C g−1 h−1]0.07 ± 0.01 a0.16 ± 0.01 b
N2O [μg N g−1 h−1]3.47 ± 0.63 a1319 ± 101 b
NO [μg N g−1 h−1]0.31 ± 0.04 a72 ± 2.1 b
N2 [μg N g−1 h−1]23.9 ± 21 a338 ± 93 b
Note. Results are means of three replicates (n = 3); ±indicates standard deviation of mean. Values with the same letter are not significantly different at p < 0.05. 1 Soil organic carbon, 2 Total nitrogen content, 3 Electrical conductivity, 4 Cation exchange capacity.
Table 3. Cumulative soil GHG emissions over a period of 155 days in 2014. Treatments are control (K) and three BC-compost treatments (T1, T2 and T3). For application rates of BC-compost and mineral fertilizer see Table 1.
Cumulative Soil GHG EmissionsKT1T2T3
CH4 [kg C ha−1]0.27 ± 0.56 a0.44 ± 0.50 a0.18 ± 0.37 a0.50 ± 0.61 a
CO2 [t C ha−1]2.89 ± 1.14 a2.92 ± 1.25 a2.68 ± 1.05 a2.40 ± 0.95 a
N2O [kg N ha−1]0.60 ± 0.48 a0.21 ± 0.11 b0.33 ± 0.19 b0.29 ± 0.16 b
NO [kg N ha−1]0.27 ± 0.12 a0.18 ± 0.07 a0.43 ± 0.16 b0.30 ± 0.18 a
Note: Means followed by the same letter show no significant difference between the treatments at p < 0.05.
Table 4. Soil organic carbon (Corg) [mg g−1], total nitrogen (Ntot) [mg g−1], C:N ratio and pH before (−30 DAA a) and after (mean: +1 to +125 DAA a) BC-compost and mineral N application in 2014. Treatments are control (K) and three BC-compost treatments (T1, T2, and T3). For application rates of BC-compost and mineral fertilizer see Table 1.
Soil PropertiesDAA aKT1T2T3
Corg−3018.6 ± 0.5 a21.2 ± 2.1 a18.6 ± 0.7 a21.3 ± 2.8 a
+1 to +12518.5 ± 1.6 c32.9 ± 7.04 a22.6 ± 3.23 b20.4 ± 2.1 bc
Ntot−301.8 ± 0.01 a1.9 ± 0.1 a1.8 ± 0.1 a2.0 ± 0.2 a
+1 to +1251.9 ± 0.1 c2.3 ± 0.2 a2.1 ± 0.2 b2.0 ± 0.2 bc
C:N−3010.1 ± 0.17 a11.2 ± 0.67 a10.1 ± 0.02 a10.9 ± 0.33 a
+1 to +1259.9 ± 0.5 c13.9 ± 1.5 a11.0 ± 0.7 b10.4 ± 0.4 c
pH−306.1 ± 0.20 a6.4 ± 0.15 a6.2 ± 0.01 a6.2 ± 0.10 a
+16.1 ± 0.18 c6.5 ± 0.04 a6.4 ± 0.16 ab6.2 ± 0.02 bc
Note: Results are means of three replicates (n = 3 for −30 DAA and n = 18 for +1 to +125 DAA); ± indicates the standard deviation of the mean. a DAA = days after application of BC-compost. Note: Values with the same letter are not significantly different at p < 0.05.
Publisher’s Note: MDPI stays neutral with regard to jurisdictional claims in published maps and institutional affiliations.

