Article

Spatial Distribution Patterns for Identifying Risk Areas Associated with False Smut Disease of Rice in Southern India

by
Sharanabasav Huded
1,
Devanna Pramesh
1,*,
Amoghavarsha Chittaragi
1,2,
Shankarappa Sridhara
3,
Eranna Chidanandappa
1,
Muthukapalli K. Prasannakumar
4,
Channappa Manjunatha
5,
Balanagouda Patil
2,
Sandip Shil
6,
Hanumanthappa Deeshappa Pushpa
7,
Adke Raghunandana
1,
Indrajeet Usha
1,
Siva K. Balasundram
8 and
Redmond R. Shamshiri
9,*
1
Rice Pathology Laboratory, All India Coordinated Rice Improvement Programme, University of Agricultural Sciences, Raichur 584 104, India
2
Department of Plant Pathology, University of Agricultural and Horticultural Sciences, Shivamogga 577 201, India
3
Center for Climate Resilient Agriculture, University of Agricultural and Horticultural Sciences, Shivamogga 577 201, India
4
Department of Plant Pathology, University of Agricultural Sciences, Bangalore 560 065, India
5
ICAR-National Bureau of Agricultural Insect Resources, Bangalore 560 065, India
6
Research Centre, Division of Social Sciences, ICAR-Central Plantation Crops Research Institute, Mohitnagar 734 105, India
7
ICAR-Indian Institute of Oilseeds Research, Hyderabad 500 030, India
8
Department of Agriculture Technology, Faculty of Agriculture, Universiti Putra Malaysia, Serdang 43400, Selangor, Malaysia
9
Leibniz Institute for Agricultural Engineering and Bioeconomy, Max-Eyth-Allee 100, 14469 Potsdam, Germany
*
Authors to whom correspondence should be addressed.
Agronomy 2022, 12(12), 2947; https://doi.org/10.3390/agronomy12122947
Submission received: 26 August 2022 / Revised: 11 November 2022 / Accepted: 15 November 2022 / Published: 24 November 2022
(This article belongs to the Section Pest and Disease Management)

Abstract

:
False smut disease (FSD) of rice incited by Ustilaginoidea virens is an emerging threat to paddy cultivation worldwide. We investigated the spatial distribution of FSD in different paddy ecosystems of South Indian states, viz., Andhra Pradesh, Karnataka, Tamil Nadu, and Telangana, by considering the exploratory data from 111 sampling sites. Point pattern and surface interpolation analyses were carried out to identify the spatial patterns of FSD across the studied areas. The spatial clusters of FSD were confirmed by employing spatial autocorrelation and Ripley’s K function. Further, ordinary kriging (OK), indicator kriging (IK), and inverse distance weighting (IDW) were used to create spatial maps by predicting the values at unvisited locations. The agglomerative hierarchical cluster analysis using the average linkage method identified four main clusters of FSD. From the Local Moran’s I statistic, most of the areas of Andhra Pradesh and Tamil Nadu were clustered together (at I > 0), except the coastal and interior districts of Karnataka (at I < 0). Spatial patterns of FSD severity were determined by semi-variogram experimental models, and the spherical model was the best fit. Results from the interpolation technique, the potential FSD hot spots/risk areas were majorly identified in Tamil Nadu and a few traditional rice-growing ecosystems of Northern Karnataka. This is the first intensive study that attempted to understand the spatial patterns of FSD using geostatistical approaches in India. The findings from this study would help in setting up ecosystem-specific management strategies to reduce the spread of FSD in India.

1. Introduction

False smut disease (FSD) caused by Ustilaginoidea virens (Cook) is an emerging grain-infecting disease of rice wherein the infected grains are transformed into yellow to black-colored smut balls [1]. The FSD has gained economic importance as it causes economic losses in terms of both quantity (reducing the grain yield) and quality (contamination of grains with toxins) [2,3,4,5]. The FSD was first reported in the Tirunelveli district of Tamil Nadu, India [6], and further concurrent occurrences were reported across the rice-growing areas. FSD is caused by an ascomycete fungus, in which the overwintered sclerotia germinate to produce stroma on which asci are formed, producing ascospores as primary sources of inoculum and conidia act as a secondary source of infection [7]. The characteristic and devastating symptoms of the FSD are generally observed at the grain-filling stage. Initially, white mycelium surrounds the grain and produces a yellow-to-orange mass of chlamydospores in a small smut ball. After bursting the thin outer membrane, the smut ball turns velvety greenish to black.
In India, the incidences of FSD were evidenced up to 85% and resulted in grain yield losses of up to 49% [2,3,8,9,10]. Recently, FSD has attained serious proportions by inflicting rapid spread and inoculum build-up in neighboring states/regions. However, it is imperative to understand the FSD incidences across the regions and to identify the potential risk associated with FSD. The spatial pattern of disease indicated the source of primary inoculum, dispersal means, and factors driving the epidemics that assist in refining the strategies of disease monitoring and management [11,12,13,14]. Various approaches have been utilized to identify the spatial pattern of plant diseases [15,16]. Among the attempted approaches, interpolation techniques are regularly used to identify the potential risk factors involved in epidemics and characterize plant disease spatial patterns [17,18].
The inclusion of geographical information system (GIS) in the geostatistical techniques offered a platform to integrate plant disease status and meteorological data along with geographical information into one system, thereby enabling the study of the relationship between plant disease progress and the environment [19]. The GIS helps to characterize the disease-affected fields. With the GIS, geostatistical, hot spot analysis, interpolation, interpretation of semi-variograms, and other modeling can be made to understand the progress of plant diseases over time and space [20]. The correlation between spatial data at different intervals can be determined by spatial autocorrelation [21]. With these spatial observations, spatial dependence models can be expressed as semi-variograms, by which the disease occurrences without bias and with the least variance can be estimated using kriging interpolation techniques [22].
Southern India has been enriched with varied geographical patterns and ecological diversity where rice is grown in different ecosystems such as irrigated, rainfed, coastal, and hills [23]. Each ecosystem is unique concerning the soil type, cultivars that are grown, water source, etc., and has always been affected by the occurrence of FSD every year in severe form [5,24,25]. Initially, the FSD was considered a minor disease, but due to its recent gaining of epidemic form in all growing rice-growing parts at the global level, the FSD is considered one of the major threats to rice production. Many studies have been carried out on disease severity assessment distinctively in different parts of India, but due to its varied level of disease intensity in rice ecosystems, a holistic study on the spatial distribution of FSD in different south Indian ecosystems will provide the needful information on the population structure of the pathogen and dynamics of the FSD across India [3,5,9,14,24,25].
No previous works were focused on the FSD spatial distribution and potential risk regions in the different ecosystems of southern India. In the perusal of shortfalls, the present investigation aimed to determine the current FSD status and spatial distribution in diverse rice ecosystems of South India to identify the FSD clusters by point analysis and potential risk areas estimation using the interpolation techniques.

2. Materials and Methods

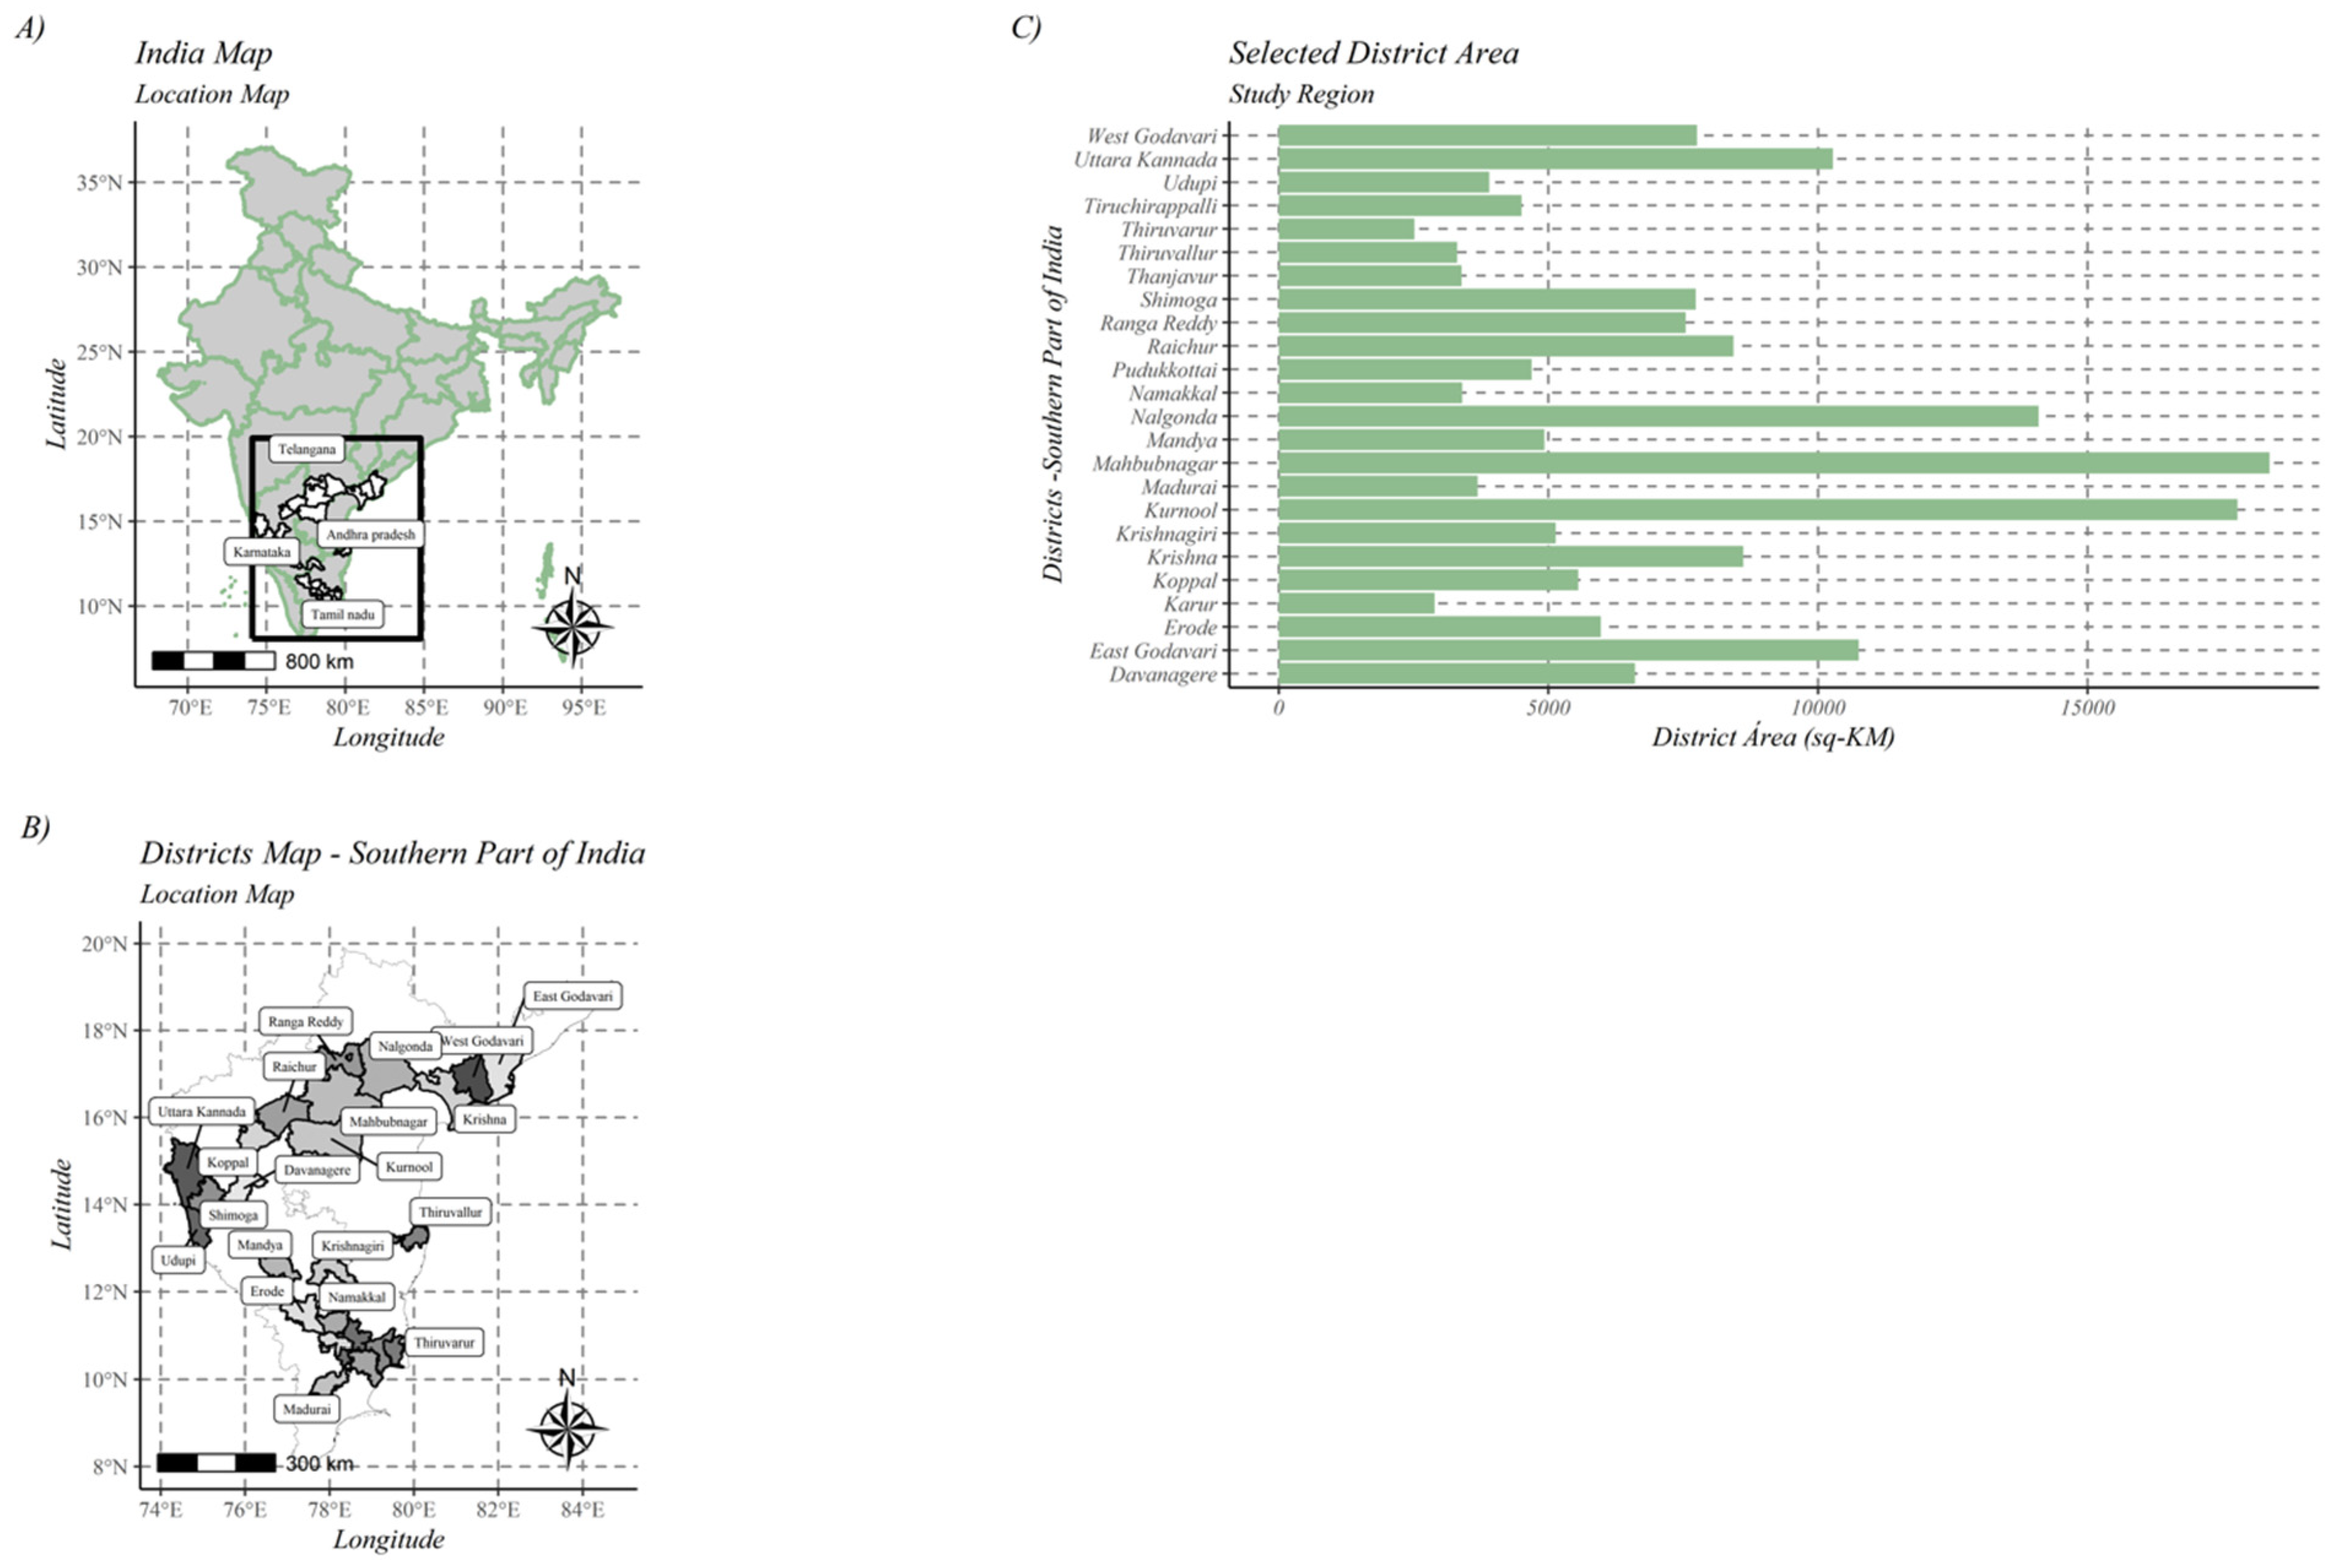
2.1. Data Collection and Sampling

This study was undertaken in the four major paddy-growing southern Indian states covering dry land, irrigated, hilly, and coastal ecosystems during the Kharif season of 2018 (Table 1 and Figure 1).
Four states with 26 administrative districts consisting of 111 sampling points of Andhra Pradesh, Karnataka, Telangana State, and Tamil Nadu states were covered during the exploratory survey. Major paddy growing districts were selected from each state, and five fields were selected and randomly sampled from different villages.

2.2. Estimation of Disease Severity

Two to three m2 areas were marked randomly in each field, observations on the number of infected tillers per m2, percent infected grains, and the number of smut balls per panicle were recorded, and disease severity was calculated using the Formula (3) [7]. Percent infected tillers and percent infected grains were calculated using the Formulas (1) and (2) [26].
Disease   Severity   =   Percent   infected   tillers   ×   Percent   infected   grains
Percent   infected   tillers =   Number   of   infected   tillers   /   m 2 Total   number   of   tillers   /   m 2   ×   100
Percent   infected   grains =   Number   of   infected   grains / panicle Total   number   of   grains / panicle   ×   100

2.3. Statistical Analysis and Data Validation

Initially, the normality of the collected data was checked using Kolmogorov–Smirnov test [27]. Further, histogram and QQ plots were generated to remove the slight global trend observed in the data set and understand the data distribution. The FSD severity (%) collected from different rice ecosystems was analyzed by Kruskal–Wallis test in R software (version R-4.0.3) [28]. Agglomerative hierarchical cluster analysis was done using the average linkage method to find the distances among the districts [29]. Cluster analysis was performed through the “hclust” function using R software (version R-4.0.3). In a hierarchical linkage clustering, the distance between two points IS the distance (L) between two clusters (r,s) and can be expressed by Formula (4):
L r , s   =   1 n r n s i   =   1 n r j   =   1 n s D X r i   , X s j

2.4. Geostatistical Approaches

The spatial distribution of the FSD occurrence across the surveyed districts of southern India was investigated by employing two widely used geospatial techniques such as point pattern and surface interpolation. Ripley’s K function and point-pattern-optimized hotspot analysis were used to locate and confirm the substantial FSD clusters existing across the studied areas. Similarly, inverse distance weighting (IDW), ordinary kriging (OK), and indicator kriging (IK) methods were used to create geographic maps of the probable surface and risk associated with FSD among the sampled regions.

2.5. Point-Pattern-Optimized Cluster Analysis

The data sets were optimized by considering the closest sampling locations/sites. Spatial autocorrelation is a point pattern technique that was carried out using Moran’s I or local indicator of spatial association (LISA) statistics. LISA suggests spatial clusters exist, and the findings were deduced using the p-value. Equation (5) was used to calculate Moran’s I statistic for a real unit i.
  I i   =   Z i j n W i j Z j
where I is the statistic for district I; Z is the difference between the FSD severity risk at i and the mean FSD severity for regions; W is the spatial weights matrix, and j and n represent constant.
The nearest areas or sampling sites with higher FSD severity values (%) were considered hotspots or potential risk areas [30]. The clustering pattern was estimated using Ripley’s K(r) function [31] for the model developed in each sampling area. The function is expressed as K(r) = λ − 1E, where K(r) represents the characteristics of point events over a range of scales; E(r) is the expected mean number of points within a distance r of randomly chosen points, and λ is the FSD severity of the studied sites.

2.6. Spatial Interpolation Techniques

Using the surface interpolation method, the values at the unvisited locations were anticipated; for instance, the FSD severity at sites (X1, X2, ..., Xn) is (Z1, Z2, ..., Zn). The Z values can be calculated at a new position X through surface interpolation. IDW and OK approaches were generally used to estimate the FSD-infected surface area. The following Formula (6) can express the IDW at an unsampled site I.
  F i   =   i   =   1 m W i Z r i   =   i   =   1 m Z r i / r     r i j   =   1 m 1 / r     r j p p
where P = parameter; m = a number of neighboring points taken into account at a certain cut-off distance. The interpolated values are compared with the actual values via leaving one-out-cross validation from the omitted point.
Kriging is an interpolation technique to determine the random function Z’s spatial correlation (X0). Formula (7) determines the expected values of variable Z at the unsampled point X0 [32]
γ d   =   1 2 X 1     Z X 2 2
Equation (8) was used to generate the surface maps of the FSD severity using the OK technique:
X 0 =     i   =   1 n λ i Z X i
where Z is the variable of interest located at spatial coordinates Xi and X0, n is the number of neighbors connected to the sampling point, and λi = is the weight associated with Xi (the sampling point) and the ith observation point [33].

2.7. Semivariance

Based on the average spatial variability and the severity of the FSD, semivariograms estimated the closest neighbor index [34]. Different experimental models were utilized to fit the semivariograms, but the best match was found to be the exponential model, which was then used to produce the OK maps. According to the following Formula (9),
ŷ h   =   1 2 N h i   =   1 N h Z X i     Z X i   +   h 2
where y(h) = semivariance for the interval distance class h, N(h) = number of data pairs of a given lag interval distance and direction, Z(xi) = measured sample value at point i, and Z(xi + h) = measured sample value at position I + h.
Semivariogram values are fitted with spherical, exponential, and Gaussian models as:
Spherical model:
ŷ h   =   C 0     +   C 1.5 h a     h a 3 ,   i f   0     h     a .  
Exponential model:
ŷ h   =   C 0     +   C 1     exp h a for   h     0  
Gaussian model:
ŷ h   =   C 0     +   C 1     exp h 2 a 2 for   h     0  
C0 is a nugget, (C + C0) is a sill, and a is the range in the spherical model. The theoretical range for exponential and Gaussian models is represented by “a”.
By calculating validation metrics, including the average standard error (ASE), mean square error (MSE), and root mean square error (RMSE), the validity of the simulated data across applied models and methodologies was carefully compared. Whenever the severity of FSD was greater than 20% per field, indicator kriging (IK) was employed to identify the disease-vulnerable regions [35,36]. Based on this, the probability risk maps were created using the best-fitted semivariogram model. A similar approach was used to create a color-coded map for ordinary kriging, where the contour symbolization depicts the areas of higher risk for FSD in the various rice ecosystems of South India.

3. Results

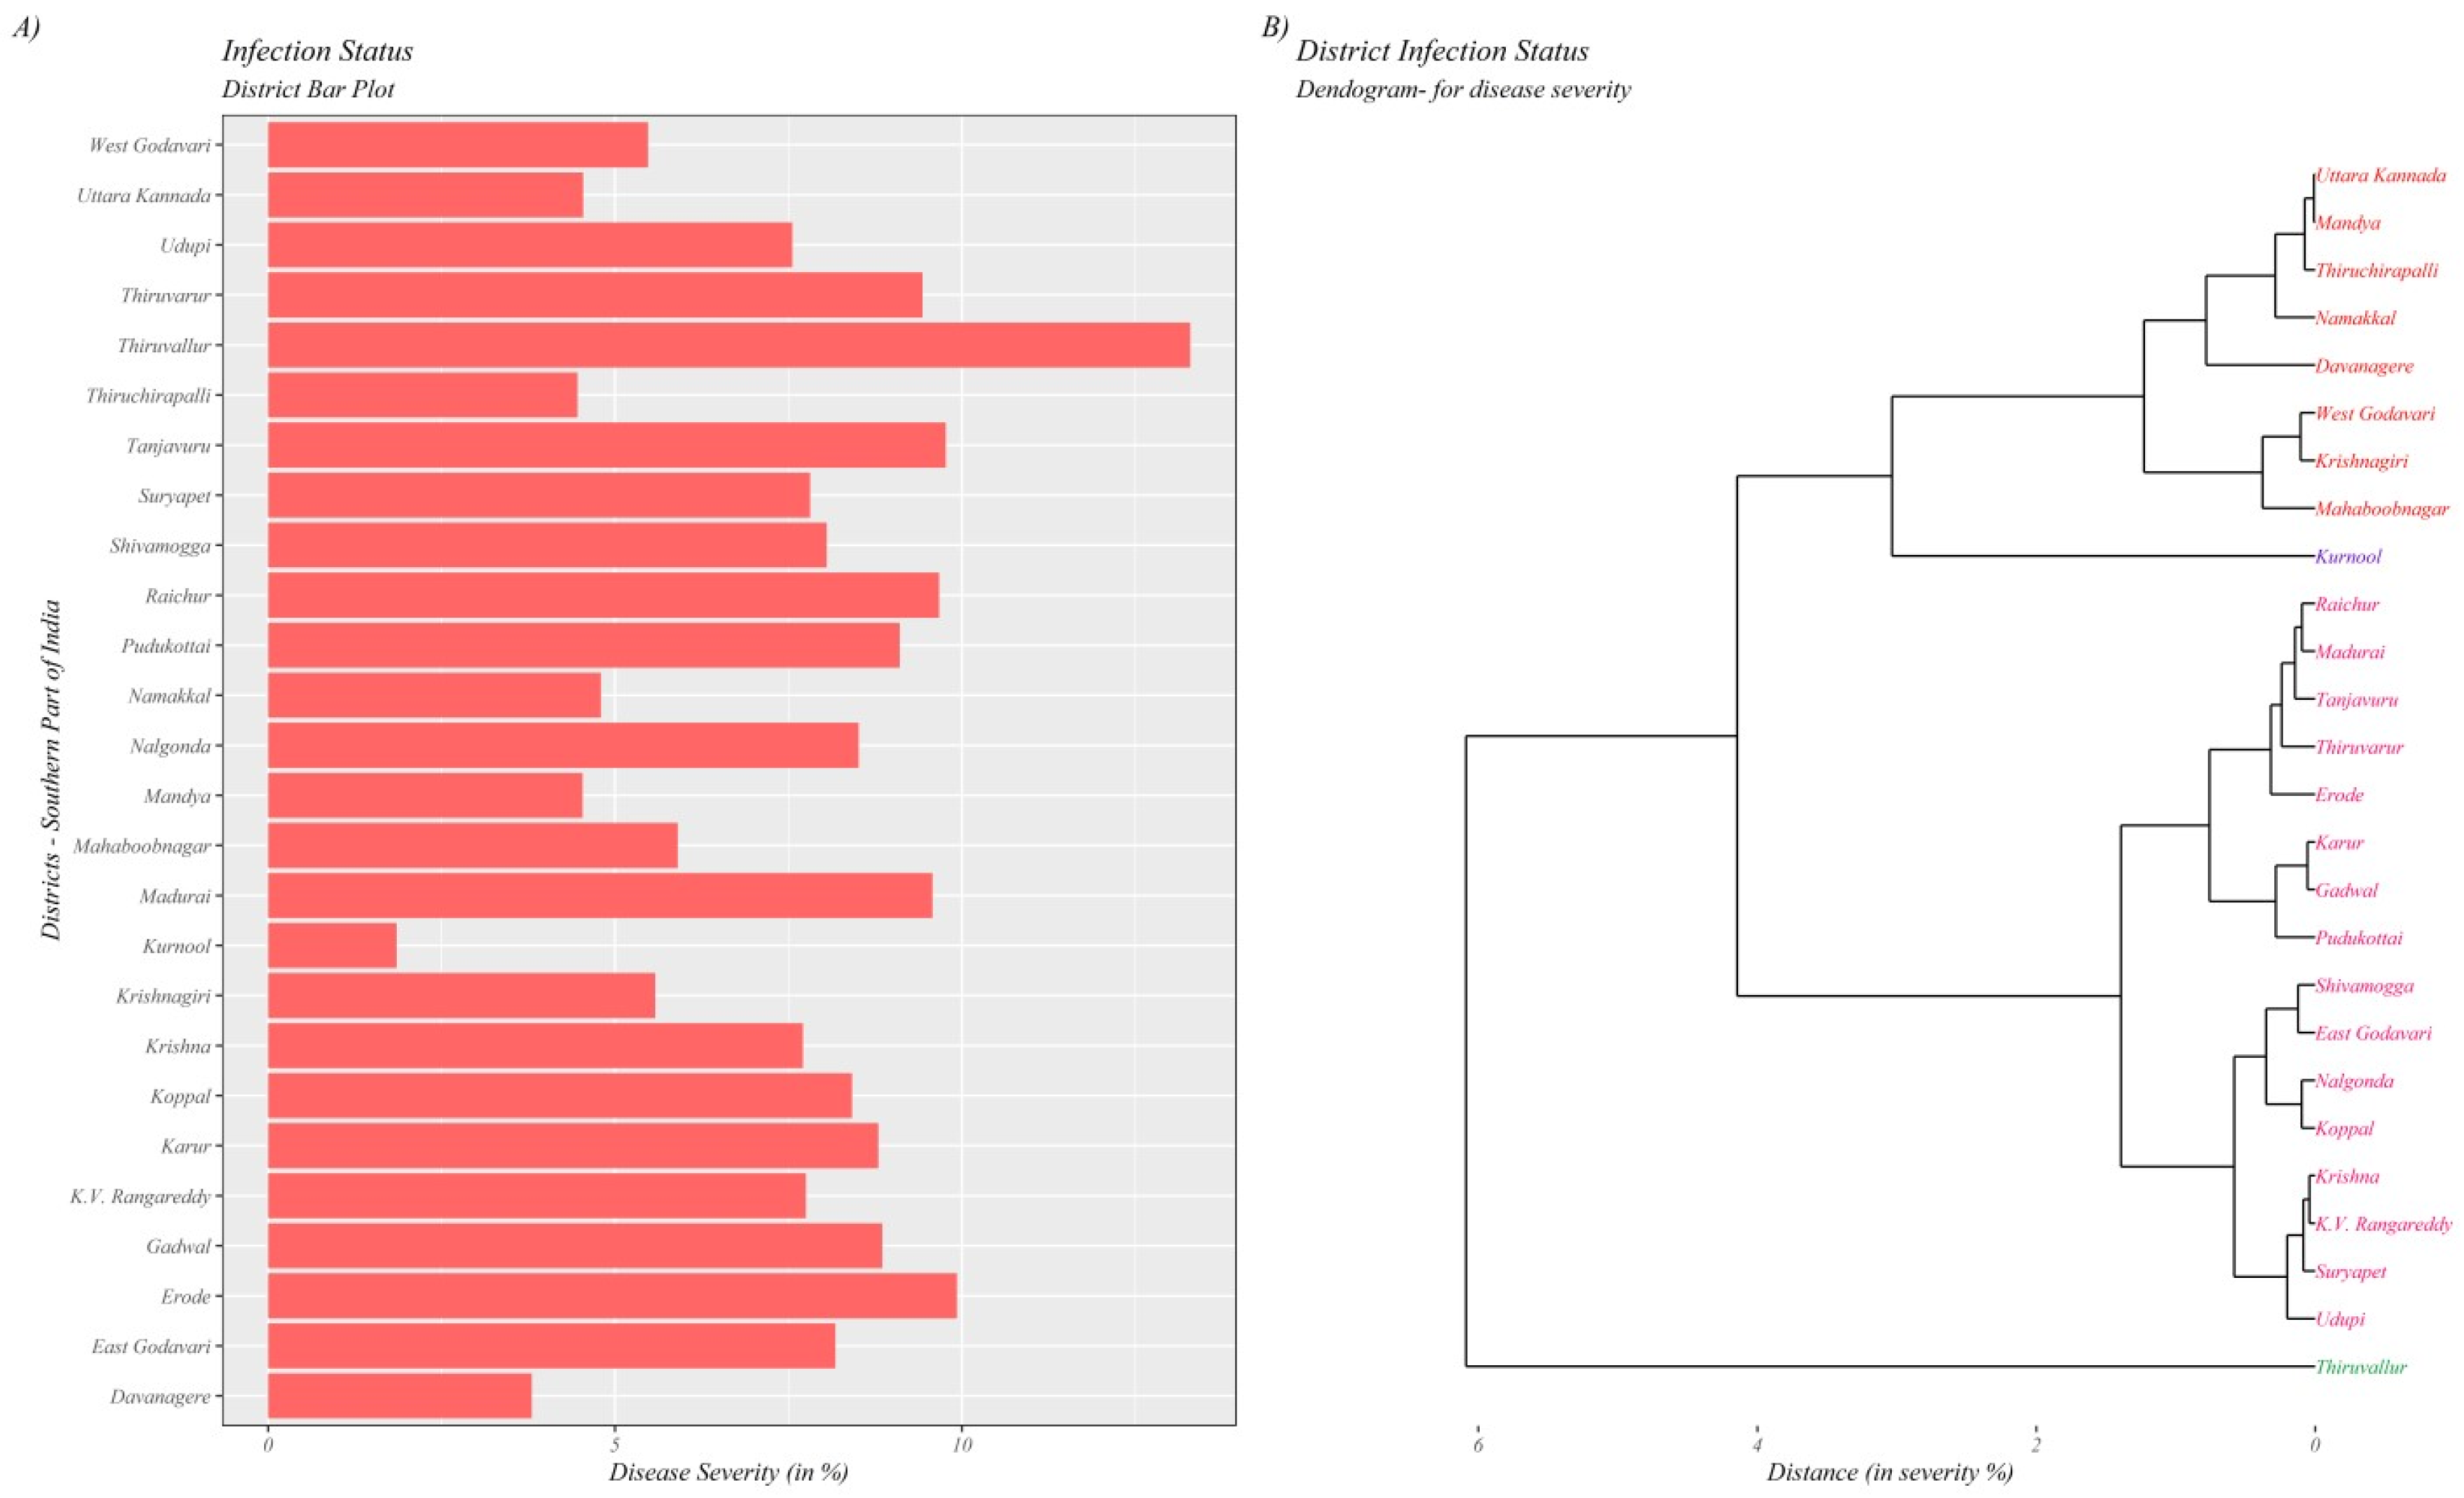
3.1. FSD Severity across the Studied Areas of South India

Significant variation in FSD severity was observed among the studied areas, and FSD occurrence was noticed in all the sampled locations. Among the studied ecosystems, the Pillallamarri lake ecosystem of Telangana recorded the highest disease severity (14.55%), followed by the Coastal ecosystem of Tamil Nadu (10.22%), and the least FSD was observed in the Thunga-Badhra ecosystem of Andhra Pradesh (1.85%) (Figure 2).
Among the different surveyed villages, Konamoolai village of Sathyamangalam taluk of Erode district (32.96 %) of Tamil Nadu witnessed the highest FSD severity, followed by Bheemaneri village of Sagara taluk of Shivamogga district (17.31%) of Karnataka. The FSD severity during 2018 revealed considerable variation among the evaluated districts, with the highest FSD severity observed in the Thiruvallur district of Tamil Nadu, followed by the Madurai and Erode districts of Tamil Nadu and Raichur districts of Karnataka. Among the studied districts, the Kurnool districts of Andhra Pradesh presented the lowest severity of FSD (Figure 3A).
The agglomerative hierarchical cluster analysis of the FSD severity among the 26 surveyed districts identified two main clusters using the average linkage method. The first cluster includes 25 districts, which are further divided into two subclusters consisting of 9 (Uttara Kannada, Mandya, Thiruchirapalli, Namakkal, Davanagere, West Godavari, Krishnagiri, Mahaboobnagar, and Kurnool) and 16 districts (Raichur, Madhurai, Tanjavuru, Erode, Karur, Gadwal, Pudukottai, Shivamogga, East Godavari, Nalgonda, Koppal, Krishna, K.V. Ramareddy, Suryapet, and Udupi). Similarly, the second cluster consists of only one district (Thiruvallur) (Figure 3B).

3.2. Spatial Point Patterns of FSD in Southern India

The local Moran’s I spatial autocorrelation (LISA) analysis identified different patterns of FSD at the district and taluk level, representing random, dispersed, and aggregated clusters of severity surrounded by other areas (Figure 4). Higher spatially dependent clusters were confirmed in Mahbubnagar, while most districts exhibited medium to lower spatial clusters, as evidenced by the LISA.
Considering the significance of p-values, the highest spatial dependence was observed in Andhra Pradesh districts such as Nalgonda, West Godavari, Krishna, East Godavari, and Erode districts of Tamil Nadu. Contrastingly, the Namakkal districts of Tamil Nadu showed medium spatial rates of dependency (non-significant). In comparison, the lowest was observed in Udupi, followed by the Koppal district of Karnataka. Considering the p-values (p < 0.05), all of the studied districts showed moderate spatial dependence (p < 0.05), indicating statistically insignificant clusters with randomness across most areas. LISA analyses revealed that non-traditional/sparse paddy growing areas presented a dispersed pattern of FSD on paddy cultivating ecosystems, while the traditional tracts exhibited a significantly clustered pattern with an increased amount of FSD, indicating the potential spread of the disease to traditional paddy cultivating areas.
To demonstrate the exact spatial point patterns of FSD, we further analyzed Ripley’s K function (Figure 5), which characterized the patterns by computing the average number of neighboring features associated with each feature at specific distances. The red line in Ripley’s K function plots denotes translation correction, whereas the blue line represents theoretical Poisson fitted data (expected), while the black line represents the observed data and shows the degree of point process clustering for different distance classes Regarding the appearance of infection, all distances (in degrees) displayed significant positive values, indicating that the observed disease patterns were moderately clustered among the studied areas.
The point pattern analysis of FSD through LISA and Ripley’s K function suggested the presence of significant hotspots in the Cauvery Belt, Bhavani Sagara Belt (BSB) ecosystems of Tamil Nadu, East Godavari ecosystem of Andhra Pradesh, Transplanted ecosystems of TBP and UKP command ecosystem of Karnataka, Coastal parts (seashore), including non-traditional paddy cultivating areas.

3.3. Spatial Distribution of FSD

3.3.1. IDW Surface Interpolation

Inverse distance weighted (IDW) interpolation identified the cell values using a linearly weighted combination of sample points. A complete enumeration of discrete observations represented the point data. The outcome of the IDW interpolation was depicted through color-coded maps of datasets (Figure 6), with darker colors (red) portraying higher percent severity rates of FSD. The interpolated surface areas of FSD differed considerably, indicating that the disease occurrence was inconsistent across the locations.
During the evaluation, transplanted ecosystems of TBP and UKP had the highest disease severity and posed a potential risk to FSD with higher disease proportions (20%), with focal points at Koppal, Raichur. West Godavari and East Godavari districts are followed by Cauveri and Bhavani Sagara Belt (BSB) ecosystems with 14–15 percent severity, indicating them as hotspots for FSD. Pillalamari lake, Munneru, and Irrigated Cauvery ecosystems were less disease-prone areas for FSD with relatively reduced disease indices (0–3%), making them cold spots. It is evident from the maps that the disease hot spots are majorly in the Tamil Nadu state and a few traditional paddy-growing ecosystems of Northern Karnataka.
The IDW results were further validated by a scatter plot for predicted severity against observed severity (Figure 7). From the plot, the predicted and observed severity lies apart from the line, excluding the errors during both years. The plot values representing the FSD during 2018 exhibited a similar severity with RMSE values of 6.6.

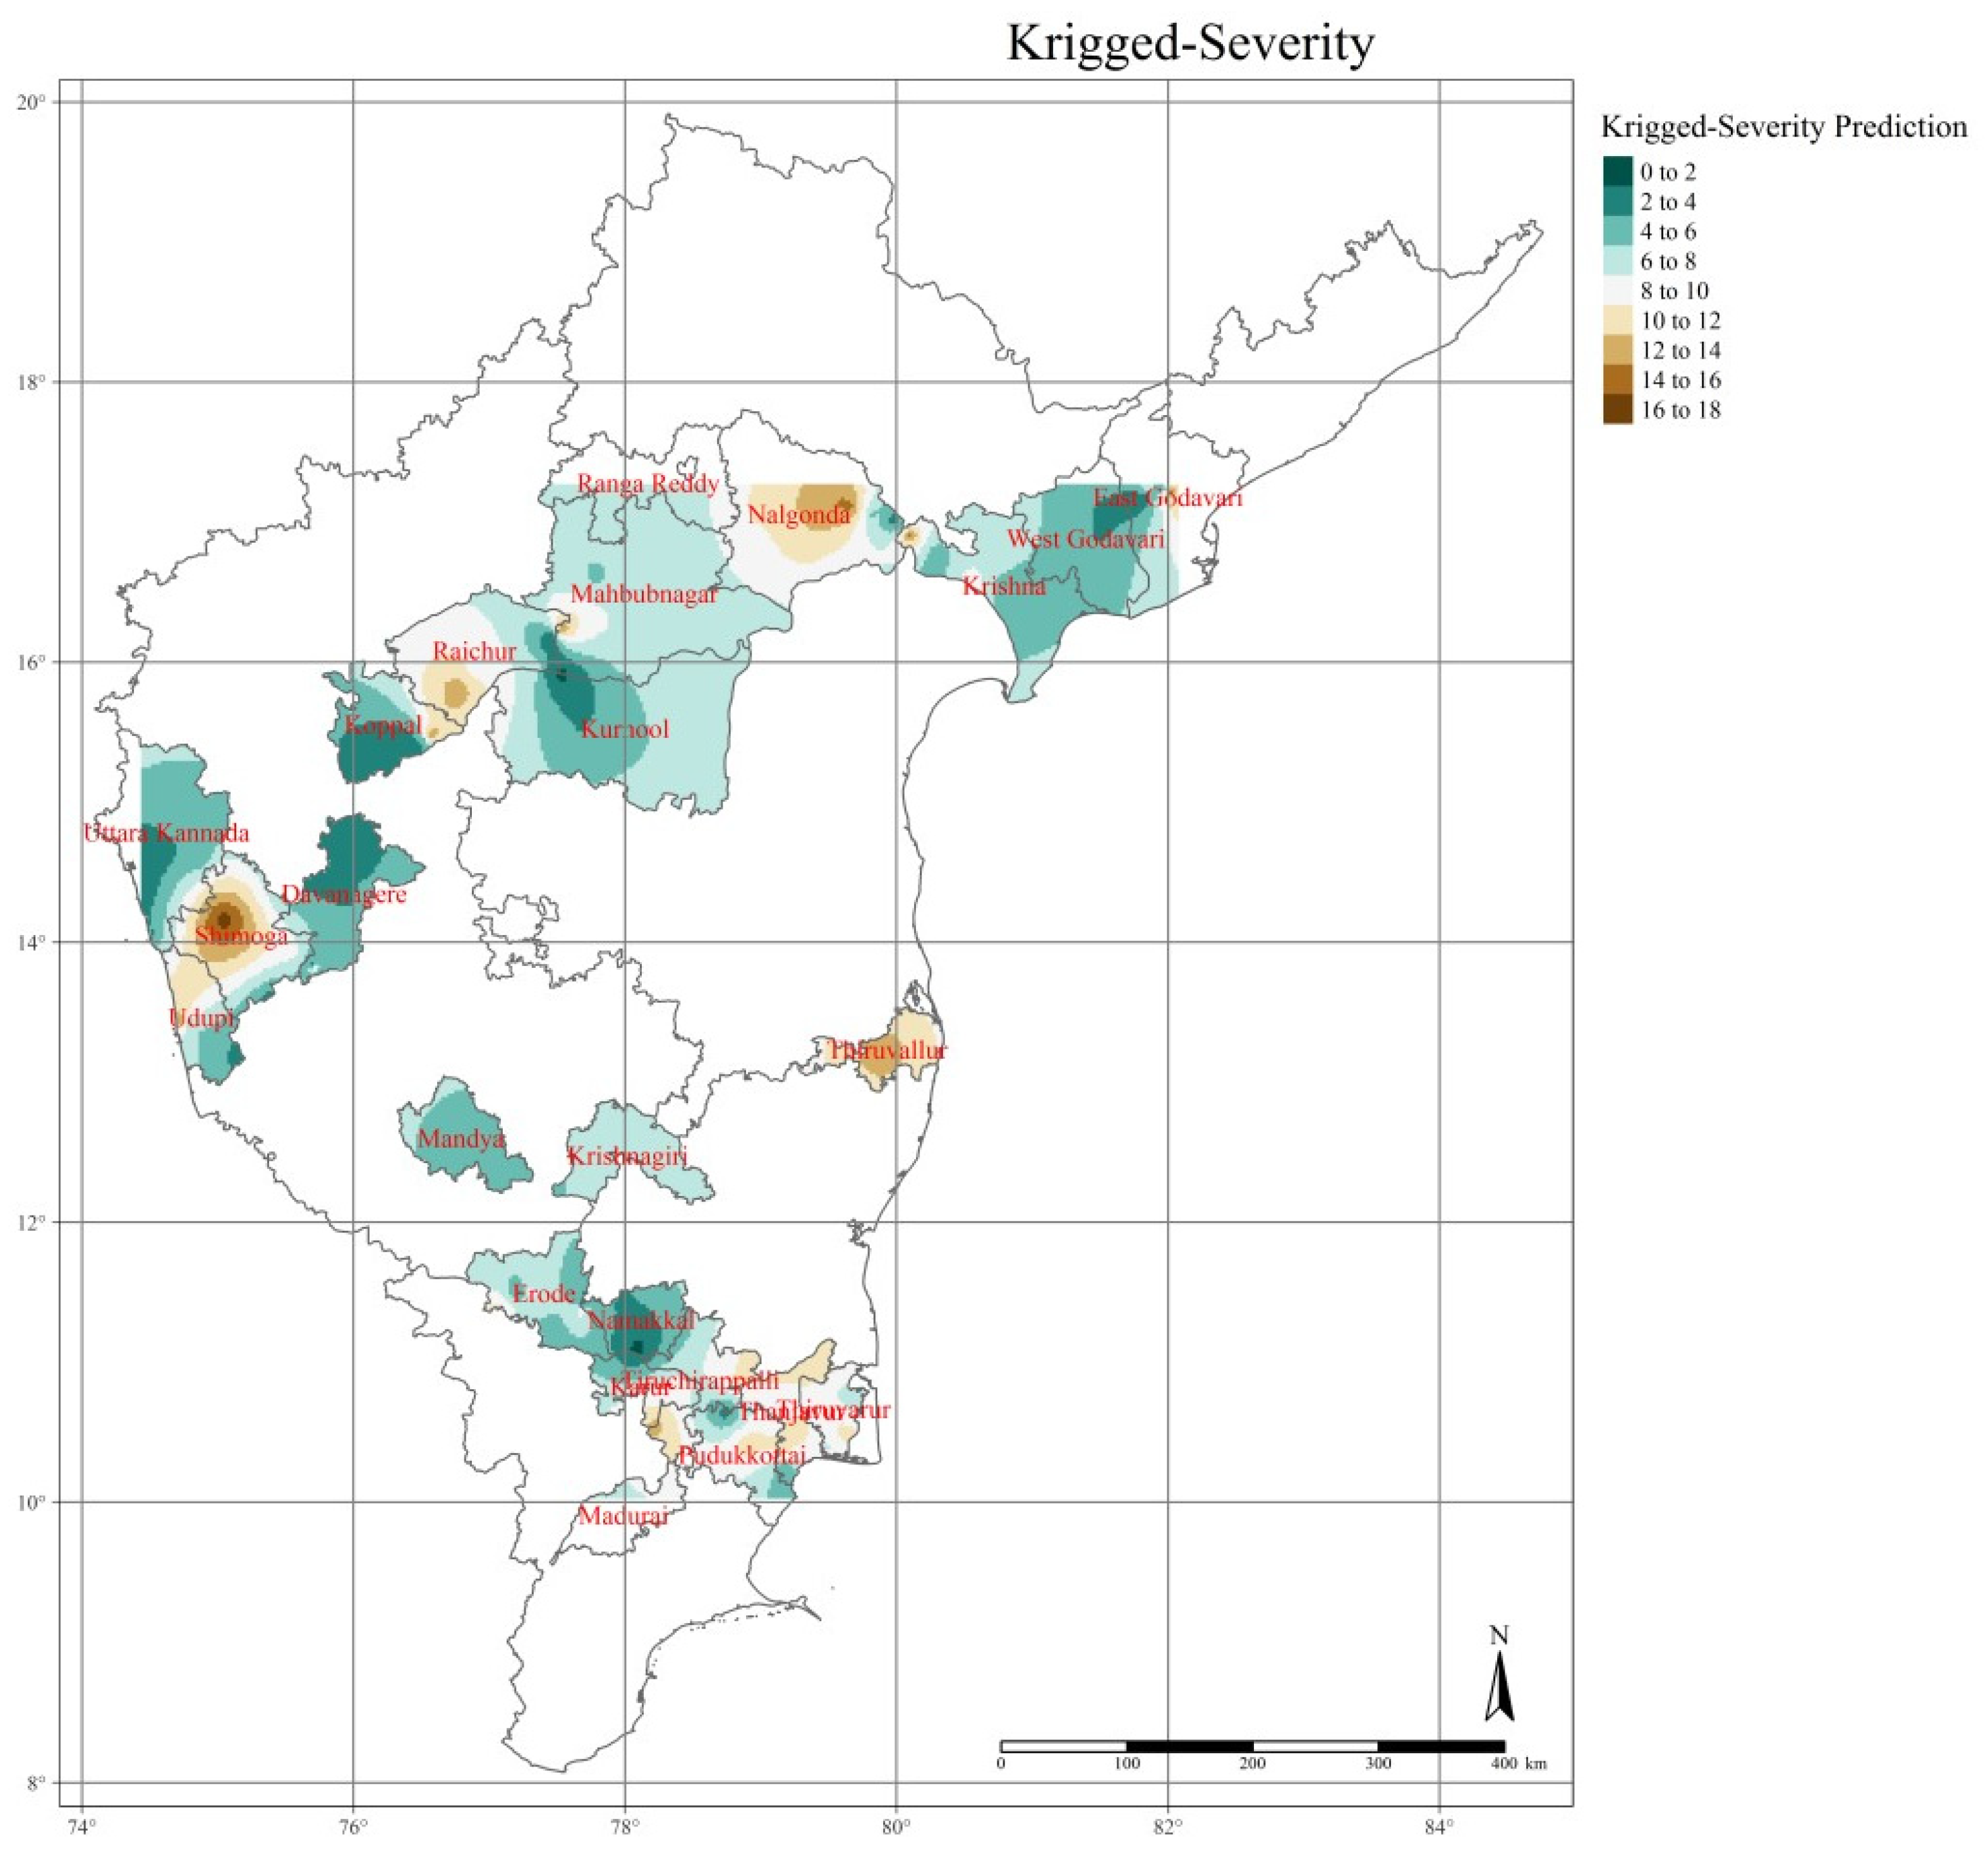
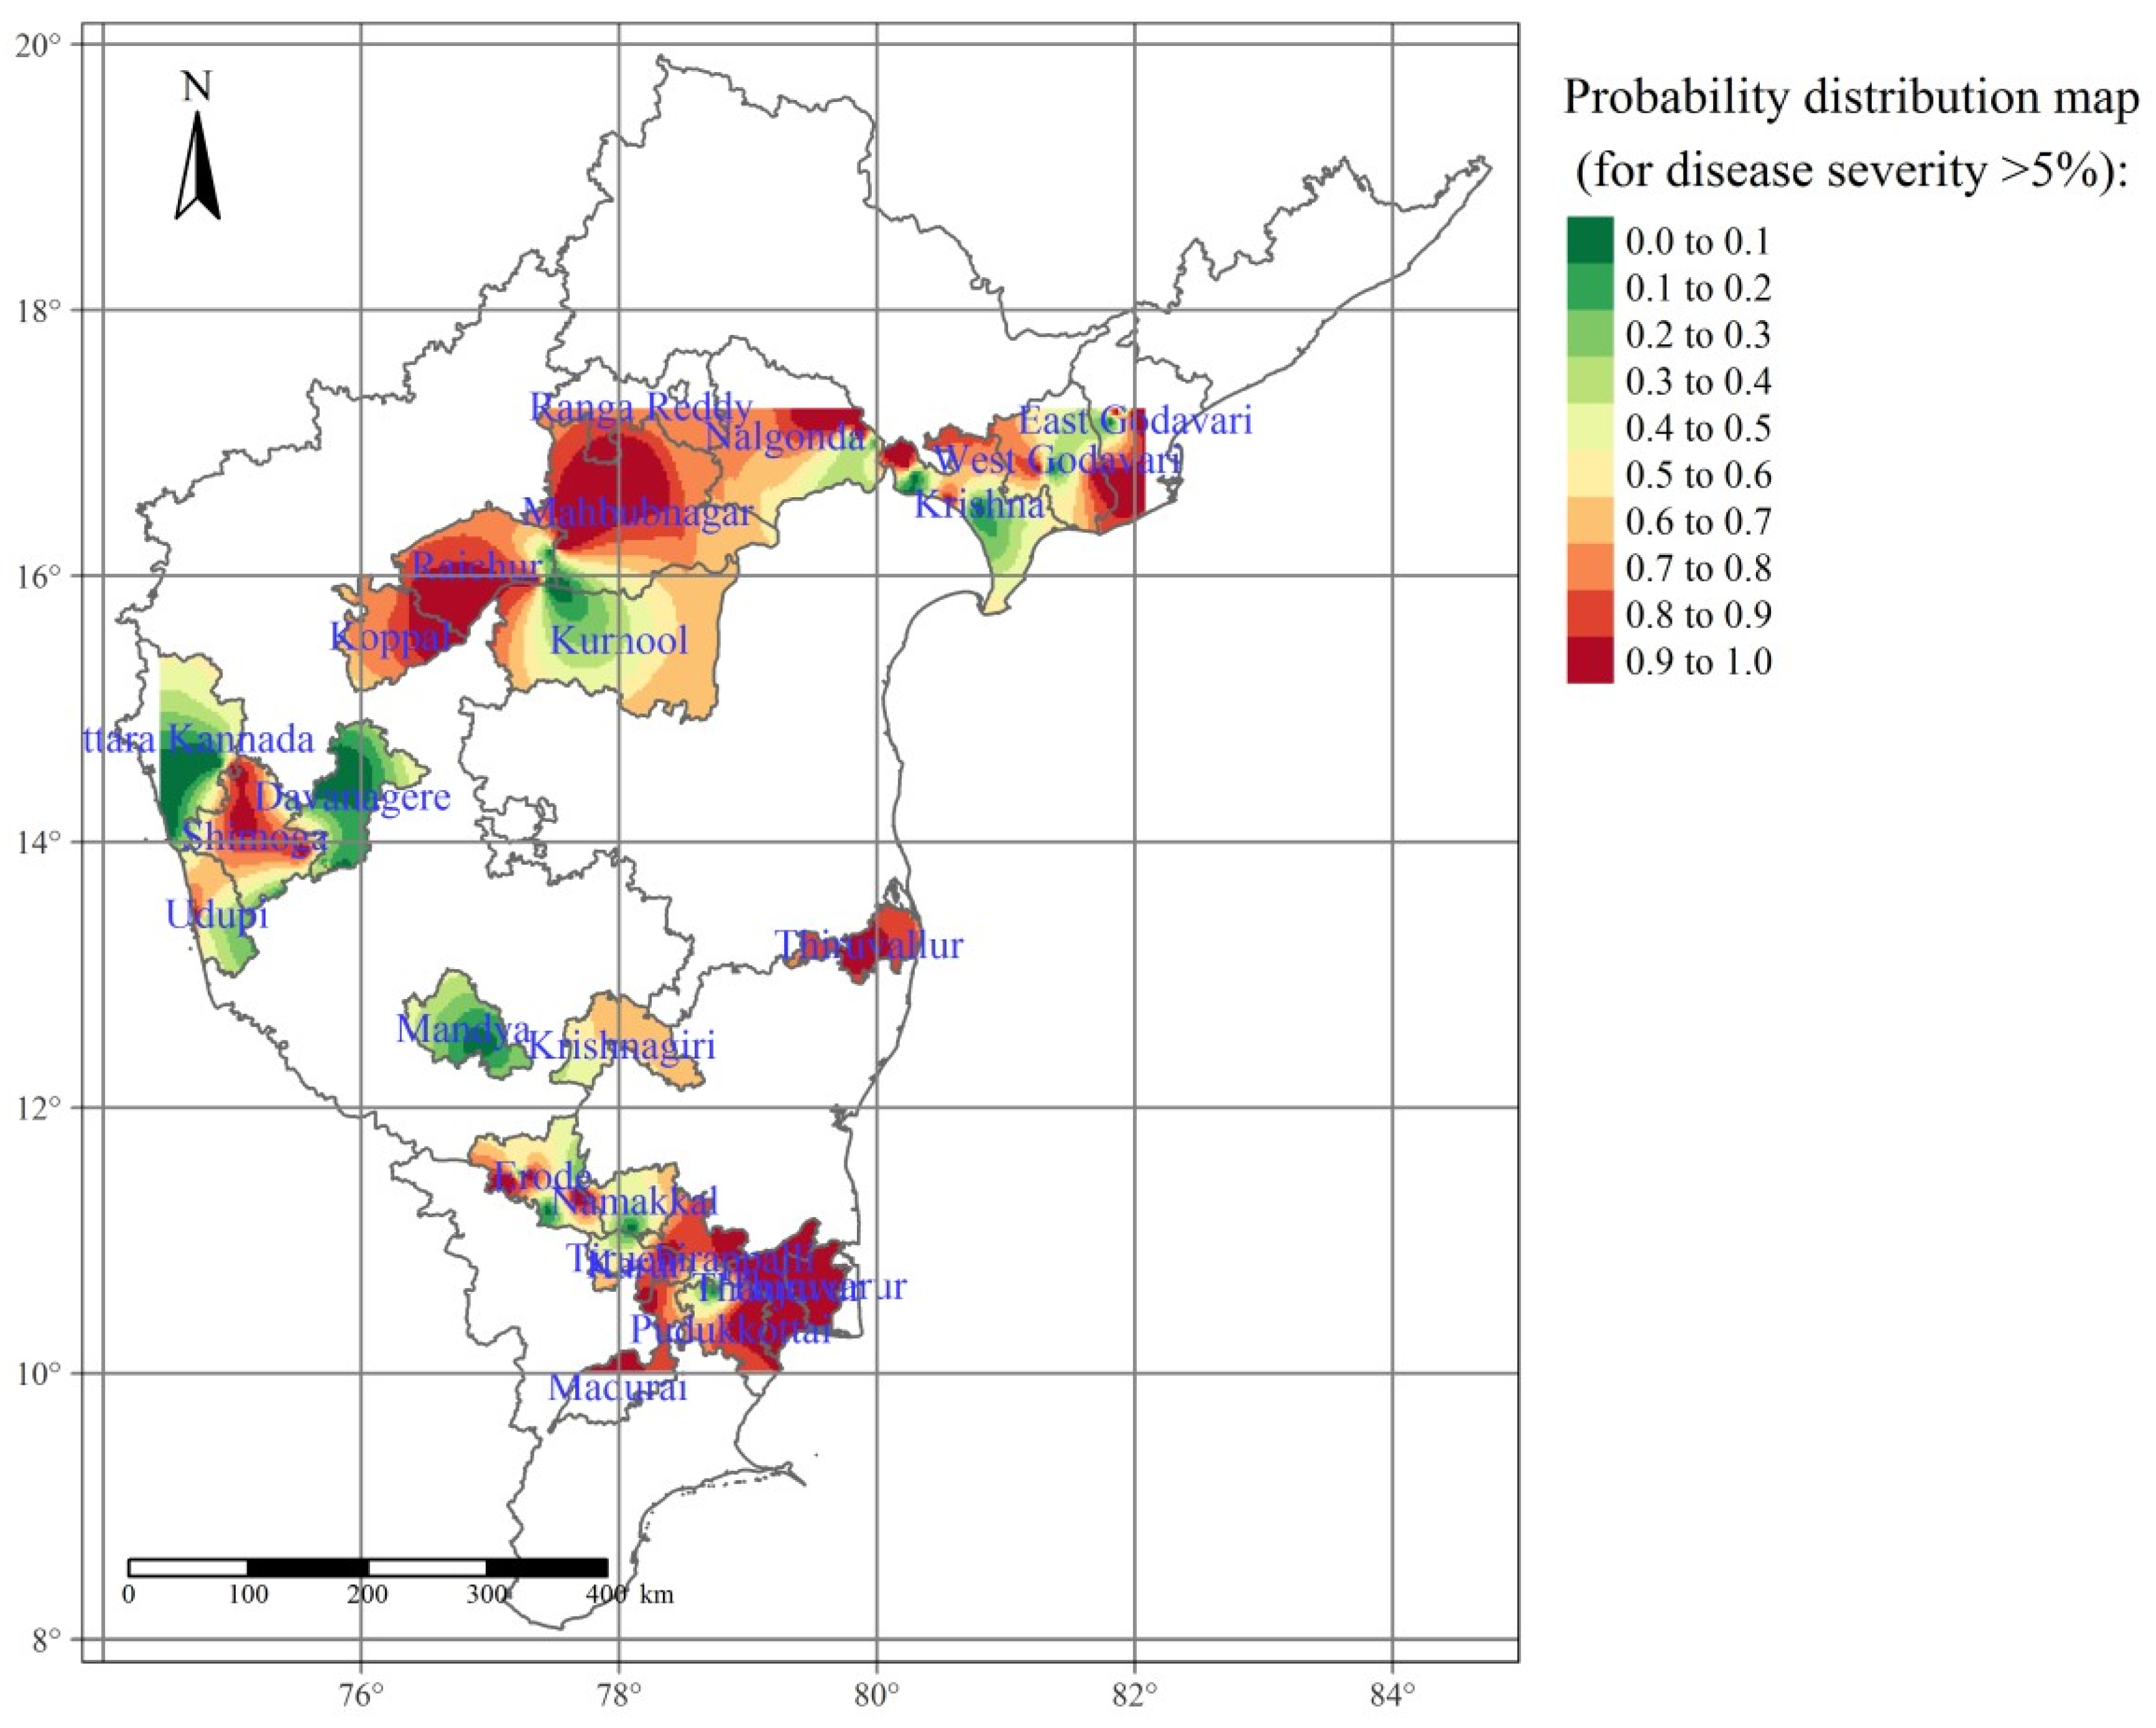
3.3.2. Ordinary and Indicator Kriging

Semivariogram experimental models, such as spherical, exponential, and Gaussian models, were used to determine spatial patterns of FSD severity. Based on validation of the semivariogram results that exhibited lower mean square error (MSE), root mean square standard error (RMSE), and average standard error (ASE) values, the spherical model was found to be the best fit (Table 2 and Figure 8).
FSD severity in different rice ecosystems of southern India during 2018 followed a normal distribution, as revealed by the Kolmogorov–Smirnov test, which was depicted through histograms and a normal QQ plot of the dataset (Figure 9). Before kriging and interpolation, a slight global trend in the data was removed using the first-order nominal trend removal function.
As with the IDW interpolation technique, ordinary kriging (OK) and indicator kriging (IK) were used to find the spatial surface areas of FSD in different rice ecosystems by considering the severity observations. The OK map revealed the maximum severity of FSD in the Shimoga district of the Irrigated Bhadra ecosystem, Nalgonda district of the Krishna River ecosystem, Thiruvallur district of the Cauvery ecosystem, and Raichur district of Transplanted ecosystems of TBP and UKP command ecosystem (Figure 10).
However, in the case of IK, the FSD was more severely distributed in the Transplanted ecosystems of TBP and UKP command (Koppal, Raichur), Irrigated Bhadra (Shimoga), and Coastal ecosystem (Udupi) of Karnataka; East Godavari district of Andhra Pradesh; Cauvery ecosystem (Thiruvallur, Madurai), BSB ecosystems (Erode), Cauvery Belt and Coastal Belt ecosystems of Tamil Nadu state (Thirichinapalli, Thanjavur, Padukottai) and districts of Telangana State with highest disease severity was noticed in Krishna river ecosystems (Mahabubnagar, Nalgonda). Medium disease severity was recorded in Bhavani Sagara Belt (BSB) ecosystems (Namakkal) and parts of the Cauvery River ecosystems (Krishnagiri) (Figure 11). Districts of Cauvery (Mysore, Mandya), Bhadra (Davangere, Uttara Kannada), Krishna (Krishna), Parts of Palleru lake (Nalgonda), Thunga-Badhra ecosystems of Kurnool exhibited less severity of FSD.

4. Discussion

False smut disease (FSD) of rice is one of the threats to rice production across the globe. The build-up of inoculum and prevailing environmental situations under field conditions favors the rapid spread of the FSD. Thus, understanding the spatial distribution of FSD across the major rice-growing states of India is highly imperative. The present investigation revealed the current status of FSD in the different rice-growing ecosystems of southern India, including Andhra Pradesh, Karnataka, Telangana, and Tamil Nadu states. The extension of rice cultivars to non-traditional paddy cultivating areas has posed the potential risk of FSD over a time, resulting in predominant yield loss. In this context, it was necessary to understand the spatial distribution of FSD in different traditional and non-traditional rice ecosystems of southern India. Although the disease status of FSD in southern states was studied in the past, ecosystem-wise information is lacking [3,9,37]. In the present investigation, for the first time in India, the current status and spatial distribution of FSD were identified using geostatistical approaches such as spatial interpolation, autocorrelation, point pattern, and variogram analysis.
The agglomerative hierarchical cluster analysis of FSD patterns among the 26 monitored districts identified two main clusters using the average linkage method. The first cluster includes 25 districts, further divided into subclusters consisting of 9 and 16 districts. Similarly, the second cluster consists of only one district (Thiruvallur) with the highest FSD severity. Severe FSD in the Dindugal, Madurai, Theni, and Tirunelveli districts of Tamil Nadu was also reported previously [9]. The present study identified moderate spatial clusters of FSD by the Local Moran’s I spatial autocorrelation (LISA). Higher spatially dependent clusters were confirmed in Mahbubnagar compared to other districts that were least spatially dependent, as evidenced by Ripley’s K function. U. virens produces thick-walled chlamydospores during the disease cycle, which reserves disease propagules under field conditions. These spores contaminate rice seeds and are spread by rain splash, air currents, and overwinter in the field [38], causing severe disease in the next crop.
The conidia and ascospores of FSD were dispersed by air currents and act as significant determinants of the spread and severity of the FSD along with changing climate. The clustering of points in a different ecosystem might be credited to the faster movement of the spores of the pathogen through air and irrigation water and the cultivation of susceptible cultivars all along the southern paddy ecosystems [14].
Point pattern analysis was used to identify the hotspots of FSD in different rice ecosystems of southern India. Results from the analysis, the hot spots were identified in the Hilly ecosystem consisting of Chikmagalur, Shivamogga, Kodagu, and Dharwad districts. These spots need the extensive management strategy of FSD since the disease is known to affect >70 percent of these areas. These areas with high rainfall are congenial for FSD pathogens to proliferate and invade as these conditions of high humidity and rainfall induce the germination of chlamydospores producing the hyphae, thereby leading to the production of a large number of secondary conidia that infect the flowers of rice at late booting stage [38].
In the present study, the percent severity of FSD was considered to generate the spatial distribution maps across the studied areas of South India. Similarly, the data were generated at unsampled points using the surface interpolation tools such as inverse distance weighting (IDW), ordinary kriging (OK), and indicator kriging (IK). The FSD semivariogram indicated relatively moderate spatial dependency. IDW is simple and quick; however, kriging is complex and time-consuming but provides the best linear unbiased estimates [39]. Based on the generated spatial clusters in the interpolation tools, the kriging is more accurate than IDW.
The possible reason for the spatial pattern of FSD is the dispersal of the pathogen through the air and the distribution of susceptible/resistant plant cultivars [40]. Terrain affects microclimate and probably acts as another reason for the differential distribution of pathogens over space [38]. The pathogen also produces sclerotial, which is induced by the low temperatures [41], and the sclerotia tend to increase in autumn in the years with low temperatures. The sclerotia will be dormant for 2–5 months in the field, and under low temperatures, they maintain a higher germination rate even up to 5 years, posing a long-term threat to the crop [40].
LISA analyses revealed non-traditional/sparse paddy growing areas presented a dispersed pattern of FSD on paddy cultivating ecosystems than in traditional tracts. The local Moran’s I spatial autocorrelation (LISA) cluster analyses identified higher spatially dependent clusters in Mahbubnagar, while the major districts presented lower spatial autocorrelation clusters. Considering the p-values, the highest spatial dependence was observed in Andhra Pradesh districts such as Nalgonda, West Godavari, Krishna, East Godavari, and Erode district of Tamil Nadu, whereas the lowest was observed in Udupi, followed by Koppal district of Karnataka indicating the higher disease prone areas in the eastern part of South India.
Surface interpolation approaches are used to unravel the spatial distribution of FSD in South India. The outcome of the IDW interpolation was depicted through color-coded maps of datasets. During the evaluation, transplanted ecosystems of TBP and UKP had the highest disease severity (14–15%), followed by Cauvery and Bhavani Sagara Belt (BSB) ecosystems, and were considered hotspots for FSD. Pillalamari lake, Munneru, and Irrigated Cauvery ecosystems are cold spots with less disease severity (0–3%). The dOrdnary kriging (OK) map revealed the maximum severity of FSD in Shimoga district, Nalgonda, Thiruvallur district, and Raichur district. However, in the case of IK (indicator kriging), the FSD was more severely distributed during 2018 around the transplanted ecosystems of TBP and UKP command (Koppal, Raichur), Irrigated Bhadra (Shimoga), and coastal ecosystem (Udupi) of Karnataka. East Godavari district of Andhra Pradesh. Cauvery ecosystem (Thiruvallur, Madurai), Bhavani Sagara Belt (BSB) ecosystems (Erode), Cauvery Belt and Coastal Belt ecosystems of Tamil Nadu state (Thirichinapalli, Thanjavur, Padukottai) and districts of Telangana State with highest disease severity was noticed in Krishna River ecosystems (Mahabubnagar, Nalgonda). Districts of Cauvery (Mysore, Mandya), Bhadra (Davangere, Uttara Kannada), Krishna ecosystems (Krishna), Parts of Palleru lake ecosystems (Nalgonda), Thunga-Badhra ecosystems of Kurnool exhibited less severity of FSD. Results from OK and IK indicated that irrigated ecosystems comprising Transplanted ecosystems of TBP and UKP command, Irrigated Bhadra, Coastal ecosystem, Godavari, Bhavani Sagara Belt (BSB), and Cauvery Belt had shown potential risk areas to FSD.

5. Conclusions

The present work demonstrated the clustering of FSD, which has significant implications for managing the disease. Understanding the patterns of aggregation of FSD provides an opportunity to help the farmers and scientists focus on the hot spots and thereby reduce unwanted expenses in the management of the FSD. The site-specific management of FSD increases the efficiency of disease management and helps to design the disease management strategy for different rice ecosystems of southern India.

Author Contributions

Study designing: S.H. and D.P.; collecting the data: A.C., E.C., C.M., B.P., S.S. (Sandip Shil), M.K.P., H.D.P., A.R. and I.U.; analysis: A.C., B.P., S.S. (Sandip Shil), M.K.P., H.D.P. and A.R.; drafting: S.H., S.S. (Sandip Shil), D.P. and A.C.; reviewing: D.P., S.S. (Shankarappa Sridhara), M.K.P., S.K.B., R.R.S. and H.D.P.; fund acquisition: D.P. All authors have read and agreed to the published version of the manuscript.

Funding

This project was funded by the Early Career Research (ECR) Grant (Project Number: ECR/2017/000246) of the Science and Engineering Research Board (SERB), Government of India, to Pramesh D.

Institutional Review Board Statement

Not applicable.

Informed Consent Statement

Not applicable.

Data Availability Statement

Not applicable.

Acknowledgments

The authors are thankful to the Director of Research, UAS Raichur for providing the research facilities.

Conflicts of Interest

The authors declare that they have no conflict of interest.

References

  1. Padwick, G.W. Manual of Rice Diseases; CAB Press: London, UK, 1950. [Google Scholar]
  2. Dodan, D.S.; Singh, R. False smut of rice present status. Agric. Res. 1996, 17, 227–240. [Google Scholar]
  3. Muniraju, K.M.; Pramesh, D.; Mallesh, S.B.; Mallikarjun, K.; Guruprasad, G.S. Disease severity and yield losses caused by false smut disease of rice in different rice ecosystems of Karnataka. Int. J. Microbiol. Res. 2017, 9, 955–958. [Google Scholar]
  4. Wang, W.M.; Fan, J.; Jeyakumar, J.M.J. Rice false smut: An increasing threat to grain yield and quality. In Protecting Rice Grains in the Post-Genomic Era; IntechOpen: Rijeka, Croatia, 2019. [Google Scholar] [CrossRef] [Green Version]
  5. Pramesh, D.; Prasannakumar, M.K.; Muniraju, K.M.; Mahesh, H.B.; Pushpa, H.D.; Manjunatha, C.; Saddamhusen, A.; Chidanandappa, E.; Yadav, M.K.; Kumara, M.K.; et al. Comparative genomics of rice false smut fungi Ustilaginoidea virens Uv-Gvt strain from India reveals genetic diversity and phylogenetic divergence. 3 Biotech 2020, 10, 342. [Google Scholar] [CrossRef] [PubMed]
  6. Cooke, M.C. Some extra-European fungi. Grevillea 1878, 7, 13–15. [Google Scholar]
  7. Singh, R.A.; Dube, K.S. Assessment of loss in seven rice cultivars due to false smut. Indian Phytopathol. 1978, 31, 186–188. [Google Scholar]
  8. Biswas, A. Field reaction of hybrid rice varieties to false smut and kernel smut disease in West Bengal India. Environ. Econ. 2001, 19, 229–230. [Google Scholar]
  9. Ladhalakshmi, D.; Laha, G.; Singh, R.; Karthikeyan, A.; Mangrauthia, S.; Sundaram, R.; Thukkaiyannan, P.; Viraktamath, B. Isolation and characterization of Ustilaginoidea virens and survey of false smut disease of rice in India. Phytoparasitica 2012, 40, 171. [Google Scholar] [CrossRef]
  10. Kumari, S.; Kumar, J. Evaluation of yield losses and management practices of false smut in rice (Oryza sativa). Indian Phytopathol. 2015, 68, 45–49. [Google Scholar]
  11. Amoghavarsha, C.; Pramesh, D.; Naik, G.R.; Naik, M.K.; Yadav, M.K.; Ngangkham, U.; Chidanandappa, E.; Raghunandana, A.; Sharanabasav, H.; Manjunatha, S.E. Morpho-molecular diversity and avirulence genes distribution among the diverse isolates of Magnaporthe oryzae from Southern India. J. Appl. Microbiol. 2022, 132, 1275–1289. [Google Scholar] [CrossRef]
  12. Guo, F.; Chen, X.; Lu, M.; Yang, L.; Wang, S.; Wu, B.M. Spatial analysis of rice blast in China at three different scales. Phytopathology 2018, 108, 1276–1286. [Google Scholar] [CrossRef] [Green Version]
  13. Turechek, W.W.; Mc Roberts, N. Considerations of scale in the analysis of spatial pattern of plant disease epidemics. Annu. Rev. Phytopathol. 2013, 51, 453–472. [Google Scholar] [CrossRef] [PubMed]
  14. Sharanabasav, H.; Pramesh, D.; Chidanandappa, E.; Saddamhusen, A.; Chittaragi, A.; Raghunandana, A.; Kumar, M.P.; Raghavendra, B.T.; Naik, R.H.; Mallesh, S.B.; et al. Field evaluation of fungicides against false smut disease of rice. J. Pharm. Phytochem. 2020, 9, 1453–1456. [Google Scholar] [CrossRef]
  15. Subbarao, N.V.; Mani, J.K.; Shrivastava, A.; Srinivas, K.; Varghese, A.O. Acreage estimation of kharif rice crop using Sentinel-1 temporal SAR data. Spat. Inf. Res. 2021, 29, 495–505. [Google Scholar] [CrossRef]
  16. Balanagouda, P.; Sridhara, S.; Shil, S.; Hegde, V.; Naik, M.K.; Narayanaswamy, H.; Balasundram, S.K. Assessment of the spatial distribution and risk associated with fruit rot disease in Areca catechu L. J. Fungi 2021, 7, 797. [Google Scholar] [CrossRef]
  17. Byamukama, E.; Eggenberger, S.K.; Coelho-Netto, R.A.; Robertson, A.E.; Nutter, F.W., Jr. Geospatial and temporal analyses of Bean pod mottle virus epidemics in soybean at three spatial scales. Phytopathology 2014, 104, 365–378. [Google Scholar] [CrossRef]
  18. Freitas, A.S.; Pozza, E.A.; Alves, M.C.; Coelho, G.; Rocha, H.S.; Pozza, A.A.A. Spatial distribution of yellow sigatoka leaf spot correlated with soil fertility and plant nutrition. Precis. Agric. 2016, 17, 93–107. [Google Scholar] [CrossRef]
  19. Savary, S.; Nelson, A.; Willocquet, L.; Pangga, I.; Aunario, J. Modeling and mapping potential epidemics of rice diseases globally. Crop Prot. 2012, 34, 6–17. [Google Scholar] [CrossRef]
  20. Yuen, J.; Mila, A. Landscape-scale disease risk quantification and prediction. Annu. Rev. Phytopathol. 2015, 53, 471–484. [Google Scholar] [CrossRef]
  21. Oro, Z.F.; Bonnot, F.; Ngo-Bieng, M.A.; Delaitre, E.; Dufour, P.B.; Ametefe, E.K.; Mississo, E.; Wegbe, K.; Muller, E.; Cilas, C. Spatiotemporal pattern analysis of cacao swollen shoot virus in experimental plots in Togo. Plant Pathol. 2012, 61, 1043–1051. [Google Scholar] [CrossRef]
  22. Viggiano, M.; Busetto, L.; Cimini, D.; Di Paola, F.; Geraldi, E.; Ranghetti, L.; Ricciardelli, E.; Romano, F. A new spatial modeling and interpolation approach for high-resolution temperature maps combining reanalysis data and ground measurements. Agric. For. Meteorol. 2019, 276, 107590. [Google Scholar] [CrossRef]
  23. Amoghavarsha, C.; Pramesh, D.; Sridhara, S.; Patil, B.; Shil, S.; Naik, G.R.; Naik, M.K.; Shokralla, S.; El-Sabrout, A.M.; Mahmoud, E.A.; et al. Spatial distribution and identification of potential risk regions to rice blast disease in different rice ecosystems of Karnataka. Sci. Rep. 2022, 12, 7403. [Google Scholar] [CrossRef]
  24. Sharanabasav, H.; Pramesh, D.; Prasannakumar, M.K.; Chidanandappa, E.; Yadav, M.K.; Ngangkham, U.; Parivallal, B.; Raghavendra, B.T.; Manjunatha, C.; Sharma, S.K.; et al. Morpho-molecular and mating-type locus diversity of Ustilaginoidea virens: An incitant of false smut of rice from Southern parts of India. J. Appl. Microbiol. 2021, 131, 2372–2386. [Google Scholar] [CrossRef]
  25. Alase, S.; Nagaraja, A.; Pramesh, D.; Prasanna Kumar, M.K. Influence of Weather Parameters on False Smut Disease Development in Rice. Mysore J. Agric. Sci. 2021, 55, 320–325. [Google Scholar]
  26. Mandhare, V.K.; Gawade, S.B.; Game, B.C.; Padule, D.N. Prevalence and incidence of bunt and false smut in paddy (Oryza sativa L.) seeds in Maharashtra. Agric. Sci. Digest 2008, 28, 292–294. [Google Scholar]
  27. Vannini, A.; Natili, G.; Anselmi, N.; Montaghi, A.; Vettraino, A.M. Distribution and gradient analysis of Ink disease in chestnut forests. For. Pathol. 2010, 40, 73–86. [Google Scholar] [CrossRef]
  28. R Core Team. A Language and Environment for Statistical Computing; R Foundation for Statistical Computing: Vienna, Austria, 2020. [Google Scholar]
  29. Kaufman, L.; Rousseeuw, P.J. Finding Groups in Data: An Introduction to Cluster Analysis; Wiley: New York, NY, USA, 2009. [Google Scholar]
  30. Reynolds, K.M.; Madden, L.V. Analysis of epidemics using spatio-temporal autocorrelation. Phytopathology 1988, 78, 240–246. [Google Scholar] [CrossRef]
  31. López-Granados, F.; Jurado-Expósito, M.; Atenciano, S.; García-Ferrer, A.; Sánchez de la Orden, M.; García-Torres, L. Spatial variability of agricultural soil parameters in southern Spain. Plant Soil. 2002, 246, 97–105. [Google Scholar] [CrossRef]
  32. Larkin, R.P.; Gumpertz, M.L.; Ristaino, J.B. Geostatistical analysis of Phytophthora epidemic development in commercial bell pepper fields. Phytopathology 1995, 85, 191–202. [Google Scholar] [CrossRef]
  33. Ristaino, J.B.; Gumpertz, M.L. New frontiers in the study of dispersal and spatial analysis of epidemics caused by species in the genus Phytophthora. Annu. Rev. Phytopathol. 2000, 38, 541–576. [Google Scholar] [CrossRef] [Green Version]
  34. Ten Hoopen, G.M.; Sounigo, O.; Babin, R.; Dikwe, G.; Cilas, C. Spatial and temporal analysis of a Phytophthora megakarya epidemic in a plantation in the Centre of Cameroon. In Proceedings of the 16th International Cacao Research Conference, Bali, Indonesia, 16–21 November 2009; pp. 16–21. [Google Scholar]
  35. Koch, F.H.; Smith, W.D. Spatio-temporal analysis of Xyleborus glabratus (Coleoptera: Circulionidae: Scolytinae) invasion in Eastern S forests. Environ. Entomol. 2008, 37, 442–452. [Google Scholar] [CrossRef]
  36. Peng, W.; Liu, Y.; Wu, N.; Sun, T.; Yan, X.; Xiang, G.Y.; Wu, W. Areca catechu L. (Arecaceae): A review of its traditional uses, botany, phytochemistry, pharmacology and toxicology. J. Ethnopharmacol. 2015, 164, 340–356. [Google Scholar] [CrossRef] [PubMed]
  37. Muniraju, K.M.; Pramesh, D.; Mallesh, S.B.; Mallikarjun, K.; Guruprasad, G.S. Novel Fungicides for the Management of False Smut Disease of Rice Caused by Ustilaginoidea virens. Int. J. Curr. Microbiol. Appl. Sci. 2017, 6, 2664–2669. [Google Scholar] [CrossRef]
  38. Sun, W.; Fan, J.; Fang, A.; Li, Y.; Tariqjaveed, M.; Li, D.; Hu, D.; Wang, W.M. Ustilaginoidea virens: Insights into an emerging rice pathogen. Annu. Rev. Phytopathol. 2020, 58, 363–385. [Google Scholar] [CrossRef]
  39. Gent, D.H.; Farnsworth, J.L.; Johnson, D.A. Spatial analysis and incidence density relationships for downy mildew on hop. Plant Pathol. 2011, 61, 37–47. [Google Scholar] [CrossRef]
  40. Yong, M.; Deng, Q.; Fan, L.; Miao, J.; Lai, C.; Chen, H.; Yang, X.; Wang, S.; Chen, F.; Jin, L.; et al. The role of Ustilaginoidea virens sclerotia in increasing incidence of rice false smut disease in the subtropical zone in China. Eur. J. Plant Pathol. 2018, 150, 669–677. [Google Scholar] [CrossRef]
  41. Fan, J.; Yang, J.; Wang, Y.Q.; Li, G.B.; Li, Y.; Huang, F.; Wang, W.M. Current understanding on Villosiclava virens, a unique flower-infecting fungus causing rice false smut disease. Mol. Plant Pathol. 2016, 17, 1321–1330. [Google Scholar] [CrossRef]
Figure 1. Featured map of India (A), South India (B), and selected districts from southern India. A total of 26 administrative districts of South India were considered to gather data on false smut. However, in the map, the district Mahbubnagar represents Mahbubnagar and Gadwal districts; similarly, the district Nalgonda represents Nalgonda and Suryapet as the district boundaries are not updated in the Shapefile. The area of different districts under study is shown (C). The maps were created using R software (version R-4.0.3).
Agronomy 12 02947 g001
Figure 2. Sampling sites and severity of false smut disease in different rice ecosystems of South India as indicated by a distribution map. However, in the map, the district Mahbubnagar represents Mahbubnagar and Gadwal districts; similarly, the district Nalgonda represents Nalgonda and Suryapet as the district boundaries are not updated in the Shapefile. The map was created using R software (version R-4.0.3).
Agronomy 12 02947 g002
Figure 3. (A) Bar diagram showing the infection status of the 26 districts of southern India, (B) Agglomerative hierarchical cluster analysis of FSD using the average linkage method identified four main clusters among 26 districts in southern India, India.
Agronomy 12 02947 g003
Figure 4. Local Moran’s I clusters across the studied areas of southern India, as inferred from p-values (<0.1), portray higher, medium, and lower spatial dependency rates.
Agronomy 12 02947 g004
Figure 5. Ripley’s K function values for different sampling sites show the explicit spatial patterns.
Agronomy 12 02947 g005
Figure 6. The optimized interpolated disease severity maps of FSD were generated using the inverse distance weighted (IDW) deterministic tool. Darker to lighter colors indicate higher to lower disease severity.
Agronomy 12 02947 g006
Figure 7. Scatter plot comparing predicted and observed values at the different sampled locations for FSD in southern India.
Agronomy 12 02947 g007
Figure 8. Semivariogram of different experimental models for rice blast disease severity during 2018. The colored lines depict the different models, such as spherical (purple), exponential (red), and Gaussian (green) models that depict the spatial autocorrelation of measured sample points. Blue dots indicate the observed values.
Agronomy 12 02947 g008
Figure 9. Histograms and normal QQ plots of FSD severity to understand the distribution of the dataset.
Agronomy 12 02947 g009
Figure 10. Ordinary kriging interpolated maps representing the spatial distribution of FSD in different rice ecosystems of southern India during 2018. Blue to brown coded surfaces depicts lower to higher disease severe points. The maps were created using R software (version R-4.0.3).
Agronomy 12 02947 g010
Figure 11. Rice false smut probability distribution map for southern India generated through semivariogram model information using indicator kriging. Green to red-colored points depicts lower to higher levels of risk-prone areas of FSD. The maps were created using R software (version R-4.0.3).
Agronomy 12 02947 g011
Table 1. Details of the different paddy ecosystems of South India surveyed in this study.
StateEcosystemDistrictsImportant Varieties
KarnatakaIrrigated BhadraShivamoggaKempu Jyothi, Jaya, Sona Mahsoori, Supriya Hybrid, Jyothi, BPT-5204, Sona Mahsoori
Davanagere
CoastalUdupiKempu Mukthi, Prateeksha, Mo-4 (Bhadra), Irga (318-11-6-9-2), BMR-US-1-24-2, Phalguna-2, Kaje Jaya, KCP-1, MTU-1001
MO-4, MO-4
Uttara Kannada
Transplanted ecosystems of TBP and UKP commandRaichurNandhyal Sona. Kavery Sona, Nellore Sona
BPT-5204, Nellur Sona, BPT-5204, Cauvery Sona, Sanna Batta, IRRI-236, GNV-05-01, Gangavathi Emergency, BPT-5204, GPB-133, IR-28, Gvt-10-89, Gangavathi Sanna, Gangavathi Sona, Sona Mahsoori, Kavery Sona
Koppal
Irrigated KaveriMandyaAmogh, Jyothi, Jaya, BR2655, Tanu, Intan, Rajamudi, MC 13, MTU 1010, IR-64, KRH-2 and KRH-4
Hilly UplandUttara KannadaMTU-1001, Jaya
Andhra PradeshGodavariWest GodavariBPT-5204, MTU-1064, PL, Godavari (MTU-1032), Swathi, Samba Sona, Arjal, MTU-1064, Arjal
East Godavari
Krishna riverKrishnaDeepthi (MTU-4870), Swarna (MTU-7029), Samba Mahsoori
Munneru riverKrishnaMTU-1064
Thunga-BadhraKurnoolRNR-15048, Nandyal Sona
Telangana StatePillallamarri LakeSuryapetVijetha (MTU-1001)
Krishna riverK.V.RangareddySriram Gold, Nellore Sona, Sriram Gold
Nandhyal Sona
Gadwal
Mahaboobnagar
Palleru lakeSuryapetVedagiri (IET 14328), RNR 15048, Telangana Sona, Samba Sona, BPT-5204, RNR 15048
Nalgonda
Tamil NaduBhavani Sagara Belt (BSB)ErodePonni, IR-20, NLR-34449, BPT-5204, Delux Ponni, White Ponni, Delux Ponni, Ponni, Andhra Ponni, Co-45, BPT-5204, Athur Samba, BPT-2628
Namakkal
Erode
Karur
Cauvery BeltThiruchirapalliDelux Ponni, Andhra Ponni, Vella Ponni, Co-39, IR-64, IR-64, Co-37, Ponni, CO-43, IR-64, PMK-2 (IET13971), ADT-44 (IET 14099), CO-37
Krishnagiri
Pudukottai
Madurai
Thanjavur
Thiruvallur
Thanjavur
Karur
Coastal BeltThiruvarurTKM (R) 12, Ponni, BPT-5204, White Ponni
ADT-39, CO-43, CR-1009 SUB 1, CO-47 (IET-14298)
Table 2. Cross-validation results of semivariogram experimental models on FSD disease severity during 2018.
ModelRange (in Degree)Partial Sill (C + C0)Nugget (C0)MSERMSEMAPE
Spherical1.13748117.613870.515.9523.9940.4677
Exponential1.13748117.613870.516.1214.01510.4815
Gaussian1.13748117.613870.5NANANA
MSE: mean square error; RMSE: root mean square standard error; MAPE: mean absolute percentage error.
Publisher’s Note: MDPI stays neutral with regard to jurisdictional claims in published maps and institutional affiliations.

