Article

Sugarcane Ratoon Yield and Soil Phosphorus Availability in Response to Enhanced Efficiency Phosphate Fertilizer

by
Clayton Luís Baravelli de Oliveira
1,*,
Juliana Bonfim Cassimiro
2,
Maikon Vinicius da Silva Lira
2,
Ariele da Silva Boni
1,
Natália de Lima Donato
1,
Roberto dos Anjos Reis, Jr.
3 and
Reges Heinrichs
1
1
Department of Crop Science, São Paulo State University—Unesp, Rodovia SP 294, km 651, Dracena 17900-000, Brazil
2
Soil and Fertilizers Lab., University do Oeste Paulista—Unoeste, Rodovia Raposo Tavares, Presidente Prudente 19067-175, Brazil
3
Wirstchat Polímeros do Brasil, Av. Ayrton Senna da Silva, 300, Torre 01, 8° Andar-Sala 805, Londrina 86050-460, Brazil
*
Author to whom correspondence should be addressed.
Agronomy 2022, 12(11), 2817; https://doi.org/10.3390/agronomy12112817
Submission received: 21 October 2022 / Revised: 8 November 2022 / Accepted: 9 November 2022 / Published: 11 November 2022

Abstract

:
The low availability of phosphorus in most Brazilian soils causes a heavy dependence of agricultural production on phosphate fertilizers, which are generally agronomically inefficient in tropical soils. Breeding for increased longevity of sugarcane ratoons is extremely important, but understanding how the efficiency of phosphate fertilization can be improved is equally necessary. The objective of this research was to evaluate the effects of phosphate fertilizers with and without polymer coating on the productivity and nutritional status of sugarcane ratoons and phosphorus availability in the soil. The experiment was carried out on a commercial sugarcane field on a dystrophic Ultisol over two growing seasons in a randomized complete block design with four replications. Two phosphorus sources (monoammonium phosphate (MAP) and MAP + Policote) were tested at four rates (20, 40, 60 and 80 kg P2O5 ha−1) in addition to the control (no P fertilization). The Policote-coated phosphate fertilizer induced higher stalk and TRS yields in the first experimental year, while the same effect was not observed in the second year. Nevertheless, with the reapplication of the treatments in the second study year, the mean stalk yield was high in response to the application of 20 kg P2O5 ha−1 of coated fertilizer and very different from that of the higher rates of the same fertilizer, which yielded 88 Mg ha−1, i.e., 8 Mg ha−1 more than the mean of the other rates.

1. Introduction

Sugarcane is an internationally significant crop for the production of renewable energy and is planted on a global acreage of approximately 24.3 million hectares [1]. Brazil is the largest producer, with a cultivated area of around 8 million hectares and an estimated annual output of 521.67 million tons [2]. These data stand for the relevance of sugarcane cultivation in the context of the ongoing expansion of a clean and renewable energy matrix. Under tropical conditions, the yield potential of the crop is enormous. Sugarcane can be grown in approximately 100 countries [3] and due to its versatility of use and high biomass and sucrose production, it has become a focus of global interest [4,5]. All over the world, ways to increase sugarcane yield are being studied, and improving the nutrient supply of the crop may be the answer.
Phosphorus, an essential macronutrient for plants, is often available at insufficient levels, limiting crop yield and productivity [6]. In the case of deficiency of this nutrient, plants cannot complete the production cycle and the structural integrity (nucleic acids, phospholipids) as well as energy production (ATP) for most cellular processes and storage are affected [7]. The importance of P for plants is fundamental and seriously hampered by the reactivity of the nutrient with the soil, making it less available to crops.
Phosphorus in the soil is affected by adsorption and fixation, mainly by binding to Fe and Al oxides, which is intensified in acidic soils, reducing P utilization by plants. In tropical climate regions, soils are deeply weathered and the high complexity of P in relation to the colloidal phase prevents the crop from exploiting more than 15 to 25% of the applied fertilizer P [8,9]. The reason is the high soil P adsorption, depressing the plant available levels, mainly in soils with a predominance of sesquioxides [10].
High phosphorus rates are applied at sugarcane planting, although the residual effect of this initial fertilization is insufficient to meet the crop requirements for subsequent years, causing a decline in ratoon cane yield [11,12]. Phosphate fertilization of ratoon cane is essential to meet the nutritional demand of the crop [13], and more efficient fertilizer sources are being sought, with fixation inhibitors or soil adsorption blockers, as an alternative to increase crop productivity or longevity [14]. Several strategies have been used to increase P fertilization efficiency. Lately, the most frequently used strategy has been the application of enhanced-efficiency fertilizers [9]. These fertilizers contain aggregate technologies that control the nutrient release or stabilize their chemical transformation in the soil, increasing nutrient availability to plants [15].
The need to increase the efficiency of phosphate fertilizers and the lack of information about the issue motivated the hypothesis that the application of polymer-coated fertilizer raises phosphate fertilization efficiency and crop yields. In light of the global importance of sugarcane, the crop requirements during the cycle and low P levels in highly weathered soils, the purpose of this study was to evaluate the effects of phosphate fertilizers with and without polymer coating (fixation inhibitors) on the productivity and nutritional status of sugarcane ratoon and its effects on soil phosphorus availability.

2. Materials and Methods

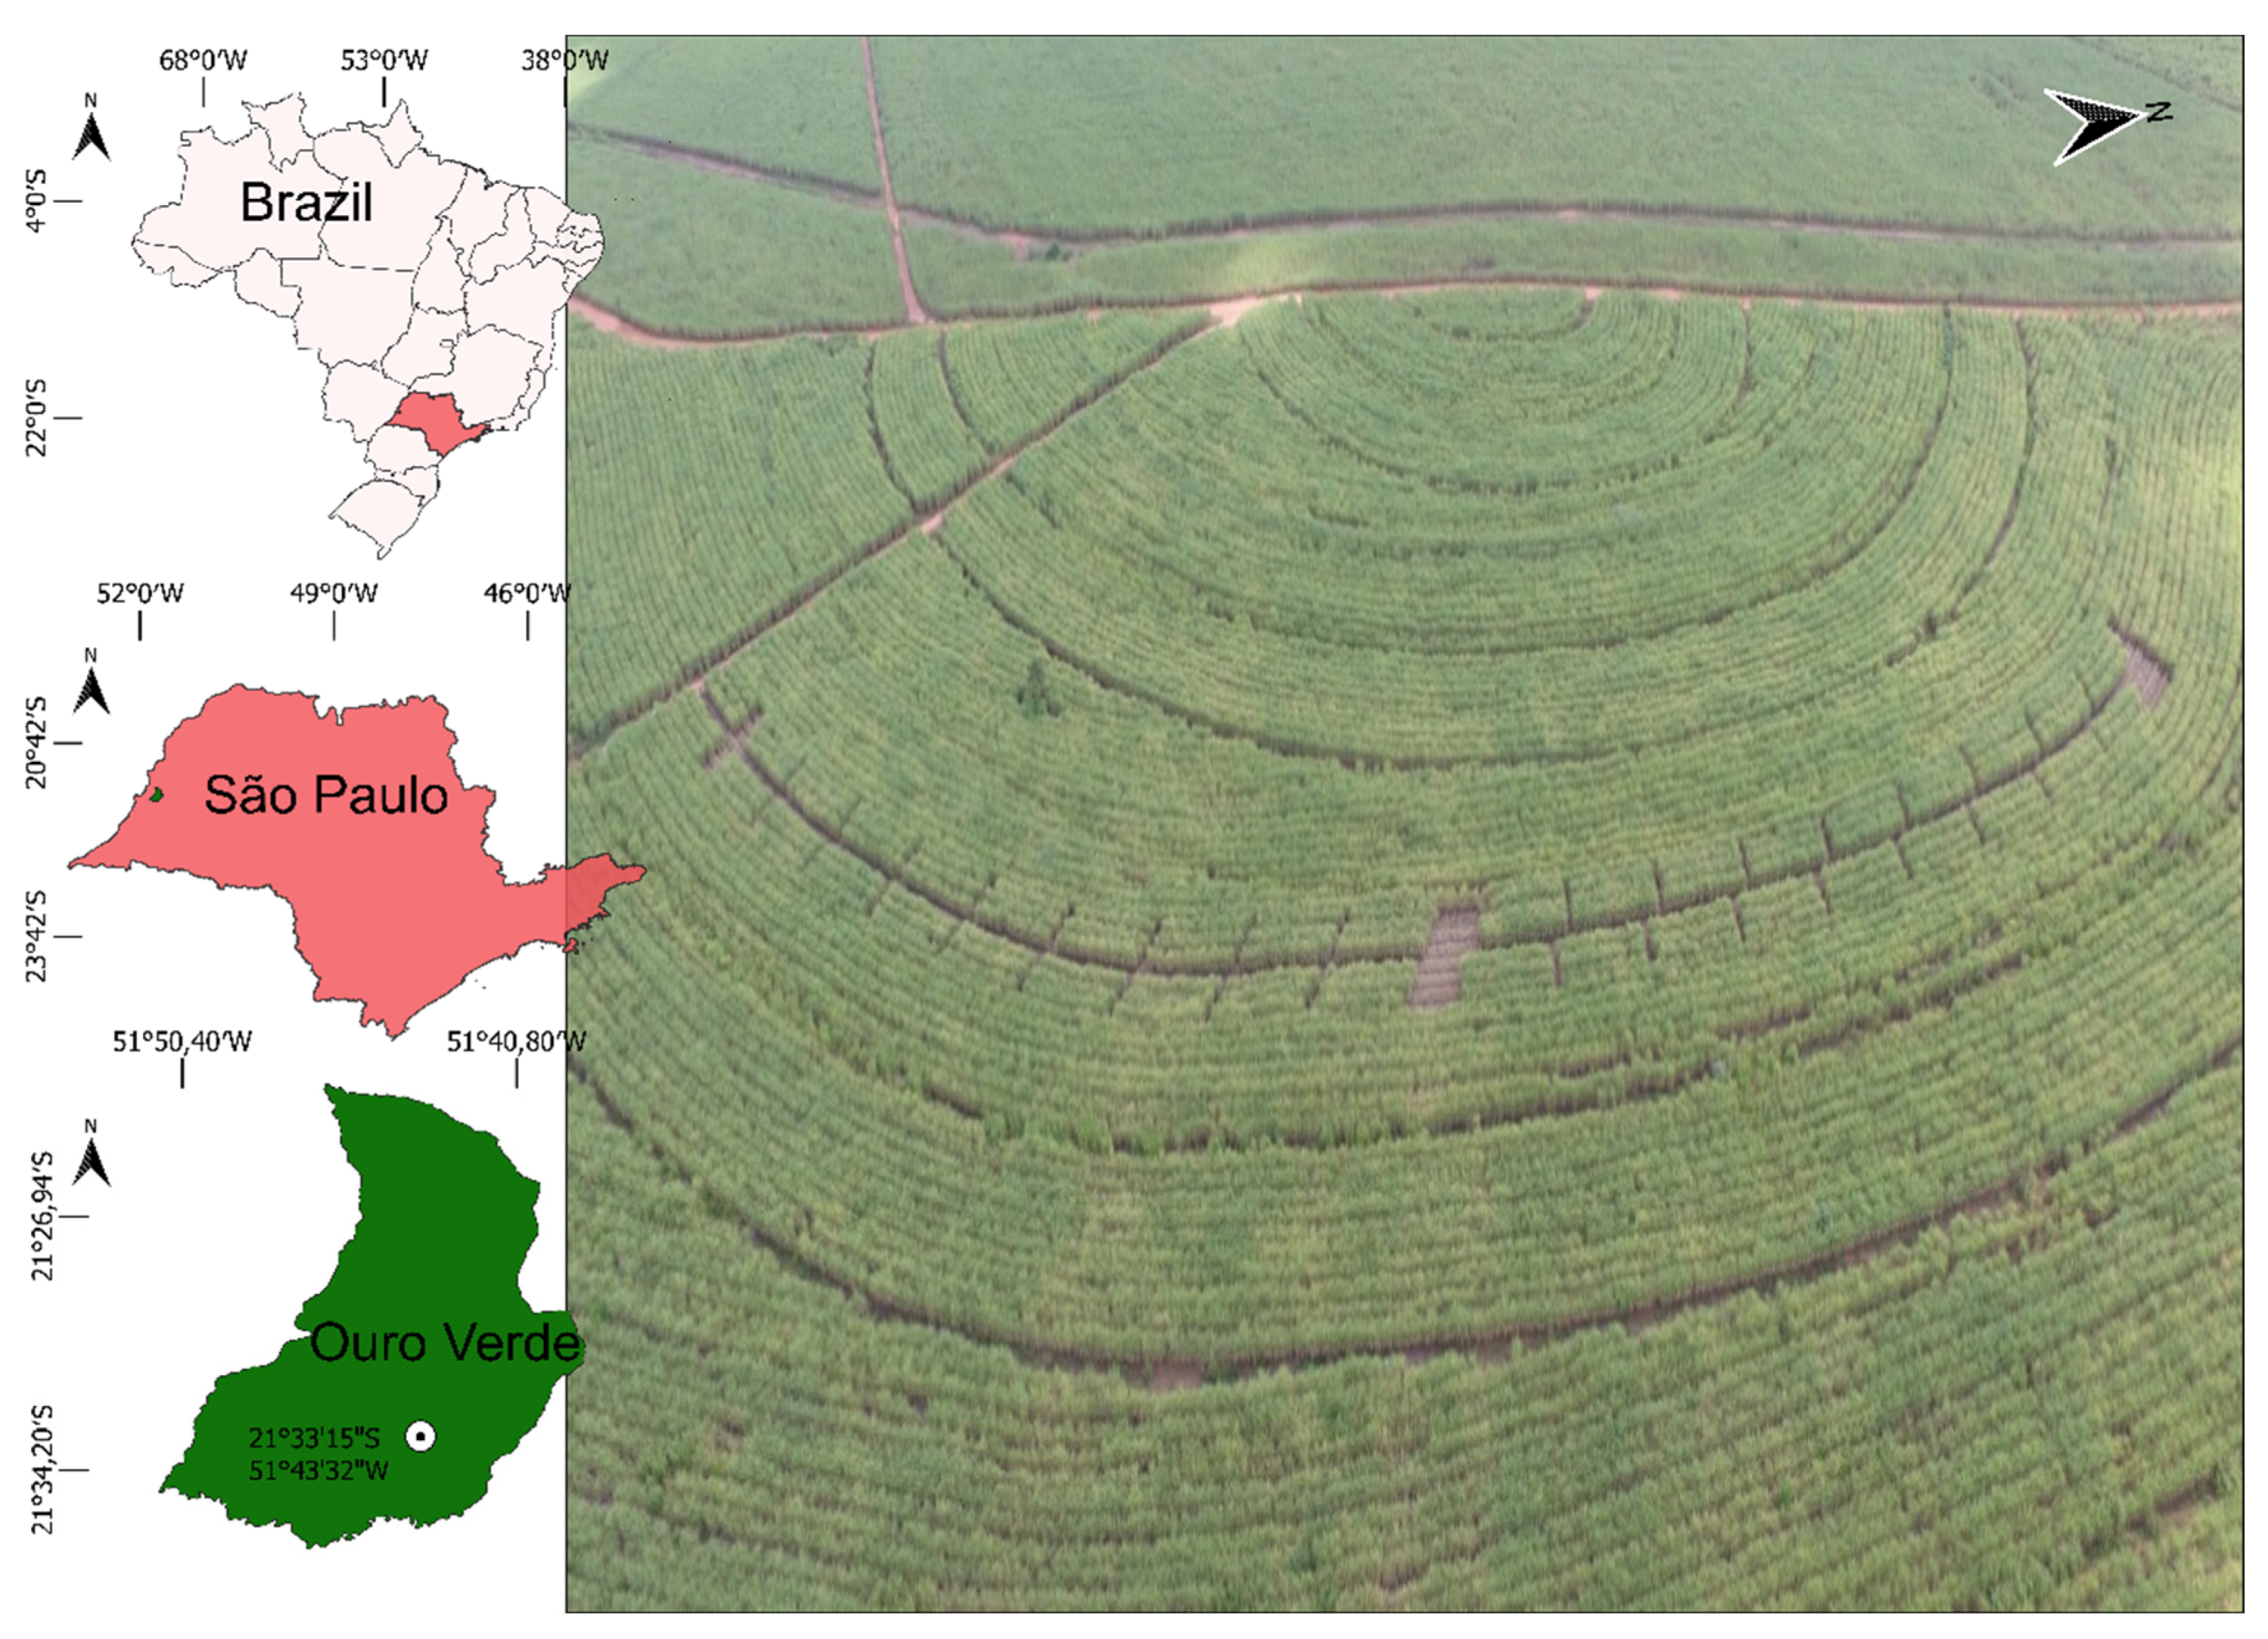
2.1. Experimental Site and Treatments

The experiment was carried out in Ouro Verde (21°33′15″ S; 51°43′32″ W; 420 m asl) in São Paulo State, Brazil on a commercial sugarcane plantation with variety RB 92579 in the 2018/19 and 2019/2020 growing seasons (Figure 1). The experiment was set up in an area in the third crop cycle (second ratoon) on an Argissolo Vermelho Amarelo soil with sandy texture [16], corresponding to a dystrophic Ultisol [17] and evaluated for two successive growing seasons. The results of soil chemical and particle-size analysis of samples collected after harvesting the first ratoon, from the layers 0.00–0.10 m, 0.10–0.20 m and 0.20–0.40 m are described in Table 1 [18,19].
The experiment was arranged in a randomized complete block design with four replications, with treatments in a factorial scheme (2 × 4) + 1, represented by two sources, uncoated MAP and Policote-coated MAP (MAP + Policote) at four rates (20, 40, 60 and 80 kg P2O5 ha−1) and without P fertilization (control). The N and P2O5 concentrations in MAP and coated MAP were 11% and 52%; and 10% and 49%, respectively. To coat the MAP fertilizer, the granules were covered with water-soluble additives based on copolymers with iron and aluminum affinity, called Policote, marketed by Wirstchat Polímeros do Brasil.
The experimental plots consisted of six 20 m long rows with alternating row spacing of 0.90 and 1.5 m on a total area of 144 m2. Planting of the crop occurred in 2015, with the first cut in 2016 (plant-cane), the second cut in 2017 (first ratoon) and the experiment installed on 16 October 2018 (second ratoon). Phosphate fertilizers were applied on the crop row together with 120 kg N ha−1 (34 and 86 kg ha−1, respectively, of ammonium sulfate-N and N urea) and 120 kg K2O ha−1 (potassium chloride), in both growing seasons (2018/20 and 2019/20). After the second cut, 2 Mg ha−1 of limestone was applied.

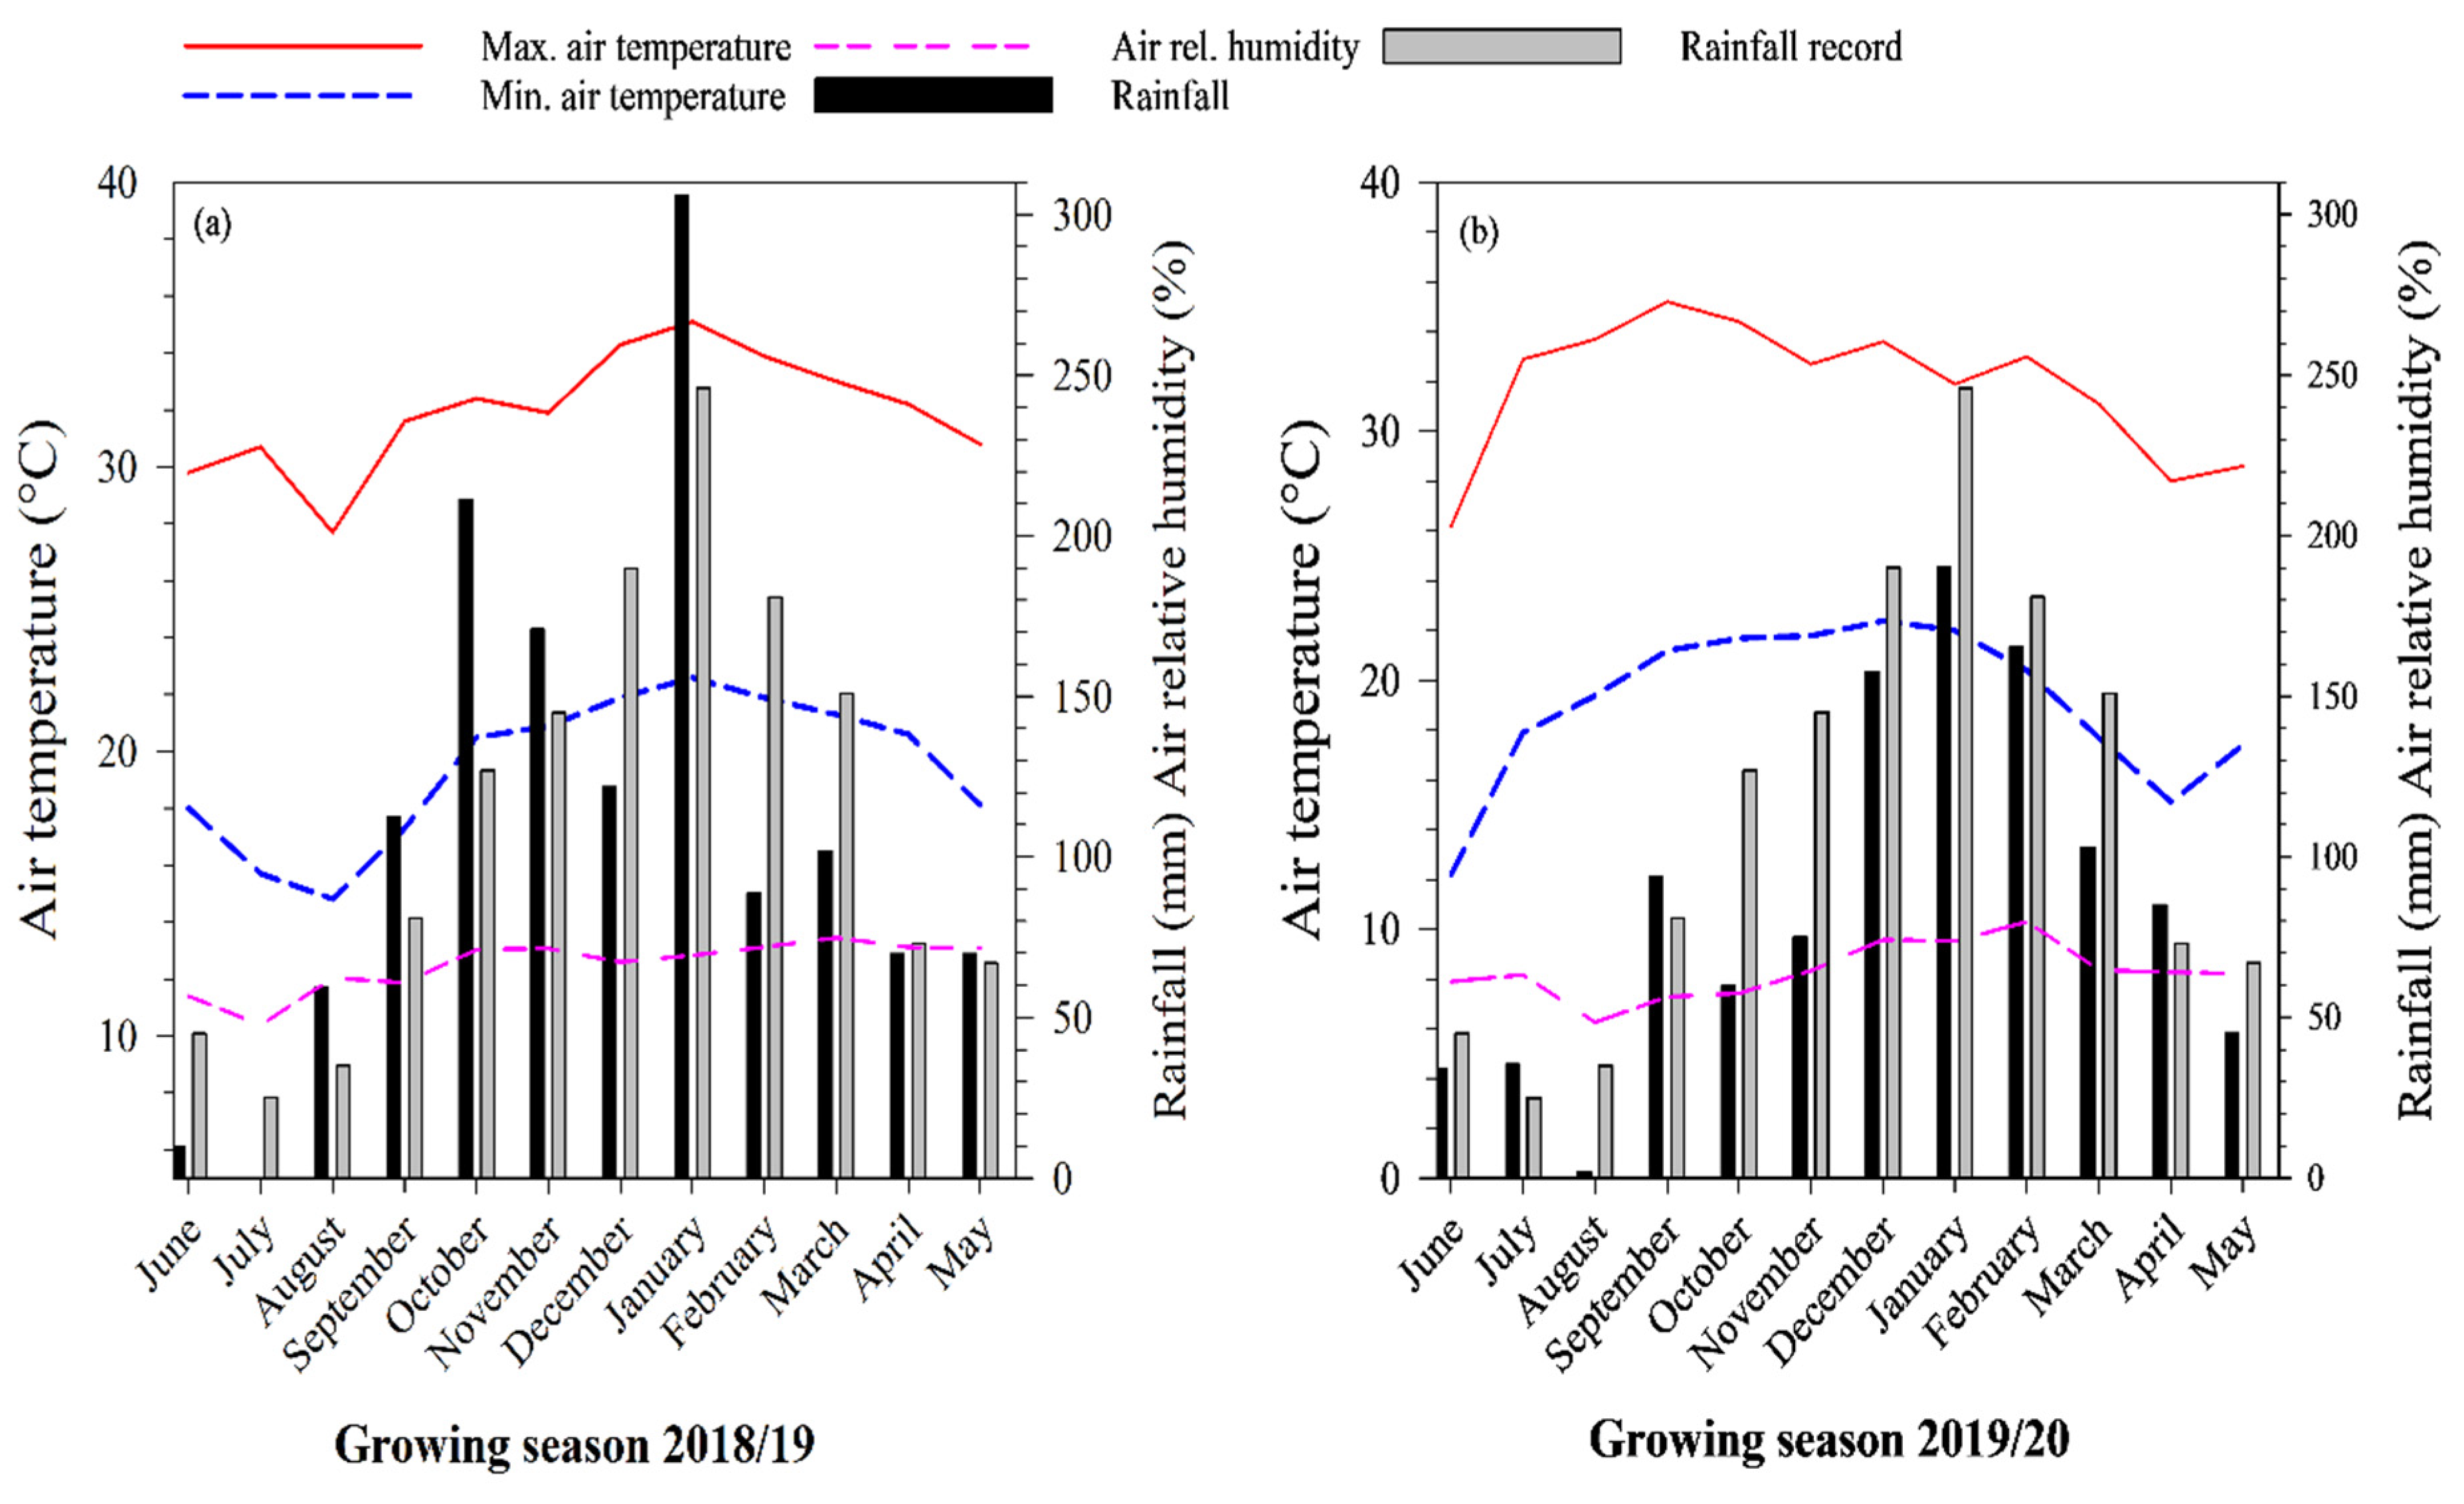
2.2. Weather Conditions

According to the Köppen classification, the climate is Aw, characterized by seasons of a tropical climate with dry winters [20]. Rainfall, temperature and relative humidity data of the experimental period were provided by a meteorological station close to the experimental area and the National Institute of Meteorology (INMET) [21] (Figure 2). The historical average was 1.366 mm, and 1.322 and 1.046 mm in the growing seasons 2018/19 and 2019/20, respectively.

2.3. Soil Phosphorus

After each harvest, six soil samples per treatment were taken, crumbled, air-dried and sieved (2 mm mesh). Soil P availability was evaluated by the methods of Ion-Exchange Resin (P-Resin) and Mehlich-1 (M1). For P-Resin analysis, the methodology described by Raij et al. [18] was used, in which cationic resin is treated with 1 mol L−1 NaHCO3 at pH 8.5. Extractor Mehlich-1 was prepared with a mixture of two dilute acids (0.05 mol L−1 HCl and 0.0125 mol L−1 H2SO4), as described by Tedesco et al. [22]. The P concentration in the solution of the two extractors was determined by a methodology of recording the phosphomolybdate complex in a UV visible spectrophotometer, with a wavelength reading at 660 nm, proposed by Murphy and Riley [23].

2.4. Plant Analysis

To assess the nutritional status of sugarcane plants, 20 diagnosis leaves (leaf + 1) per plot were randomly collected from the four central rows, leaving a 2 m border. For analysis, the middle third of the leaves were used, excluding the midrib. The N content was determined by the method of sulfuric digestion, titration by micro Kjeldahl and the P, K, Ca, Mg and S levels by nitroperchloric digestion. The P concentration was assessed with a spectrophotometer and the K, Ca, Mg, and S concentrations with an atomic-absorption spectrophotometer [24].
For the technological quality analysis of sugarcane, 12 stalks were randomly sampled at each harvest throughout the experiment. After identification and weighing, the stalks were sent to the laboratory to analyze the following parameters [25]:
Brix (Bj): soluble solids content in percent of juice weight, determined by an automatic digital refractometer.
Fiber (F): stalk fiber content calculated as: F = 0.08 P B U + 0.876 Where: PBU = Wet bagasse weight.
Moisture   %   ( U ) :   calculated   as :   U = W w m W d m W w m 100
where: Wwm = wet matter weight; Wdm = dry matter weight.
Pol in juice (S): apparent sucrose content per juice weight, measured with an automatic digital saccharimeter and calculated as: S = L P o l ( 0.26047 0.0009882 B j ) . Where: LPol = Sucrose reading of clarified juice; and, Bj = Juice Brix.
Pol in cane (PC): calculated as:
P O L = S ( 1 0.01 F ) C
where: S = Pol in juice; F = Fiber; C = Coefficient for transformation of pol from juice extracted in press (S) into pol in cane (PC).
Juice purity (Q): apparent purity of cane juice (Q), defined as the ratio of pol to brix expressed as percentage, calculated by:
Q = 100 S / B j
where: S = Pol in juice; Bj = Brix in juice.
Reducing sugars in juice % (RS): percent of reducing sugars (RS) per juice weight was calculated as:
R S = 3.641 0.0343 Q
where: Q = juice purity.
Total Recoverable Sugar (TRS): computed from pol in cane (PC) and reducing cane sugars (RCS); calculated as:
T R S = 9.526 P C + 9.05 R S
Forage and stalk weight were determined by cutting 15 neighboring plants of the four central rows (excluding plot borders), resulting in a total of 60 plants per plot. After cutting, the plants were weighed immediately on a scale, then husked and shoot tips removed. The material was weighed again and trash weight estimated as the difference between forage and stalk weight. To determine cane yield, the number of stalks within 3 m of the four central rows was counted, discarding 2 m at either end. From these results, the sugarcane yield was calculated.

2.5. Statistical Analysis

Data analysis was performed using Statistical Analysis System software [26]. Residual normality and variance homogeneity were analyzed. To meet the prerequisites, the data were subjected to analysis of variance (ANOVA) at a probability of 5%. In case of significance, the means of the P sources were compared with each other by the F-test and the rates by regression equations [27]. Graphs were plotted using Sigmaplot® version 14.5 (Systat Software, Inc., San Jose, CA, USA, www.sigmaplot.com, accessed on 18 October 2022).

3. Results

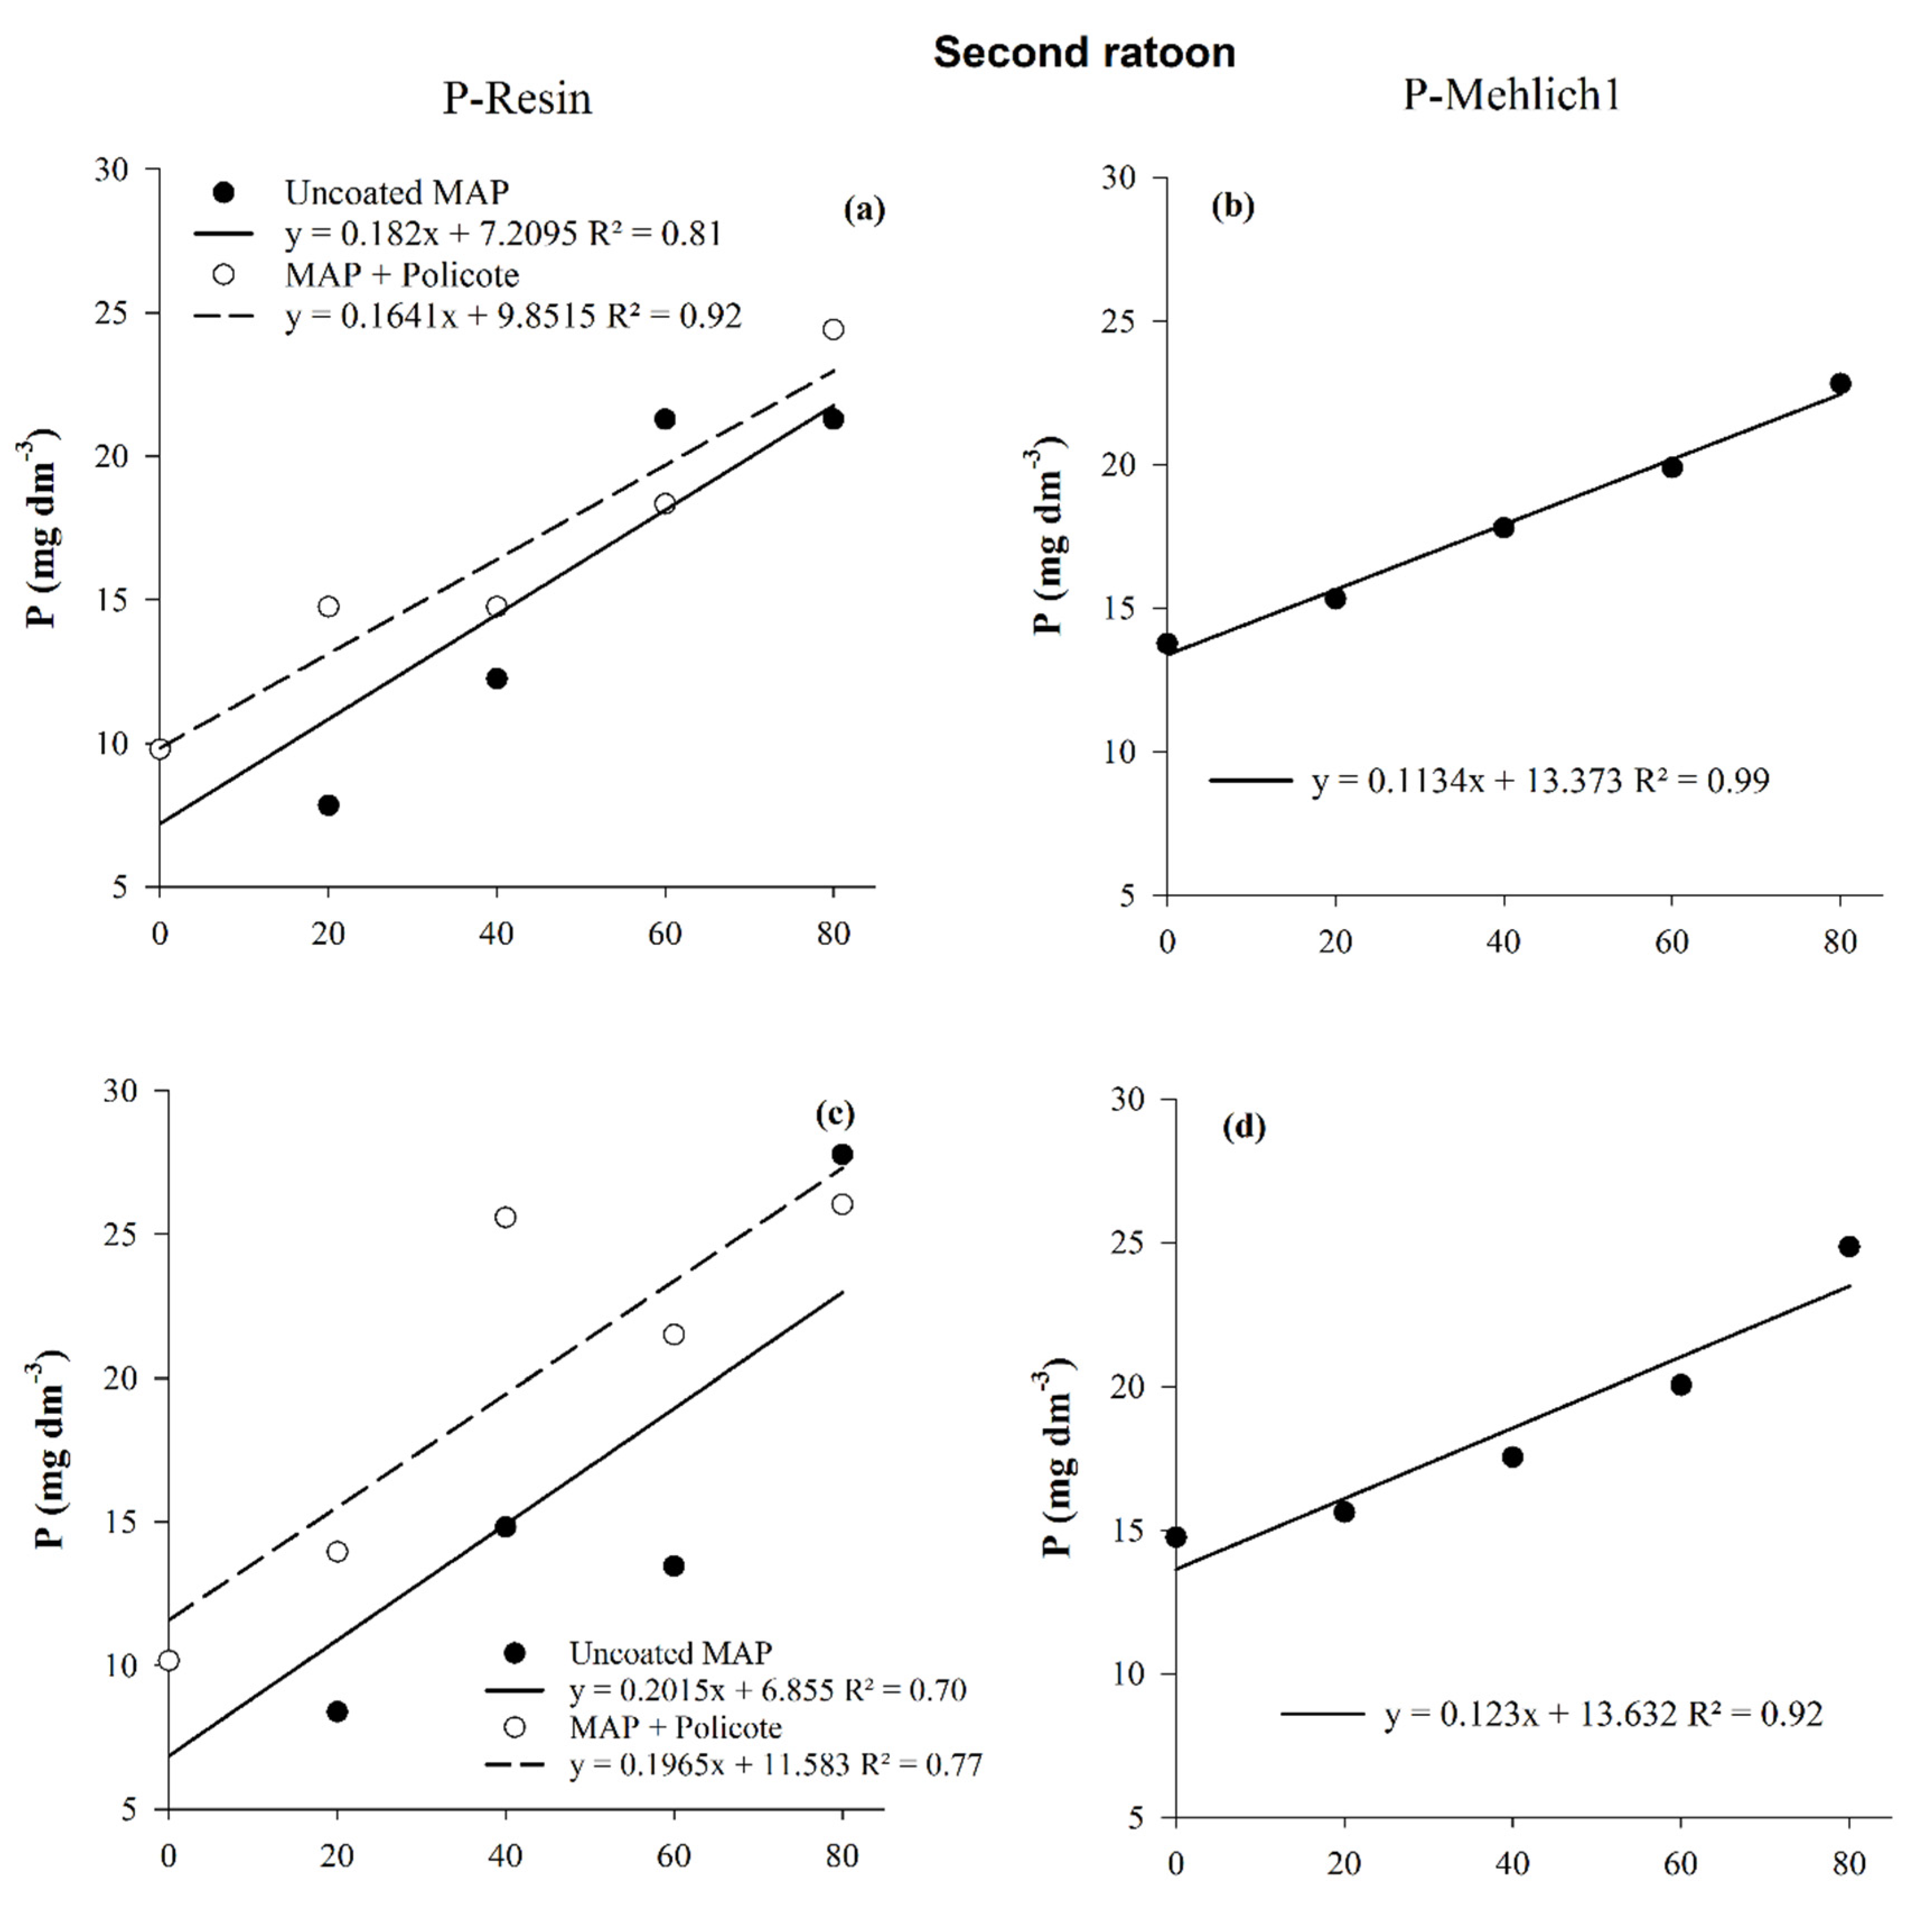
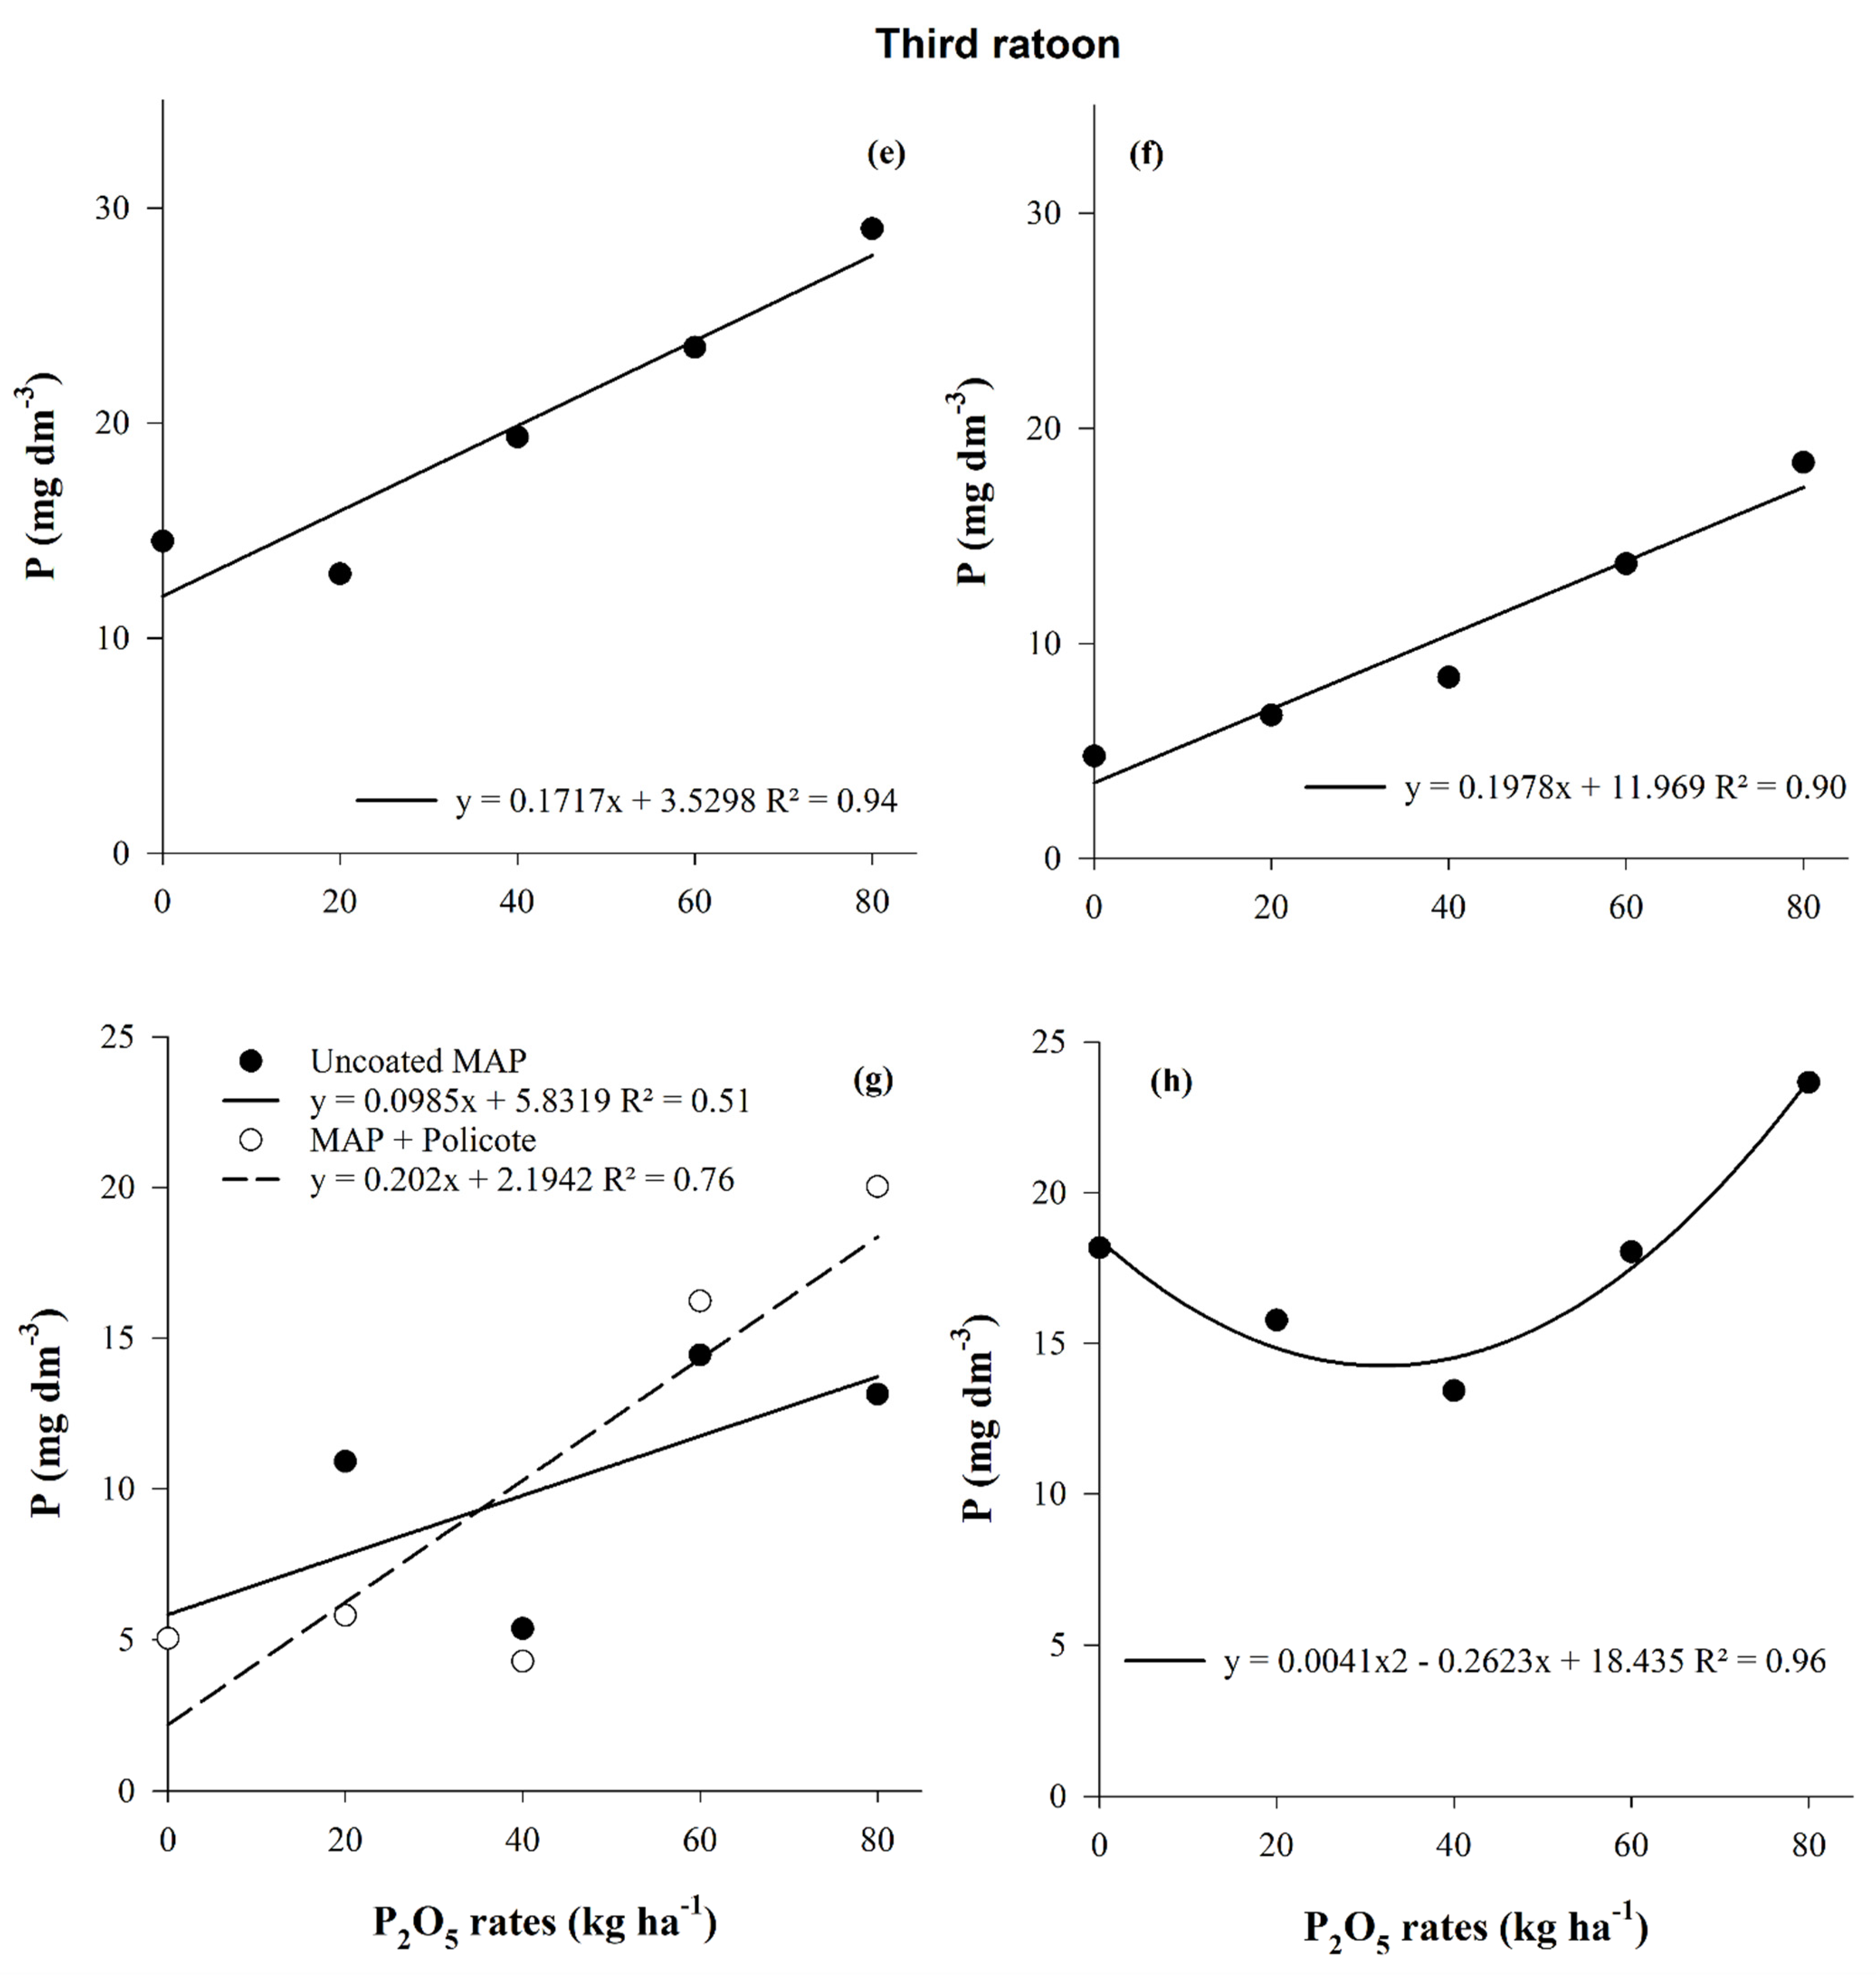
3.1. Phosphorus Availability in the Soil

Soil phosphorus levels varied in response to the P sources and rates applied to sugarcane (p < 0.05). In the second ratoon crop, extraction by P-Resin detected interaction in both layers (0–0.10 and 0.10–0.20 m) (Figure 3a,c), which became significant in the third ratoon in the lower layer (0.10–0.20 m) (Figure 3g). In the surface layer (0–0.10 m), there was a response to isolated factors, with a linear effect for rates (Figure 3e). Comparing the sources, MAP + Policote made the highest levels of nutrients available (12.72 mg P dm−3) (Table 2). Between the first and second year of evaluation, P-Resin detected a decrease in the mean P concentration of 32% and 41%, respectively, in the 0–0.10 and 0.10–0.20 m layers.
By the Mehlich-1 method, there was no significant interaction between rates and sources (p > 0.05). However, there was an isolated effect for the two factors, with a linear response to P rates in the two evaluated years and two layers (Figure 3b,d,f), except in the 0.10–0.20 m layer in the second year when a quadratic response was observed (Figure 3h). Regarding the sources, results in soil P contents were positive in response to Policote-coated fertilizer in the 0–0.10 m layer in the third ratoon and the 0.10–0.20 m layer in both years (Table 2). Between the first and second years of evaluation, Mehlich-1 detected a mean increase of 10.94% in the surface layer and a reduction of 4% in the layer below.

3.2. Plant Nutritional Status

The phosphorus rates and sources had no effect on the nutritional status of sugarcane (p > 0.05). However, there was a difference between the years of cultivation (Table 3). Nitrogen and K contents decreased by 29 and 50%, respectively, from the second to the third ratoon crop (Table 3). The levels of P, Ca and Mg soil availability increased from the first to the second year of evaluation, respectively, by 43%, 14% and 39% (Table 3), while S remained constant in the evaluated cycles (p > 0.05).
Leaf macronutrient contents were within the range considered adequate for the nutritional status of sugarcane [24,28], and in the second and third ratoon crops, S was the only macronutrient below the critical level (1.4 g kg−1), while the levels of the others were within the range considered adequate. In the third ratoon crop, the levels of the macronutrients N, K and S were below the ideal (18, 10 and 1.4 g kg−1 respectively), whereas those of the others were adequate.

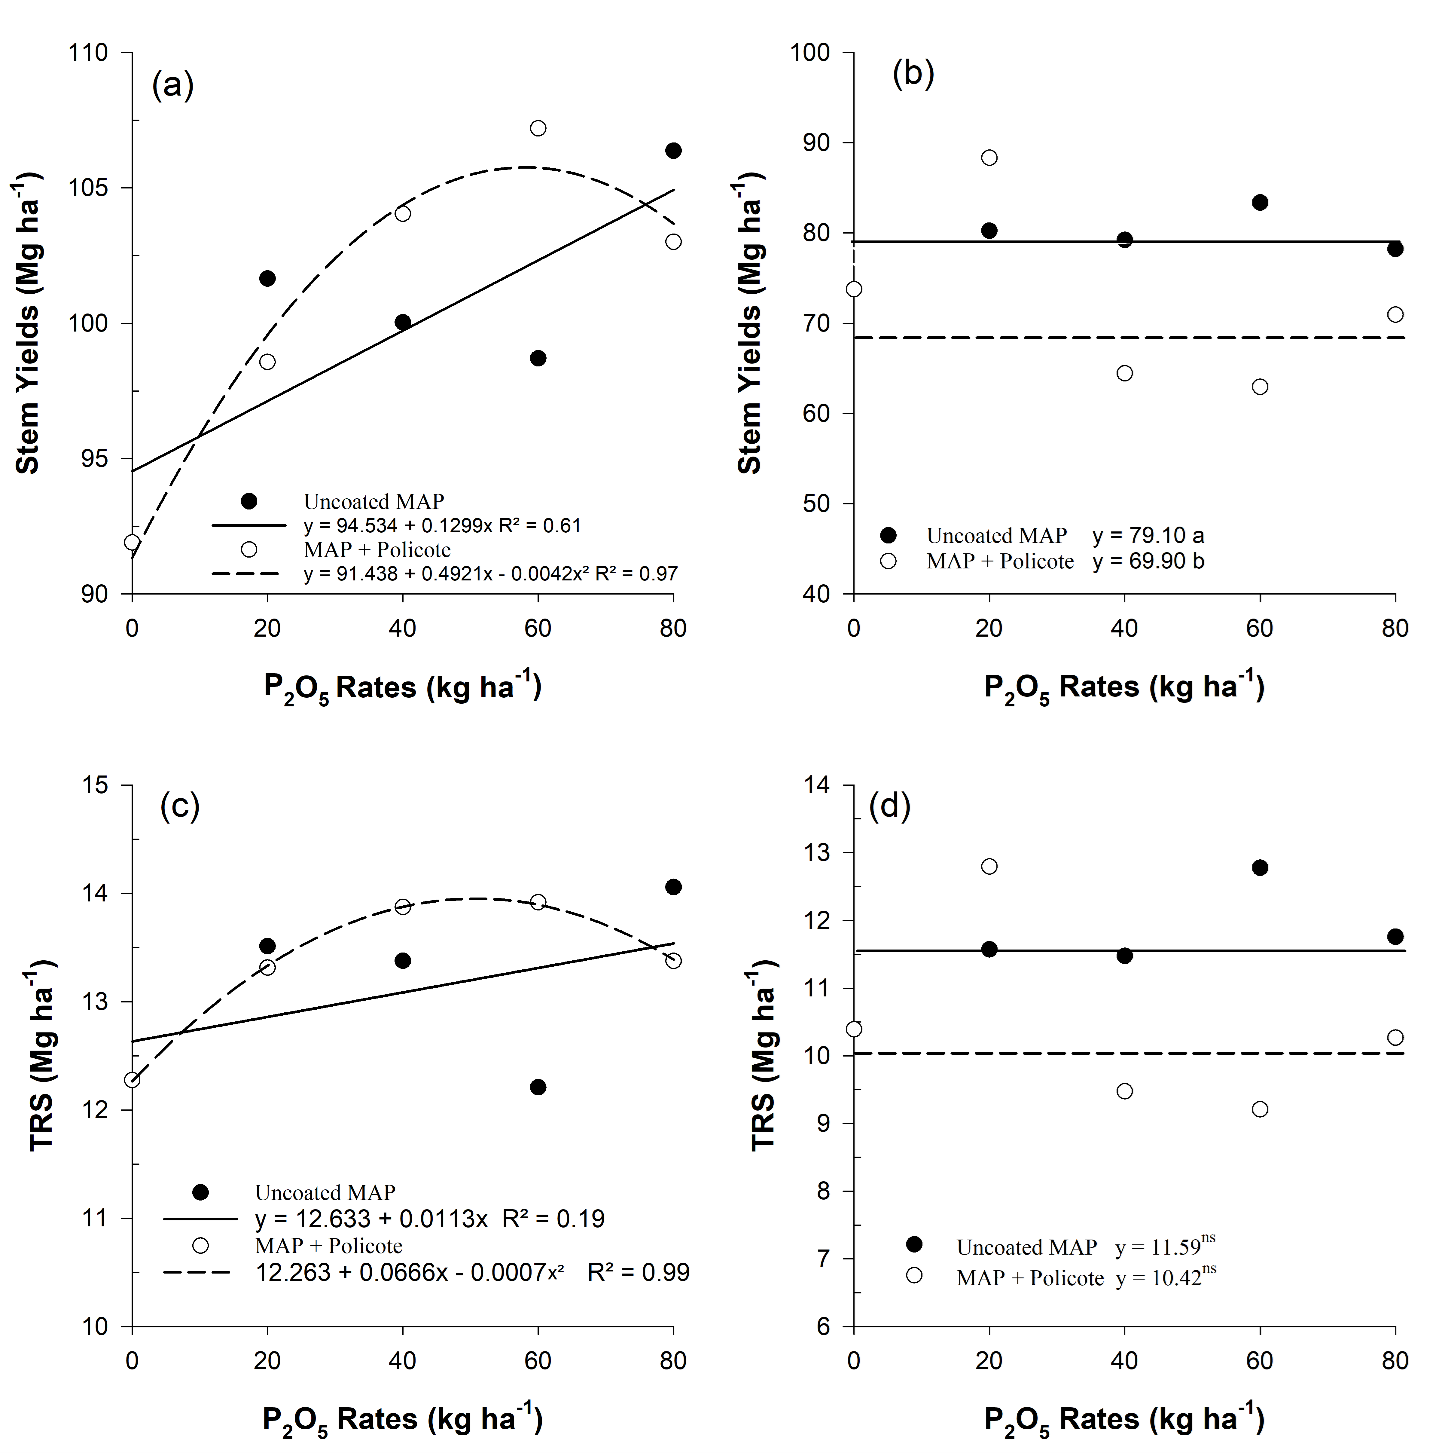
3.3. Effects on Sugarcane Technological Quality and Yield

The second ratoon stalk yield (Figure 4a) shows that the response to uncoated fertilizer increased linearly up to the rate of 80 kg P2O5 ha−1, reaching a production of 105 Mg ha−1. In turn, the response to the Policote-coated phosphate source fitted a quadratic model, with a maximum yield of 106 Mg ha−1 at a rate of 58 kg P2O5 ha−1. Total reducing sugar (TRS) yield had a similar pattern to that observed for stalk yield (Figure 4c). In the third ratoon, after reapplication of the treatments, no mathematical model could be fitted relating P rates with stalk and TRS yield (Figure 4b,d). However, the rate of 20 kg P2O5 ha−1 in coated fertilizer stood out among the other treatments, with a yield of 88 Mg ha−1 (Figure 4b).
Fertilization with P sources and rates had no significant effect on the interaction, nor the separate factors on the technological quality of sugarcane (p > 0.05). Comparing the growing seasons, the levels of Brix, Fiber, POL, PC and TRS differed (p < 0.05), with an increase of, respectively, 9.5, 9.2, 13.8, 11.7 and 10.8% in the second year of evaluation, while the moisture content was 2.5% higher in the first year (Table 4). For RS and juice purity, no significant differences were observed between the evaluated cultivation cycles.

4. Discussion

In response to soil application of the two phosphorus sources, the methods P-Resin and Mehlich-1 detected increasing concentrations with increasing rates. In the second ratoon crop, the P-Resin extractor better differentiated the fertilizer responses in the 0–0.10 and 0.10–0.20 m layers (Figure 3a,c) based on the principle of ion exchange, affecting the colloidal system. This pattern can be explained by the principle of the polymers used as fertilizer coating, which, when in contact with the soil solution, release charges to saturate positive soil colloid charges. This reduces P adsorption and fixation in the soil colloidal fraction, leaving the nutrient available for plant uptake. In this way, the results can be different depending on the soil characteristic, especially in relation to the colloidal fraction as well as other factors e.g., crop, management system, and climate, among others [29].
In the second year of evaluations (third ratoon), no interaction was observed between rates and sources in phosphorus contents 0–0.10 m by the P-Resin method, showing only a linear effect for rates (Figure 3e). This result can be attributed to factors related to low rainfall in the period (Figure 2b) and intensified by the low water retention capacity due to the sandy texture of the surface layer, which reduces granule solubility and levels out the effect of the two sources on the soil. In the subsurface, an interaction between phosphorus sources and rates was stated, which can be attributed to some residual effect of fertilization applied in the previous year, since rainfall was restricted.
The soil P contents determined by Mehlich-1 were significantly influenced by the rates (Figure 3b,d,f,h), but no difference was identified between the sources in both layers and the two evaluated years, unlike the pattern detected when using P-Resin. These results can be attributed to factors inherent to the Mehlich-1 method, which preferentially extracts P forms bound to Ca, leading to an overestimation of P availability in recently fertilized soils [30]. For the evaluation of fertilizer sources, the results of the extraction methods must be discriminated according to the soil characteristics, especially with regard to the texture class [31].
Several studies correlate the extractors P-resin and Mehlich-1 [32,33,34]. These authors claimed that the lower the amount of clay, the higher the contents extracted by Mehlich-1. This confirmed the results of this study, which were mostly higher than those obtained by the P-Resin method. However, Mumbach et al. [35] reported contrary results, emphasizing that apart from soil texture, which can be explained by the natural phosphates that are often used for phosphating, the acid extractant predominantly solubilizes Ca-P, resulting in an overestimation of available P.
Table 3 shows the foliar levels of macronutrients, which indicate lower N and K uptake in the second than the first year of evaluation. These results may be related to the lower rainfall in the second year (Figure 2), since N and K movement in the soil is strongly influenced by mass flow, affecting root uptake [36,37], along with the sandy soil with low organic matter content and water retention capacity [38]. Water stress also affects the development of the root system [39,40], reducing the soil volume exploited for nutrient uptake. For both nutrients, the values in the second year were below the critical level considered adequate for the crop [24,28].
The levels of P, Ca and Mg increased in the soil in the second year of evaluation. The difference in P content can be attributed to the increase in the availability of the element in the soil due to phosphate fertilization in the application of treatments in two successive years. While the differences in Ca and Mg observed between the growing seasons must be related to the 2 Mg ha−1 limestone applied after the first ratoon harvest, this application may also have affected K uptake due to an imbalance in the K/Ca/Mg ratio [41]. According to the values found, the three nutrients are within the range considered suitable for sugarcane [24,28].
Leaf concentrations of S, although applied in fertilization via ammonium sulfate, were low. This can be attributed to the low amount of soil organic matter, high nutrient mobility in the soil profile, mainly due to the predominant sandy fraction, or to varietal characteristics, as also observed by Calheiros et al. [42] in a study with the same variety.
The concentration of parameters that make up the technological quality of sugarcane stalks was not significant between treatments (Table 4). However, there was a difference between the two years evaluated in some parameters. In the second year, the leaf moisture content (U) was lower than in the first, leading to a concentration effect of brix, PC, Pol and TRS. In turn, the reduction in moisture was a result of the water deficit in the second crop growth cycle (Figure 2). It is worth emphasizing that the plant, even under water stress, continues to synthesize sugar, while photosynthesis is affected if the annual water deficit exceeds 145 mm [43]. According to Araújo et al. [44], the effects of water stress can be beneficial to accumulate TRS, since the increase in TRS is inversely proportional to the moisture decrease up to 51 days of water stress before harvesting the stalks.
Another reason for the positive response in the high levels of technological quality parameters in the second year (Table 4) may be due to the better supply of the system with P since the nutrient influences the apparent sucrose percentage or pol in cane contained in sugarcane juice (PC) and juice purity [45]. Although the difference in purity between the growing seasons was not significant, it increased, confirming the data of Albuquerque et al. (2016) [46] who attributed an increase in Pol to purity to P application.
The cane stalk yield had a quadratic response to Policote-coated fertilizer, while in the absence of the Policote, the response was linear up to the rate of 80 kg P2O5 ha−1. The maximum stalk yield (105.85 Mg ha−1) in response to coated fertilizer was reached at a rate of 58.58 kg P2O5 ha−1. This yield was similar to that obtained with 80 kg ha−1 uncoated P2O5, representing a 26% reduction in the applied P rate when using the technology of fertilizer coating (Figure 4). The yield potential is close to that reported by Gava et al. (2011); Abreu et al. (2013) [47,48].
An important parameter in the evaluation of sugarcane fertilization is the production of total reducing sugars, for which the same pattern as for stalk yield was observed, with maximum yield produced at a rate of 47.57 kg P2O5 ha−1 by applying Policote-coated fertilizer, reaching a TRS yield of 13.85 Mg ha−1. The response to the uncoated monoammonium phosphate source fitted a linear model up to the rate of 80 kg P2O5 ha−1, with a TRS yield of 13.34 Mg ha−1 (Figure 4). Based on these values, the agronomic efficiency was computed, i.e., 33.21 and 15.87 kg of TRS per kilogram of P2O5, respectively, for fertilization with or without Policote coating.
In the evaluations of stalk and TRS yield in the second year (third ratoon), only the difference in the mean of the sources was verified, with higher stalk yield in response to the application of uncoated fertilizer. The difference between fertilizers may be related to the lower biodegradability of the polymer [49,50]. This may explain the lower productivity with the MAP + Policote fertilizer. Clearly, the sparse rainfall directly influenced the dissolution of the coated fertilizer in the soil, hampering the enzymatic action responsible for breaking down the polymers. Along with these factors, the soil SOM levels were low and consequently, the interactions of organisms and enzymes with the fertilizer were reduced.
Although without significant effect, with the reapplication of the treatments in the second study year, the mean stalk yield was high in response to the application of 20 kg P2O5 ha−1 of coated fertilizer, a very different mean in relation to the higher rates of the same fertilizer. These results suggest the need for further investigation into causes and effects in the application of high rates of fertilizers with technologies for enhanced efficiency, which may allow the use of lower rates due to the use of technology in successive years. Multiple authors describe the beneficial effects of phosphate fertilization with Policote-coated fertilizer and reported no negative effects due to applications of high fertilizer rates [9,31,51,52,53].

5. Conclusions

Fertilizers with or without Policote coating induced positive responses in soil P, as shown by the extractors P-Resin and Mehlich 1. However, the P-Resin extractor proved to be an adequate detection method of the importance of the polymer in increasing soil phosphorus availability. Leaf contents did not vary in response to phosphate fertilization. The technological quality of cane stalks varied between the studied growing seasons with better results in the second year. The Policote-coated phosphate fertilizer induced higher stalk and TRS yields in the first experimental year, while the same effect was not observed in the second year. Nevertheless, with the reapplication of the treatments in the second study year, the mean stalk yield was high in response to the application of 20 kg P2O5 ha−1 of coated fertilizer, a very different mean in relation to the higher rates of the same fertilizer.
Further research should be encouraged to understand the dynamics between polymer and the availability of P in soil and the possible effect on the physiology and production of enzymes that may contribute to nutrient use efficiency. These studies will allow the understanding of the physiological phenomena that occur with the highest phosphorus rates in the presence of the polymer.

Author Contributions

Conceptualization, C.L.B.d.O. and R.H.; methodology, C.L.B.d.O., J.B.C., A.d.S.B., N.d.L.D. and R.H.; software, C.L.B.d.O.; validation, C.L.B.d.O. and R.H.; Resource, R.H.; formal analysis, C.L.B.d.O., A.d.S.B. and N.d.L.D.; investigation, C.L.B.d.O., J.B.C. and M.V.d.S.L.; data curation, C.L.B.d.O.; writing—original draft preparation, C.L.B.d.O. and J.B.C. writing—review and editing, C.L.B.d.O., J.B.C., A.d.S.B., R.d.A.R.J. and R.H.; visualization, C.L.B.d.O., R.d.A.R.J. and R.H.; supervision, R.H. All authors have read and agreed to the published version of the manuscript.

Funding

This research received no external funding.

Institutional Review Board Statement

Not applicable.

Informed Consent Statement

Not applicable.

Data Availability Statement

The data presented in this study are available on request from the corresponding author.

Conflicts of Interest

The authors declare no conflict of interest.

References

  1. OECD; Food and Agriculture Organization of the United Nations. OECD-FAO Agricultural Outlook 2022–2031; OECD: Paris, France, 2022; ISBN 978-92-64-58870-7. [Google Scholar]
  2. de A Conab, C.N. Acompanhamento da safra brasileira cana-de-açúcar. Acompan. Safra Bras. 2021, 8, 59. [Google Scholar]
  3. Heinrichs, R.; Otto, R.; Magalhães, A.; Meirelles, G. Importance of Sugarcane InBrazilian and World Bioconomy. In Springer Nature; S. Dabber: Cham, Switzerland, 2017. [Google Scholar]
  4. Ahorsu, R.; Medina, F.; Constantí, M. Significance and Challenges of Biomass as a Suitable Feedstock for Bioenergy and Biochemical Production: A Review. Energies 2018, 11, 3366. [Google Scholar] [CrossRef] [Green Version]
  5. de Andrade, A.F.; Flores, R.A.; Casaroli, D.; Bueno, A.M.; Pessoa-de-Souza, M.A.; de Lima, F.S.R.; Marques, E.P. K Dynamics in the Soil–Plant System for Sugarcane Crops: A Current Field Experiment Under Tropical Conditions. Sugar Tech 2021, 23, 1247–1257. [Google Scholar] [CrossRef]
  6. Gonçalves, V.; Meurer, E.; Tatsch, F.; Carvalho, S.; Neto, O. Biodisponibilidade de Cádmio Em Fertilizantes Fosfatados. Rev. Bras. Ciência Solo 2008, 32, 2871–2875. [Google Scholar] [CrossRef]
  7. Taiz, L.; Zeiger, E.; Moller, I.M.; Murphy, A. Fisiologia e Desenvolvimento Vegetal, 6th ed.; Artmed: Prague, Czech Republic, 2017; ISBN 978-1-60535-255-8. [Google Scholar]
  8. Sanders, J.L.; Murphy, L.S.; Noble, A.; Melgar, R.J.; Perkins, J. Improving Phosphorus Use Efficiency with Polymer Technology. Procedia Eng. 2012, 46, 178–184. [Google Scholar] [CrossRef] [Green Version]
  9. Zanão, L.A., Jr.; Arf, O.; dos Reis, R.A., Jr.; Pereira, N. Phosphorus Fertilization with Enhanced Efficiency in Soybean and Corn Crops. Aust. J. Crop Sci. 2020, 14, 78–84. [Google Scholar] [CrossRef]
  10. Fink, J.R.; Inda, A.V.; Bayer, C.; Torrent, J.; Barrón, V. Mineralogy and Phosphorus Adsorption in Soils of South and Central-West Brazil under Conventional and No-Tillage Systems. Acta Sci. Agron. 2014, 36, 379–387. [Google Scholar] [CrossRef] [Green Version]
  11. Gopalasundaram, P.; Bhaskaran, A.; Rakkiyappan, P. Integrated Nutrient Management in Sugarcane. Sugar Tech 2012, 14, 3–20. [Google Scholar] [CrossRef]
  12. Costa, D.B.D.; Neto, D.E.S.; Freire, F.J.; De, E.C.A. Adubação fosfatada em cana planta e soca em argissolos do nordeste de diferentes texturas. Rev. Caatinga 2014, 27, 10. [Google Scholar]
  13. Zambrosi, F.C.B. Phosphorus Fertilizer Reapplication on Sugarcane Ratoon: Opportunities and Challenges for Improvements in Nutrient Efficiency. Sugar Tech 2020, 23, 704–708. [Google Scholar] [CrossRef]
  14. Guelfi, D.R. Tecnologias e Inovações Para Fertilizantes Fosfatados. NPTC 2021, 10, 14–33. [Google Scholar]
  15. AAPFCO Association of American Plant Food Control Officials (AAPFCO). Available online: http://www.aapfco.org/publications.html (accessed on 18 February 2021).
  16. Santos, E.F. dos Mecanismos de Interação Fósforo-Zinco no Sistema Solo-Planta: Disponibilidade No Solo, Avaliações Fisiológicas e Expressão de Transportadores de Fosfato. Ph. D. Thesis, em Biologia na Agricultura e no Ambiente, Universidade de São Paulo, Piracicaba, Brazil, 2018. [Google Scholar]
  17. Soil Survey Division Keys to Soil Taxonomy, 12th ed.; United States Department of Agriculture, Natural Resources Conservation Service: Washington, DC, USA, 2014.
  18. Raij, B.V.; Andrade, J.C.; Cantarella, H.; Quaggio, J.A. Análise Química Para Avaliação Da Fertilidade de Solos Tropicais; Instituto Agronômico de Campinas: Campinas, Brazil, 2001.
  19. Teixeira, P.C.; Donagemma, G.K.; Fontana, A.; Teixeira, W.G. Manual de Métodos de Análise de Solo; Embrapa Solos: Brasilia, DF, Brazil, 2017; Volume 3, ISBN 978-85-7035-771-7. [Google Scholar]
  20. Alvares, C.A.; Stape, J.L.; Sentelhas, P.C.; de Gonçalves, J.L.M.; Sparovek, G. Köppen’s Climate Classification Map for Brazil. Meteorol. Z. 2013, 22, 711–728. [Google Scholar] [CrossRef]
  21. Instituto Nacional de Meteorologia-INMET. Available online: https://portal.inmet.gov.br/ (accessed on 15 April 2021).
  22. Tedesco, M.J.; Gianello, C.; Anghinoni, I.; Bissani, C.A.; Camargo, F.A.O.; Wiethölter, S. Manual de Adubação e Calagem.; Comissão de Química e Fertilidade do Solo-RS/SC: Porto Alegre, Brazil, 2004. [Google Scholar]
  23. Murphy, J.; Riley, J.P. A Modified Single Solution Method for the Determination of Phosphate in Natural Waters. Anal. Chim. Acta 1962, 27, 31–36. [Google Scholar] [CrossRef]
  24. Malavolta, E. Avaliação Do Estado Nutricional Das Plantas: Princípios e Aplicações/Eurípedes Malavolta, Godofredo Cesar Vitti, Sebastião Alberto de Oliveira. Piracicaba Potafos. 1997. Available online: https://books.google.com.sg/books/about/Avalia%C3%A7%C3%A3o_do_estado_nutricional_das_pl.html?hl=pt-BR&id=Lu9EAAAAYAAJ&redir_esc=y (accessed on 18 October 2022).
  25. Fernandes, A.C. Cálculos na Agroindústria da Cana-de-açúcar; Sociedade dos Técnicos Açucareiros e Alcooleiros do Brasil: Piracicaba, Brazil, 2011. [Google Scholar]
  26. SAS® SAS OnDemand for Academics. Available online: https://welcome.oda.sas.com/home (accessed on 9 February 2022).
  27. Pimentel-Gomes, F. Curso de Estatistica Experimental, 15th ed.; ESALQ: Piracicaba, Brazil, 2009; ISBN 978-85-7133-055-9. [Google Scholar]
  28. van Raij, B.; Cantarella, H.; Quaggio, J.A.; Furlani, Â.M.C. Recomendações de Adubação e Calagem para o Estado de São Paulo; IAC: Campinas, Brazil, 1997; pp. 173–251. [Google Scholar]
  29. de Gazola, R.N.; Buzetti, S.; Dinalli, R.P.; Teixeira Filho, M.C.M.; de Celestrino, T.S. Efeito residual da aplicação de fosfato monoamônio revestido por diferentes polímeros na cultura de milho. Rev. Ceres 2013, 60, 876–884. [Google Scholar] [CrossRef] [Green Version]
  30. Bortolon, L.; Gianello, C. Simultaneous Multielement Extraction with the Mehlich-1 Solution for Southern Brazilian Soils Determined by ICP-OES and the Effects on the Nutrients Recommendations to Crops. Rev. Bras. Ciência Solo 2010, 34, 125–132. [Google Scholar] [CrossRef] [Green Version]
  31. Chagas, W.F.T.; Emrich, E.B.; Guelfi, D.R.; Caputo, A.L.C.; Faquin, V. Productive characteristics, nutrition and agronomic efficiency of polymer-coated MAP in lettuce crops. Rev. Ciência Agronômica 2015, 46, 266–276. [Google Scholar] [CrossRef] [Green Version]
  32. Schlindwein, J.A.; Gianello, C. Nível de Suficiência e Índice de Equivalência Entre o Fósforo Determinado Pelos Métodos da Resina de Troca Iônica e Mehilch-1. Curr. Agric. Sci. Technol. 2008, 14, 299–306. [Google Scholar] [CrossRef]
  33. Schlindwein, J.A.; Bortolon, L. Soil Phosphorus Available for Crops and Grasses Extracted with Three Soil-Test Methods in Southern Brazilian Soils Amended with Phosphate Rock. Commun. Soil Sci. Plant Anal. 2011, 42, 283–292. [Google Scholar] [CrossRef]
  34. de Freitas, I.F.; Novais, R.F.; de Villani, E.M.A.; Novais, S.V. Phosphorus Extracted by Ion Exchange Resins and Mehlich-1 from Oxisols (Latosols) Treated with Different Phosphorus Rates and Sources for Varied Soil-Source Contact Periods. Rev. Bras. Ciênc. Solo 2013, 37, 667–677. [Google Scholar] [CrossRef] [Green Version]
  35. Mumbach, G.L.; de Oliveira, D.A.; Warmling, M.I.; Gatiboni, L.C. Phosphorus Extraction by Mehlich 1, Mehlich 3 and Anion Exchange Resin in Soils with Different Clay Contents. Rev. Ceres 2018, 65, 546–554. [Google Scholar] [CrossRef] [Green Version]
  36. Crusciol, C.A.C.; Mancuso, M.A.C.; Garcia, R.A.; Castro, G.S.A. Crescimento radicular e aéreo de cultivares de arroz de terras altas em função da calagem. Bragantia 2012, 71, 256–263. [Google Scholar] [CrossRef] [Green Version]
  37. Lefèvre, I.; Ziebel, J.; Guignard, C.; Hausman, J.-F.; Rosales, R.O.G.; Bonierbale, M.; Hoffmann, L.; Schafleitner, R.; Evers, D. Drought Impacts Mineral Contents in Andean Potato Cultivars. J. Agron. Crop Sci. 2012, 198, 196–206. [Google Scholar] [CrossRef]
  38. Carneiro, F.M.; Furlani, C.E.A.; Ormond, A.T.S.; Kazama, E.H.; Silva, R.P. da Mechanized Fertilization: Individual Application of Nitrogen, Phosphorus and Potassium in Sugarcane. Rev. Ciênc. Agron. 2017, 48, 278–287. [Google Scholar] [CrossRef]
  39. de Vasconcelos, A.C.M.; Dionardo-Miranda, L. Dinâmica do desenvolvimento radicular da cana-de-açúcar e implicações no controle de nematóides, 2nd ed.; Revista e Ampliada: Campinas, Brazil, 2011; ISBN 978-85-87645-48-7. [Google Scholar]
  40. Simões, W.L.; Calgaro, M.; Guimarães, M.J.M.; de Oliveira, A.R.; Pinheiro, M.P.M.A. Sugarcane crops with controlled water deficit in the submiddle são francisco valley, Brazil. Rev. Caatinga 2018, 31, 963–971. [Google Scholar] [CrossRef] [Green Version]
  41. Marschner, H. Marschner’s Mineral Nutrition of Higher Plants-3rd Edition. Available online: https://www.elsevier.com/books/marschners-mineral-nutrition-of-higher-plants/marschner/978-0-12-384905-2 (accessed on 22 May 2020).
  42. Calheiros, A.; Oliveira, M.; Ferreira, V.; Barbosa, G.; Costa, J.; Lima, G.; Aristides, E. Acúmulo de Nutrientes e Produção de Sacarose de Duas Variedades de Cana-de-Açúcar Na Primeira Rebrota, Em Função de Doses de Fósforo. STAB 2011, 29, 4. [Google Scholar]
  43. Inman-Bamber, N.G. Sugarcane Water Stress Criteria for Irrigation and Drying Off. Field Crops Res. 2004, 89, 107–122. [Google Scholar] [CrossRef]
  44. Araújo, R.; Alves Junior, J.; Casaroli, D.; Evangelista, A.W.P. Variation in the sugar yield in response to drying-off of sugarcane before harvest and the occurrence of low air temperatures. Bragantia 2016, 75, 118–127. [Google Scholar] [CrossRef] [Green Version]
  45. Simões Neto, D.E.; de Oliveira, A.C.; Freire, F.J.; dos Freire, M.B.G.S.; do Nascimento, C.W.A.; Rocha, A.T. da Extração de fósforo em solos cultivados com cana-de-açúcar e suas relações com a capacidade tampão. Rev. Bras. Eng. Agríc. Ambient. 2009, 13, 840–848. [Google Scholar] [CrossRef] [Green Version]
  46. Albuquerque, A.W.; de Sá, L.A.; Rodrigues, W.A.R.; Moura, A.B.; dos Oliveira, M.S. Growth and Yield of Sugarcane as a Function of Phosphorus Doses and Forms of Application. Rev. Bras. Eng. Agríc. Ambient. 2016, 20, 29–35. [Google Scholar] [CrossRef]
  47. de Gava, G.J.C.; de Silva, M.A.; da Silva, R.C.; Jeronimo, E.M.; Cruz, J.C.S.; Kölln, O.T. Produtividade de três cultivares de cana-de-açúcar sob manejos de sequeiro e irrigado por gotejamento. Rev. Bras. Eng. Agrícola Ambient. 2011, 15, 250–255. [Google Scholar] [CrossRef] [Green Version]
  48. de Abreu, M.L.; de Silva, M.A.; Teodoro, I.; de Holanda, L.A.; Sampaio Neto, G.D. Crescimento e produtividade de cana-de-açúcar em função da disponibilidade hídrica dos Tabuleiros Costeiros de Alagoas. Bragantia 2013, 72, 262–270. [Google Scholar] [CrossRef]
  49. Trenkel, M.E. Slow- and Controlled-Release and Stabilized Fertilizers: An Option for Enhancing Nutrient Use Efficiency in Agriculture, 2nd ed.; International Fertilizer Industry Association (IFA): Paris, France, 2010; ISBN 978-2-9523139-7-1. [Google Scholar]
  50. Briassoulis, D.; Dejean, C. Critical Review of Norms and Standards for Biodegradable Agricultural Plastics Part Ι. Biodegradation in Soil. J. Polym. Environ. 2010, 18, 384–400. [Google Scholar] [CrossRef]
  51. Guelfi, D.R.; Chagas, W.F.T.; Lacerda, J.R.; Chagas, R.M.R.; de Souza, T.L.; Andrade, A.B. Monoammonium Phosphate Coated with Polymers and Magnesium for Coffee Plants. Ciênc. Agrotec. 2018, 42, 261–270. [Google Scholar] [CrossRef] [Green Version]
  52. Pelá, A.; Ribeiro, M.A.; Bento, R.U.; Cirino, L.H.; Reis Júnior, R.A. Enhanced-Efficiency Phosphorus Fertilizer: Promising Technology for Carrot Crop. Hortic. Bras. 2018, 36, 492–497. [Google Scholar] [CrossRef]
  53. Pelá, A.; Bento, R.U.; Crispim, L.B.R.; dos Reis, R.A., Jr. Enhanced efficiency of Phosphorus fertilizer in Soybean and Maize. Aust. J. Crop Sci. 2019, 13, 1638–1642. [Google Scholar] [CrossRef]
Figure 1. Location of the experimental area under sugarcane, Ouro Verde—SP, Brazil.
Agronomy 12 02817 g001
Figure 2. Weather conditions in the growing seasons 2018/19 (a) and 2019/20 (b).
Agronomy 12 02817 g002
Figure 3. Phosphorus content in soil in response to fertilization with different phosphorus rates with and without Policote coating, extracted by P-Resin from the layer 0–0.10 m (a,e) and 0.10–0.20 m (c,g), and by Mehlich-1 from the layer 0–0.10 m (b,f) and 0.10–0.20 m (d,h). Growing seasons 2018/2019 and 2019/2020.
Agronomy 12 02817 g003aAgronomy 12 02817 g003b
Figure 4. Stalks and TRS yield in the second ratoon (a,c) and in the third ratoon crop (b,d) of sugarcane fertilized with phosphorus rates and sources without or with Policote coating in two sugarcane production cycles. Growing seasons 2018/2019 and 2019/2020. Different letters indicate significant differences according to Tukey’s test (p < 0.05), nsp > 0.05.
Agronomy 12 02817 g004
Table 1. Soil physical and chemical properties at the beginning of the study in 2018.
LayerpH
CaCl2
OMPKCaMgAlH + AlBSCEC
mg kg−1mg dm−3mmolc dm−3
0–0.104.9910.05.191.0310.913.8211515.7630.76
0.10–0.204.867.027.020.369.983.9211514.2629.26
0.20–0.405.597.236.970.0810.656.2301216.9628.96
SandSiltClayVmSBCuFeMnZn
g kg−1%mg dm−3
0–0.108224613251.25.973.880.180.7734.628.500.58
0.10–0.208463212248.76.555.280.170.8143.988.910.69
0.20–0.408047312365.606.620.120.8127.205.660.53
OM: organic matter; BS: sum of base; CEC: cation exchange capacity; V: base saturation; m: aluminum saturation.
Table 2. Mean soil phosphorus contents extracted with P-Resin and Mehlich-1 after sugarcane cultivation in the second and third ratoon crops fertilized with phosphorus sources with and without Policote coating. Growing seasons 2018/2019 and 2019/2020.
Fertilizer SourcesP-ResinMehlich-1
Third RatoonSecond RatoonThird Ratoon
0–0.10 m0–0.10 m0.10–0.20 m0–0.10 m0.10–0.20 m
mg dm−3
Uncoated MAP10.89 b17.2417.36 b18.19 b16.65 b
MAP + Policote12.72 a18.6119.90 a24.26 a18.79 a
p-value0.0149 *0.332 ns0.0018 **0.0001 ***0.0001 ***
Different letters within a column indicate significant differences according to Tukey’s test. *, **, *** and ns indicate p < 0.05, p < 0.01, p < 0.001 and nsp > 0.05, respectively.
Table 3. Mean levels of macronutrients (leaf + 1) in two sugarcane cycles. Growing seasons 2018/2019 and 2019/2020.
RatoonNPKCaMgS
g kg−1
Second17.87 a1.68 b14.62 a6.98 b1.43 b1.08
Third12.65 b2.41 a7.35 b7.95 a2.00 a1.15
p-value0.0002 ***0.003 **0.0001 ***0.0132 *0.005 **0.5682 ns
Different letters within a column indicate significant differences according to Tukey’s test. *, **, *** and ns indicate p < 0.05, p < 0.01, p < 0.001 and nsp > 0.05, respectively.
Table 4. Mean values of stalk technology quality parameters in two sugarcane ratoons. Growing seasons 2018/2019 and 2019/2020.
RatoonBrixFiberMoisturePOLPCPurityRSTRS
%kg t−1
Second15.06 b11.64 b73.31 a15.40 b13.13 b87.17 ns0.55 ns131.47 b
Third16.49 a12.71 a70.80 b17.53 a14.66 a88.910.50145.72 a
p-value0.003 **0.001 **0.0008 ***0.003 **0.06 **0.1262 ns0.073 ns0.006 **
PC: pol in cane; RS: reducing sugars in juice; TRS: total recoverable sugar. Different letters within a column indicate significant differences according to Tukey’s test. **, *** and ns indicate p < 0.01, p < 0.001 and nsp > 0.05, respectively.
Publisher’s Note: MDPI stays neutral with regard to jurisdictional claims in published maps and institutional affiliations.

