
Methane and Nitrous Oxide Fluxes with Different Land Uses in the Temperate Meadow Steppe of Inner Mongolia, China
Abstract
:1. Introduction
2. Materials and Methods
2.1. Site Description
2.2. Experimental Design
2.3. Gas Flux Measurements
2.4. Auxiliary Measurements
2.5. Plant Biomass and Soil Characteristics
2.6. Statistical Analyses
3. Results
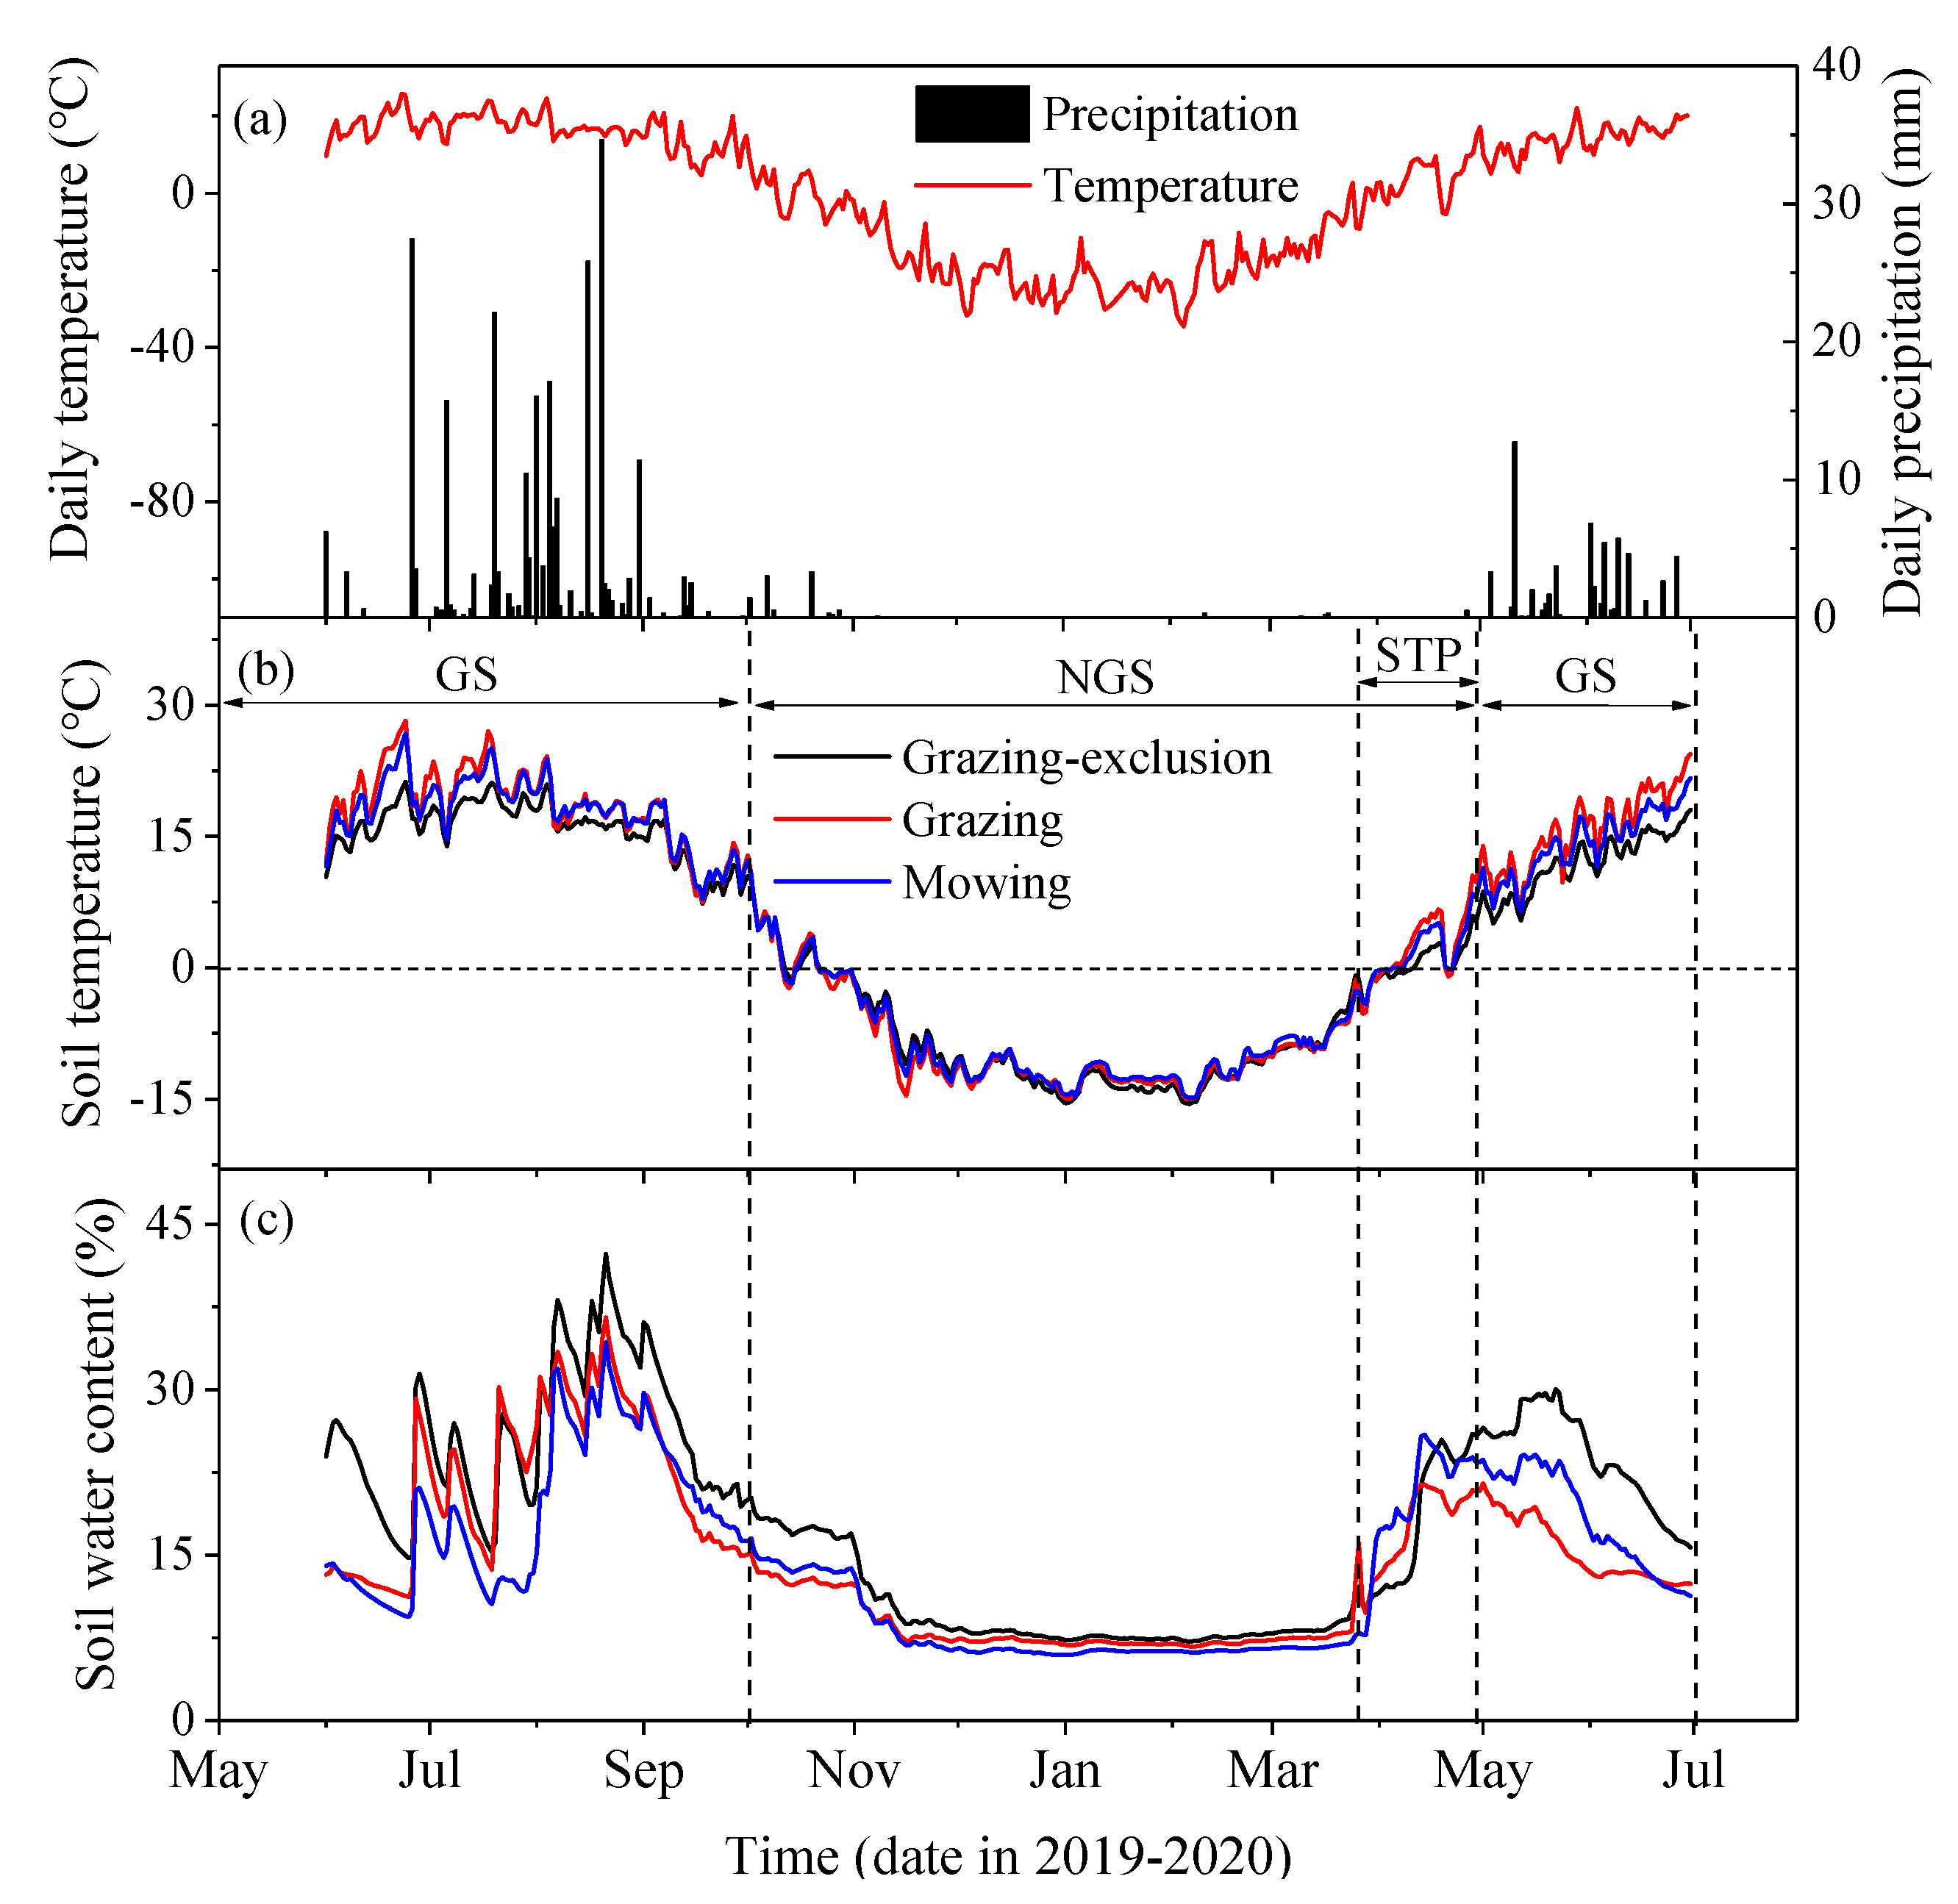
3.1. Environment
3.2. Soil and Vegetation Condition
3.3. Freeze–Thaw Cycles
3.4. Characteristics of CH4 and N2O Fluxes
3.5. Effects of Environmental Factors on the Fluxes
4. Discussion
4.1. STP and Freeze–Thaw Cycles
4.2. Effect of Grazing and Mowing on CH4 Fluxes
4.3. Effect of Grazing and Mowing on N2O Fluxes
5. Conclusions
Author Contributions
Funding
Data Availability Statement
Conflicts of Interest
References
- IPCC. Climate Change 2013: The Physical Science Basis. Contribution of Working Group I to the Fifth Assessment Report of the Intergovernmental Panel on Climate Change; Stocker, T.F., Qin, D., Plattner, G.-K., Tignor, M., Allen, S.K., Boschung, J., Nauels, A., Xia, Y., Bex, V., Midgley, P.M., Eds.; Cambridge University Press: Cambridge, UK, 2013; p. 153. [Google Scholar]
- IPCC. Summary for policymakers. In Climate Change 2007: The Physical Science Basis. Contribution of Working Group I to the Fourth Assessment Report of the Intergovernmental Panel on Climate Change; Solomon, S., Qin, D., Manning, M., Chen, Z., Marquis, M., Averyt, K.B., Tignor, M., Miller, H., Eds.; Cambridge University Press: Cambridge, UK, 2007. [Google Scholar]
- Batjes, N.H. Mitigation of Atmospheric CO2 Concentrations by Increased Carbon Sequestration in the Soil. Biol. Fertil. Soils 1998, 27, 230–235. [Google Scholar] [CrossRef]
- Schönbach, P.; Wolf, B.; Dickhöfer, U.; Wiesmeier, M.; Chen, W.; Wan, H.; Gierus, M.; Butterbach-Bahl, K.; Kögel-Knabner, I.; Susenbeth, A.; et al. Grazing Effects on the Greenhouse Gas Balance of a Temperate Steppe Ecosystem. Nutr. Cycl. Agroecosyst. 2012, 93, 357–371. [Google Scholar] [CrossRef]
- Skiba, U.; Jones, S.K.; Drewer, J.; Helfter, C.; Anderson, M.; Dinsmore, K.; McKenzie, R.; Nemitz, E.; Sutton, M.A. Comparison of Soil Greenhouse Gas Fluxes from Extensive and Intensive Grazing in a Temperate Maritime Climate. Biogeosciences 2013, 10, 1231–1241. [Google Scholar] [CrossRef] [Green Version]
- Wang, Y.; Chen, H.; Zhu, Q.; Peng, C.; Wu, N.; Yang, G.; Zhu, D.; Tian, J.; Tian, L.; Kang, X.; et al. Soil Methane Uptake by Grasslands and Forests in China. Soil Biol. Biochem. 2014, 74, 70–81. [Google Scholar] [CrossRef]
- Zhong, X.; Zhou, X.; Fei, J.; Wu, Y.; Cao, R.; Huang, Y.; Peng, J. Gained Net Ecosystem Economic Benefit in Machine-Transplanted Double-Cropped Rice Strategies. Nutr. Cycl. Agroecosyst. 2022, 124, 1–15. [Google Scholar] [CrossRef]
- Smith, K.A.; Dobbie, K.; Ball, B.; Bakken, L.; Sitaula, B.; Hansen, S.; Brumme, R.; Borken, W.; Christensen, S.; Priemé, A.; et al. Oxidation of Atmospheric Methane in Northern European Soils, Comparison with Other Ecosystems, and Uncertainties in the Global Terrestrial Sink. Glob. Chang. Biol. 2000, 6, 791–803. [Google Scholar] [CrossRef]
- Zhang, L.; Guo, D.; Niu, S.; Wang, C.; Shao, C.; Li, L. Effects of Mowing on Methane Uptake in a Semiarid Grassland in Northern China. PLoS ONE 2012, 7, e35952. [Google Scholar] [CrossRef] [Green Version]
- Yin, M.; Gao, X.; Tenuta, M.; Li, L.; Gui, D.; Li, X.; Zeng, F. Enhancement of N2O Emissions by Grazing Is Related to Soil Physicochemical Characteristics Rather than Nitrifier and Denitrifier Abundances in Alpine Grassland. Geoderma 2020, 375, 114511. [Google Scholar] [CrossRef]
- Zumft, W.G. Cell Biology and Molecular Basis of Denitrification. Microbiol. Mol. Biol. Rev. MMBR 1997, 61, 533–616. [Google Scholar] [CrossRef]
- Holst, J.; Liu, C.; Yao, Z.; Brüggemann, N.; Zheng, X.; Han, X.; Butterbach-Bahl, K. Importance of Point Sources on Regional Nitrous Oxide Fluxes in Semi-Arid Steppe of Inner Mongolia, China. Plant Soil 2007, 296, 209–226. [Google Scholar] [CrossRef]
- Zhong, L.; Du, R.; Ding, K.; Kang, X.; Li, F.Y.; Bowatte, S.; Hoogendoorn, C.J.; Wang, Y.; Rui, Y.; Jiang, L.; et al. Effects of Grazing on N2O Production Potential and Abundance of Nitrifying and Denitrifying Microbial Communities in Meadow-Steppe Grassland in Northern China. Soil Biol. Biochem. 2014, 69, 1–10. [Google Scholar] [CrossRef]
- Longyu, H.; Zhifang, G.; Wang, J.-M.; Wang, B.; Zhou, S.; Li, L.-H. Growing Season in Situ Uptake of Atmospheric Methane by Desert Soils in a Semiarid Region of Northern China. Geoderma 2012, 189, 415–422. [Google Scholar] [CrossRef]
- Li, K.; Gong, Y.; Song, W.; Lv, J.; Chang, Y.; Hu, Y.; Tian, C.; Christie, P.; Liu, X. No Significant Nitrous Oxide Emissions during Spring Thaw under Grazing and Nitrogen Addition in an Alpine Grassland. Glob. Chang. Biol. 2012, 18. [Google Scholar] [CrossRef]
- Yan, Y.; Wan, Z.; Ganjurjav, H.; Yang, J.; Hu, G.; Gao, Q.; Zou, J.; Liu, G.; Quan, W.; Wen, L. Nitrogen Deposition Reduces Methane Uptake in Both the Growing and Non-Growing Season in an Alpine Meadow. Sci. Total Environ. 2020, 747, 141315. [Google Scholar] [CrossRef]
- LeCain, D.R.; Morgan, J.A.; Schuman, G.E.; Reeder, J.D.; Hart, R.H. Carbon Exchange and Species Composition of Grazed Pastures and Exclosures in the Shortgrass Steppe of Colorado. Agric. Ecosyst. Environ. 2002, 93, 421–435. [Google Scholar] [CrossRef]
- Chen, W.; Wolf, B.; Zheng, X.; Yao, Z.; Butterbach-Bahl, K.; Brüggemann, N.; Liu, C.; Han, S.; Han, X.-G. Annual Methane Uptake by Temperate Semiarid Steppes as Regulated by Stocking Rates, Aboveground Plant Biomass and Topsoil Air Permeability. Glob. Chang. Biol. 2011, 17, 2803–2816. [Google Scholar] [CrossRef]
- Steffens, M.; Kölbl, A.; Totsche, K.U.; Kögel-Knabner, I. Grazing Effects on Soil Chemical and Physical Properties in a Semiarid Steppe of Inner Mongolia (P.R. China). Geoderma 2008, 143, 63–72. [Google Scholar] [CrossRef]
- Liu, N.; Kan, H.; Yang, G.; Zhang, Y. Changes in Plant, Soil, and Microbes in a Typical Steppe from Simulated Grazing: Explaining Potential Change in Soil C. Ecol. Monogr. 2015, 85, 150119064717001. [Google Scholar] [CrossRef]
- Herrero, M.; Henderson, B.; Havlík, P.; Thornton, P.K.; Conant, R.T.; Smith, P.; Wirsenius, S.; Hristov, A.N.; Gerber, P.; Gill, M.; et al. Greenhouse Gas Mitigation Potentials in the Livestock Sector. Nat. Clim. Chang. 2016, 6, 452–461. [Google Scholar] [CrossRef] [Green Version]
- Wang, B.; Lerdau, M.; He, Y. Widespread Production of Non-Microbial Greenhouse Gases in Soils. Glob. Chang. Biol. 2017, 23. [Google Scholar] [CrossRef]
- Gao, D.; Zhang, L.; Liu, J.; Peng, B.; Fan, Z.; Dai, W.; Jiang, P.; Bai, E. Responses of Terrestrial Nitrogen Pools and Dynamics to Different Patterns of Freeze-Thaw Cycle: A Meta-Analysis. Glob. Chang. Biol. 2017, 24. [Google Scholar] [CrossRef] [PubMed]
- Zhong, L.; Li, F.Y.; Wang, Y.; Zhou, X.; Zhou, S.; Gong, X.; Bai, Y. Mowing and Topography Effects on Microorganisms and Nitrogen Transformation Processes Responsible for Nitrous Oxide Emissions in Semi-Arid Grassland of Inner Mongolia. J. Soils Sediments 2018, 18, 929–935. [Google Scholar] [CrossRef]
- Blagodatsky, S.; Smith, P. Soil Physics Meets Soil Biology: Towards Better Mechanistic Prediction of Greenhouse Gas Emissions from Soil. Soil Biol. Biochem. 2012, 47, 78–92. [Google Scholar] [CrossRef]
- Bai, Y.; Wu, J.; Clark, C.; Pan, Q.; Zhang, L.; Chen, S.; Wang, Q.; Han, X.-G. Grazing Alters Ecosystem Functioning and C:N:P Stoichiometry of Grasslands along a Regional Precipitation Gradient. J. Appl. Ecol. 2012, 49, 1204–1215. [Google Scholar] [CrossRef]
- Wolf, B.; Zheng, X.; Brüggemann, N.; Chen, W.; Dannenmann, M.; Han, X.-G.; Sutton, M.; Wu, H.; Yao, Z.; Butterbach-Bahl, K. Grazing-Induced Reduction of Natural Nitrous Oxide Release from Continental Steppe. Nature 2010, 464, 881–884. [Google Scholar] [CrossRef]
- Zhou, X.-Q.; Wang, Y.-F.; Huang, X.-Z.; Hao, Y.-B.; Tian, J.-Q.; Wang, J.-Z. Effects of Grazing by Sheep on the Structure of Methane-Oxidizing Bacterial Community of Steppe Soil. Soil Biol. Biochem. 2008, 40, 258–261. [Google Scholar] [CrossRef]
- Han, G.; Hao, X.; Zhao, M.; Wang, M.; Ellert, B.H.; Willms, W.; Wang, M. Effect of Grazing Intensity on Carbon and Nitrogen in Soil and Vegetation in a Meadow Steppe in Inner Mongolia. Agric. Ecosyst. Environ. 2008, 125, 21–32. [Google Scholar] [CrossRef]
- Gi, M.; Brueck, H.; Gao, Y.; Lin, S.; Steffens, M.; Kögel-Knabner, I.; Glindemann, T.; Susenbeth, A.; Taube, F.; Butterbach-Bahl, K.; et al. N Balance and Cycling of Inner Mongolia Typical Steppe: A Comprehensive Case Study of Grazing Effects. Ecol. Monogr. 2013, 83, 195–219. [Google Scholar] [CrossRef]
- de Klein, C.A.; Shepherd, M.A.; van der Weerden, T.J. Nitrous Oxide Emissions from Grazed Grasslands: Interactions between the N Cycle and Climate Change—A New Zealand Case Study. SI Syst. Dyn. Sustain. 2014, 9-10, 131–139. [Google Scholar] [CrossRef]
- Priemé, A.; Christensen, S. Natural Perturbations, Drying–Wetting and Freezing–Thawing Cycles, and the Emission of Nitrous Oxide, Carbon Dioxide and Methane from Farmed Organic Soils. Soil Biol. Biochem. 2001, 33, 2083–2091. [Google Scholar] [CrossRef]
- Xu, Y.; Wan, S.; Cheng, W.; Li, L. Impacts of Grazing Intensity on Denitrification and N2O Production in a Semi-Arid Grassland Ecosystem. Biogeochemistry 2008, 88, 103–115. [Google Scholar] [CrossRef]
- Lu, Z.; Du, R.; Du, P.; Li, Z.; Liang, Z.; Wang, Y.; Qin, S.; Zhong, L. Effect of Mowing on N2O and CH4 Fluxes Emissions from the Meadow-Steppe Grasslands of Inner Mongolia. Front. Earth Sci. 2015, 9, 473–486. [Google Scholar] [CrossRef]
- Akiyama, T.; Kawamura, K. Grassland Degradation in China: Methods of Monitoring, Management and Restoration. Grassl. Sci. 2007, 53, 1–17. [Google Scholar] [CrossRef]
- Liang, E.; Vennetier, M.; Lin, J.; Shao, X. Relationships between Tree Increment, Climate and above-Ground Biomass of Grass: A Case Study in the Typical Steppe, North China. Acta Oecol. 2003, 24, 87–94. [Google Scholar] [CrossRef]
- Kreyling, J.; Beierkuhnlein, C.; Pritsch, K.; Schloter, M.; Jentsch, A. Recurrent Soil Freeze-Thaw Cycles Enhance Plant Productivity. New Phytol. 2008, 177, 938–945. [Google Scholar] [CrossRef]
- Yang, X.; Chen, H.; Gong, Y.; Zheng, X.; Fan, M.; Kuzyakov, Y. Nitrous Oxide Emissions from an Agro-Pastoral Ecotone of Northern China Depending on Land Uses. Agric. Ecosyst. Environ. 2015, 213, 241–251. [Google Scholar] [CrossRef]
- Chen, Z.; Li, Y.; Xu, Y.; Lam, S.K.; Xia, L.; Zhang, N.; Castellano, M.J.; Ding, W. Spring Thaw Pulses Decrease Annual N2O Emissions Reductions by Nitrification Inhibitors from a Seasonally Frozen Cropland. Geoderma 2021, 403, 115310. [Google Scholar] [CrossRef]
- Fu, Y.; Liu, C.; Lin, F.; Hu, X.; Zheng, X.; Zhang, W.; Cao, G. Quantification of Year-Round Methane and Nitrous Oxide Fluxes in a Typical Alpine Shrub Meadow on the Qinghai-Tibetan Plateau. Agric. Ecosyst. Environ. 2018, 255, 27–36. [Google Scholar] [CrossRef]
- Li, J.; Zhao, Y.; Zhang, A.; Song, B.; Hill, R.L. Effect of Grazing Exclusion on Nitrous Oxide Emissions during Freeze-Thaw Cycles in a Typical Steppe of Inner Mongolia. Agric. Ecosyst. Environ. 2021, 307, 107217. [Google Scholar] [CrossRef]
- Liu, C.; Zheng, X.; Zhou, Z.; Han, S.; Wang, Y.; Wang, K.; Liang, W.; Li, M.; Chen, D.; Yang, Z. Nitrous Oxide and Nitric Oxide Emissions from an Irrigated Cotton Field in Northern China. Plant Soil 2010, 332, 123–134. [Google Scholar] [CrossRef]
- Liu, C.; Wang, K.; Zheng, X. Effects of Nitrification Inhibitors (DCD and DMPP) on Nitrous Oxide Emission, Crop Yield and Nitrogen Uptake in a Wheat–Maize Cropping System. Biogeosciences 2013, 10, 2427–2437. [Google Scholar] [CrossRef] [Green Version]
- Alves, B.J.R.; Smith, K.A.; Flores, R.A.; Cardoso, A.S.; Oliveira, W.R.D.; Jantalia, C.P.; Urquiaga, S.; Boddey, R.M. Selection of the Most Suitable Sampling Time for Static Chambers for the Estimation of Daily Mean N2O Flux from Soils. Soil Biol. Biochem. 2012, 46, 129–135. [Google Scholar] [CrossRef]
- He, H.; Li, D.; Pan, F.; Wu, Z.; Wang, F.; Wu, D.; Wu, S.; Yang, S.; Ma, Y. Effects of Drainage on Greenhouse Gas Emissions and Yields of Lowland Rice—Wheat Rotation System in East China. Agronomy 2022, 12, 1932. [Google Scholar] [CrossRef]
- Gao, W.; Yao, Y.; Gao, D.; Wang, H.; Song, L.; Sheng, H.; Cai, T.; Liang, H. Responses of N2O Emissions to Spring Thaw Period in a Typical Continuous Permafrost Region of the Daxing’an Mountains, Northeast China. Atmos. Environ. 2019, 214, 116822. [Google Scholar] [CrossRef]
- Bochove, E.; Pre´vost, D.; Pelletier, F. Effects of Freeze–Thaw and Soil Structure on Nitrous Oxide Produced in a Clay Soil. Soil Sci. Soc. Am. J. SSSAJ 2000, 64. [Google Scholar] [CrossRef]
- Goldberg, S.; Borken, W.; Gebauer, G. N2O Emission in a Norway Spruce Forest Due to Soil Frost: Concentration and Isotope Profiles Shed a New Light on an Old Story. Biogeochemistry 2010, 97, 21–30. [Google Scholar] [CrossRef]
- Martin, R.E.; Scholes, M.C.; Mosier, A.R.; Ojima, D.S.; Holland, E.A.; Parton, W.J. Controls on Annual Emissions of Nitric Oxide from Soils of the Colorado Shortgrass Steppe. Glob. Biogeochem. Cycles 1998, 12, 81–91. [Google Scholar] [CrossRef]
- Mosier, A.; Parton, W.; Valentine, D.; Ojima, D.; Schimel, D.; Heinemeyer, O. CH4 and N2O Fluxes in the Colorado Shortgrass Steppe: 2. Long-Term Impact of Land Use Change. Glob. Biogeochem. Cycles 1997, 11, 29–42. [Google Scholar] [CrossRef]
- Singh, B.K.; Tate, K. Biochemical and Molecular Characterization of Methanotrophs in Soil from a Pristine New Zealand Beech Forest. FEMS Microbiol. Lett. 2007, 275, 89–97. [Google Scholar] [CrossRef] [Green Version]
- Liu, C.; Holst, J.; Brüggemann, N.; Butterbach-Bahl, K.; Yao, Z.; Yue, J.; Han, S.; Han, X.; Krümmelbein, J.; Horn, R.; et al. Winter-Grazing Reduces Methane Uptake by Soils of a Typical Semi-Arid Steppe in Inner Mongolia, China. Atmos. Environ. 2007, 41, 5948–5958. [Google Scholar] [CrossRef]
- Menyailo, O.; Hungate, B.; Abraham, W.-R.; CONRAD, R. Changing Land Use Reduces Soil CH4 Uptake by Altering Biomass and Activity but Not Composition of High-Affinity Methanotrophs. Glob. Chang. Biol. 2008, 14, 2405–2419. [Google Scholar] [CrossRef]
- Wang, Y.; Xue, M.; Zheng, X.; Ji, B.; Du, R.; Wang, Y. Effects of Environmental Factors on N2O Emission from and CH4 Uptake by the Typical Grasslands in the Inner Mongolia. Chemosphere 2005, 58, 205–215. [Google Scholar] [CrossRef]
- Peichl, M.; ARAIN, M.; Ullah, S.; Moore, T. Carbon Dioxide, Methane, and Nitrous Oxide Exchanges in an Age-Sequence of Temperate Pine Forests. Glob. Chang. Biol. 2009, 16, 2198–2212. [Google Scholar] [CrossRef]
- Chen, W.; Wolf, B.; Yao, Z.; Brüggemann, N.; Butterbach-Bahl, K.; Liu, C.; Han, S.; Han, X.-G.; Zheng, X. Annual Methane Uptake by Typical Semiarid Steppe in Inner Mongolia. J. Geophys. Res. 2010, 115. [Google Scholar] [CrossRef] [Green Version]
- Groffman, P.; Hardy, J.; Driscoll, C.; FAHEY, T. Snow Depth, Soil Freezing, and Fluxes of Carbon Dioxide, Nitrous Oxide and Methane in a Northern Hardwood Forest. Glob. Chang. Biol. 2006, 12, 1748–1760. [Google Scholar] [CrossRef] [Green Version]
- Ding, W.; Cai, Z. Effect of Temperature on Methane Production and Oxidation in Soils. Ying Yong Sheng Tai Xue Bao J. Appl. Ecol. Zhongguo Sheng Tai Xue Xue Hui Zhongguo Ke Xue Yuan Shenyang Ying Yong Sheng Tai Yan Jiu Suo Zhu Ban 2003, 14, 604–608. [Google Scholar]
- Curry, C.; van der Kamp, D.; Dunkley, R. Modelling the Soil Consumption of Atmospheric Methane; Canadian Meteorological and Oceanographic Society: Ottawa, ON, Canada, 2005. [Google Scholar]
- Le Mer, J.; Roger, P. Production, Oxidation, Emission and Consumption of Methane by Soils: A Review. Eur. J. Soil Biol. 2001, 37, 25–50. [Google Scholar] [CrossRef]
- Butterbach-Bahl, K.; Wolf, B. Greenhouse Gases: Warming from Freezing Soils. Nat. Geosci. 2017, 10, 248–249. [Google Scholar] [CrossRef]
- Koschorreck, M.; Conrad, R. Oxidation of Atmospheric Methane in Soil: Measurements in the Field, in Soil Cores and in Soil Samples. Glob. Biogeochem. Cycles 1993, 7, 109–122. [Google Scholar] [CrossRef]
- Steinkamp, R.; Butterbach-Bahl, K.; Papen, H. Methane Oxidation by Soils of an N Limited and N Fertilized Spruce Forest in the Black Forest, Germany. Soil Biol. Biochem. 2001, 33, 145–153. [Google Scholar] [CrossRef]
- Kähkönen, M.A.; Wittmann, C.; Ilvesniemi, H.; Westman, C.J.; Salkinoja-Salonen, M.S. Mineralization of Detritus and Oxidation of Methane in Acid Boreal Coniferous Forest Soils: Seasonal and Vertical Distribution and Effects of Clear-Cut. Soil Biol. Biochem. 2002, 34, 1191–1200. [Google Scholar] [CrossRef]
- Castro, M.S. Effects of Nitrogen Fertilization on the Fluxes of N2O, CH4, and CO2 from Soils in a Florida Slash Pine Plantation. Can. J. For. Res. 1994, 24, 9–13. [Google Scholar] [CrossRef]
- Nesbit, S.P.; Breitenbeck, G.A. A Laboratory Study of Factors Influencing Methane Uptake by Soils. Agric. Ecosyst. Environ. 1992, 41, 39–54. [Google Scholar] [CrossRef]
- Whiting, G.J.; Chanton, J.P. Primary Production Control of Methane Emission from Wetlands. Nature 1993, 364, 794–795. [Google Scholar] [CrossRef]
- Malla, G.; Bhatia, A.; Pathak, H.; Prasad, S.; Jain, N.; Singh, J. Mitigating Nitrous Oxide and Methane Emissions from Soil in Rice–Wheat System of the Indo-Gangetic Plain with Nitrification and Urease Inhibitors. Chemosphere 2005, 58, 141–147. [Google Scholar] [CrossRef] [PubMed]
- Zhu-Barker, X.; Burger, M.; Doane, T.; Horwath, W. Ammonia Oxidation Pathways and Nitrifier Denitrification Are Significant Sources of N2O and NO under Low Oxygen Availability. Proc. Natl. Acad. Sci. USA 2013, 110, 6328–6333. [Google Scholar] [CrossRef] [Green Version]
- Verchot, L.V.; Groffman, P.M.; Frank, D.A. Landscape versus Ungulate Control of Gross Mineralization and Gross Nitrification in Semi-Arid Grasslands of Yellowstone National Park. Soil Biol. Biochem. 2002, 34, 1691–1699. [Google Scholar] [CrossRef]
- Müller, C.; Martin, M.; Stevens, R.J.; Laughlin, R.J.; Kammann, C.; Ottow, J.C.G.; Jäger, H.-J. Processes Leading to N2O Emissions in Grassland Soil during Freezing and Thawing. Soil Biol. Biochem. 2002, 34, 1325–1331. [Google Scholar] [CrossRef]
- Schuman, G.E.; Reeder, J.D.; Manley, J.T.; Hart, R.H.; Manley, W.A. Impact of grazing management on the carbon and nitrogen balance of a mixed-grass rangeland. Ecol. Appl. 1999, 9, 65–71. [Google Scholar] [CrossRef]
- Wu, H.; Dannenmann, M.; Wolf, B.; Han, X.-G.; Zheng, X.; Butterbach-Bahl, K. Seasonality of Soil Microbial Nitrogen Turnover in Continental Steppe Soils of Inner Mongolia. Ecosphere 2012, 3, 34. [Google Scholar] [CrossRef]


| Land-Uses | BD (g·cm−3) | SOC (%) | TN (%) | NH4+-N (mg kg−1) | NO3−-N (mg kg−1) | AGB (g m−2) | BGB (g m−2) | Litter (g m−2) |
|---|---|---|---|---|---|---|---|---|
| GE | 0.75 ± 0.01 b | 2.70 ± 0.05 a | 0.27 ± 0.01 a | 5.23 ± 0.36 a | 8.65 ± 0.34 a | 148 ± 24 a | 1843 ± 223 a | 308 ± 27 a |
| G | 1.04 ± 0.04 a | 2.66 ± 0.13 a | 0.25 ± 0.01 a | 5.13 ± 0.62 a | 8.39 ± 1.28 a | 78 ± 7 b | 2772 ± 522 a | 20 ± 3 b |
| M | 0.80 ± 0.01 b | 2.50 ± 0.07 a | 0.26 ± 0.01 a | 4.44 ± 0.22 a | 5.12 ± 0.68 b | 91 ± 10 b | 2162 ± 283 a | 27 ± 4 b |
| Site | Greenhouse Gases | Optimum Regression Model | R2 | p |
|---|---|---|---|---|
| GE | CH4 | Y1 = −21.26 − 2.38X1 − 1.44X2 | 0.50 | <0.01 |
| N2O | Y2 = 24.37 + 0.75X1 | 0.10 | <0.05 | |
| G | CH4 | Y1 = −78.78 − 4.25X1 + 2.39X2 | 0.62 | <0.01 |
| N2O | Y2 = 20.79 + 0.31X1 | 0.07 | <0.05 | |
| M | CH4 | Y1 = −59.71 − 3.64X1 + 0.30X2 | 0.50 | <0.01 |
| N2O | Y2 = 17.69 + 0.63X1 | 0.12 | <0.05 |
Publisher’s Note: MDPI stays neutral with regard to jurisdictional claims in published maps and institutional affiliations. |
© 2022 by the authors. Licensee MDPI, Basel, Switzerland. This article is an open access article distributed under the terms and conditions of the Creative Commons Attribution (CC BY) license (https://creativecommons.org/licenses/by/4.0/).
Share and Cite
Fan, K.; Yan, Y.; Xu, D.; Li, S.; Zhao, Y.; Wang, X.; Xin, X. Methane and Nitrous Oxide Fluxes with Different Land Uses in the Temperate Meadow Steppe of Inner Mongolia, China. Agronomy 2022, 12, 2810. https://doi.org/10.3390/agronomy12112810
Fan K, Yan Y, Xu D, Li S, Zhao Y, Wang X, Xin X. Methane and Nitrous Oxide Fluxes with Different Land Uses in the Temperate Meadow Steppe of Inner Mongolia, China. Agronomy. 2022; 12(11):2810. https://doi.org/10.3390/agronomy12112810
Chicago/Turabian StyleFan, Kaikai, Yuchun Yan, Dawei Xu, Shuzhen Li, Yue Zhao, Xu Wang, and Xiaoping Xin. 2022. "Methane and Nitrous Oxide Fluxes with Different Land Uses in the Temperate Meadow Steppe of Inner Mongolia, China" Agronomy 12, no. 11: 2810. https://doi.org/10.3390/agronomy12112810