Article

Design and Validation of Automated Sensor-Based Artificial Ripening System Combined with Ultrasound Pretreatment for Date Fruits

by
Maged Mohammed
1,2,* and
Nashi K. Alqahtani
1,3
1
Date Palm Research Center of Excellence, King Faisal University, Al-Ahsa 31982, Saudi Arabia
2
Department of Agricultural and Biosystems Engineering, Faculty of Agriculture, Menoufia University, Shebin El Koum 32514, Egypt
3
Department of Food and Nutrition Sciences, College of Agricultural and Food Sciences, King Faisal University, Al-Ahsa 31982, Saudi Arabia
*
Author to whom correspondence should be addressed.
Agronomy 2022, 12(11), 2805; https://doi.org/10.3390/agronomy12112805
Submission received: 18 October 2022 / Revised: 7 November 2022 / Accepted: 9 November 2022 / Published: 10 November 2022
(This article belongs to the Special Issue Agricultural Automation and Innovative Agricultural Systems)

Abstract

:
Climate change affects fruit crops’ growth and development by delaying fruit ripening, reducing color development, and lowering fruit quality and yield. The irregular date palm fruit ripening in the past few years is assumed to be related to climatic change. The current study aimed to design and validate an automated sensor-based artificial ripening system (S-BARS) combined with ultrasound pretreatment for artificial ripening date fruits cv. Khalas. A sensor-based control system was constructed to allow continuous real-time recording and control over the process variables. The impact of processing variables, i.e., the artificial ripening temperature (ART-temp) and relative humidity (ART-RH) using the designed S-BARS combined with ultrasound pretreatment variables, i.e., time (USP-Time) and temperature (USP-Temp) on the required time for fruit ripening (RT), the percentage of ripened fruits (PORF), the percentage of damaged fruits (PODF), and the electrical energy consumption (EEC) were investigated. The quadratic predictive models were developed using the Box–Behnken Design (B-BD) to predict the RT, PORF, PODF, and EEC experimentally via Response Surface Methodology(RSM). Design Expert software (Version 13) was used for modeling and graphically analyzing the acquired data. The artificial ripening parameter values were determined by solving the regression equations and analyzing the 3D response surface plots. All parameters were simultaneously optimized by RSM using the desirability function. The Mean Absolute Percentage Error (MAPE) and the Root Mean Square Error (RMSE) between the predicted and actual experimental values were used to evaluate the developed models. The physicochemical properties of the ripened fruit were assessed under the optimization criteria. The results indicated that the pretreated unripe date fruits with 40 kHz ultrasound frequency, 110 W power, and USP-Temp of 32.49 °C for 32.03 min USP-Time under 60 °C ART-Temp and 59.98% ART-RH achieved the best results. The designed S-BARS precisely controlled the temperature and relative humidity at the target setpoints. The ultrasound pretreatment improved the color and density of the artificially ripened date fruits, decreased the RT and EEC, and increased the PORF without negatively affecting the studied fruit quality attributes. The developed models could effectively predict the RT, PORF, PODF, and EEC. The designed S-BARS combined with ultrasound pretreatment is an efficient approach for high-quality ripening date fruits.

1. Introduction

Date palm (Phoenix dactylifera L.) is one of the major crops significantly contributing to the agroecosystems in the Middle East and North Africa regions, notably in Saudi Arabia [1]. The cultivated area of date palm in Saudi Arabia is 0.15 million hectares, producing a 1.54 Mt yield [2]. There are six phases of date palm fruit development: Hababouk, Kimri, Khalal, Biser, Rutab, and Tamr. The Hababouk, Kimri, and Khalal are the initial stages of fruit development when date palm fruit is primarily green and inedible. The Biser stage is often called the late Khalal stage, when the fruit color is changed to yellow or red, depending on the cultivar. Most date palm cultivars are edible at the Rutab and Tamr stages when the fruit is partially or fully ripened, the sugars are high, and the moisture content is low [3,4,5]. The fruits of date palm, Phoenix dactylifera L., are rich in carbohydrates, dietary fiber, protein, minerals, fatty acids, and vitamins. It has significant antioxidant potential and contains polyphenols, anthocyanins, carotenoids, tannins, procyanidins, sterols, flavonols, flavones, anthocyanidins, and isoflavones. It also contains phenolic acids, cinnamic acid derivatives, and volatile compounds [6,7,8].
A phase change in date fruit development is spurred by the stimulation of the ripening process, which is supported by a major alteration in primary and secondary metabolism. The ripening process of fruits improves their taste and makes them more palatable. Generally, a fruit becomes softer, sweeter, and less green as it ripens [9,10,11]. Ethylene, a gas produced by the amino acid methionine involved with ripening, increases certain enzymes at the intracellular level, such as amylase, which hydrolyzes starch to make simple sugars, and pectinase, which hydrolyzes pectin to make fruit softer [12,13]. On the other hand, the analysis revealed the downregulation of the two enzymes involved in ethylene biosynthesis, indicating ethylene-independent ripening of date palm cv. Barhi [14]. To maximize their return on investment, cultivators must harvest ripe date palm fruits at the right time. Choosing the ideal fruit harvesting time is essential for obtaining the best dates in quantity and quality [15]. However, the date palm’s fruit ripening time varies depending on the cultivar. Ripening indices based on the most significant variations in physical and chemical properties that occur during the ripening process are crucial for determining the level of ripeness in a fruit [16,17]. Since date fruits do not ripen simultaneously, it takes several pickings to harvest them, which takes several weeks [18]. The term ‘uneven fruit ripening’ refers to the uneven ripening of individual fruits within a bunch or whole bunch and is distinguished by the presence of green or yellow unripe fruits [19]. In Saudi Arabia, uneven fruit ripening of date palms is a significant problem that often significantly declines overall crop production. Fruits at the Khalal or Biser stages of development remain green or yellow within a bunch, which are usually discarded and negatively affect a farm’s income [4,20].
Climate change affects fruit in their different stages of growth and development, such as inadequate pollination, fruit sunburn, delayed ripening, low sugar content, reduced color development, poor fruit quality and fruit set, and low fruit yield [21]. One of the most critical challenges related to climate change is the temperature rise. Any variation in the optimum climatic variables is likely to significantly impact the yield and quality of fruits. Studies have demonstrated that exposure to high temperatures, carbon dioxide, and ozone can directly and indirectly impact crop growth, yield, and quality [22,23]. An increase in temperature directly influences plant photosynthesis, affecting fruit firmness, antioxidant activity, sugars, organic acids, and flavonoids [24,25,26]. The fruits’ various growth stages are affected by climate change, which has a wide range of effects on fruits, including poor floral emergence, delayed maturation and ripening, poor fruit quality and color development, sunburn of the fruit, poor pollination and fruit set, etc. [27,28]. The selection of improved cultivars of crop species and improvements to cultural practices such as plant architectural alteration, water management, microclimate modifications, soil organic carbon buildup, etc., are all potential adaptation strategies to mitigate the harmful effects of climatic change [29,30].
Saudi Arabia has experienced irregular date palm fruit ripening in the past few years, which is assumed to be related to climatic change. The fruits usually fail to change their development stage from Biser to Rutab and Tamr, hence are merely wasted. Studies have been conducted to facilitate the ripening of unripe Biser fruits of date palm through artificial techniques. To hasten the ripening process artificially, date palm growers use several chemicals. The ripening of Khalal fruits of date palm cv. Dhakki treated with a sodium chloride [31] brine solution [32] was enhanced up to 75%. The unripe date palm fruits were ripened when dipped in salt and acetic acid solutions [33]. However, the impact of chemically induced artificial ripening has come under scrutiny due to several health-related concerns. To ripen the unripe date fruits, alternative fruit ripening methods that are simple, economical, and environmentally friendly gained interest. Using the microwave technique, the ripening time of unripe Khalal date fruits was reduced from 288 to 40 h at 480 W for 50 s [34].
Similarly, oven-drying and solar dehydration techniques are used to ripe partially ripe Rutab fruits [35]. Date palm fruits can be treated by heat for disinfestation or artificially ripened by a heat treatment that should not exceed 60 °C [20,36,37,38]. Date palm fruits could be frozen at –8 °C and then placed at 50 °C for 48 h to ripen unripe fruit artificially [33]. Date palm fruits of cv. Khalas at the Biser stage were artificially ripened without the expense of fruit quality when placed in an automated oven at 50 °C and 50% relative humidity [20]. In contemporary packing facilities, unripe dates are allowed to ripen in controlled environments with varied temperature and humidity levels depending on the cultivar [39]. However, these artificial ripening techniques consume high energy and take a long time. Therefore, to artificially accelerate fruit ripening, low-power-consumption processing techniques must be explored [20].
For fruit drying, various pretreatment techniques are adopted to inactivate bacterial and enzyme activity and prevent the product’s quality from degrading during storage. The pretreatment methods include hot air drying, vacuum freeze-drying, steaming, alkaline dips, freezing, sulfiting, blanching, and microwave techniques [40,41,42,43,44]. However, chemical pretreatment methods decline the quality of color and flavor, while heat pretreatment causes harmful changes to the quality attributes of fruit tissue [45,46,47,48]. Ultrasound pretreatment is a potential method for fruit drying, which is simple to use, consumes little heat and energy, and requires a short treatment time [49,50]. A pre-processing phase in the drying process for fruits and vegetables results in reversible membrane perforation, which indirectly improves dryer efficiency, conserves energy, and improves product quality [51]. The drying process is enhanced by ultrasonic power. Still, the extent of the improvement was greatly influenced by other process variables, such as air velocity, air temperature, power, vacuum pressure, etc. The use of ultrasound technology has an impact on food quality. Applying ultrasound can generally lower water activity, enhance fruit color, and minimize nutritional loss [52,53,54]. In a previous study, pretreating apple slices with an ultrasonic system (100 kHz for 5 min at 25 °C) before vacuum freeze-drying increased the drying rate by 25% and the rehydration rate [55]. The effective water diffusivity increased after being pretreated with ultrasound causing a reduction of approximately 23% in the drying time in sapota fruits [56]. Dual-frequency ultrasound pretreatment (20/40 kHz) shortened vacuum freeze-drying time and improved strawberries’ fruit quality and biological activity [57]. The drying time for nectarine slices was shortened, and their qualitative and thermodynamic properties were enhanced by increasing the temperature (50, 60, and 75 °C) and time of the ultrasound (10, 20, and 40 min) treatment [58]. Another study’s findings showed that increasing the temperature (50, 60, and 70 °C) and the ultrasound pretreatment time (15, 30, and 45 min) decreased the rate of color change while increasing energy utilization and efficiency in blackberry [59]. The combined application of ultrasound pretreatment in ultrasonic baths and direct ultrasound application during air-drying intensified the drying process, increasing the effective water diffusivity by up to 93%, the external mass transfer by up to 30%, and reducing the drying time by up to 58% when compared to the conventional air-drying process [60].
The energy consumption for the dryer and fruit-ripened systems depends on ambient environmental conditions and the system design/type. The systems consume different energy quantities per unit mass of water evaporated based on the sample’s initial and final moisture contents, thickness, and specific product heat [61]. However, the latent heat required for evaporating water from the product, heat loss by conduction through the walls and ceiling, air loss from the leaky airflow, and heat loss associated with vent air are the elements of energy consumption during the artificial ripening of the fruit or drying of the agricultural product. Therefore, crop dryers and artificial ripening systems consume significantly more energy through their heat supply units than latent evaporation heat [37,61,62].
Artificial ripening using controlled temperature and relative humidity for ripening unripe fruits, such as date palm fruits, is similar to the fruit-drying process. Though the mentioned studies have provided some insight into ultrasound applications for drying agricultural products, no reports were identified regarding the application of ultrasound pretreatment to promote the artificial ripening of unripe date palm Biser fruits, which are otherwise applied. The current study aimed to design and validate a modern automated sensor-based artificial ripening system combined with ultrasound pretreatment for unripe Biser fruits of date palm cv. Khalas. The artificial ripening process and the designed S-BARS performance in terms of the ripening and ultrasound pretreatment parameters were discussed to understand the main effect of the parameters and their interactive effect. Meanwhile, this study highlighted the use of the Response Surface Methodology (RSM) with the desirability function as an optimization tool to simultaneously maximize the percentage of ripened fruit and minimize the required time for fruit ripening, the percentage of damaged fruits, and electrical energy consumption. To quantify the applicability of the proposed approach for ripening date fruits, the attributes of the fruit’s quality were evaluated under optimum conditions for ripening parameters and ultrasound pretreatment.

2. Materials and Methods

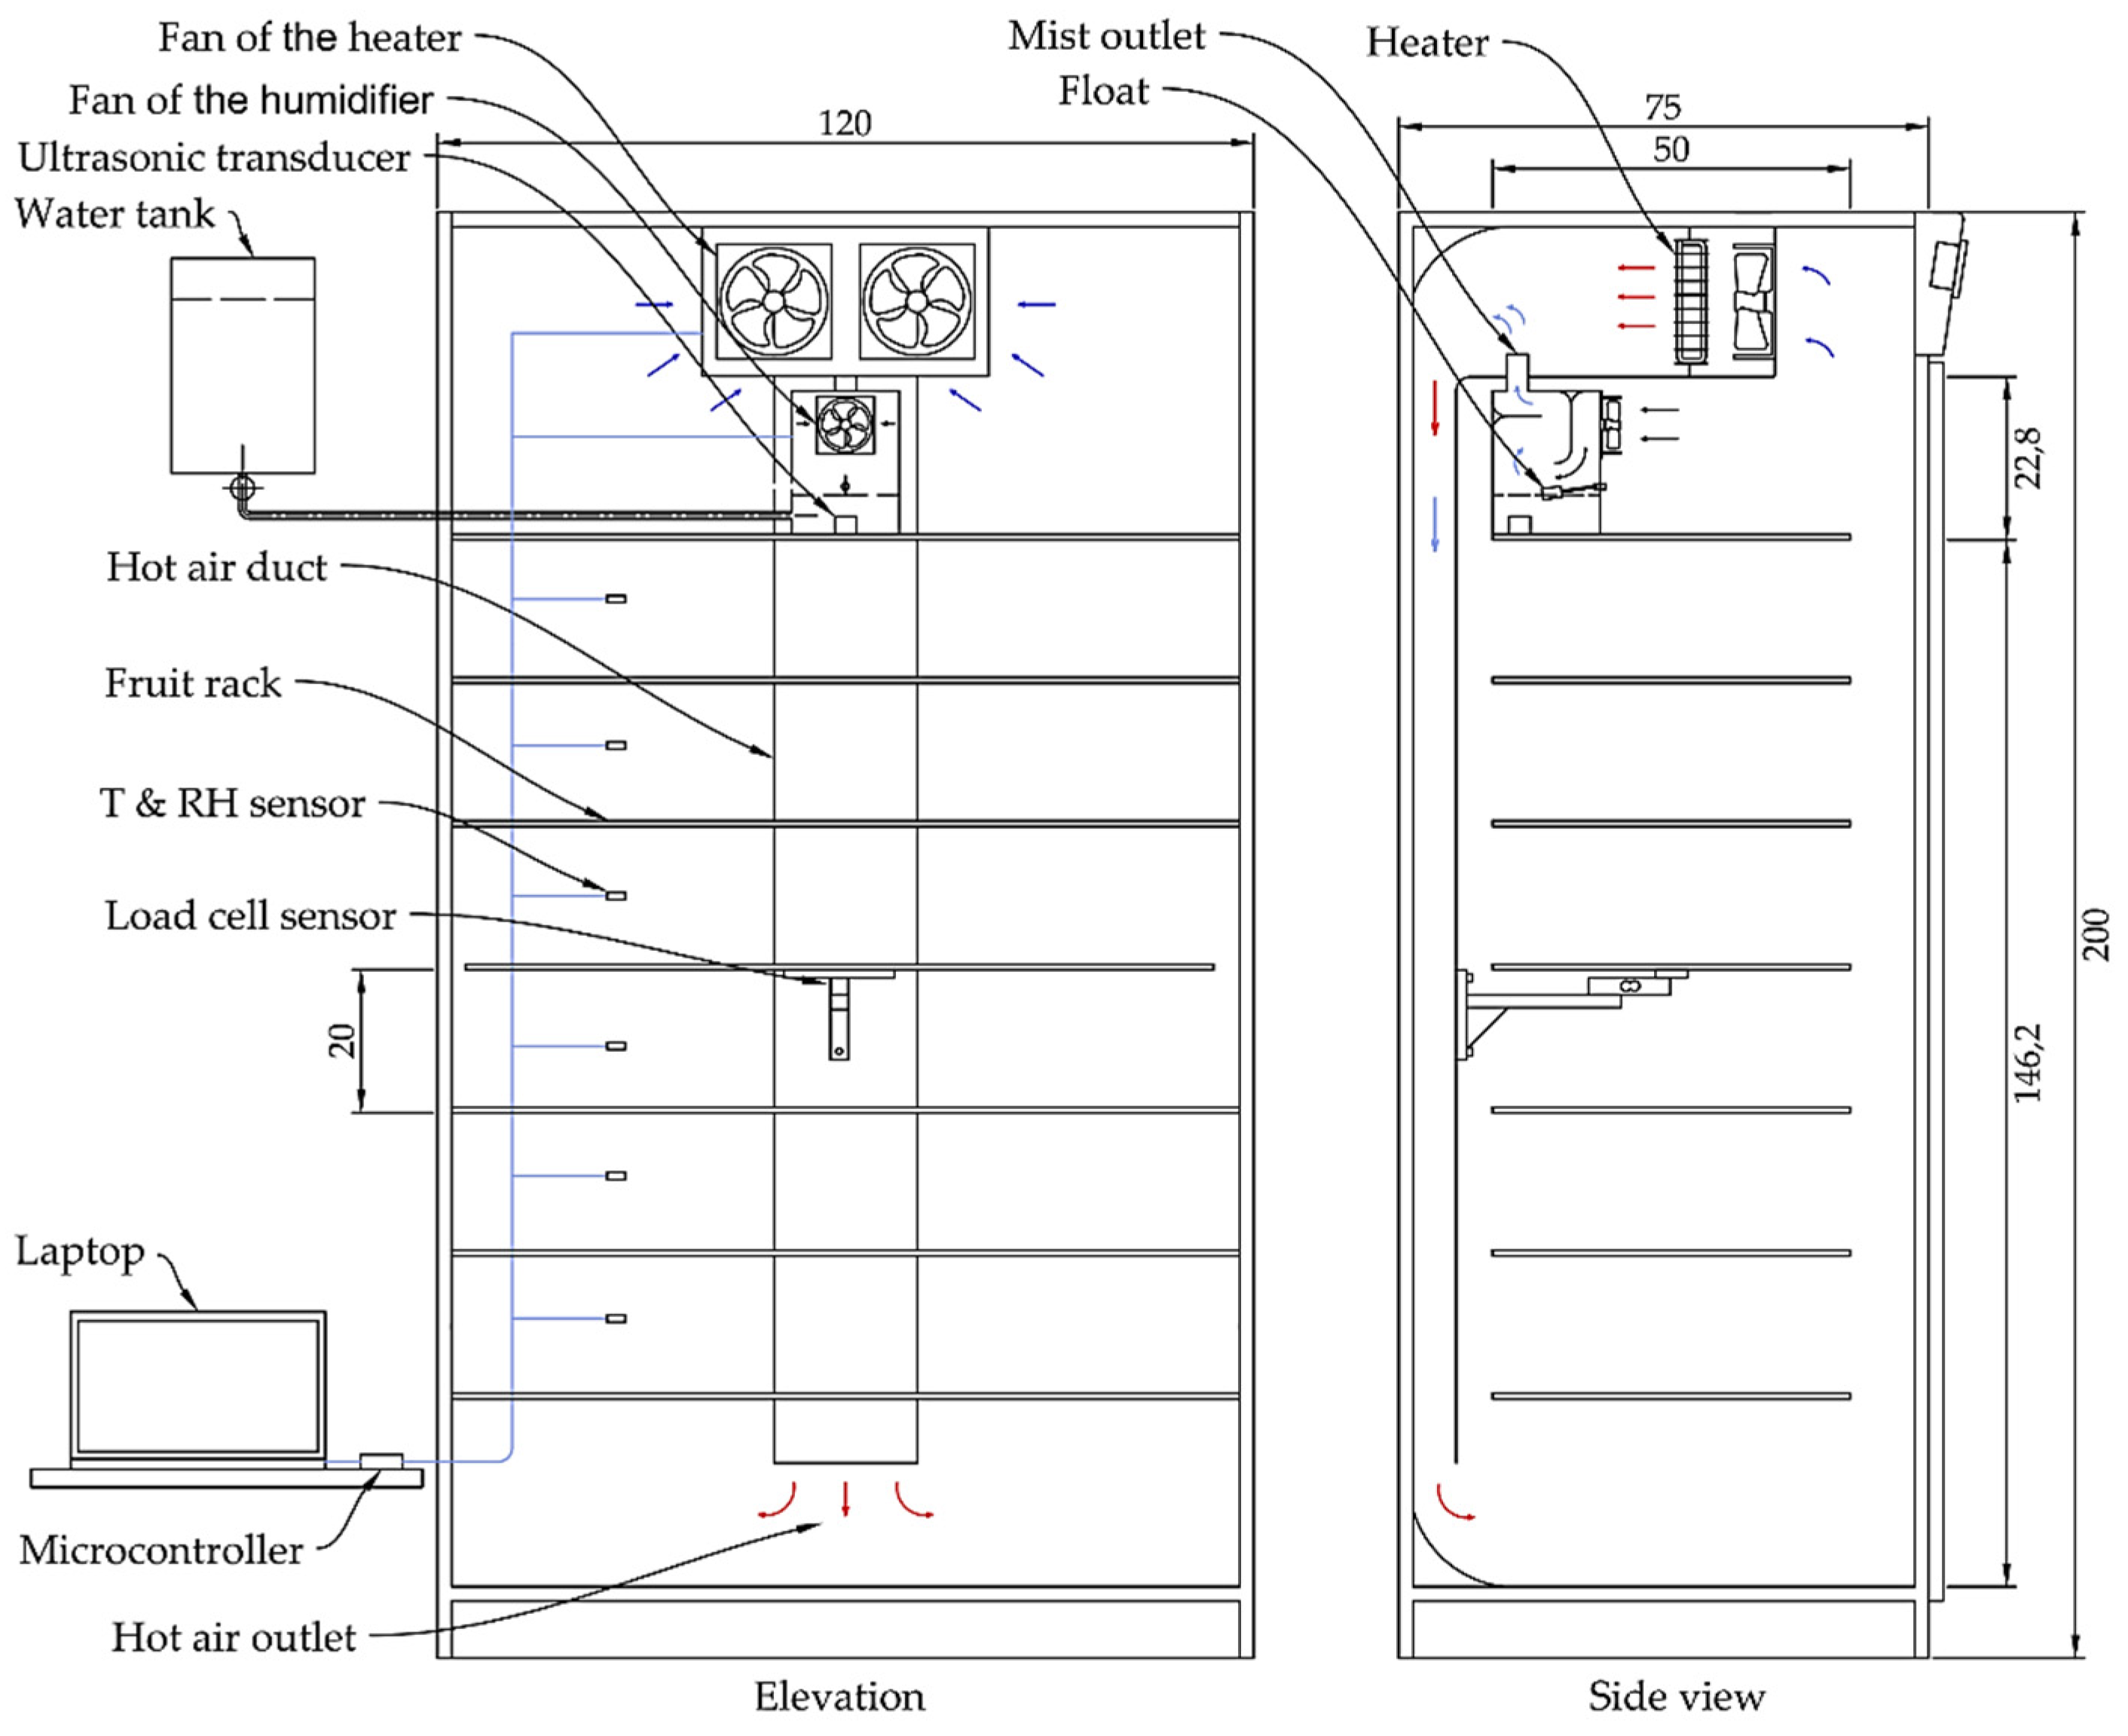
2.1. Design of the Sensor-Based Artificial Ripening System

The sensor-based artificial ripening system (S-BARS) was designed and implemented at the Date Palm Research Center of Excellence engineering lab, King Faisal University, Saudi Arabia. The designed system performance was evaluated using pretreated date palm fruits by high-power ultrasound. The S-BARS consisted of four main units: The thermally insulated treatment chamber, the heating unit, the humidification unit, and the sensor-based control unit.
Figure 1 shows the main components of the S-BARS. The thermally insulated treatment chamber dimensions were 120 cm in length, 75 cm in width, and 200 cm in height. The chamber frame was made from welded 3 cm square stainless-steel tubes. The treatment chamber walls were insulated with 2 cm thick high-density foam sandwiched between two 0.15 cm thick, high-quality 304 L stainless-steel sheets to prevent heat transmission. The door of the treatment chamber was made from two 4 mm thick glass plates. The treatment chamber had a working size of 116 cm × 71 cm and 146.2 cm and contained six racks (116 cm × 50 cm), with each rack accommodating 1 kg of unripe date fruit, and the total fruit weight was 6 kg.
The designed S-BARS was equipped with heating and humidification units to control the interior environment at the targeted temperature and relative humidity (RH). The heating unit contained a 220 V electrical heater with a power of 1000 W and two 220 electrical fans with a diameter of 10 cm. The ultrasonic humidifier included an ultrasonic transducer with a frequency of 2600 kHz installed at the central position of the humidifier base. The resonance impedance of the transducer was 2 Ω, and its operating temperature ranged from 0 to 60 °C. The water depth above the transducer was adjusted at 0.15 m to generate the water droplets efficiently. Finally, the large droplets were dropped back into the humidifier tank through the vertical mist duct. An electronic circuit consisting of analog temperature sensors (LM 35), comparators (LM 339) for signal processing of the sensor’s output, timers (555 N), transistors (ULN 2003), capacitors, resistors, and relays were used to control the air temperature of the heating unit. The ultrasonic humidifier development was based on the techniques for controlling the RH in systems that the authors explain in [20,50,63,64,65]. The control unit comprised the power source, fuse, LED indication, electrical switches sensors, relays, microcontrollers, and laptop [66].

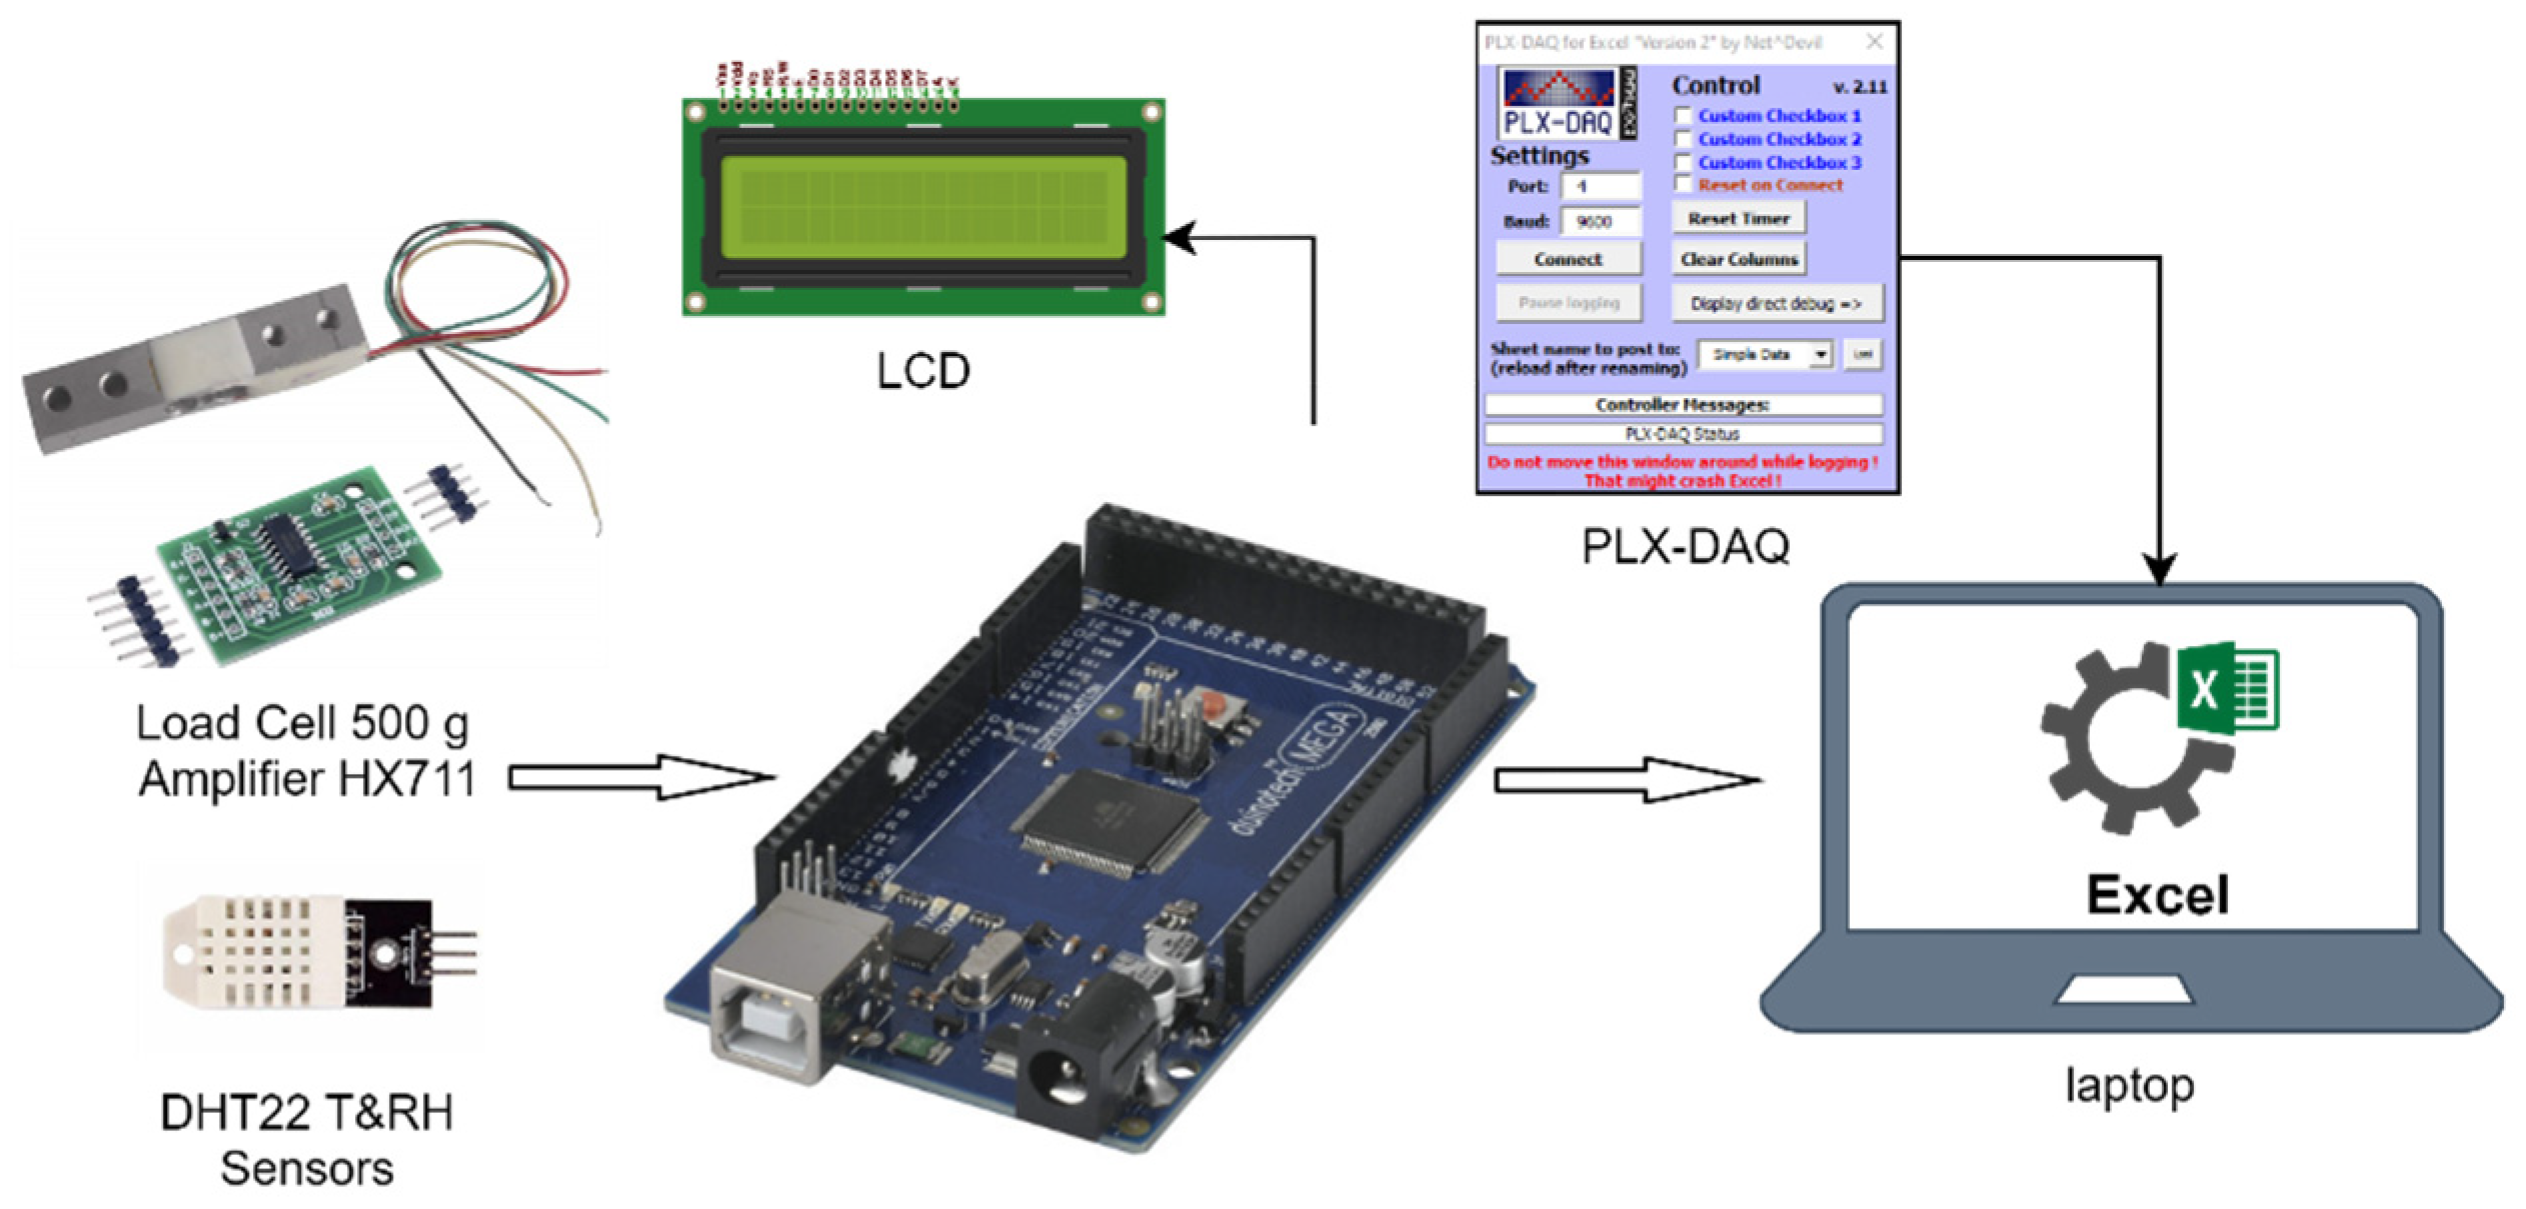
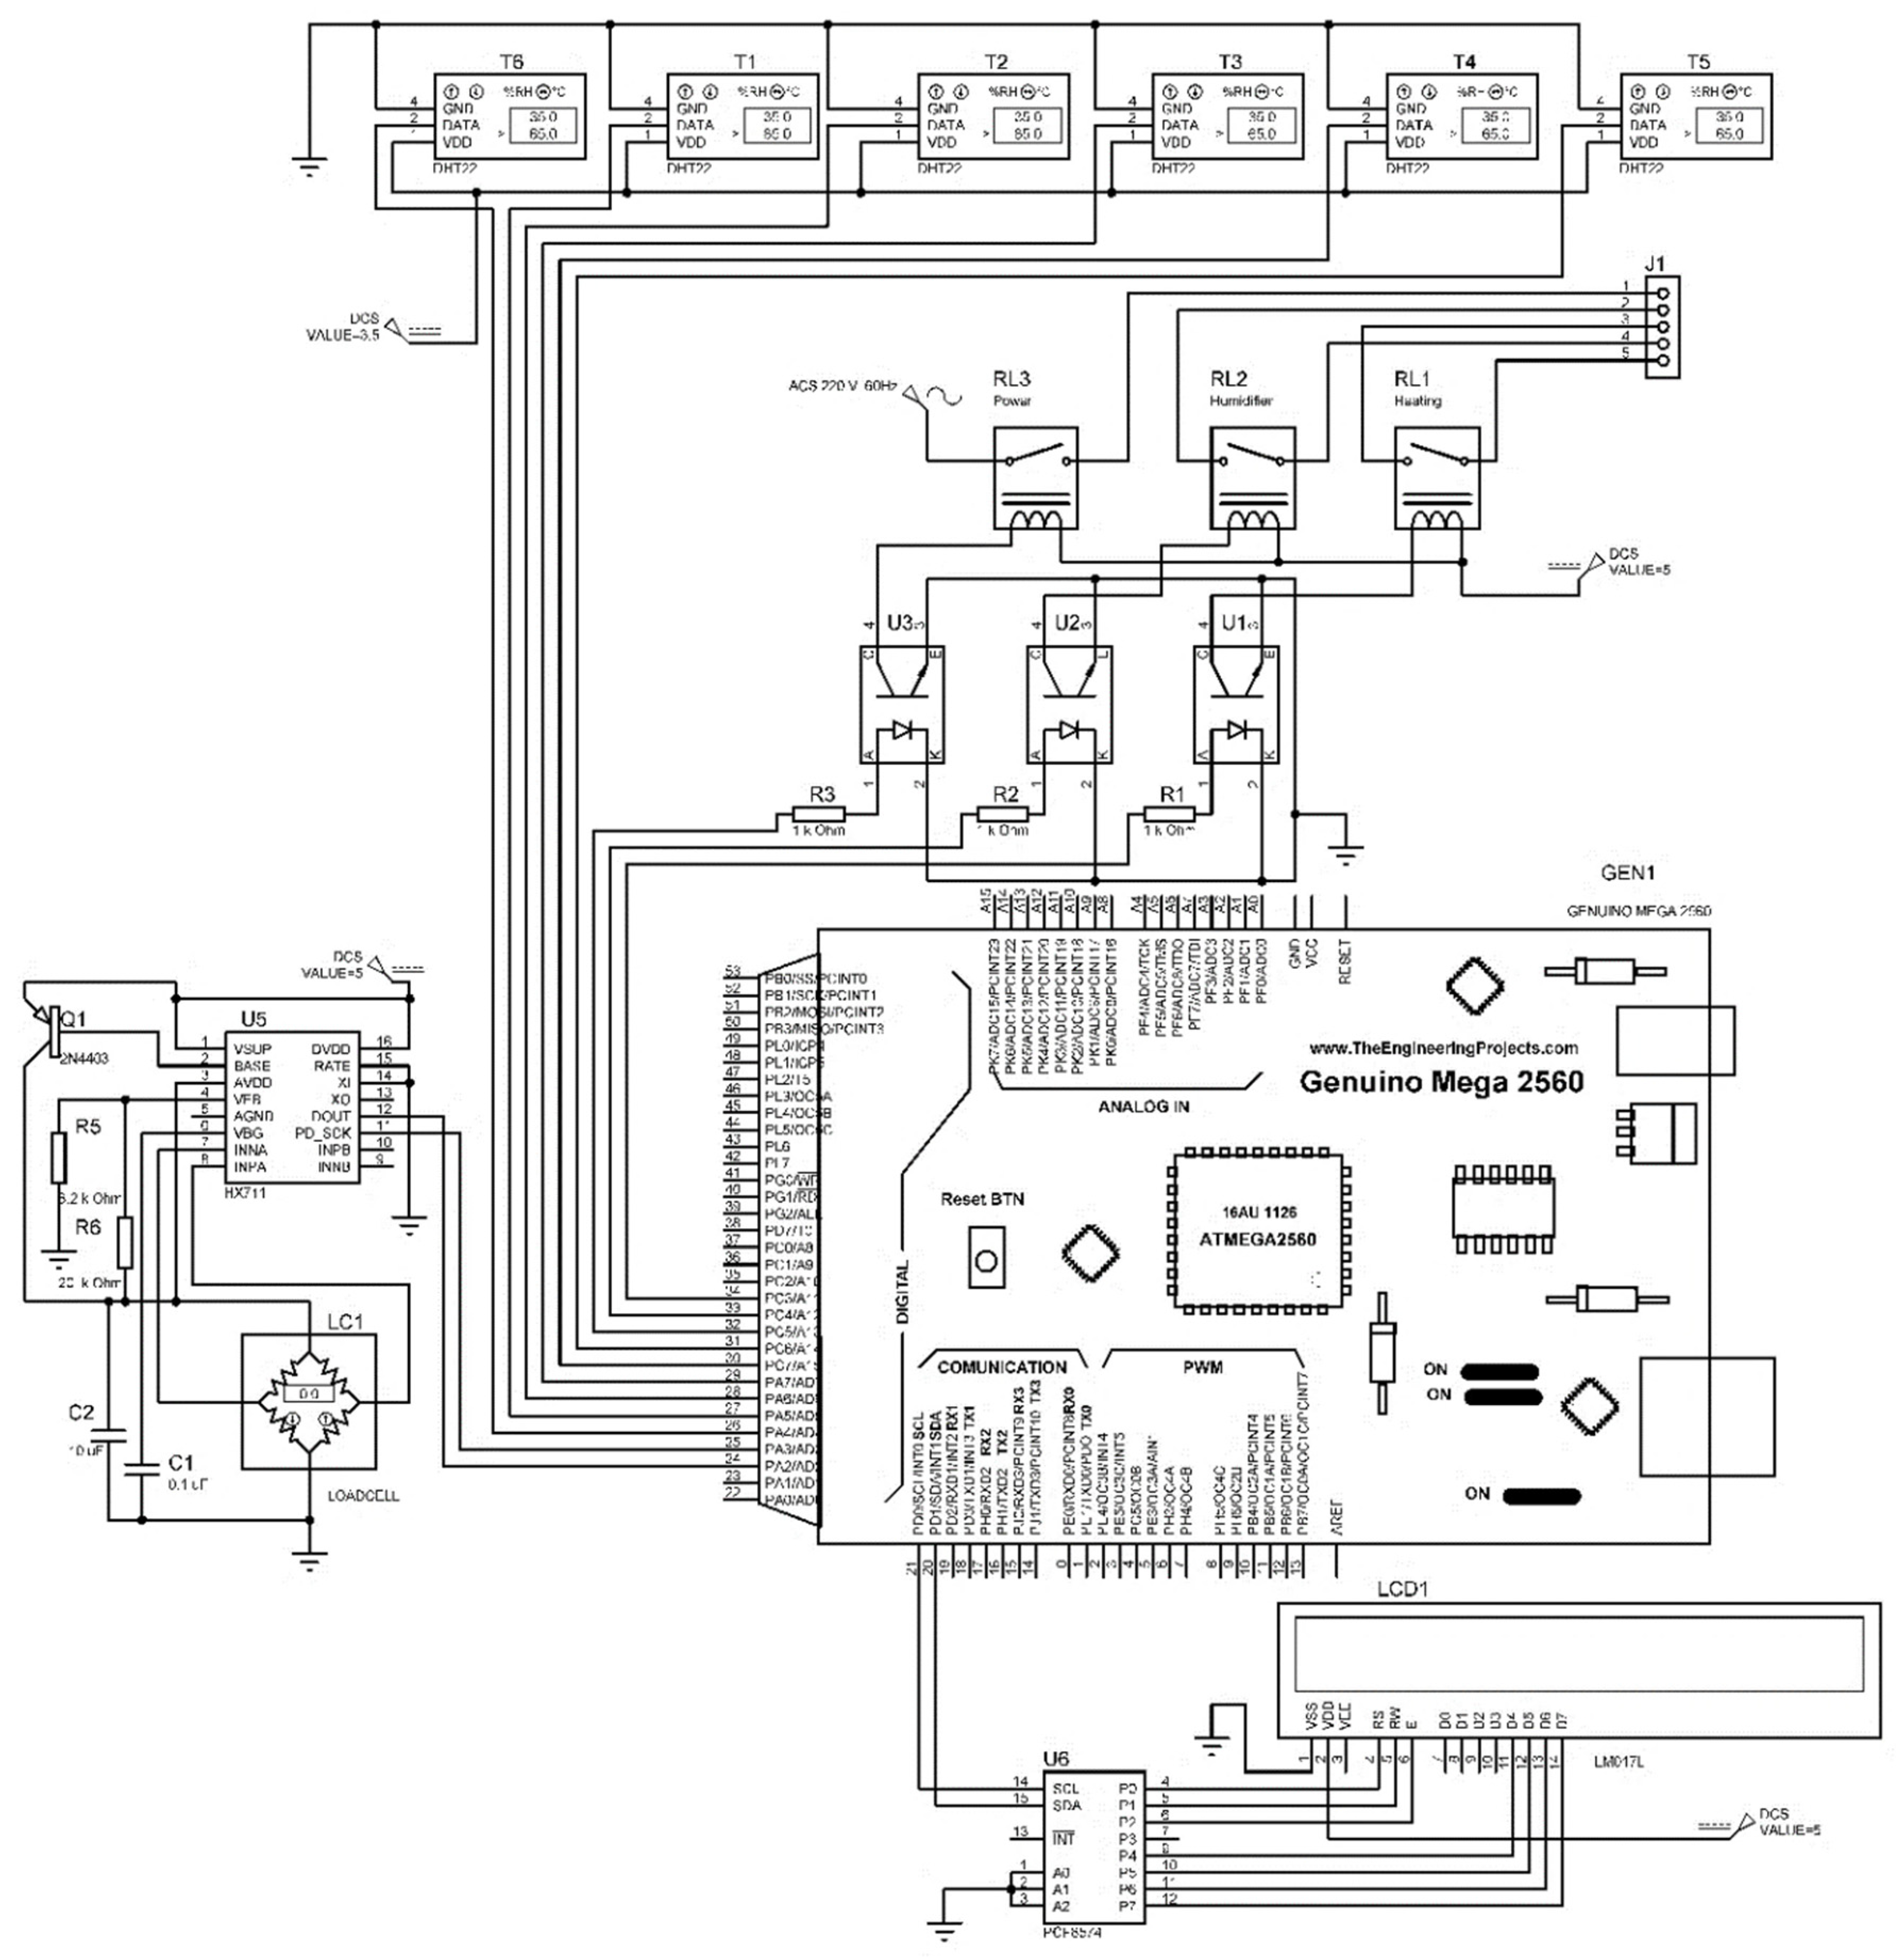
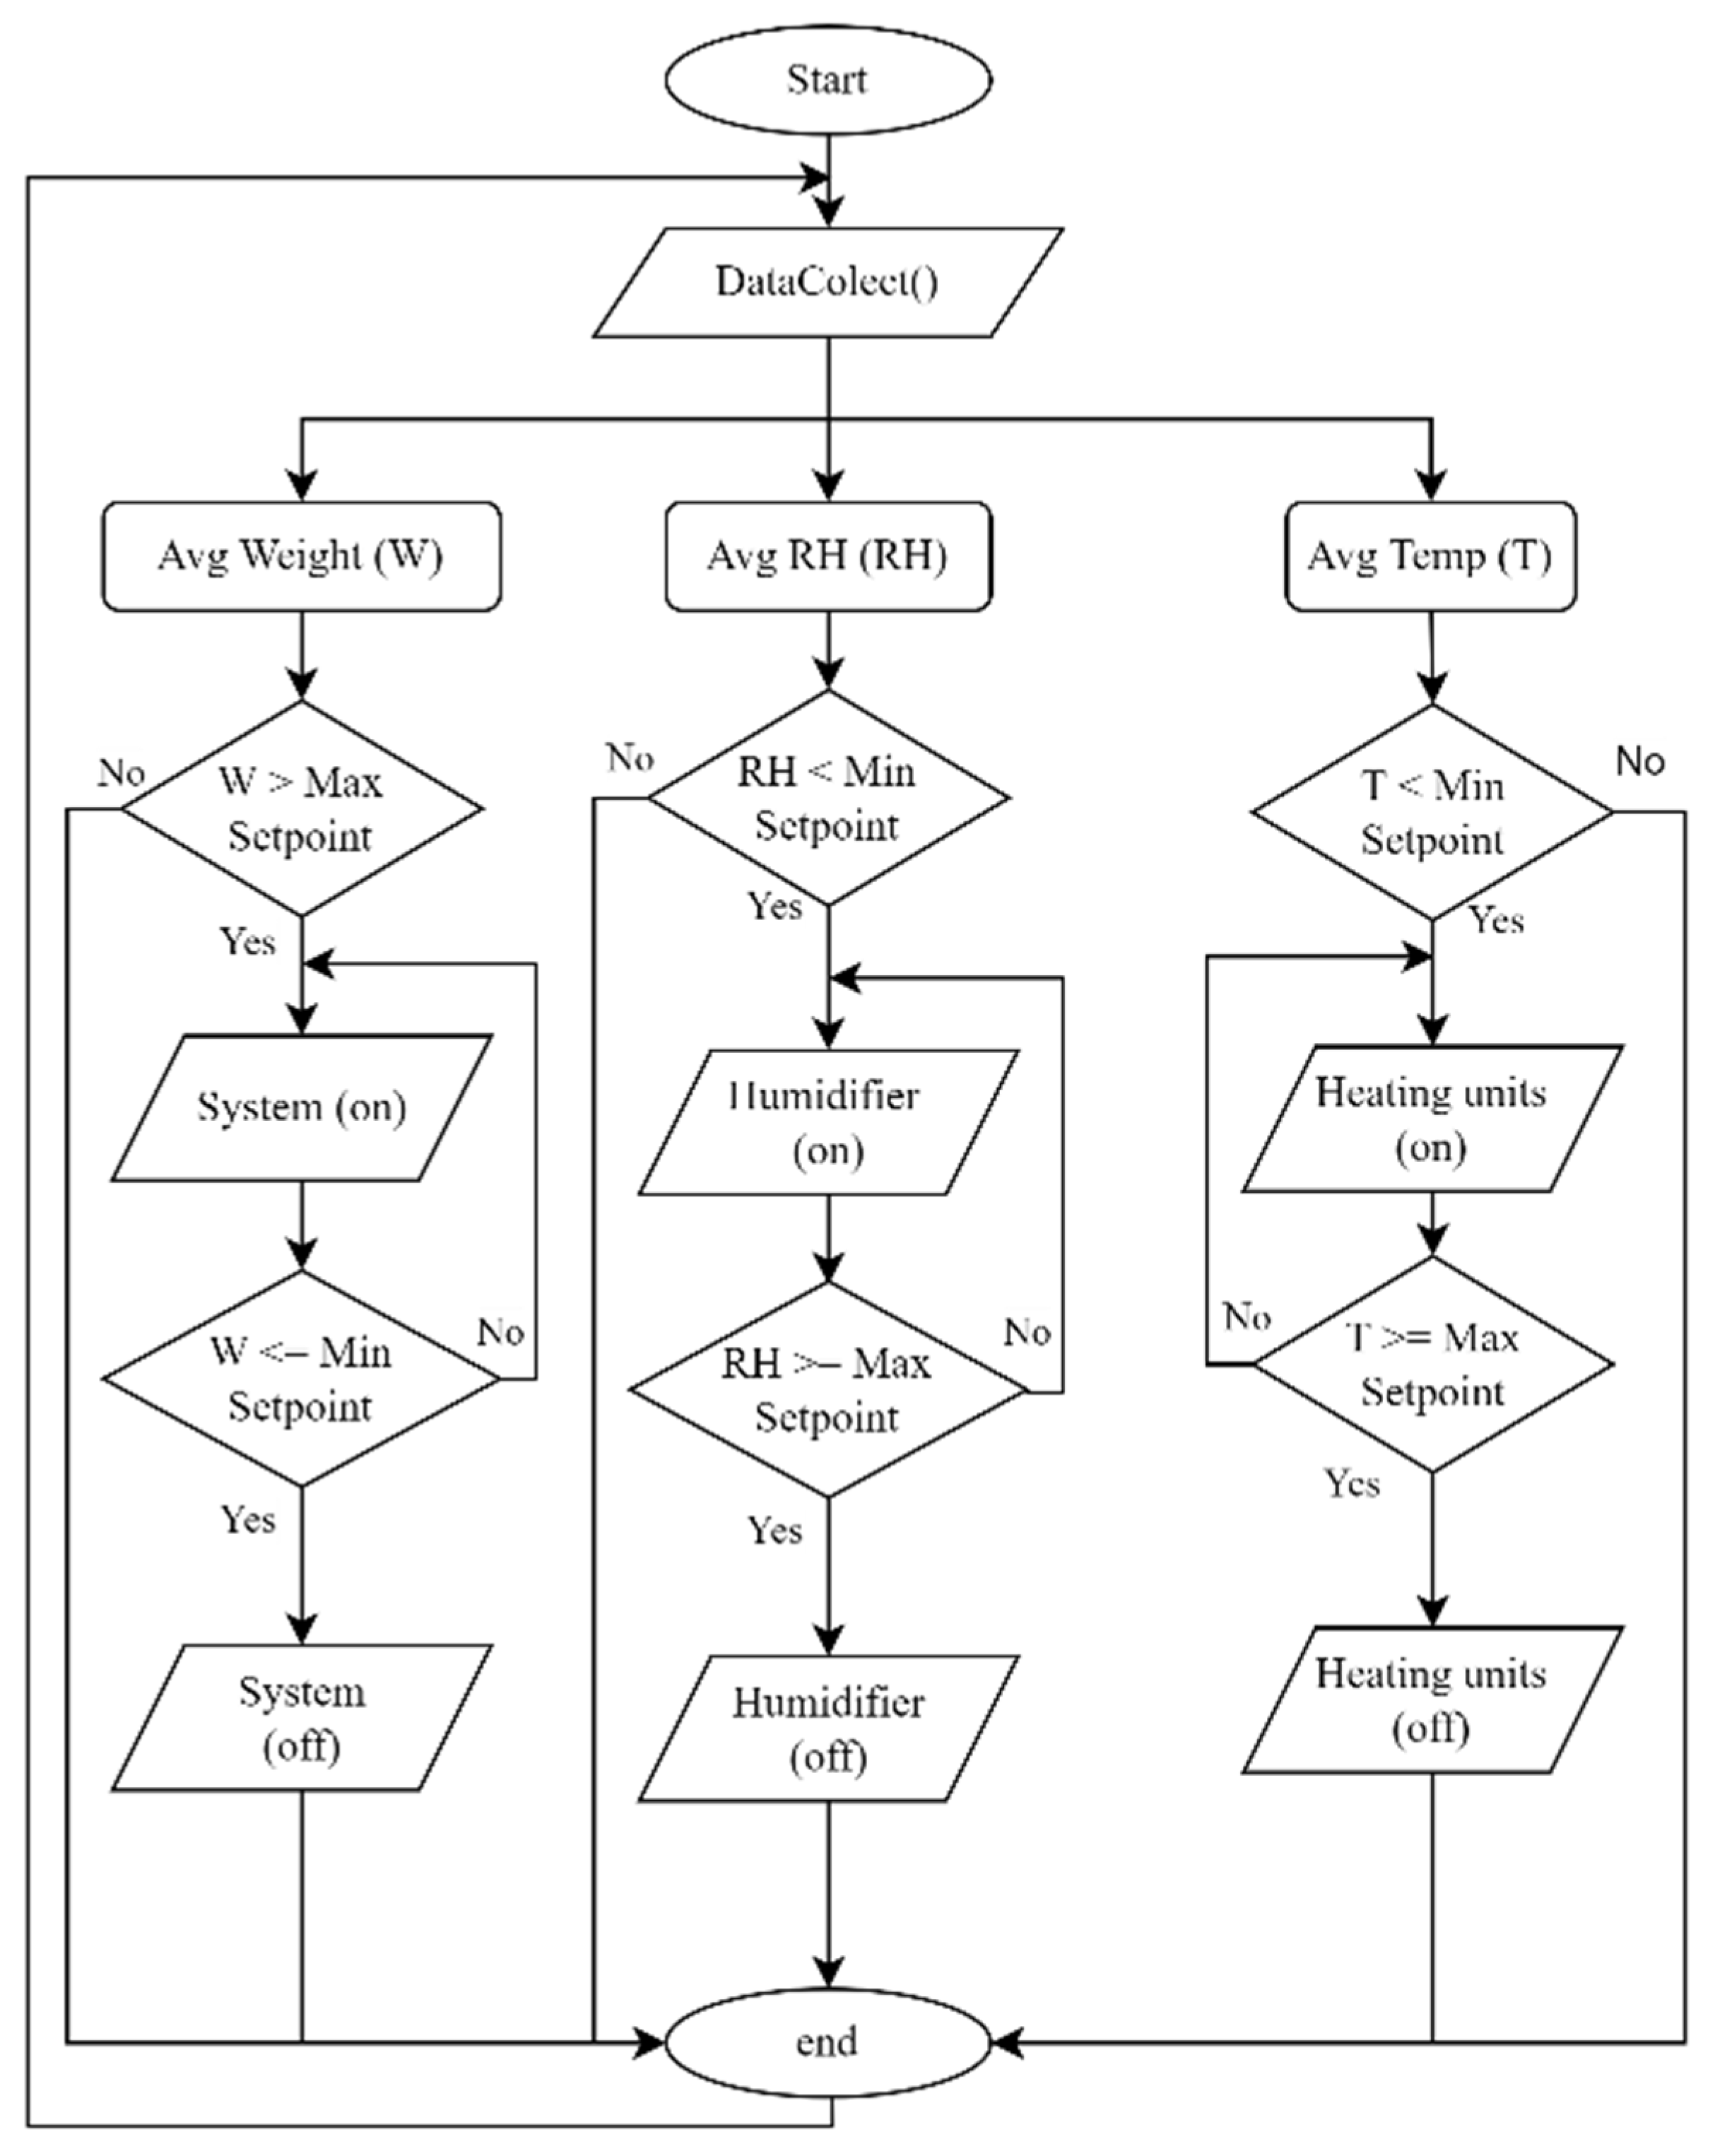
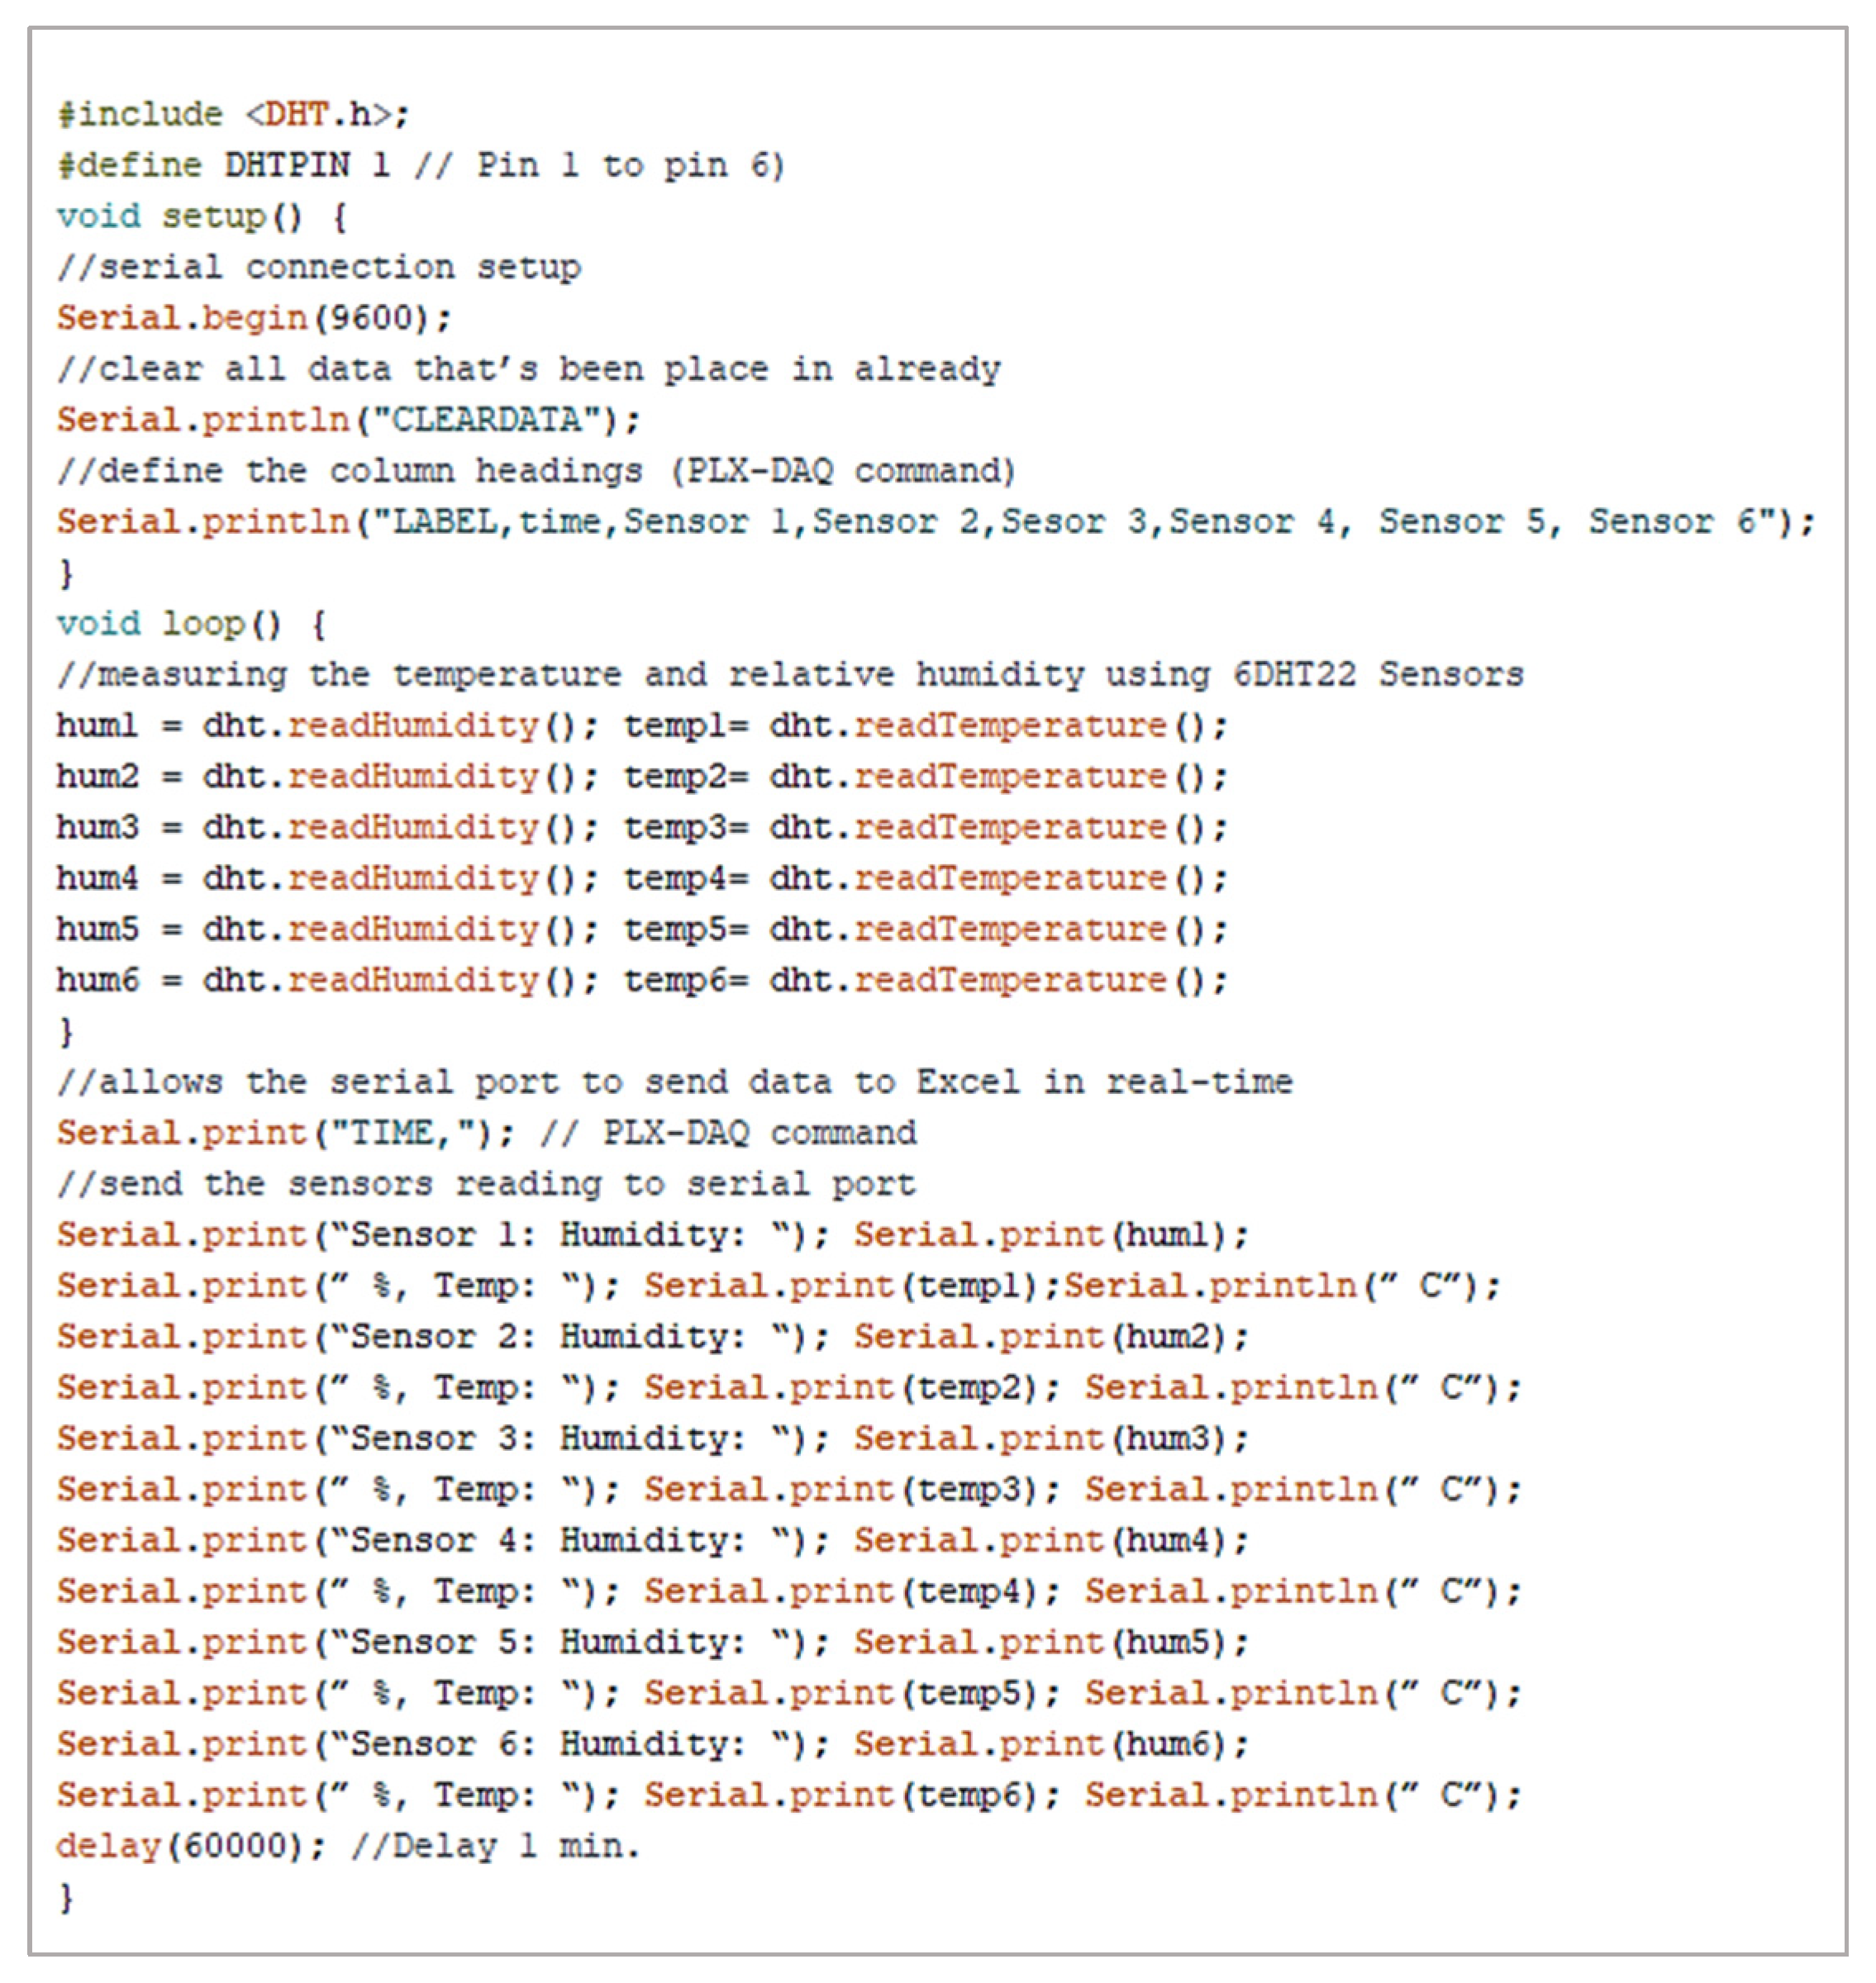
2.2. System Control and Data Acquisition

A straightforward technique was developed for system control and data acquisition. The technique is based on the sensors, the open-source microcontroller board, the liquid crystal display (LCD), and the Microsoft Excel program to collect data, store, and track temperature, RH, and fruit weight data inside the S-BARS. PLX-DAQ Excel Macro was used to display the acquisition data in an Excel spreadsheet and on the LCD. Six DHT22 sensors were used to collect data on temperature and RH. These sensors sent the data to the Arduino Mega board’s open-source microprocessor (ATmega328P). Figure 2 shows an overview of real-time data acquisition of the temperature and RH inside the treatment chambers of the designed S-BARS using Arduino and Excel. The data collected from the S_BARS and the PLX-DAQ presented the acquired real-time data into columns of real-time data of the load cell sensors in each Excel spreadsheet.
Figure 3 shows a schematic Proteus simulation diagram with the essential components of S-BARS control and monitoring [67]. Proteus 8 was used to perform electrical circuit simulations on all sensors and electric actuators to ensure their operational compatibility. The Arduino Mega microcontroller board (Microchip Mega2560, Microchip Technology Inc. W Chandler Blvd, Chandler, AZ, USA) was used in the circuit to collect data from the DHT22 and Load Cell sensors. This circuit controlled the heating unit, humidifier, and operation of the S-BARS. The control of the actuators was enacted through three relays, i.e., RL1 to control the heating unit, RL2 to control the ultrasonic humidifier, and RL3 to control the main power of the S-BARS.
Communication between the Arduino Mega board and Excel was established by opening the Spreadsheet and defining the connection settings in the PLX-DAQ window to adjust the baud rate and port of the Arduino board. During the data acquisition process, the obtained temperature and RH values were stored in real time in the Excel spreadsheet. The Load Cell sensor with amplifier HX711 was used to monitor the fruit’s weight loss during treatment and to stop the S-BARS when the required weight was achieved for the treated date fruits. The S-BARS temperature, RH, and operation control were conducted based on the control flowchart, as shown in Figure 4.
Figure 5 shows the program code embedded in the Arduino Mega board to acquire the data of the temperature and RH from the six DHT22 sensors installed in the treatment chamber of the S-BARS and send the measured data to a PLX-DAQ Spreadsheet for real-time monitoring and data logging. As a result, the PLX-DAQ displayed the acquired real-time data in six columns of temperature and RH sensors in each Excel spreadsheet.

2.3. Samples Collection

The date fruits (Khalas cv.) were collected from the experimental fields of the Date Palm Research Center of Excellence, King Faisal University, Saudi Arabia (25°16′05.9″ N, 49°42′29.5″ E). The selected date palm trees were almost the same age (15 years) and uniform in growth and were subjected to the same agricultural treatments under arid conditions. The date palm fruits were harvested at the Biser stage. After harvesting, the fruits were sorted, cleaned, and to inhibit the growth and reproduction of bacteria and fungus, a Sodium Benzoate (C7H5O2Na) solution was used. Afterward, the date fruits were stored at 18 °C in a cold storage room for ultrasound pretreatment and artificial ripening [68].

2.4. Ultrasound Pretreatment

The procedure of ultrasound pretreatment consists of immersing the Biser samples in desalted water and exposing them to high-power ultrasound. In this study, the unripe date samples were immersed in an ultrasonic bath (model: CPX3800H-E, Branson Ultrasonics Corp., Danbury, CT, USA) containing distilled water. The Biser-fruit-to-distilled-water ratio was set at 1:4, according to previous studies’ recommendations [69,70]. The ultrasonic bath is completely programmable for treatment time, power ultrasonic tracking capabilities, high/low-power ultrasound control, degassing control, and temperature control. The tank capacity of the ultrasonic bath was 5.7 L with internal dimensions of 290 × 150 × 150 mm. The maximum power of the ultrasonic bath was 360 W, 230 V, and the puissance at the frequency of 40 kHz was 110 W. The fruits were arranged and covered with a metal net to prevent sample flow from the bath.

2.5. Experimental Design

The Response Surface Methodology (RSM) was used to determine the optimum ultrasound pretreatment temperature, time, and RH and temperature treatments for ripening Biser fruits of date palm. The RSM was used to determine the best condition without studying all potential combinations experimentally. In addition, it is possible to decide the input levels of the various variables for a specific level of response using the RSM. The Box–Behnken design (B-BD) was used as an experimental design for RSM. The B-BD is a class of rotatable second-order designs based on incomplete factorial designs with three levels. In the second-order rotatable design, the effect of observation at the design stage was measured by comparing the predicted response variances in the absence or presence of observation. The minimum, maximum, and variance averages in this design compare the region of interest. The impact of ultrasonic pretreatment (time and temperature) and the artificial ripening (temperature and RH) treatments on the required time for fruit ripening (RT), the percentage of ripe fruit (PORF), the percentage of damaged fruits (PODF), and the electrical energy consumption (EEC) parameters was studied according to the B-BD. Twenty-six trials were conducted based on the B-BD. Therefore, twenty-six ultrasound-pretreated date fruit samples were used. The levels and values of the factors, i.e., ultrasound pretreatment temperature (USP-Temp), ultrasound pretreatment time (USP-Time), artificial ripening treatment temperature (ART-Temp), and artificial ripening treatment RH (ART-RH), are shown in Table 1.
Triplicate validation experiments were conducted to validate the predictive model under optimization conditions using six ultrasound pretreated and six untreated date fruit samples. First, the experimental results for the RT, PORF, PODF, and EEC were compared with the predicted results obtained by the predictive models to validate their suitability and accuracy. In addition, the physicochemical properties of ultrasound pretreated and untreated Biser date fruits were measured in the validation experiment. Finally, the artificially ripened date fruits under the optimization criteria were compared with naturally ripened date fruits at the Tamr stage (control).

2.6. Physical and Chemical Properties of Date Fruit

The sample of ten fruits was used to determine the fruit length (mm) and diameter (mm), which were measured by a handheld digital Vernier Caliper. Fruit weight was measured by the Sartorius electronic balance (Sartorius Lab Instruments GmbH and Co., Gottingen, Germany). The xylometric method was used to calculate fruit density. With this technique, the date fruits were immersed in a graduated water container and the amount of displaced water was measured [36,71]. Ten grams of fruit samples were placed in an oven (Model ED-260, Binder, Marbach, Germany) set at 70 °C and left until the weight remained constant to assess the fruit’s moisture content. The moisture content was then determined as grams of water per 100 g of sample. The Texture Analyzer (Model TA.XTplus, Stable Micro Systems Ltd., Godalming, Surrey, UK) measured fruit firmness. The texture of each date fruit sample was assessed at room temperature (25 °C) using a cylindrical piercing probe with a 7 mm diameter. Attention was given to using samples with nearly identical thicknesses to reduce sample variation. In all readings, the piercing distance was 5 mm while the probe’s speed was 30 mm min−1. The maximum forces observed for puncturing were reported as indicators of the date texture’s firmness. The pH value of date fruits was measured by a handheld digital pH meter (Model HI-99121, Hanna Instruments, Leighton Buzzard, Bedfordshire, UK). A digital refractometer (Model 614 RFM 840, Richmond Scientific Ltd. Unit 9, Lancashire, UK) was used to measure the total soluble solids (TSS) at 25 °C, and the results were expressed as a percentage. The digital refractometer’s prism plate was used to hold an appropriate amount of sample juice, and the reading that appeared on the screen was recorded as total soluble solids.
A Hunter lab Color Quest-45/0 LAV color difference meter (Model Quest-45/0 LAV, Hunter Associates Laboratory, Inc., Reston, VA, USA) based on the L, a, and b color system was used to measure the fruit’s color parameters. While a and b are the chromaticity coordinates, the L value is the lightness factor, ranging from (0) for black to (100) for white. The a value represents the degree of greenness–redness (from −60 to 0 for green and from 0 to +60 for red), while the b value represents the degree of blueness–yellowness (from −60 to 0 for blue and from 0 to +60 for yellow).
The anthrone-sulfuric acid colorimetry method was used to assess the total sugar content. The pulp of date fruits cv. Khalas was crushed and homogenized with 20 mL of distilled water in a graduated tube. After being sealed, the tube was submerged in boiling water for 30 min, after which it was filtered into a fresh tube that had been filled with up to 50 mL of distilled water. After that, a sample of 0.5 mL of this solution and 1.5 mL of the anthrone solution was measured for absorbance at 630 nm in a spectrophotometer (Model Genesys 20, Thermo Scientific, Waltham, MA, USA). A standard glucose-relative curve and the sample’s absorbance were used to compute the total sugar content [72].

2.7. Percentage of Ripened Fruit

The artificially ripened date fruits were classified into two categories based on the fruit color, i.e., ripe and unripe fruits. The ripe fruit was brown, and the unripe fruit was yellowish or greenish. The percentage of ripened fruits (PORF) was calculated based on the difference between the total treated fruits and the number of unripe fruits after the ripening process. The following equation was used to calculate the PORF:
PORF   = N i   N r N i × 100
where PORF is the percentage of ripened fruits, Ni is the total number of treated fruits, and Nr is the number of ripened fruits.

2.8. Percentage of Damaged Fruit

The percentage of damaged fruits (PODF) was calculated based on the difference between the total treated fruits and the number of damaged fruits after the ripening process. The following equation was used to calculate the PODF:
PODF   = N i   N d N i × 100
where PODF is the percentage of damaged fruits, Ni is the total number of treated fruits, and Ni is the number of damaged fruits.

2.9. Energy Consumption

The electrical energy consumption of the ripening process came from the electric energy consumed by the operation of the heating unit, the ultrasonic transducer of the humidifier, the air fans, and the controller. Therefore, the total energy consumption was calculated using the following equation:
E c = t   = 1 T a V   ×   I   × Δ t   ×   cos φ
where Ec is the total power consumed by the system (kWh), V is the nominal applied voltage (V), I is the current intensity (A), Ta is the actual treatment time for artificial ripening date fruit, and cos φ is the power factor in the experimental site.
The current, voltage, and actual power factor were measured using a portable digital power clamp meter (UNI-T UT233, Sinotronics Co., Ltd., Guizhou, China), which combines a digital ammeter power meter into one.

2.10. Statistical Analysis

The software of Design Expert (DX 13, Stat-Ease, Inc., Minneapolis, MN, USA) was used to determine the predictive models and analyze the acquired data. The optimization process determined the optimum values of the parameters and analyzed the response surface plots. The optimization process involved studying the response of the designed combinations, calculating the coefficients by fitting them in a mathematical model, predicting the response of the fitted model, and validating the sufficiency of the model (Myers 2016). The accuracy of the developed models was validated by conducting triplicate experiments under the optimization criteria. The evaluation criteria, i.e., Mean Absolute Percentage Error (MAPE) and the Root Mean Square Error (RMSE), were used to evaluate the predicted results compared with the actual experimental results. Statistical IBM SPSS software (SPSS version 26, Inc., Chicago, IL, USA) was used to analyze the physicochemical properties data.

3. Results

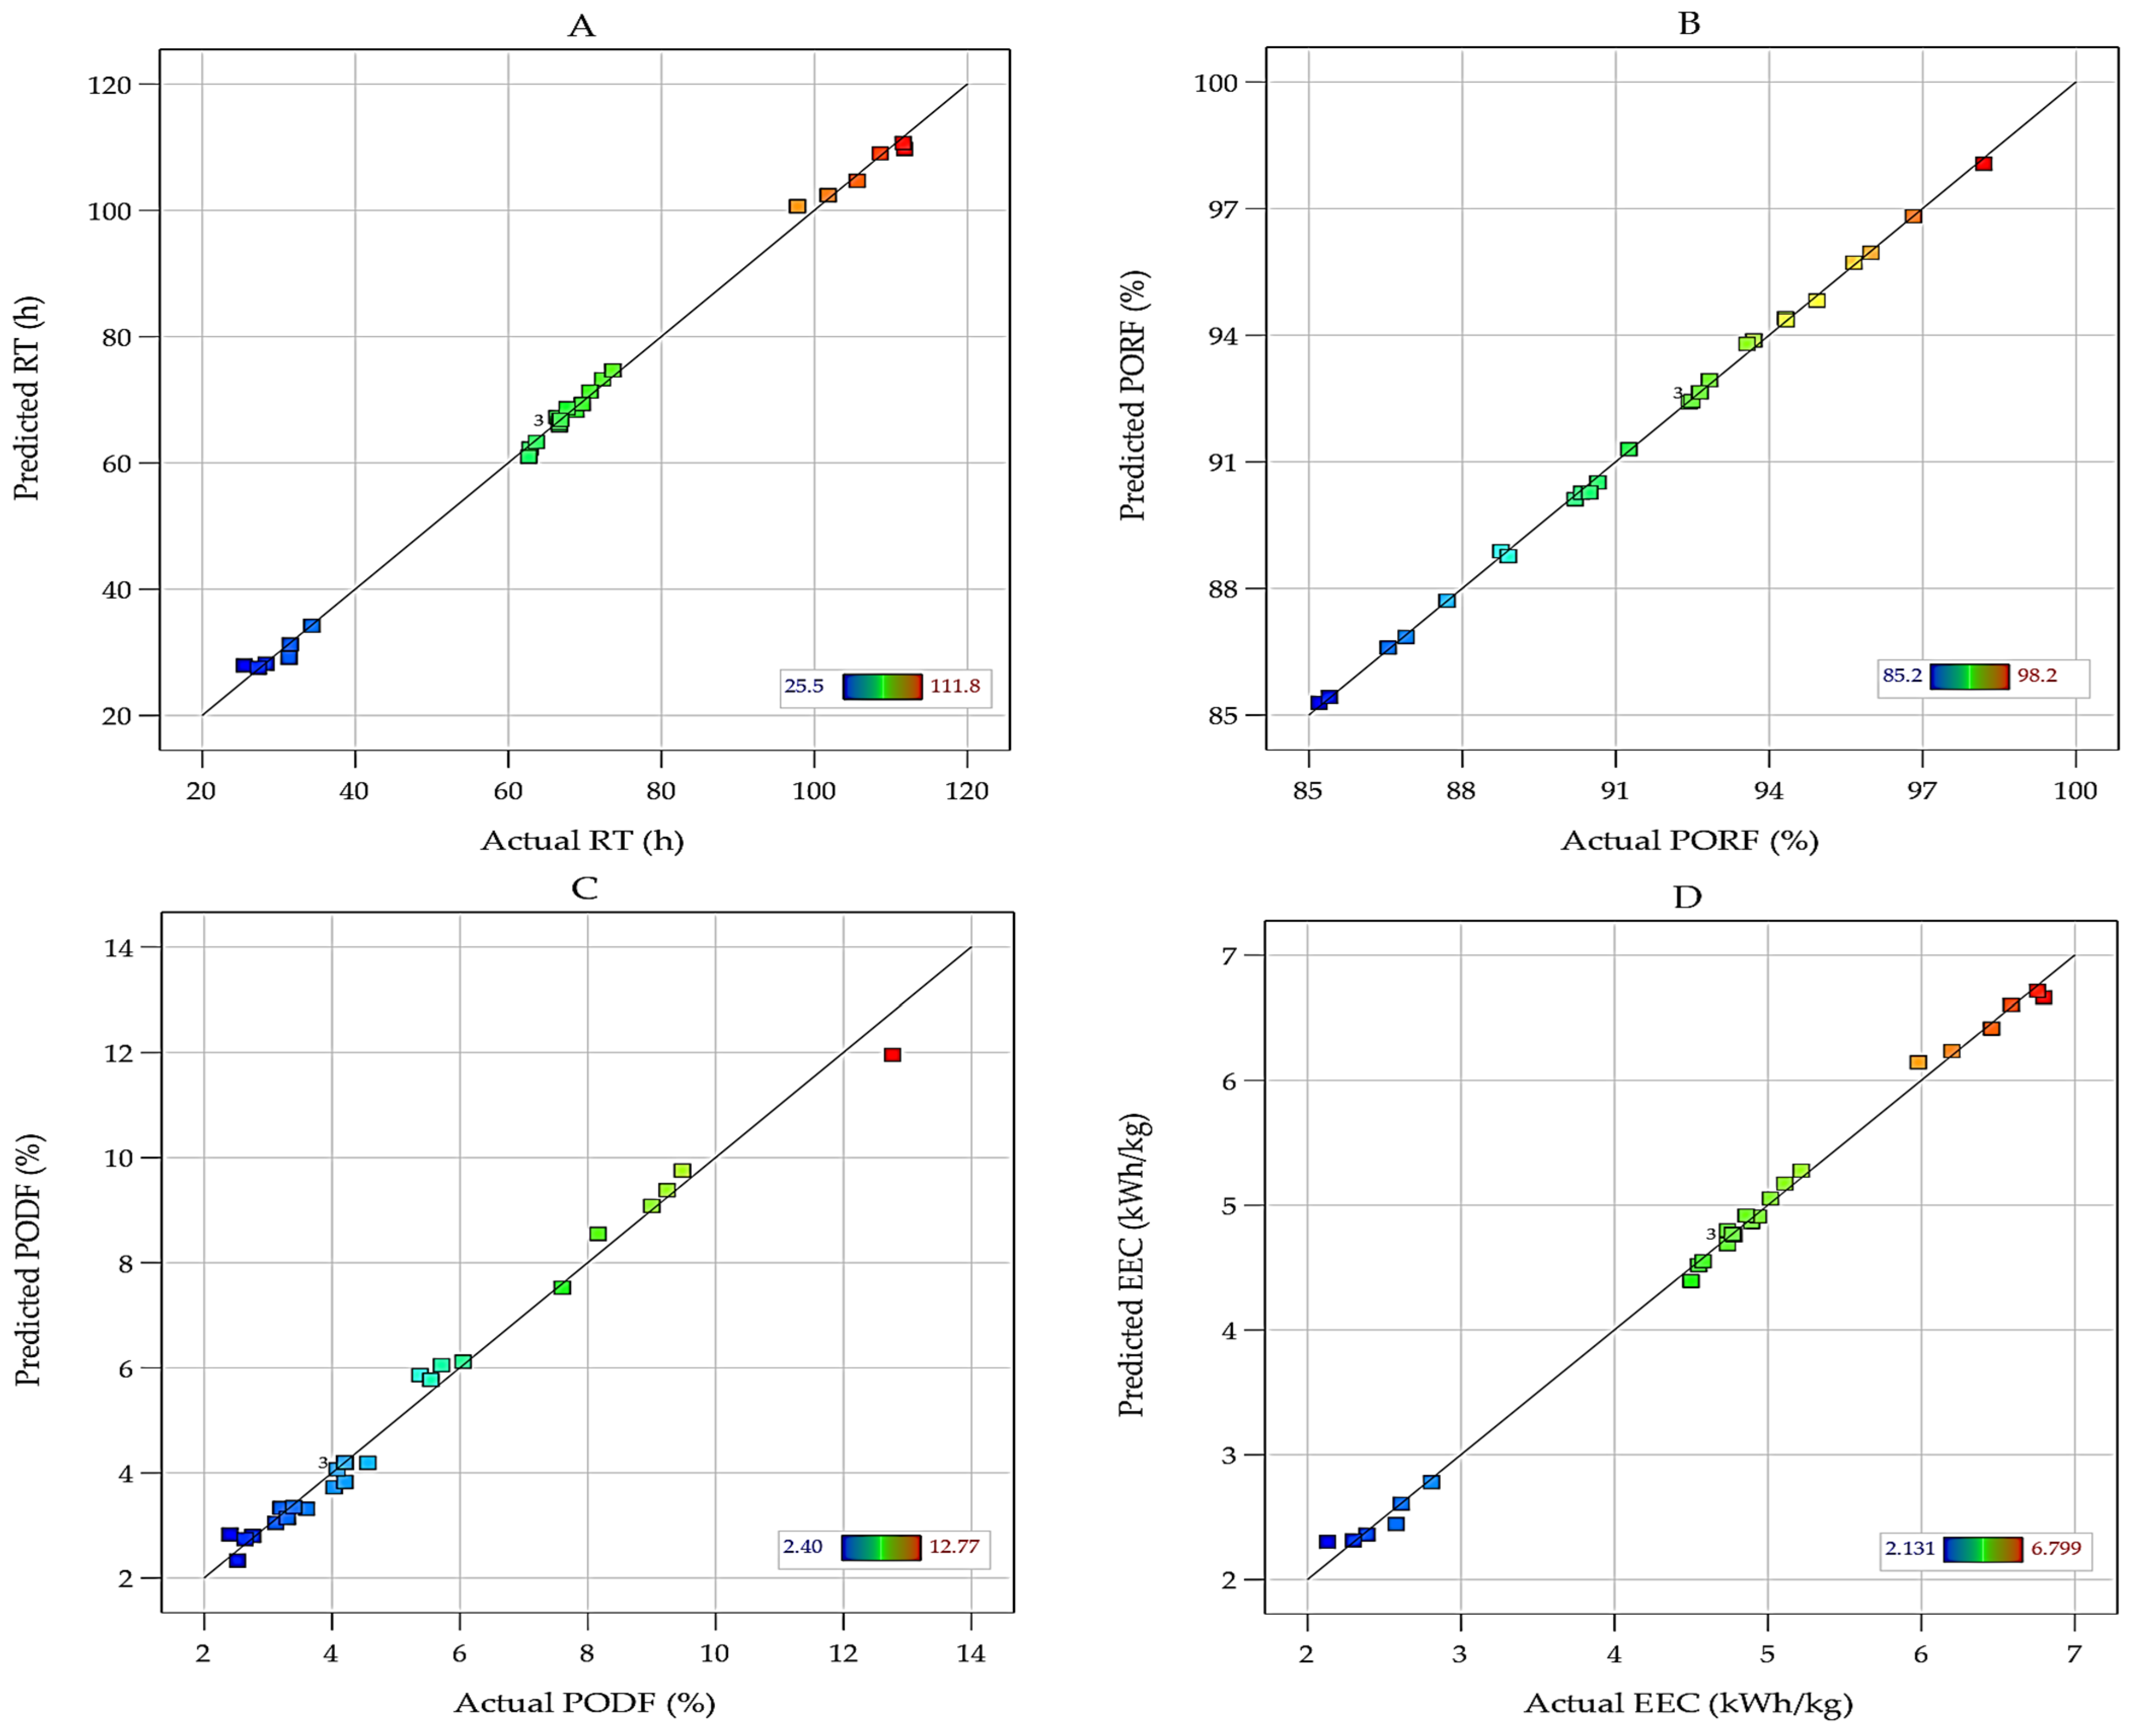
3.1. Modeling of RT, PORF, PODF, and EEC

The results of the artificial ripening experiments that were conducted according to the experimental plan of B-BD are shown in Table 2. The experiment outcomes were inputted into the Design Expert software for further data analysis. Fitting the data to different models, i.e., linear, two factorials, quadratic, and cubic, showed that the required time for fruit ripening (RT), the percentage of ripened fruit (PORF), the percentage of damaged fruits (PODF), and the electrical energy consumption (EEC) were most appropriately described with quadratic polynomial models.
The ANOVA analysis using the Design-Expert for artificial ripening parameters confirmed the adequacy of the quadratic model. The Model Prob > F is less than 0.0001 for RT, PORF, PODF, and EEC. p-values of the excluded terms from the models were greater than 0.05, which indicated that they were not significant. The RT Model F-value of 454.02 indicated that the model was significant. A, B, C, D, and B2 are significant model terms in this mode. The PORF Model F-value of 985.97 indicated that the model was highly significant. A, B, C, D, A2, B2, and C2 are significant model terms in the PORF model. The PODF Model F-value of 72.24 indicated that the model is highly significant. A, B, AB, BC, A2, and B2 are significant model terms in this mode. The EEC Model F-value of 322.36 indicated that the model is highly significant. A, B, C, D, B2, and C2 are significant model terms in this model. These outcomes indicated that there was only a 0.01% chance that an F-value this large could occur due to noise. The model terms that were not mentioned had p-values more than 0.05 and therefore had no significance in the models.
The final equations for coded factors for RT, PORF, PODF, and EEC responses are presented as Equations (4)–(7), respectively. These equations can be used to predict the responses, i.e., RT, PORF, PODF, and EEC, for given levels of each factor. In addition, the coded equation can be used to determine the relative importance of the factors by comparing the coded factor coefficients. The model terms with probability values greater than 0.10 have been removed from the following equations:
RT   = 66.83 2.482   A   3.102   B   38.242   C   + 2.672   D   + 1.71   AC   1.001   CD   0.958   A 2 + 1.81   B 2 + 0.725   C 2 + 0.275   D 2
PORF   = 92.65 + 1.21   A   + 4.56 B     0.121   C   + 1.76   D     0.125   AC   + 0.004   BC   + 0.092   BD   + 0.079   CD 0.695   A 2 0.894   B 2   0.471   C 2 0.099   D 2
PODF   = 4.202 + 1.33   A   + 3.23   B   + 0.122   C   + 0.059   D   + 0.884   AB   + 0.017   AC   + 0.068   AD   + 0.48   BC   + 0.09   BD   0.06   CD   + 0.483   A 2 + 1.83   B 2 0.105   C 2 0.026   D 2
EEC   = 4.77 0.147   A   0.179   B   2.1   C   + 0.183   D   + 0.007   AB   + 0.082   AC   0.03   BC   0.03   CD   0.061   A 2 + 0.131   B 2 0.332   C 2 + 0.015   D 2
where A, B, C, and D are the coded values for USP-Time, the USP-Temp, the ART-Temp, and ART-RH factors, respectively. The high levels of A, B, C, and D factors are coded as +1, and the low levels are coded as −1.
The predictive models in terms of actual factors for RT, PORF, PODF, and EEC responses are found in Equations (8)–(11), respectively. The non-significant model terms with probability values greater than 0.05 have been removed from the following predictive models:
RT   = 308.35 0.427   X 1 1.435   X 2 4.844   X 3 + 0.401   X 4 + 0.019   X 2 2
PORF   = 40.707 + 0.669   X 1 + 0.963   X 2 + 0.478   X 3 + 0.113   X 4 0.007   X 1 2 0.009   X 2 2 0.005   X 3 2
PODF   = 25.961 0.499   X 1 1.349   X 2 + 0.009   X 1 X 2 + 0.005   X 2 X 3 + 0.005   X 1 2 + 0.018   X 2 2
EEC   = 8.141 0.015   X 1 0.084   X 2 + 0.121   X 3 + 0.016   X 4 + 0.001   X 2 2 0.003   X 3 2
where X1, X2, X3, and X4 are the actual values for USP-Time (min), USP-Temp (°C), ART-Temp (°C), and ART-RH (%) factors, respectively.
The standard deviation (STDEV), Mean, coefficient of variation percentage (C.V. %), coefficient of determination (R2), adjusted R2, predicted R2, and Adeq Precision were evaluated using the selected quadratic models of RT, PORF, PODF, and EEC (Table 3). The quadratic model came out best because it exhibited a low standard deviation, high R-Squared values close to 1, and low PRESS. The evaluation criteria of the quadratic models for the RT, PORF, PODF, and EEC are shown in Table 3. The Predicted R2 values of 0.989, 0.995, 0.933, and 0.985 were in reasonable agreement with the Adjusted R2 values of 0.996, 0.998, 0.975, and 0.994 for RT, PORF, PODF, and EEC models, respectively, i.e., the difference is less than 0.2. Adeq precision criteria measure the signal-to-noise ratio, and a ratio greater than four is desirable. The ratio of 66.51, 114.31, 31.2, and 56.3 for RT, PORF, PODF, and EEC models indicated adequate signals. The evaluation criteria indicated that the selected models could describe the experiments. Therefore, these models were used to navigate the design space for the target responses.
The predictive model in terms of actual factors can be used to make predictions of the responses, i.e., RT, PORF, PODF, and EEC for given levels of each factor. In this case, the levels of each factor should be specified in the original units. However, this equation should not be used to determine the relative impact of the factors because the coefficients are scaled to accommodate the units of each factor in the equation, and the intercept is not at the design space center.
Figure 6 shows the scatter plots of the predicted values by the developed models of RT, PORF, PODF, and EEC versus the actual experimental values. Figure 6A–D clearly show that the predicted values were close to the actual experimental values. Therefore, the Box–Behnken design is suitable for responses, i.e., RT, PORF, PDOF, and EEC. Furthermore, the regression line between the predicted and the actual values of all target responses nearly overlapped the 1:1 line (y = x + 0), as shown in Figure 6.

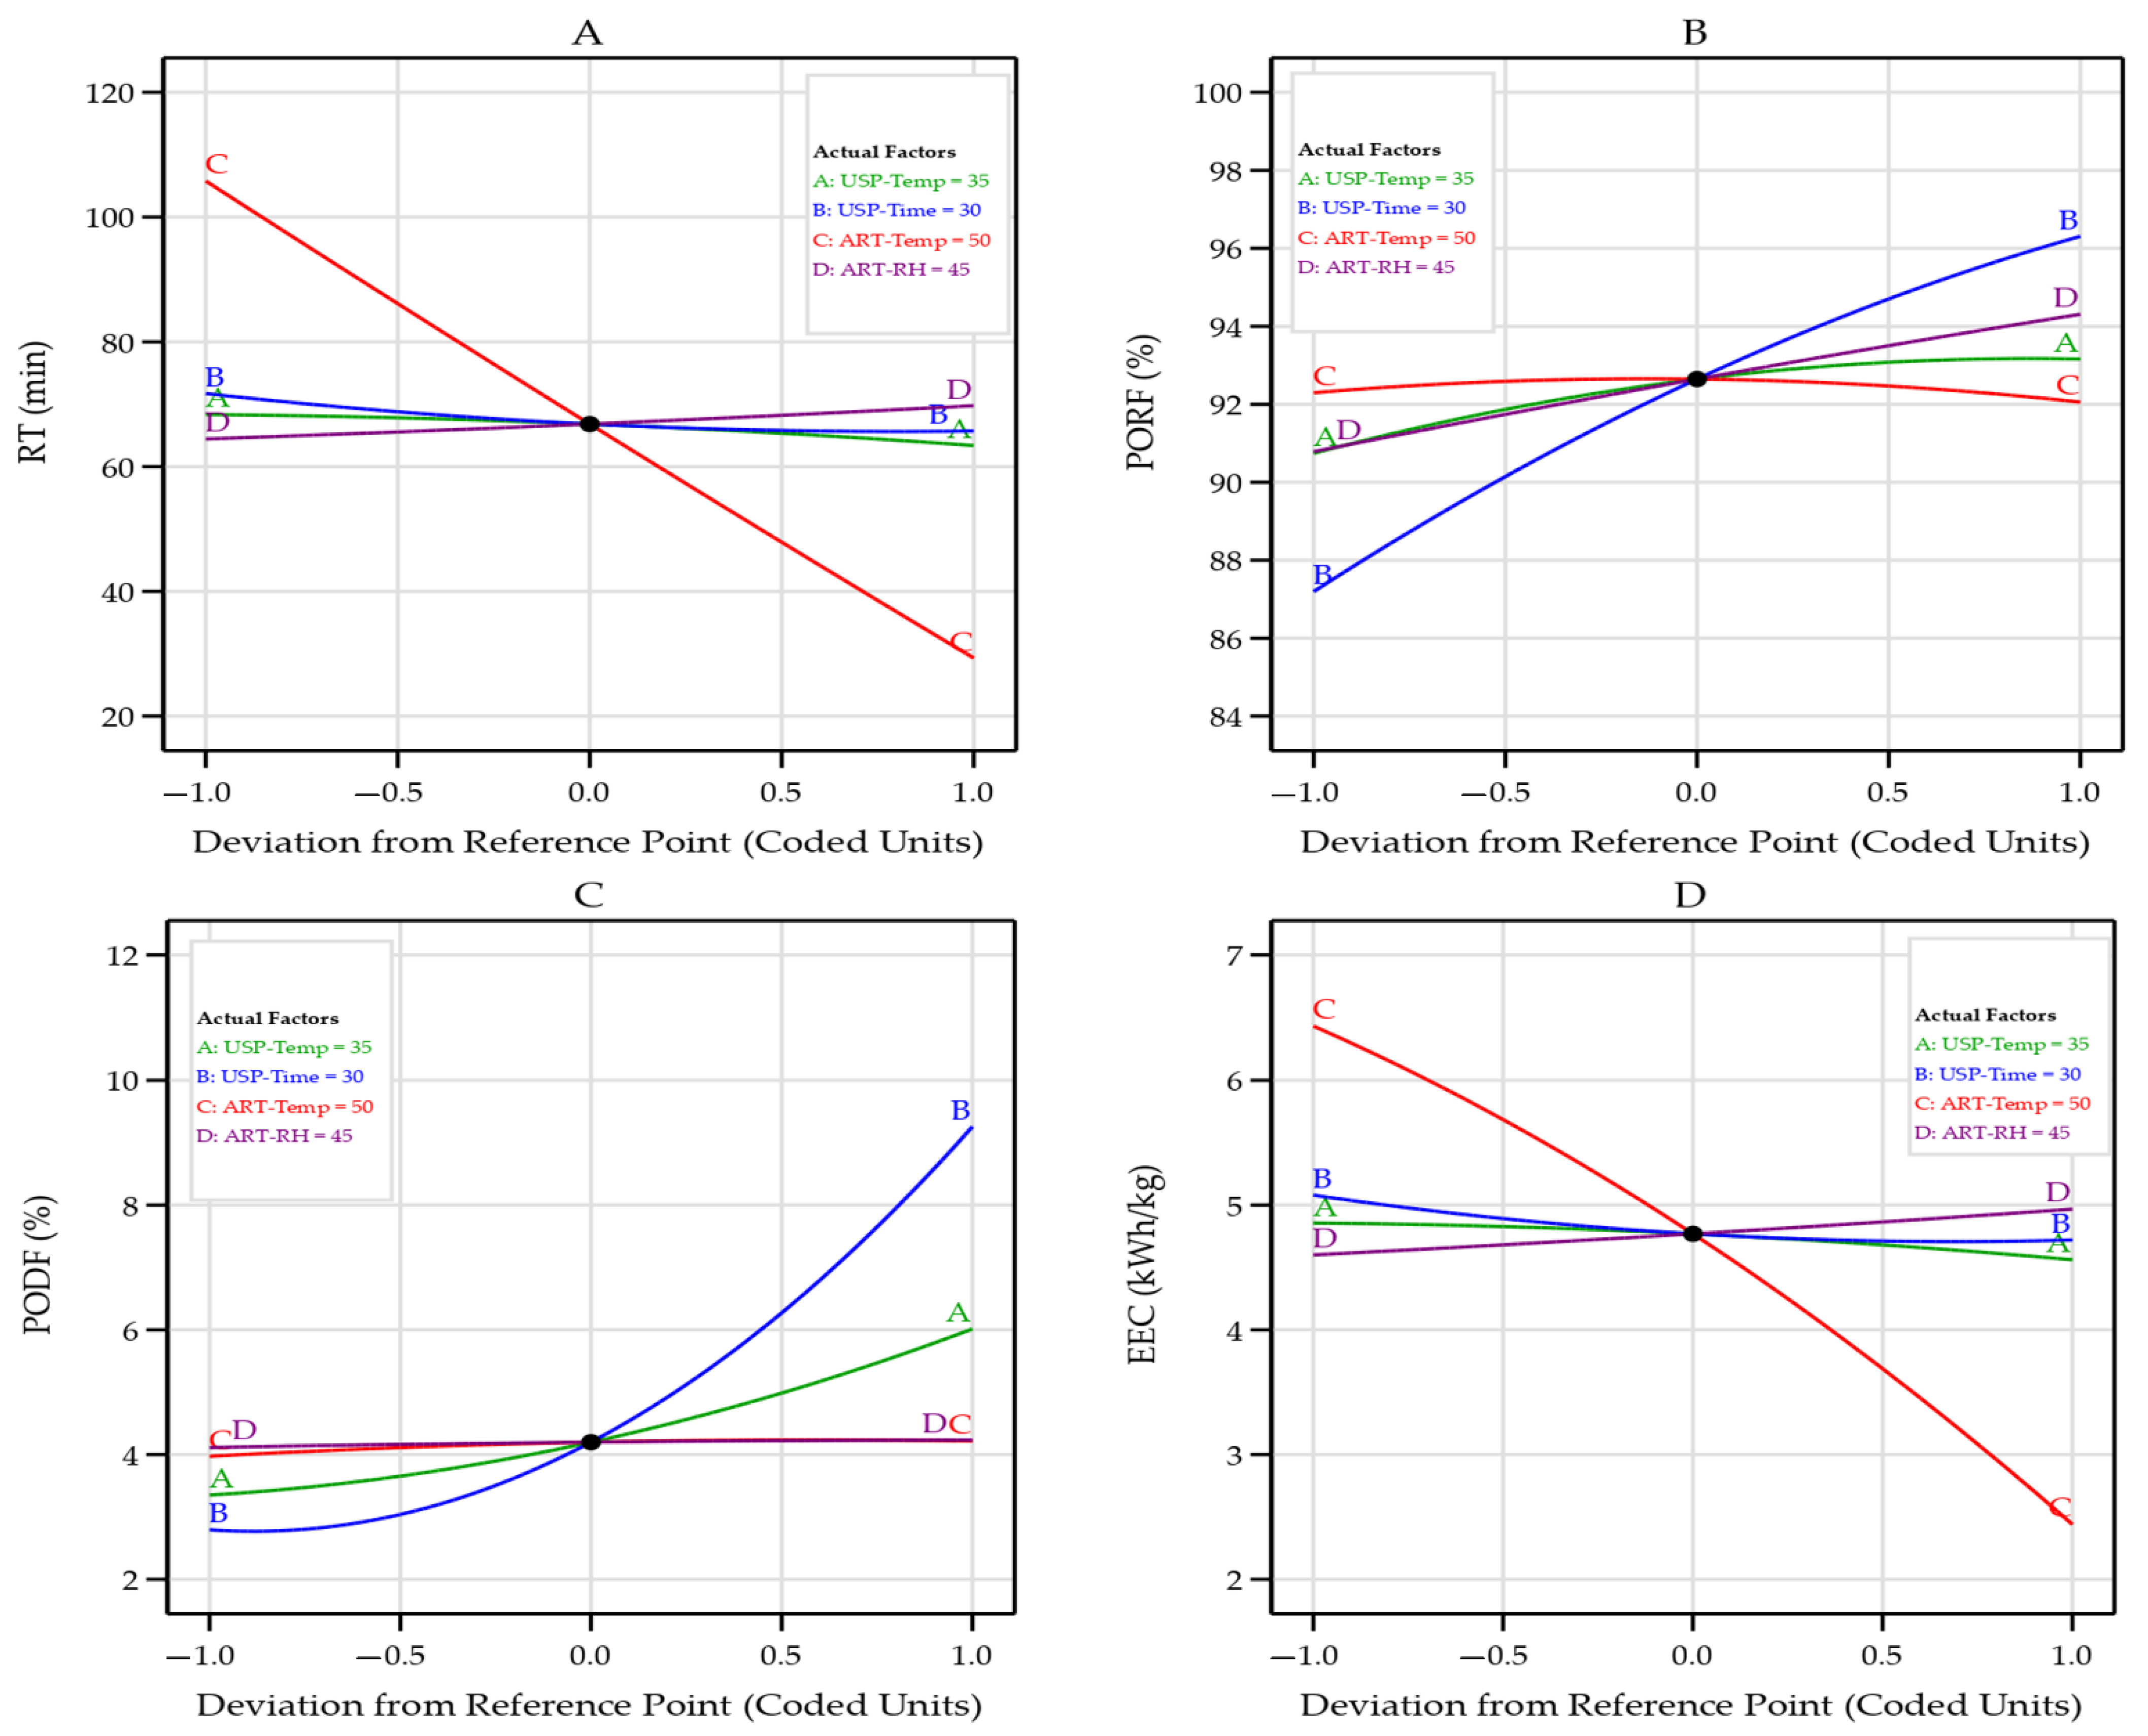
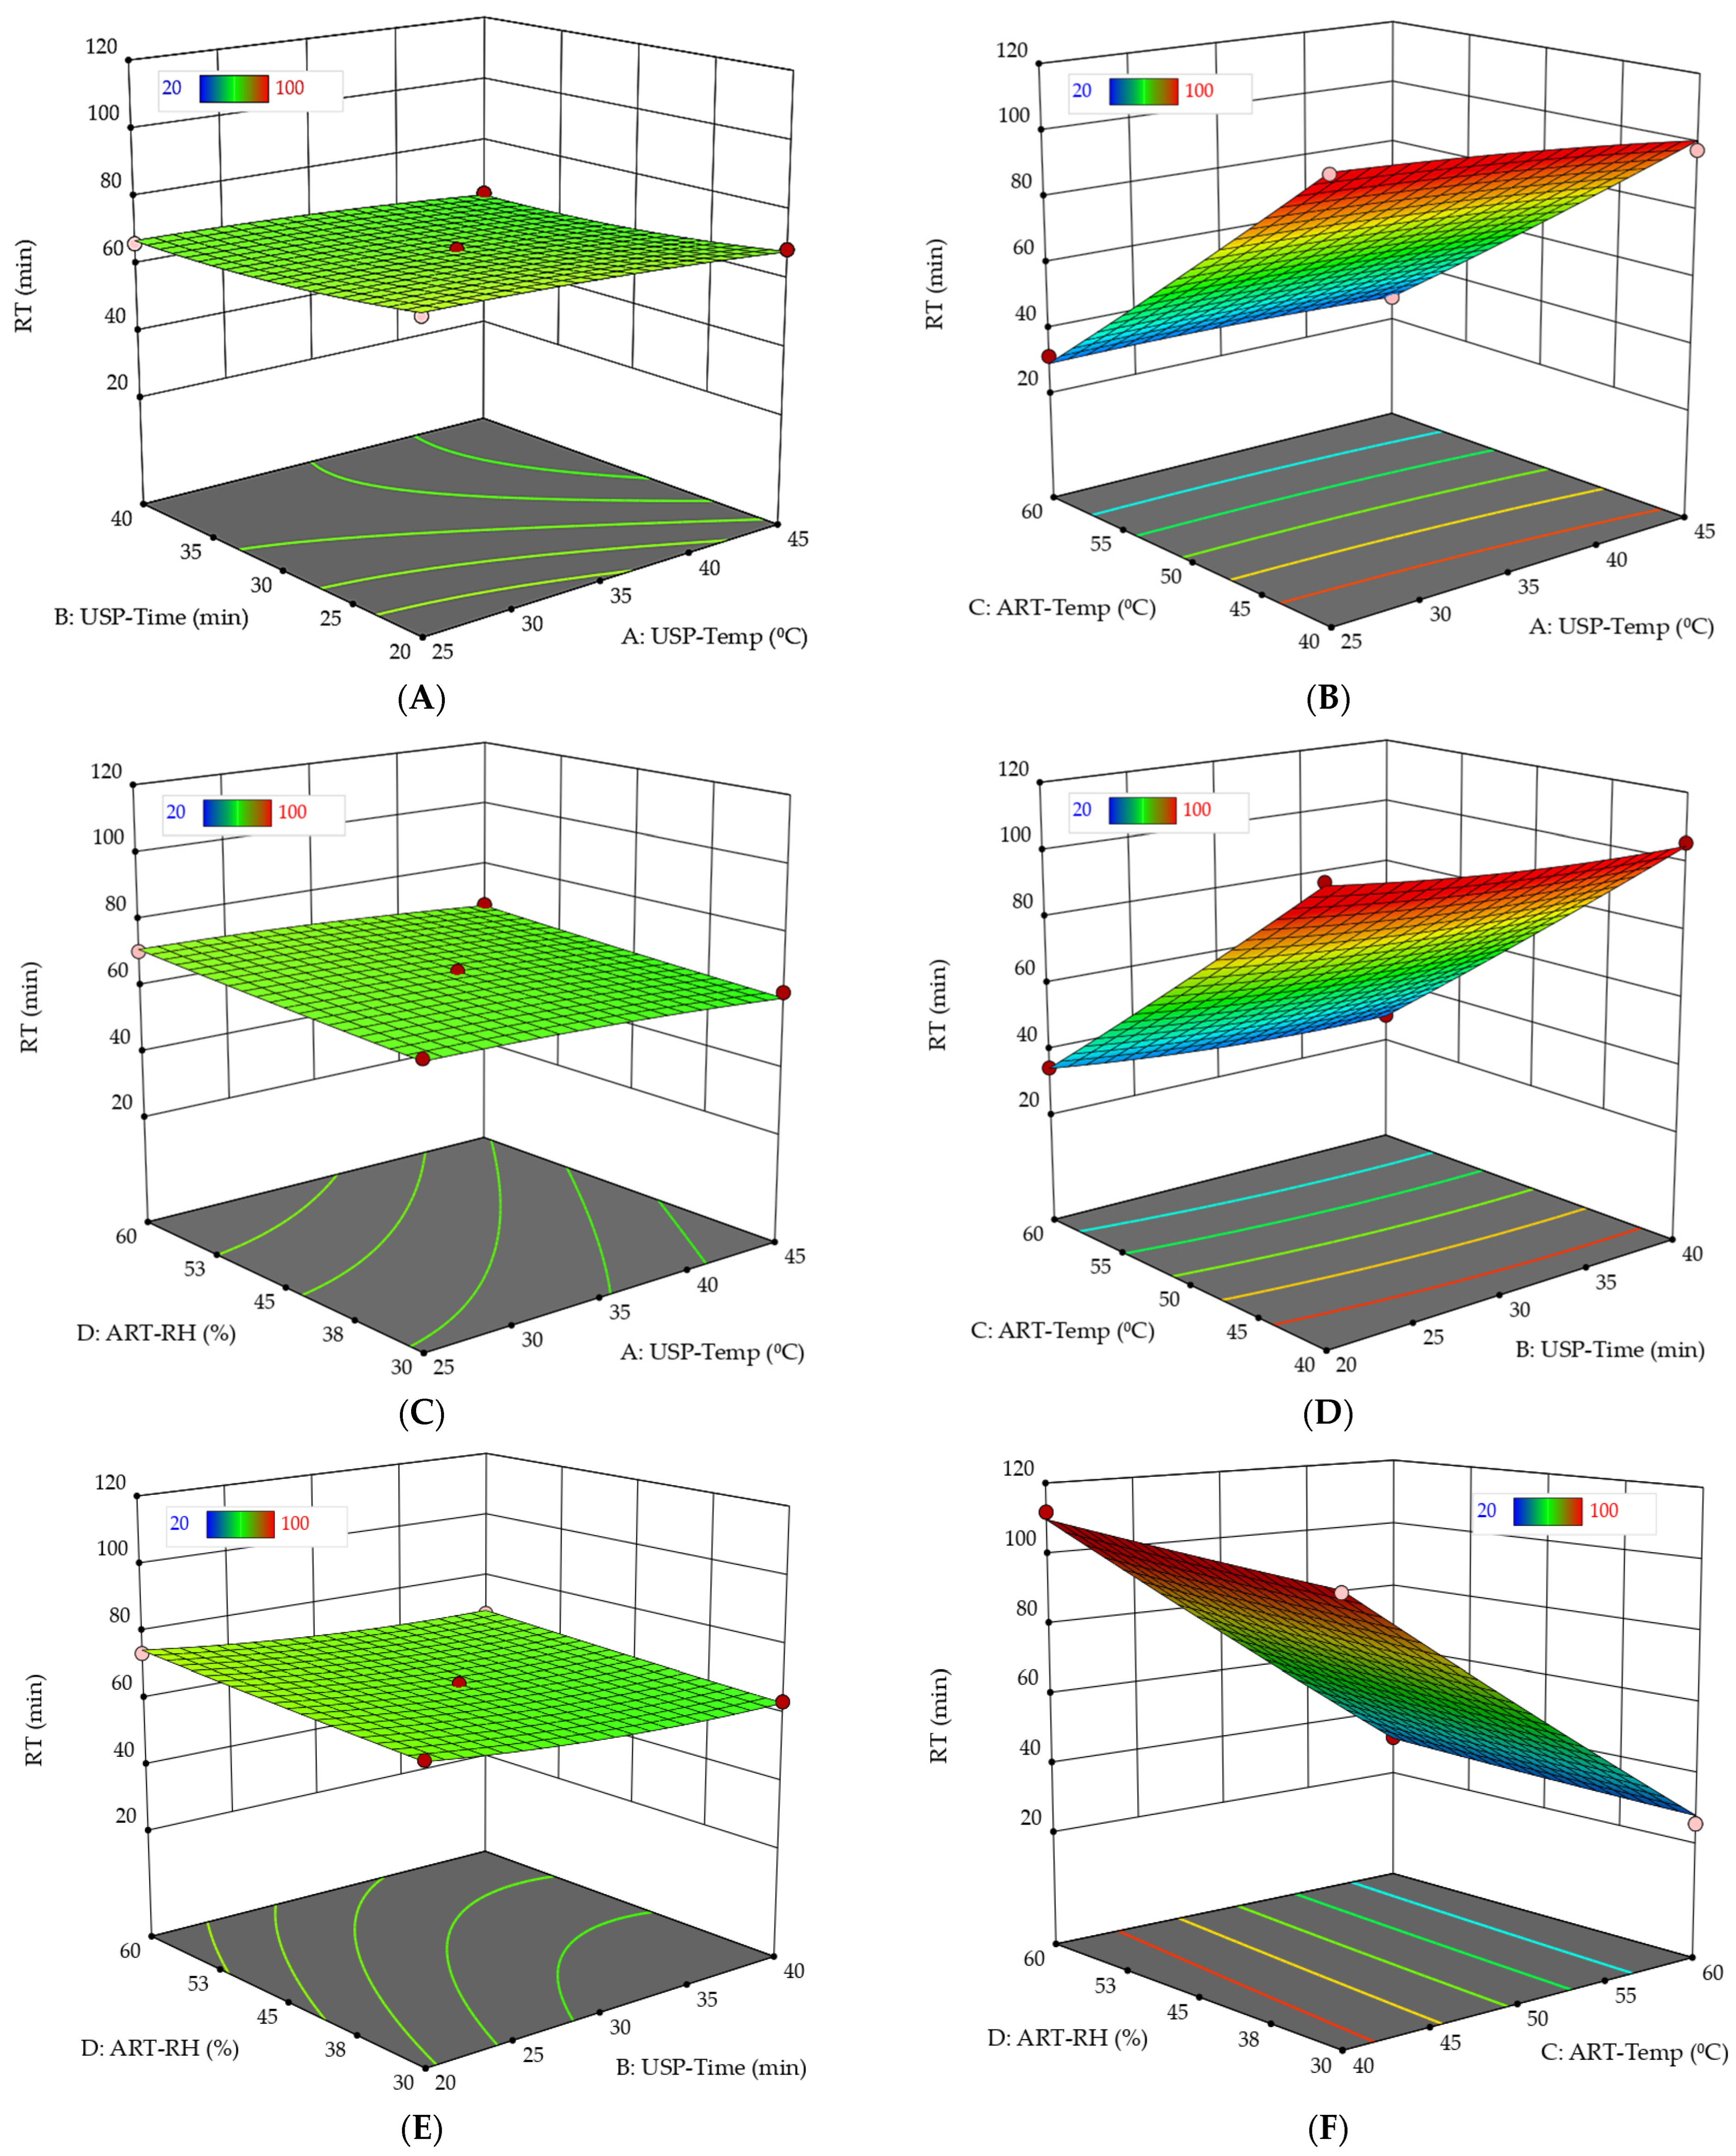
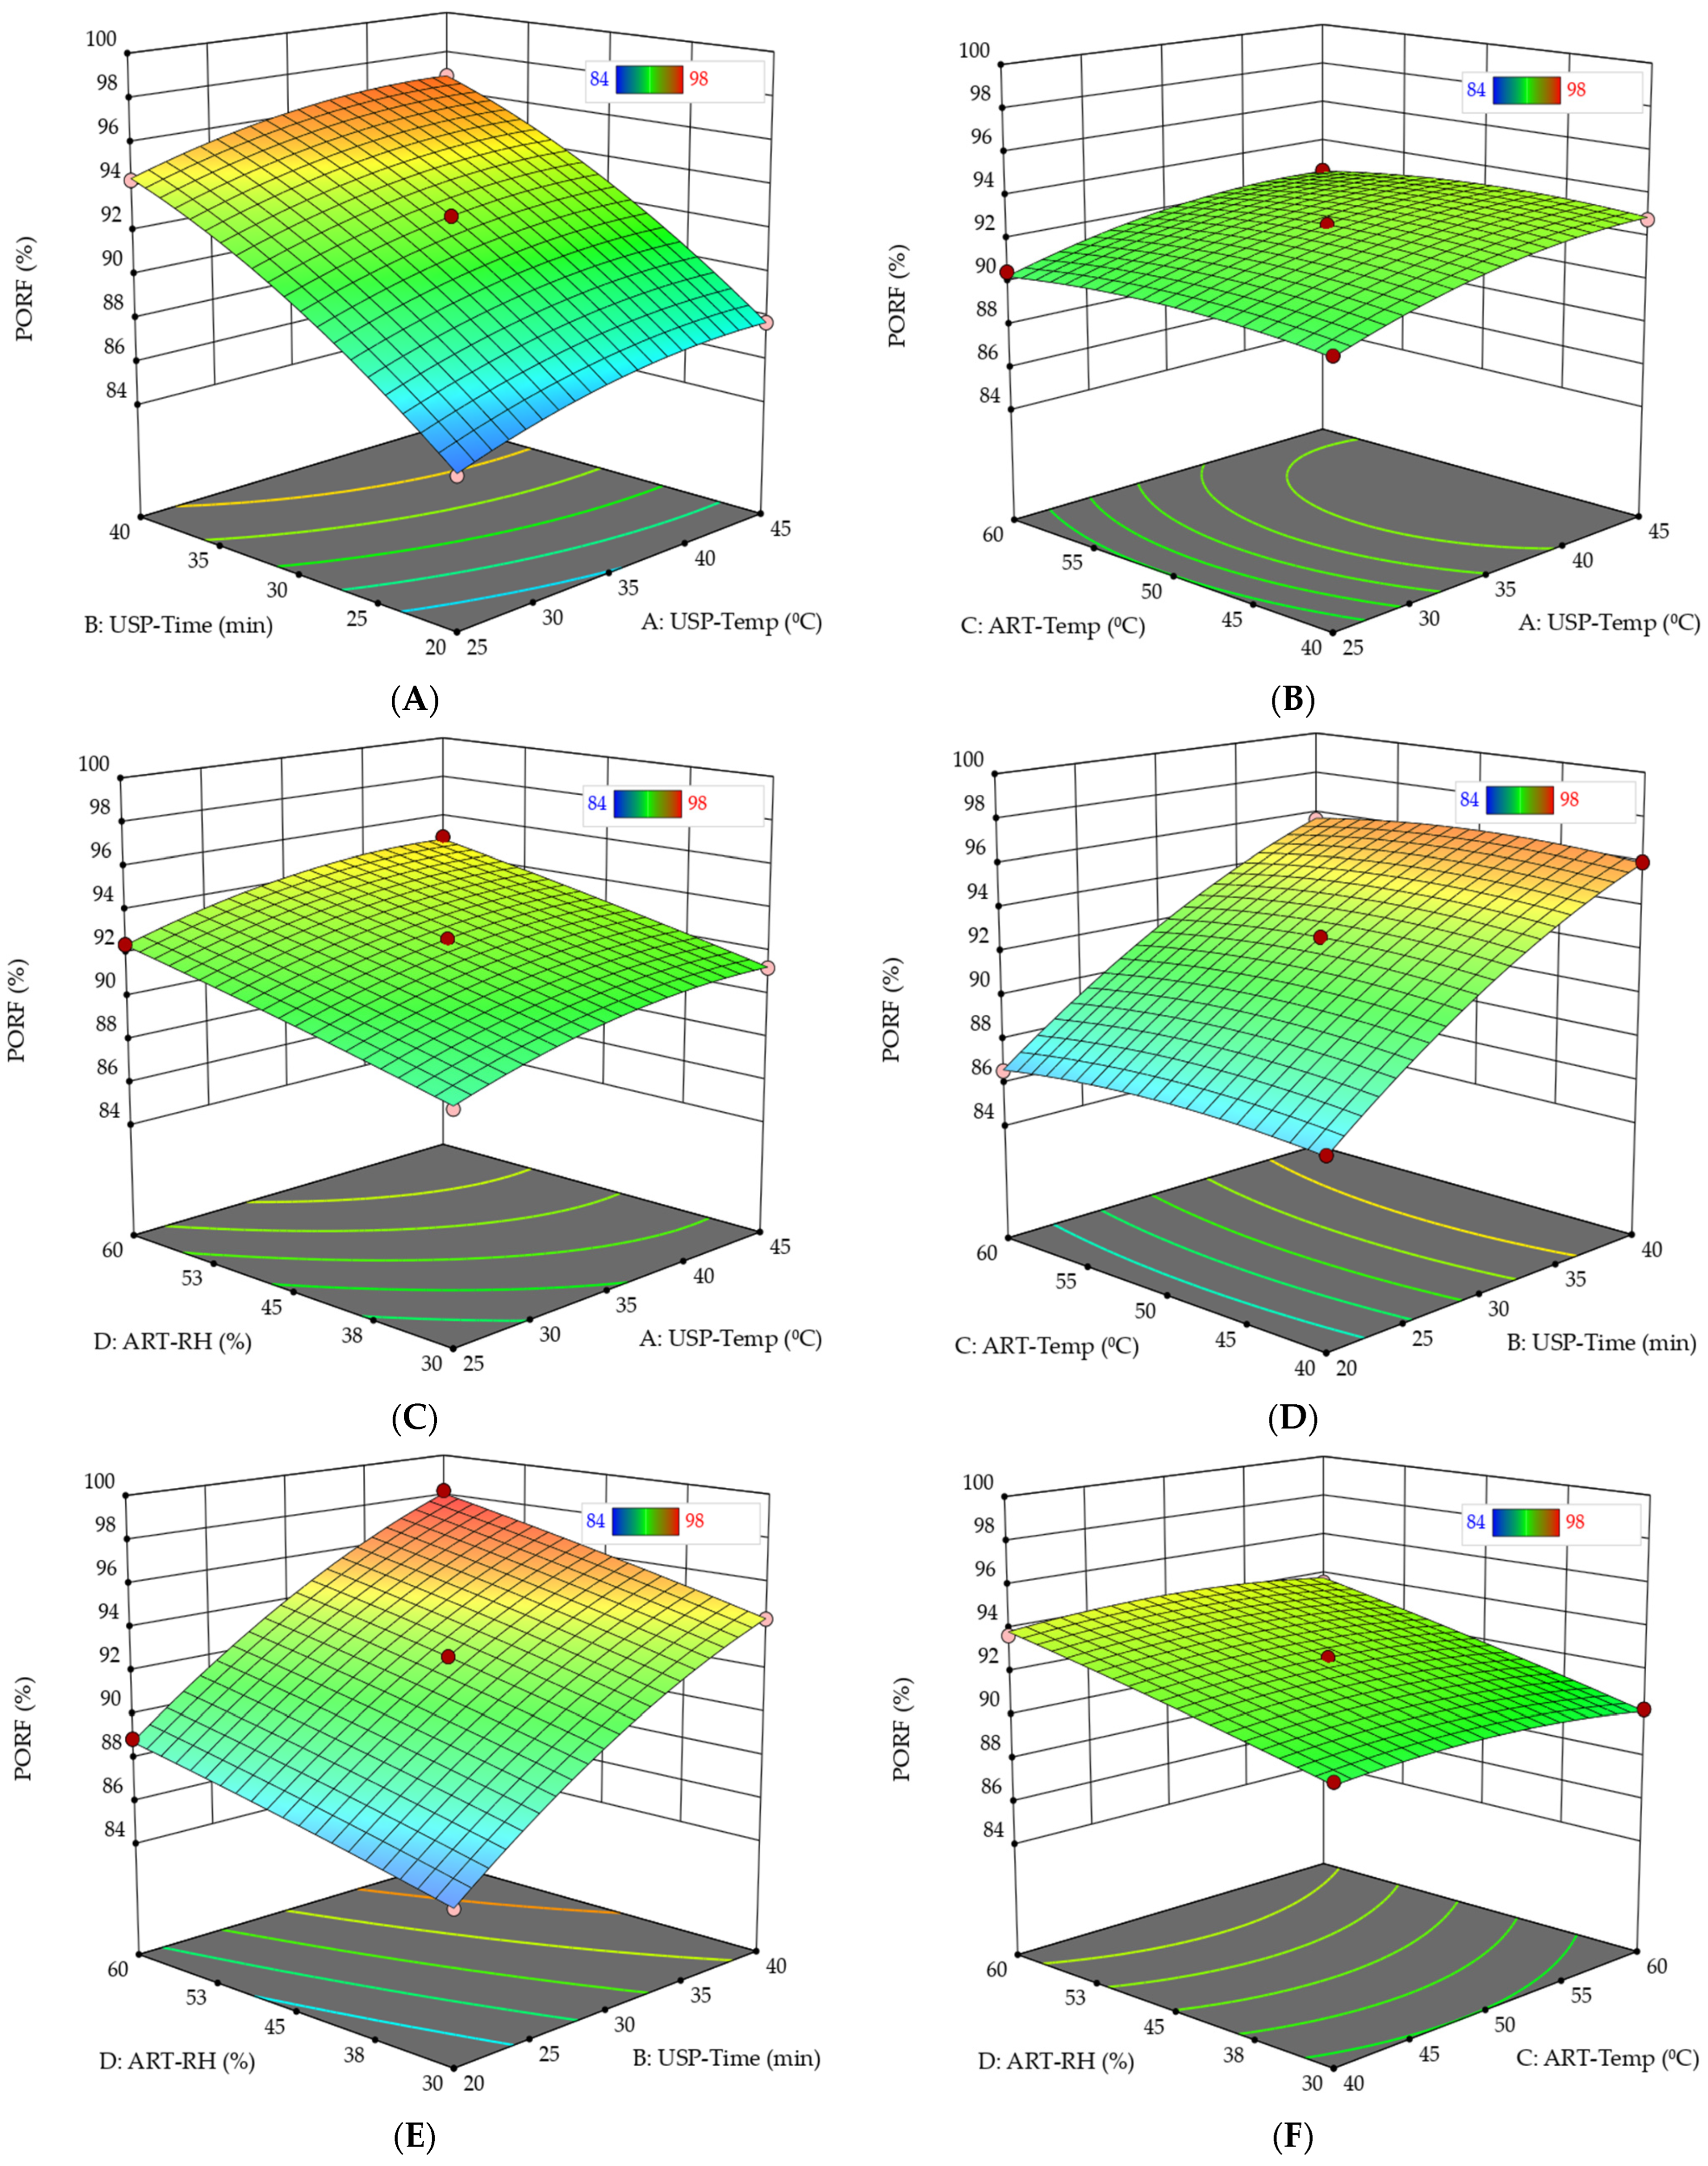
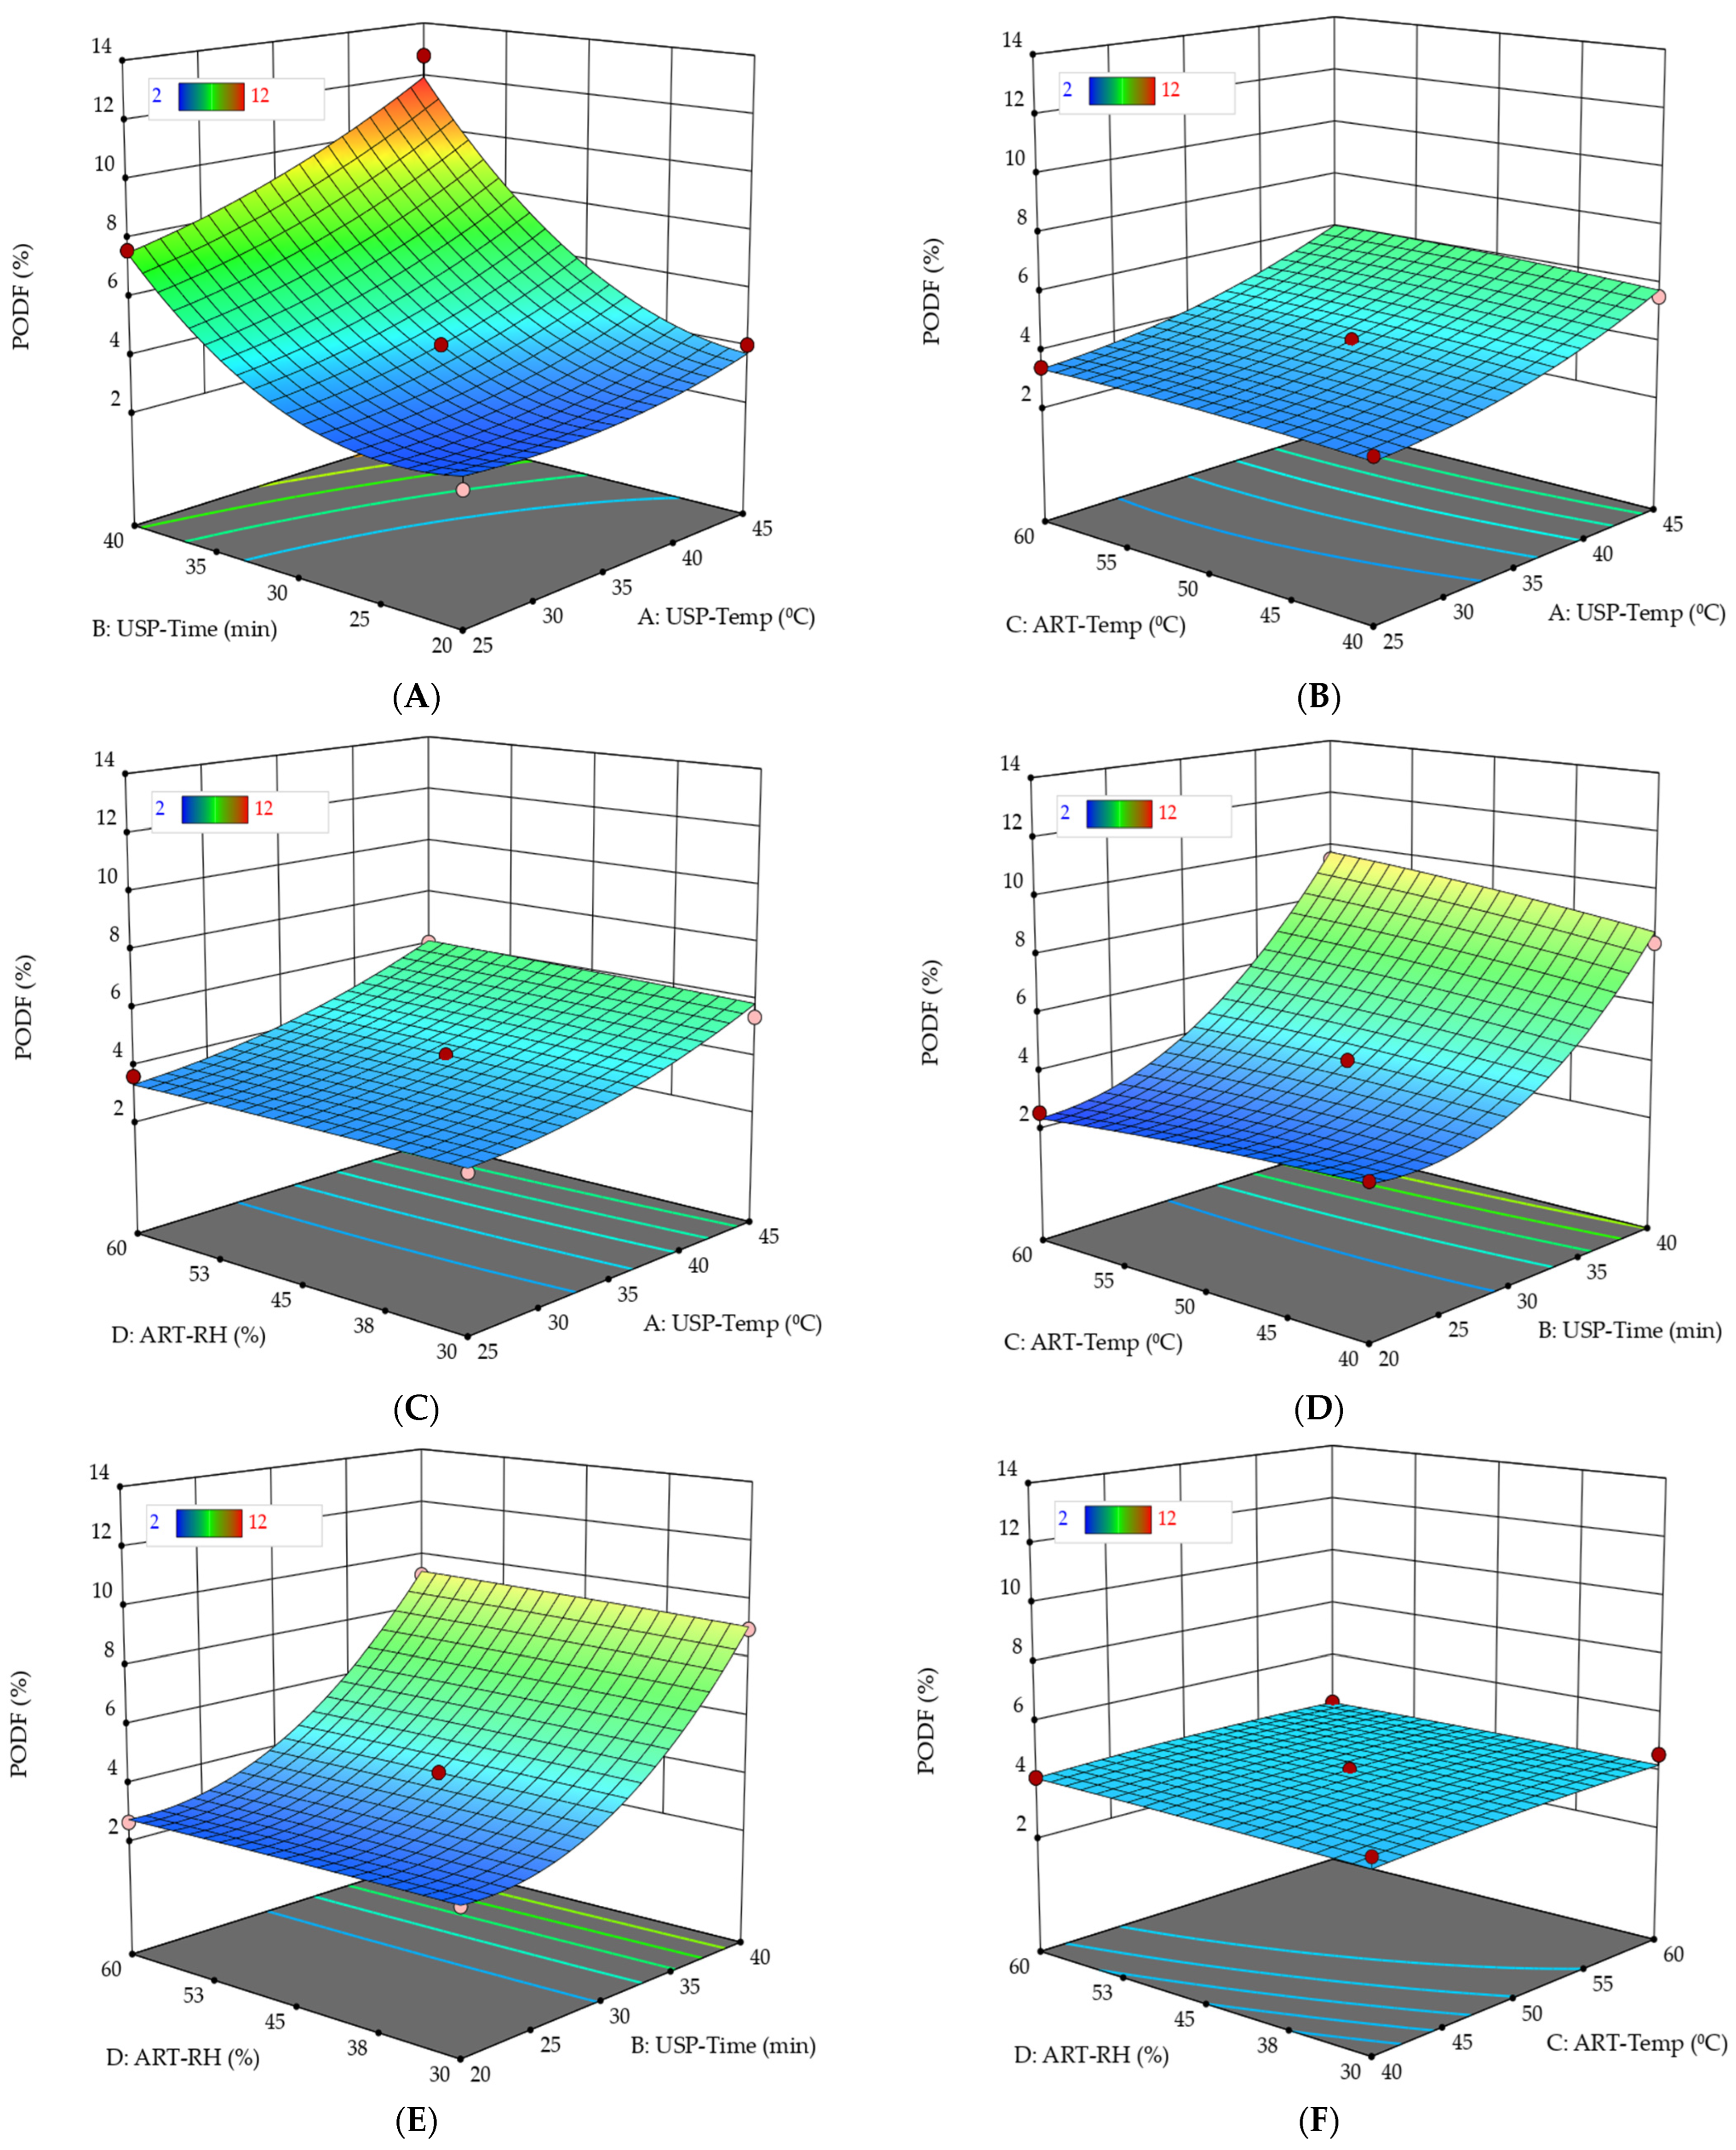
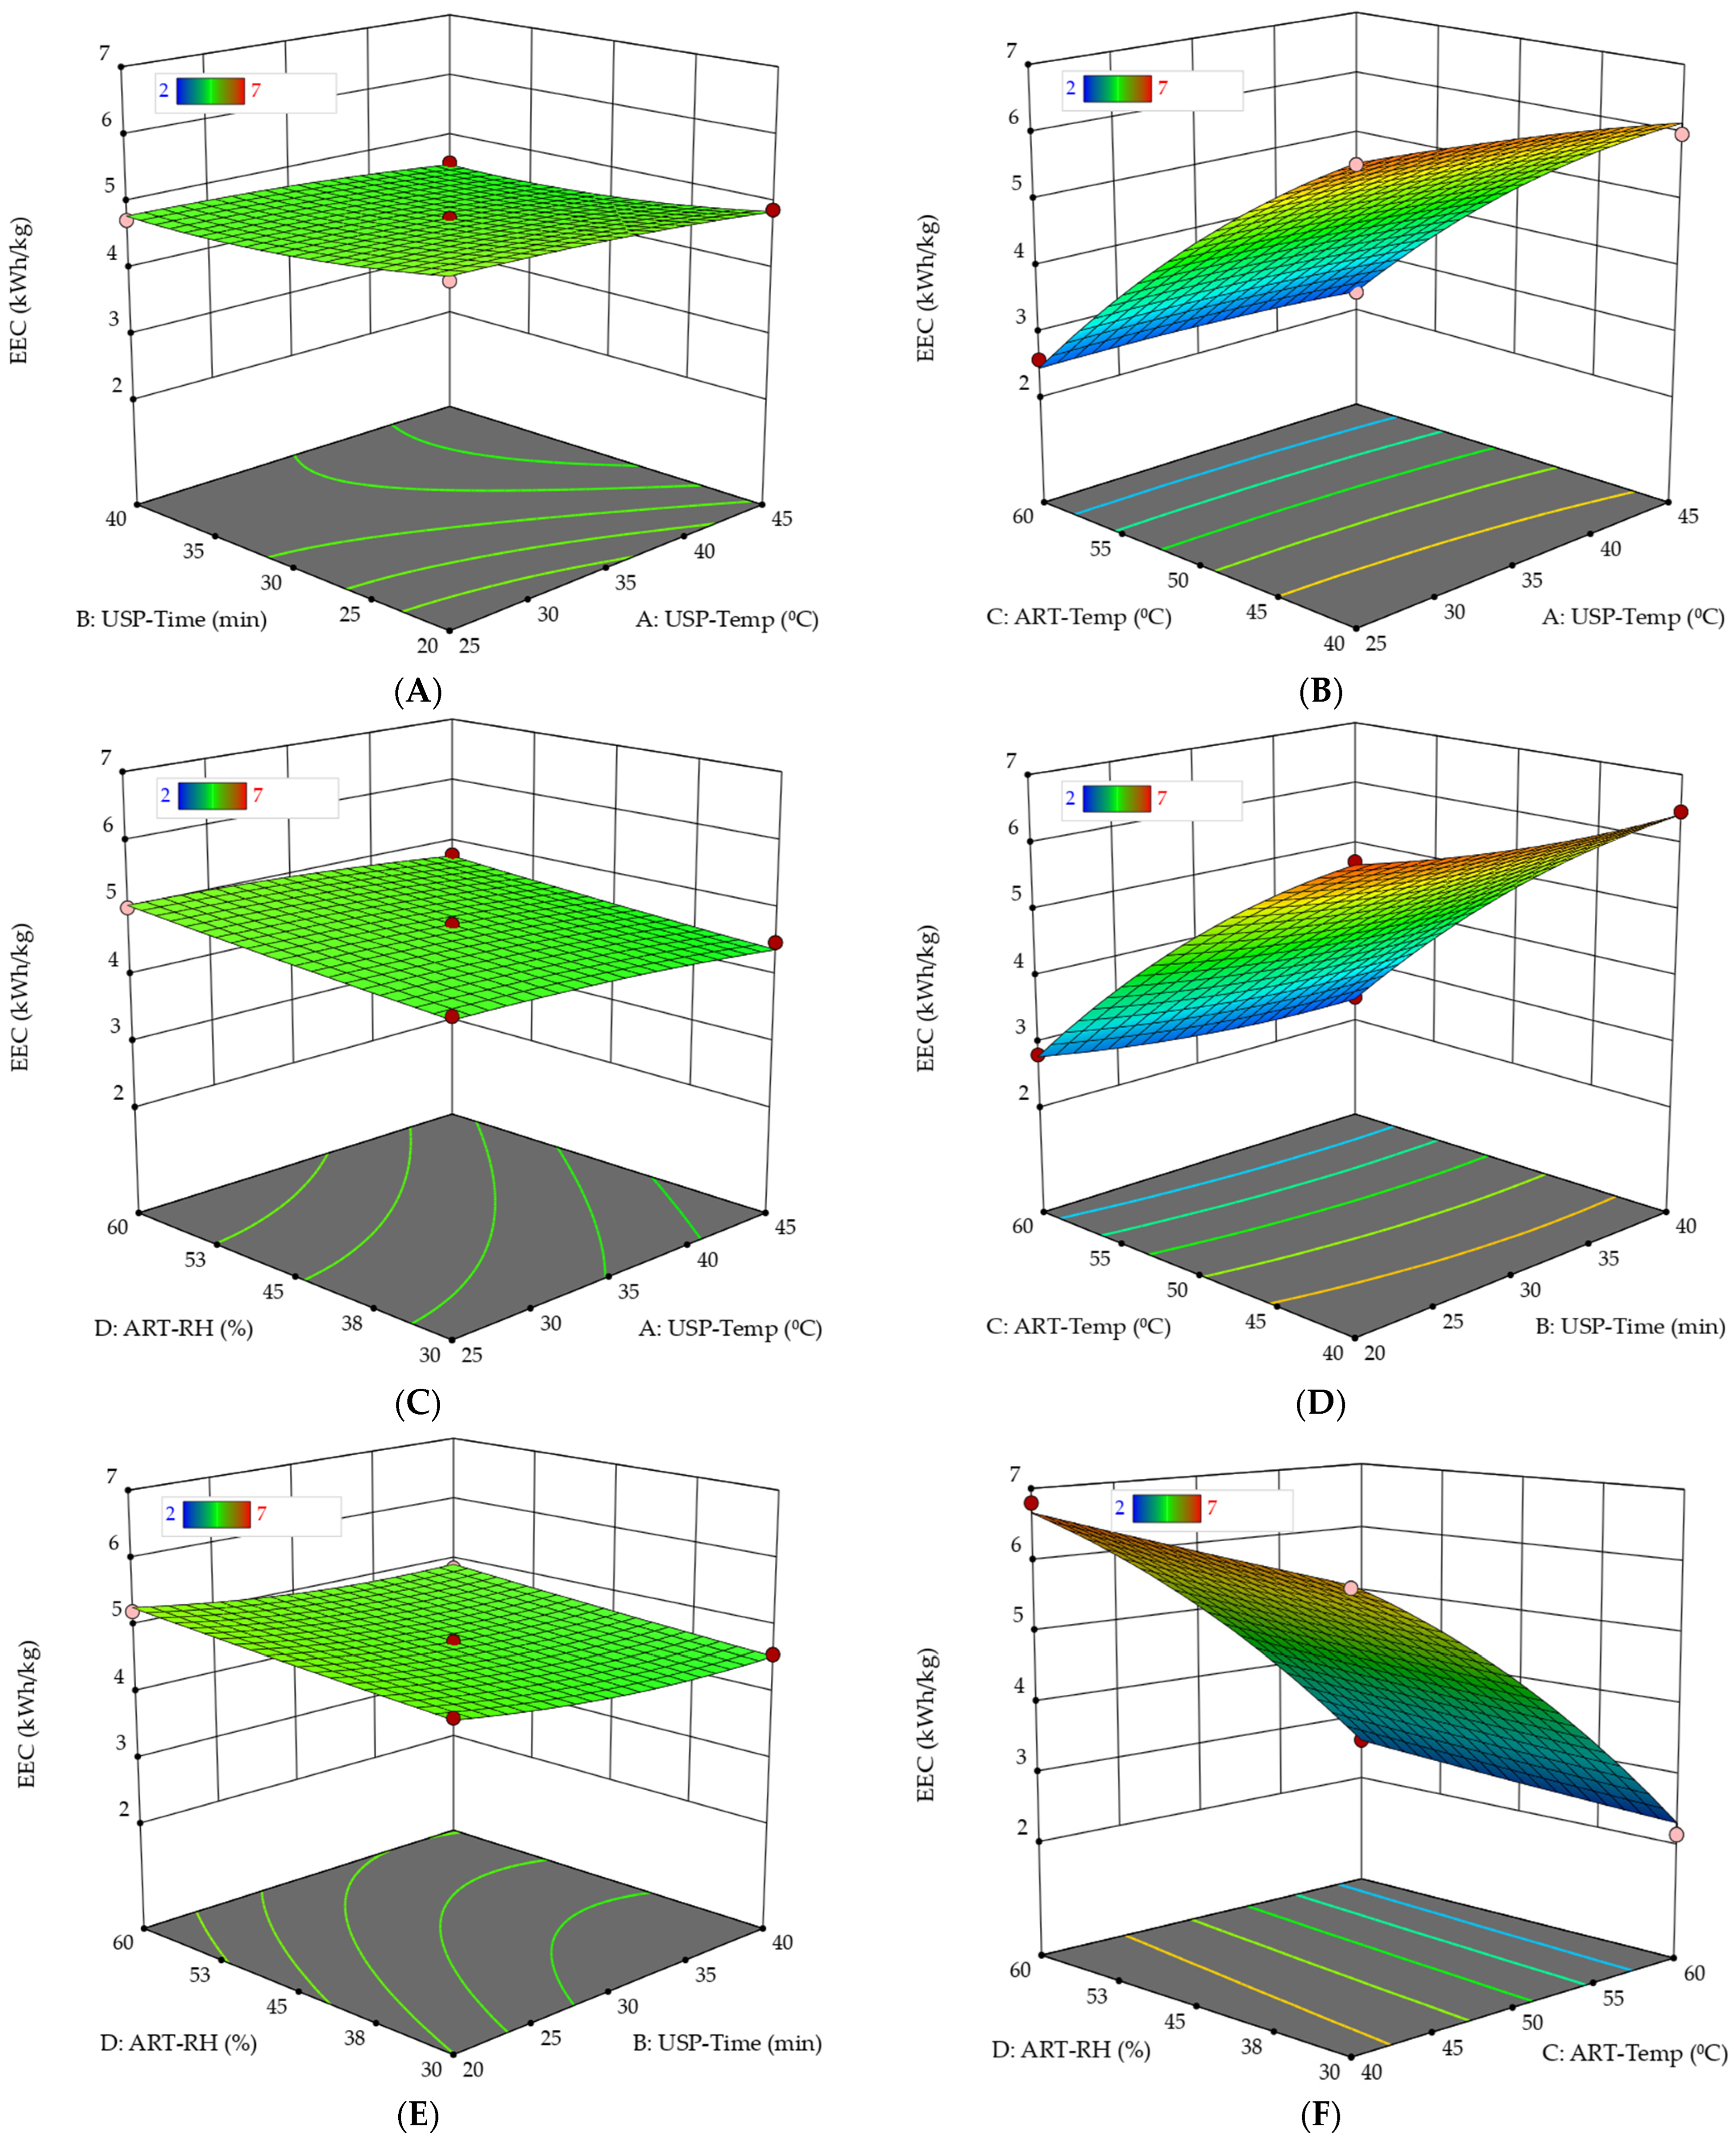
3.2. Effect of the Factors on the RT, PORF, PODF, and EEC

The main effect of the USP-Time (min), USP-Temp (°C), ART-Temp (°C), and ART-RH (%) on the RT, PORF, PDOF, and EEC are shown in Figure 7. Figure 7A–D illustrate the perturbation plots for the modeled RT, PORF, PDOF, and EEC. The response to the studied factors was plotted in this figure by keeping all factors constant at the center value.
Within the experiment factors’ low and high levels range, the perturbation plot shown in Figure 7A illustrated the effect of the USP-Temp, USP-Time, ART-Temp, and ART-RH on the RT. This graph displays how the RT response changes when each factor moves from one reference point to another, with the other factors held constant at a selected reference point. A steep curvature or slope in a factor implies that the response is sensitive to it. The ART-Temp is the most influential factor on the RT response, followed by the other factors. The RT decreased with increasing ART-Temp and slightly increased with increasing USP-Time and USP-Temp.
In contrast, the RT increased with increasing ART-RH. The ART-RH is less significant than other factors, but Figure 7B presents that the PORF increases as the ART-RH increases. In addition, ART-RH is a significant factor in improving ripe fruit quality attributes during artificial ripening [20].
Figure 7B shows the effect of the USP-Temp, USP-Time, ART-Temp, and ART-RH on the PORF. It is noticed from this graph that the increase in USP-Time, USP-Temp, and ART-RH led to an increase in the PORF. USP-Time is the most influential factor in the RT response, followed by ART-RH and USP-Temp, respectively. The increases in the ART-Temp to a high level or decreases to a low level led to a slightly decreased PORF. Figure 7C shows the effect of USP-Temp, USP-Time, ART-Temp, and ART-RH on the PORF on PODF. There was no significant effect of ART-Temp and ART-RH on the POFD. Fruit damage is due to mechanical damage caused by the impact of ultrasound pretreatment on fruit texture.
Figure 7D shows the effect of USP-Temp, USP-Time, ART-Temp, and ART-RH on the EEC. This graph shows that the ART-Temp is the most influential factor on the EEC, followed by USP-Temp and USP-Time. The EEC decreased with increasing ART-Temp and slightly increased with increasing USP-Time and USP-Temp. In contrast, the EEC increased with increasing ART-RH. The effect of all factors on the EEC is similar to the effect of the factors on RT, as shown in Figure 7A,D, because the total EEC for ripening the fruits is related to the duration of the artificial ripening treatment.
The response surface plots were created according to Equations (8)–(11) to determine the optimum conditions for each target parameter. The interaction effect of the factors on the RT, PORF, PDOF, and EEC was plotted with 3D plots using Design Expert, as shown in Figure 8, Figure 9, Figure 10 and Figure 11. The 3D surface can be plotted as a function of two factors while keeping the other factors at fixed levels. These 3D surface plots assist us in understanding the interaction effects of the two factors (significant or non-significant) on the response. The 3D response surfaces plots for the responses of RT, PORF, PDOF, and EEC provide graphical illustrations of the refined quadratic equations selected after model reduction; such graphical illustrations display the relationship between the experimental factors and the responses. The effects of USP-Temp and USP-Time (Graph A), USP-Temp and ART-Temp (Graph B), USP-Temp and ART-RH (Graph C), USP-Time and ART-Temp (Graph D), USP-Time and ART-RH (Graph E), and ART-RH and ART-Temp (Graph F) on the RT, PORF, PDOF, and EEC, respectively, are shown in Figure 8, Figure 9, Figure 10 and Figure 11.
Figure 8A–E indicates that the RT decreased with increasing USP-Temp from 25 to 45 C, ART-Temp from 40 to 60 °C, and USP-Time from 20 to 40 min. In contrast, the RT increased with an increase in ART-RH from 30 to 60%.
The PORF increased with an increase in the USP-Temp, USP-Time, and ART-RH, as shown in Figure 9A–E. The PORF significantly increased with an increase in USP-Temp from 25 to 45 °C and USP-Time from 20 to 40 min, as shown in Figure 9A. A higher PORF was obtained at a higher USP-Temp and 50 °C ART-Temp, as shown in Figure 9A. The USP-Temp was the least influential factor on the PORF, as shown in Figure 9B,D.
Figure 10A–E shows the effect of USP-Time, USP-Temp, ART-Temp, and ART-RH on PODF. The PODF increased with the increase in USP-Time and USP-Temp. In addition, the interactive effect of USP-Temp and USP-Time on PODF is significant, as shown in Figure 10B. The effect of USP-Time on the PODF response is stronger than the effect of USP-Temp; there was no effect of ART-Temp and ART-RH on PODF, as shown in Figure 10A–E. Although the ART-Temp does not affect the PODF, the interaction between it and USP-Temp was highly influential on the PODF. The interactive effect of USP-Temp and USP-Time on PODF is also very influential, as shown in Figure 10B.
Figure 11A–E show the effect of USP-Time, USP-Temp, ART-Temp, and ART-RH on EEC. The ART-Temp is the most influential factor on the EEC response, followed by the USO-Temp and USP-Time, as shown in Figure 11A–D, because high ART-Temp greatly reduces the RT, consequently reducing the EEC. The EEC decreased with increasing ART-Temp and slightly increased with increasing USP-Time and USP-Temp. In contrast, the EEC slightly increased with increasing ART-RH, as shown in Figure 11E.

3.3. Simultaneous Optimization of the Parameters

The optimization in the current study consisted of optimizing the S-BARS operating parameters and ultrasound pretreatment process condition. In each case, the objective of optimization is to achieve the best results in the shortest time, a high percentage of ripe fruits, a low percentage of damaged fruits, and low energy consumption to decrease the processing cost. The desirability function approach helps analyze experiments in which the multi-responses, i.e., RT, POEF, PODF, and EEC, must be optimized simultaneously. The RT, POEF, PODF, and EEC response values can be achieved efficiently by adjusting the ultrasound pretreatment and S-BARS parameters conditions with the help of an appropriate numerical optimization method. The EEC value is desired to be as small as possible to decrease the processing cost while maintaining ripe fruit quality. Therefore, the RT, POEF, PODF, and EEC were studied together. Once the predictive models had been developed and evaluated to validate their adequacy, the optimization criteria determined the optimum conditions for ultrasound pretreatment and the S-BARS operating parameters. This investigation executed three criteria to optimize the RT, POEF, PODF, and EEC. The first criterion was to minimize the RT, PODF, and EEC and maximize the PORF using the minimization of ART-Temp, USP-Time, ART-Temp, and ART-Time. The second criterion was to minimize the RT, PODF, and EEC and maximize the PORF using the minimization of ART-Temp with USP-Temp, USP-Time, and ART-RH under the experimental ranges. The third criterion was to minimize the RT, PODF, and EEC and maximize the PORF using the USP-Temp, USP-Time, USP-Time, and ART-RH under the experimental ranges. Table 4 summarizes the three criteria constraints for optimizing RT, PODF, PODF, and EEC. The best solutions for satisfying the optimization criteria for USP-Temp, USP-Time, ART-Temp, ART-RH, RT, PORF, PODF, and EEC are shown in Table 5.

3.4. Models Validation under Optimization Criteria

The validation experiments aimed to validate the predictive model’s accuracy under the optimization criteria for USP-Temp, USP-Time, ART-Temp, and ART-RH. Therefore, triplicate validation experiments were performed on the parameter combinations acquired under the optimization criteria. The experimental details and the results of the validation experiments are shown in Table 6. The developed models showed good performance based on the evaluation criteria, i.e., ARPE and RMSE, as shown in Table 6. The RMSE and MAPE values closer to 0 exhibit more agreement between the actual and predicted values. The experimental results confirmed the effectiveness and accuracy of the response surface predictive models for optimum artificial ripening parameters at the optimum ultrasound pretreatment and S-BARS operating parameter combination. As a result, the BBD’s predictive models are considered accurate and reliable for predicting the RT, PORF, PODF, and EEC.

3.5. Physicochemical Properties of Date Fruit

The physicochemical properties of date fruit were evaluated under the optimization criteria of S-BART conditions, i.e., ART-Temp and ART-RH for untreated date fruit (Trial: 1–3), and the optimization criteria of ultrasound pretreatment, i.e., ART-Temp, ART-RH, USP-Time, and USP-Temp (Trial: 3–6), as shown in Table 7. The first trial was conducted using untreated date fruits under 53.43 °C ART-Temp and 55.01% ART-RH. The second trial was conducted using untreated date fruits under 53.09 °C ART-Temp and 50.03% ART-RH. The third trial was conducted using untreated date fruits under 60 °C ART-Temp and 59.98% ART-RH. The fourth trial was conducted using ultrasonically pretreated date fruits under 34.11 °C USP-Temp, 29.01 min USP-Time, 53.43 °C ART-Temp, and 55.01% ART-RH. The fifth trial was conducted using ultrasonically pretreated date fruits under 35.34 °C USP-Temp, 32.21 min USP-Time, 53.09 °C ART-Temp, and 55.26% ART-RH. The sixth trial was conducted using ultrasonically pretreated date fruits under 32.49 °C USP-Temp, 32.03 min USP-Time, 60 °C ART-Temp, and 59.98% ART-RH. The physicochemical properties of artificially ripened date fruits under the six conditions (pretreated via ultrasound and untreated fruits) were compared with naturally ripened fruit (Control). The evaluated physicochemical properties of date fruit (Khalas cv.), i.e., fruit length (FL), fruit diameter (FD), fruit weight (FW), fruit density (De), fruit firmness (FF), color parameters (L, a, and b), pH, moisture content (MC), fructose content (FC), glucose content (GC), total sugar content (TSC), and total soluble solids (TSS) are shown in Table 7. There was no significant difference between treatments and naturally ripened fruits (control) regarding FL, FD, a value, PH, and TSS. At the same time, there was a significant difference between the treatments and control regarding the other properties, i.e., FW, De, FF, L, b, MC, FC, GC, and TSC.
Table 7 shows that the date fruit pretreated by ultrasound improved the color characteristics of the artificially ripened date fruits, which were characterized by a light color compared to the untreated dates and the naturally ripe dates. However, it is noted that ultrasound pretreatment reduced the sugars by a slight percentage compared to the control and untreated date fruit by ultrasound. In addition, the density of ultrasound pretreated dates was better than that of untreated fruits and their firmness. Based on these results, using the conditions of the fourth trial based on the third criterion achieves the best results for the quality of fruits, followed by the sixth trial conditions based on the first criterion. However, considering the parameters of ripening, i.e., RT, PORF, PODF, and EEC, combined with the quality parameters of the date fruits, the sixth trial is the best.

4. Discussion

Ultrasound pretreatment influences mass and heat transfer phenomena. In ultrasound treatments with a solid immersed in a fluid, similar to the current experiment, ultrasound accelerates internal transport, making fluid entry and exit easier and facilitating exchanges between the solid surface and the surrounding fluid. Then, when used efficiently, ultrasound pretreatment is useful in applications involving heat and mass transfer, decreasing the internal and external resistance to transport [73]. The ultrasound pretreatment technique has been used on several fruits for fruit drying, decontamination, storage quality and durability, and pesticide reduction. Although ultrasound has varied effects on different fruits, it has been found to hasten drying times significantly and shorten overall processing times [74,75,76,77,78]. Although there was no significant effect of ultrasound pretreatment on FL, FD, a, pH, and TSS in the current study, it significantly impacts FW, De, FF, L, b, MC, FC, GC, and TSC. Ultrasound pretreated fruits of date palm gained water and lost solids, and hence, had higher fruit weight. It could be because the effective diffusivity of water in the fruit increased after applying ultrasound, reducing air-drying time [49]. Similar results were found in the ultrasonic pretreatment of bananas [49,79].
The findings of the present study revealed that the ultrasound-pretreated fruit color resembled the control fruits, which indicated that the original Tamr fruit color attributes were much more preserved when unripe fruits were pretreated ultrasonically at 32.49 °C USP-Temp and 32.03 min USP-Time, 60 °C ART-Temp, and 59.98% ART-RH (Table 7, Trial-6). This may be connected to the shortest drying time because the enzymatic activity decreases, the color changes during drying when the drying time is shortened, and the heat increases [80,81]. The degradation of pigments and the enzymatic and non-enzymatic browning reactions caused by the extended exposure to heat, which damages the physical quality of the fruit, may be the cause of the color changes [43]. A low rate of color change was also exhibited when the fruit’s surface contact with oxygen decreased during drying, and the sample did not have long exposure to heat and pigment oxidation [82]. Ultrasound treatment only caused substantial changes in the value of color parameter L; the a and b values of the blueberry fruits did not vary significantly, which indicated that the ultrasound technique preserves the desirable reddish-blue color of blueberries caused by anthocyanins [83].
Firmness is one of the important textural characteristics to consider when assessing fruit quality degradation. It relates to the harvest time and the fruit’s suitability for processing and commercialization. The physical-chemical and structural alterations of the biological material are related to this property [84]. The present study indicated that the untreated fruits had maximum firmness. It was significantly lower when the USP-Temp and USP-Time were minimum (Trial 4) and increased in Trials 5 and 6 (Table 7). The pectin matrix’s structure and composition, as the middle lamella’s main constituent, determines cell-to-cell adhesion and provides firmness and elasticity to the tissue [85,86]. During thermal processing, most parenchyma-rich fruits lose a significant amount of their firmness due to pectin degradation and cell separation [87,88]. However, the activity of cell wall-bound peroxidase depends upon the type of tissue and the processing conditions; ultrasound treatment has a diverse impact on the structure and texture of fruits. Due to the high pressure and temperature that occur with the collapse of cavitating bubbles, the use of low-frequency, high-power ultrasound may significantly disrupt tissue, resulting in the loss of turgor pressure and softer tissue [89,90,91]. Similar findings were reported in litchi fruits pretreated with ultrasound or osmotic dehydration, which enhanced the fruit firmness after 90 days in frozen storage [92]. Similarly, moisture content was reduced and firmness increased in kiwifruit samples when ultrasonic treatment was extended from 20 to 40 min [93].
In the present study, the fruit moisture content was increased in untreated (Table 7, Trials 1–3) and ultrasound-pretreated date fruits (Table 7, Trials 4, and 5), which was significantly decreased in Trial 6 (Table 7). In Trial 6, the USP-Temp and USP-Time were lower, whereas the ART-Temp and ART-RH were higher than in Trial 4 and 5, which could be why the moisture declined. When the temperature increases, the value of the equilibrium moisture content decreases. The water molecules become activated due to the temperature rise, separating from the water-binding sites [94]. The moisture content of ultrasound-assisted osmotic dehydration-treated strawberries declined with the increase in drying time [95]. The concentration gradient that favors the mass transfer of water from the liquid medium to the fruit, as well as the mass transfer of solids from the fruit to the liquid medium, may be the cause of the increase in fruits’ moisture content that has been subjected to ultrasonic treatment [96,97,98].
Fruits pretreated with ultrasonic waves presented a significant loss of sugars when the process was carried out using distilled water as the liquid medium (Table 7, Trials 4–6). This decrease in sugar content showed that the ultrasound pretreatment could remove soluble solids from the fruits. It indicated that soluble solids from the fruit were lost in the liquid media during ultrasound pretreatment. This outcome was anticipated due to the gradient in soluble solid concentration between the liquid media and the fruit, which encourages the mass transfer of soluble solids from the fruit to the liquid medium [49]. This may be linked to the absorption effect observed in apple osmotic dehydration tests assisted by ultrasound [99]. Compared to the higher frequency, the ultrasonic pretreatment at a lower frequency level produced higher soluble solids transfer rates. They concluded that ultrasonic waves at higher frequencies appear to be partially absorbed in the liquid medium, affecting the degree of penetration into the sample. The ultrasound pretreatment process can produce dried fruits with low sugar content, which might be used to create foodstuffs with reduced calories. The application of ultrasound pretreatment increased the water diffusivity of the fruit in most cases. This phenomenon may occur because of the formation of micro-channels during the application of ultrasound. The increase in the effective water diffusivity at the air-drying stage makes the use of ultrasound an interesting technique that can be used complementarily to classical air-drying [100]. Similarly, when subjected to ultrasonic treatment, pineapple lost sugar content [96]. This indicates that ultrasonic pretreatment may be an intriguing process to produce dried fruits with low sugar content [101].
The results of the present study indicated that the ultrasound-pretreated date fruits had the minimum ripening time. Hawthorn fruits that were ultrasonically pretreated and then microwaved and dried in hot air had the shortest drying times [43]. Similar results were reported in raspberries where ultrasonic pretreatment reduced fruit drying time [102]. The shortest drying time was recorded in ultrasonically pretreated carrots regardless of the drying methods [103]. Ultrasonic pretreatment uses the cavitation process to apply a rapid and intense flow of sound waves to the surface of the food, generating microscopic channels in the samples by generating consecutive contractions and expansions [90]. Additionally, by extending the ultrasonic application, the channels widen and the product acquires a spongy texture, which facilitates the passage of water via the channels formed during the drying process [104]. Following an increase in temperature and the internal vapor pressure within the fruit sample, the water molecules inside the fruits become bipolar. Eventually, the fruit’s cellular texture swells, developing additional pores [105].
The energy consumption in this study was decreased by heat recovery through hot air recirculation and by using very short air ducts. The energy demand for artificial ripening treatments varied with the target RH and processing temperature. Energy consumption generally increases with drying time and air velocity and decreases with air temperature [37,38,61,64]. However, our study observed that lowering the temperature to 45 degrees Celsius led to higher energy consumption due to the increased time required to ripen the fruits. Energy consumption is considered a function of material properties and the configuration of operating parameters such as temperature, air velocity, power density, absolute pressure, crop energy requirement, and processing time [61]. Energy consumption could be decreased by routing exhaust air back to the input of the system’s heat source and reducing the ductwork distance between the heat source and the system [106]. Therefore, selecting the efficient processing treatments of temperature and RH in the treatment chamber is paramount to reducing the energy consumption of the artificial ripening systems, which would yield a minimal negative effect on the cost, treatment time, and quantitative and qualitative indexes of the product.

5. Conclusions

In this study, a sensor-based artificial system (S-BARS) was designed, and its performance was validated combined with ultrasound pretreatment as a promising approach for ripening date palm Biser fruits. The S-BARS control unit was constructed to allow continuous real-time recording and control of the process variables to conduct artificial ripening under controlled conditions. The processing variables, i.e., the artificial ripening temperature and relative humidity, using the designed S-BARS combined with ultrasound pretreatment variables, i.e., time and temperature, significantly affected the required time for fruit ripening, the percentage of ripened fruits, the percentage of damaged fruits, and the electrical energy consumption, indicating the necessity to establish the optimum ripening conditions for specific products and ultrasound applications. The quadratic predictive models predicted the optimum artificial ripening parameters based on the Response Surface Methodology. The findings indicated that the designed S-BARS efficiently controlled the temperature and relative humidity at the target setpoints. The applied ultrasound pretreatment improved the color and density of the artificially ripened date fruits, decreased the required time for fruit ripening, decreased the electrical energy consumption, decreased the percentage of damaged fruits, and increased the percentage of ripened fruits. The unripe date fruits pretreated by ultrasound with a frequency of 40 kHz, power of 110 W, and a treatment temperature of 32.49 °C for 32.03 min under 60 °C ripening temperature and 59.98% ripening RH achieved the best results for ripening parameters. This combination treatment was ripened date fruit with high-quality attributes such as fruit weight, density, color, firmness, TSS, pH, and sugars. The artificial ripening of date fruits (Khalas cv.) by the designed S-BARS combined with ultrasound pretreatment is considered an efficient approach for improving ripened fruit quality. However, since this study was only performed on one cultivar, the parameters identified may not be the same for other cultivars. Therefore, further research is needed to develop and optimize the suggested system combined with solar energy technology for the artificial ripening of different cultivars.

Author Contributions

Conceptualization, M.M. and N.K.A.; methodology, M.M.; system design and manufacturing, M.M.; software, M.M.; validation, M.M.; formal analysis, M.M.; investigation, M.M. and N.K.A.; data curation, M.M.; writing—original draft preparation, M.M. and N.K.A.; writing—review and editing, M.M. and N.K.A.; visualization, M.M.; project administration, M.M.; funding acquisition, M.M and N.K.A. All authors have read and agreed to the published version of the manuscript.

Funding

This work was supported by the Deanship of Scientific Research, Vice Presidency for Graduate Studies and Scientific Research, King Faisal University, Saudi Arabia [Grant No. GRANT1149].

Data Availability Statement

Not applicable.

Acknowledgments

The researchers are grateful to the Date Palm Research Center of Excellence, King Faisal University, Saudi Arabia, for its logistical assistance in providing the engineering labs for achieving the objectives of this project.

Conflicts of Interest

The authors declare no conflict of interest.

References

  1. Al-Khayri, J.M.; Jain, S.M.; Johnson, D.V. Date Palm Genetic Resources and Utilization: Volume 2: Asia and Europe; Al-Khayri, J.M., Jain, S.M., Johnson, D.V., Eds.; Springer: Dordrecht, The Netherlands, 2015; ISBN 9789401797078. [Google Scholar]
  2. Faostat-FAO Food and Agriculture Organization of the United Nations. Available online: https://www.fao.org/faostat/en/#data/QCL (accessed on 6 March 2022).
  3. Ali-Dinar, H.; Mohammed, M.; Munir, M. Effects of Pollination Interventions, Plant Age and Source on Hormonal Patterns and Fruit Set of Date Palm (Phoenix Dactylifera L.). Horticulturae 2021, 7, 427. [Google Scholar] [CrossRef]
  4. Ahmed Mohammed, M.E.; Refdan Alhajhoj, M.; Ali-Dinar, H.M.; Munir, M. Impact of a Novel Water-Saving Subsurface Irrigation System on Water Productivity, Photosynthetic Characteristics, Yield, and Fruit Quality of Date Palm under Arid Conditions. Agronomy 2020, 10, 1265. [Google Scholar] [CrossRef]
  5. Alnaim, M.A.; Mohamed, M.S.; Mohammed, M.; Munir, M. Effects of Automated Irrigation Systems and Water Regimes on Soil Properties, Water Productivity, Yield and Fruit Quality of Date Palm. Agriculture 2022, 12, 343. [Google Scholar] [CrossRef]
  6. Al-Shahib, W.; Marshall, R.J. The Fruit of the Date Palm: Its Possible Use as the Best Food for the Future? Int. J. Food Sci. Nutr. 2003, 54, 247–259. [Google Scholar] [CrossRef]
  7. Assirey, E.A.R. Nutritional Composition of Fruit of 10 Date Palm (Phoenix Dactylifera L.) Cultivars Grown in Saudi Arabia. J. Taibah Univ. Sci. 2015, 9, 75–79. [Google Scholar] [CrossRef] [Green Version]
  8. Hussain, M.I.; Farooq, M.; Syed, Q.A. Nutritional and Biological Characteristics of the Date Palm Fruit (Phoenix Dactylifera L.)—A Review. Food Biosci. 2020, 34, 100509. [Google Scholar] [CrossRef]
  9. John, P.; Marchal, J. Ripening and Biochemistry of the Fruit. In Bananas and Plantains; Springer: Dordrecht, The Netherlands, 1995; pp. 434–467. [Google Scholar]
  10. Al-Mazroui, H.S.; Zaid, A.; Bouhouche, N. Morphological Abnormalities in Tissue Culture-Derived Date Palm (Phoenix Dactylifera L.). In Proceedings of the Acta Horticulturae, Santa Barbara, CA, USA, 31 August 2007; Volume 736, pp. 329–335. [Google Scholar]
  11. Prasanna, V.; Prabha, T.N.; Tharanathan, R.N. Fruit Ripening Phenomena-an Overview. Crit. Rev. Food Sci. Nutr. 2007, 47, 1–19. [Google Scholar] [CrossRef]
  12. Barry, C.S.; Giovannoni, J.J. Ethylene and Fruit Ripening. J. Plant Growth Regul. 2007, 26, 143–159. [Google Scholar] [CrossRef]
  13. Pech, J.C.; Purgatto, E.; Bouzayen, M.; Latché, A. Ethylene and Fruit Ripening. Plant Horm. Ethyl. 2012, 44, 275–304. [Google Scholar] [CrossRef]
  14. Marondedze, C.; Gehring, C.; Thomas, L. Dynamic Changes in the Date Palm Fruit Proteome during Development and Ripening. Hortic. Res. 2014, 1, 14039. [Google Scholar] [CrossRef]
  15. Sarraf, M.; Jemni, M.; Kahramanoğlu, I.; Artés, F.; Shahkoomahally, S.; Namsi, A.; Ihtisham, M.; Brestic, M.; Mohammadi, M.; Rastogi, A. Commercial Techniques for Preserving Date Palm (Phoenix Dactylifera) Fruit Quality and Safety: A Review. Saudi J. Biol. Sci. 2021, 28, 4408–4420. [Google Scholar] [CrossRef] [PubMed]
  16. Salomón-Torres, R.; Krueger, R.; García-Vázquez, J.P.; Villa-Angulo, R.; Villa-Angulo, C.; Ortiz-Uribe, N.; Sol-Uribe, J.A.; Samaniego-Sandoval, L. Date Palm Pollen: Features, Production, Extraction and Pollination Methods. Agronomy 2021, 11, 504. [Google Scholar] [CrossRef]
  17. Chao, C.C.T.; Krueger, R.R. The Date Palm (Phoenix Dactylifera L.): Overview of Biology, Uses, and Cultivation. HortScience 2007, 42, 1077–1082. [Google Scholar] [CrossRef] [Green Version]
  18. Mohammed, M.; Sallam, A.; Munir, M.; Ali-Dinar, H. Effects of Deficit Irrigation Scheduling on Water Use, Gas Exchange, Yield, and Fruit Quality of Date Palm. Agronomy 2021, 11, 2256. [Google Scholar] [CrossRef]
  19. Cawthon, D.L.; Morris, J.R. Relationship of Seed Number and Maturity to Berry Development, Fruit Maturation, Hormonal Changes, and Uneven Ripening of ‘Concord’ (Vitis Labrusca L.) Grapes1. J. Am. Soc. Hortic. Sci. 1982, 107, 1097–1104. [Google Scholar] [CrossRef]
  20. Mohammed, M.; Sallam, A.; Alqahtani, N.; Munir, M. The Combined Effects of Precision-Controlled Temperature and Relative Humidity on Artificial Ripening and Quality of Date Fruit. Foods 2021, 10, 2636. [Google Scholar] [CrossRef]
  21. Chawla, R.; Sheokand, A.; Rai, M.R.; Kumar, R. Impact of Climate Change on Fruit Production and Various Approaches to Mitigate These Impacts. Trop. Fruits 2021, 10, 564–571. [Google Scholar]
  22. Felzer, B.S.; Cronin, T.; Reilly, J.M.; Melillo, J.M.; Wang, X. Impacts of Ozone on Trees and Crops. Comptes Rendus Geosci. 2007, 339, 784–798. [Google Scholar] [CrossRef] [Green Version]
  23. Lloyd, J.; Farquhar, G.D. Effects of Rising Temperatures and [CO2] on the Physiology of Tropical Forest Trees. Philos. Trans. R. Soc. B Biol. Sci. 2008, 363, 1811–1817. [Google Scholar] [CrossRef] [Green Version]
  24. Moretti, C.L.; Mattos, L.M.; Calbo, A.G.; Sargent, S.A. Climate Changes and Potential Impacts on Postharvest Quality of Fruit and Vegetable Crops: A Review. Food Res. Int. 2010, 43, 1824–1832. [Google Scholar] [CrossRef]
  25. Martínez-Lüscher, J.; Morales, F.; Sánchez-Díaz, M.; Delrot, S.; Aguirreolea, J.; Gomès, E.; Pascual, I. Climate Change Conditions (Elevated CO2 and Temperature) and UV-B Radiation Affect Grapevine (Vitis Vinifera Cv. Tempranillo) Leaf Carbon Assimilation, Altering Fruit Ripening Rates. Plant Sci. 2015, 236, 168–176. [Google Scholar] [CrossRef] [PubMed]
  26. van Leeuwen, C.; Philippe, D. The Impact of Climate Change on Viticulture and Wine Quality. J. Wine Econ. 2016, 11, 150–167. [Google Scholar] [CrossRef] [Green Version]
  27. Mattos, L.M.; Moretti, C.L.; Jan, S.; Sargent, S.A.; Lima, C.E.P.; Fontenelle, M.R. Climate Changes and Potential Impacts on Quality of Fruit and Vegetable Crops. In Emerging Technologies and Management of Crop Stress Tolerance; Parvaiz, A., Saiema, R., Eds.; Academic Press: Cambridge, UK; Elsevier: Amsterdam, The Netherlands, 2014; Volume 1, pp. 467–486. ISBN 9780128010884. [Google Scholar]
  28. Subedi, S. Climate Change Effects of Nepalese Fruit Production. Adv. Plants Agric. Res. 2019, 9, 141–145. [Google Scholar]
  29. Vati, L.; Ghatak, A. Phytopathosystm Modification in Response to Climate Change, Climate Dynamics in Horticultural Science. In Impact, Adaptation and Mitigation; Apple Academic Press: New York, NY, USA, 2015. [Google Scholar]
  30. Nath, V.; Kumar, G.; Pandey, S.D.; Pandey, S. Impact of Climate Change on Tropical Fruit Production Systems and Its Mitigation Strategies. In Climate Change and Agriculture in India: Impact and Adaptation; Springer International Publishing: Cham, Switzerland, 2019; pp. 129–146. [Google Scholar]
  31. Saleem, S.A.; Baloch, A.K.; Baloch, M.K.; Baloch, W.A.; Ghaffoor, A. Accelerated Ripening of Dhakki Dates by Artificial Means: Ripening by Acetic Acid and Sodium Chloride. J. Food Eng. 2005, 70, 61–66. [Google Scholar] [CrossRef]
  32. Saleem, S.A.; Saddozai, A.A.; Asif, M.; Baloch, A.K. Impact of Artificial Ripening to Improve Quality and Yield for the Export of “Dhakki” Dates. Acta Hortic. 2010, 882, 1125–1134. [Google Scholar] [CrossRef]
  33. Yektankhodaei, M.; Bagheri, A.; Mohamadpour, I.; Karami, Y.A. Artificial Ripening of Khuneizi Date Using Physical and Chemical Methods. Acta Hortic. 2007, 736, 87–93. [Google Scholar] [CrossRef]
  34. Baloch, A.K.; Saleem, S.A.; Dar, N.G.; Baloch, W.A.; Baloch, M.K. Influence of Microwave Radiation on Ripening of Dhakki Dates. J. Food Process. Preserv. 2003, 27, 181–193. [Google Scholar] [CrossRef]
  35. Haider, M.S.; Rauf, M.; Saleem, N.; Jamil, K.; Mukhtar, O. Studies on Ripening of Dates from Rutab Stage to Ripe Dehydrated Dates. J. Biochem. Mol. Biol. 2012, 45, 31–34. [Google Scholar]
  36. Mohammed, M.E.A.; Eissa, A.H.A.; Aleid, S.M. Application of Pulsed Electric Field for Microorganisms Inactivation in Date Palm Fruits. J. Food Nutr. Res. 2016, 4, 646–652. [Google Scholar]
  37. Mohammed, M.E.A.; El-Shafie, H.A.; Sallam, A.A.A. A Solar-Powered Heat System for Management of Almond Moth, Cadra Cautella (Lepidoptera: Pyralidae) in Stored Dates. Postharvest Biol. Technol. 2019, 154, 121–128. [Google Scholar] [CrossRef]
  38. Mohammed, M.E.A.; El-Shafie, H.A.F.; Alhajhoj, M.R. Design and Efficacy Evaluation of a Modern Automated Controlled Atmosphere System for Pest Management in Stored Dates. J. Stored Prod. Res. 2020, 89, 101719. [Google Scholar] [CrossRef]
  39. Barreveld, W.H. Date Palm Products; Food and Agriculture Organization of the United Nations: Rome, Italy, 1993; Volume 101, ISBN 92-5-193251-3. [Google Scholar]
  40. Deng, L.Z.; Mujumdar, A.S.; Zhang, Q.; Yang, X.H.; Wang, J.; Zheng, Z.A.; Gao, Z.J.; Xiao, H.W. Chemical and Physical Pretreatments of Fruits and Vegetables: Effects on Drying Characteristics and Quality Attributes–A Comprehensive Review. Crit. Rev. Food Sci. Nutr. 2019, 59, 1408–1432. [Google Scholar] [CrossRef] [PubMed]
  41. Khiari, R.; Zemni, H.; Mihoubi, D. Raisin Processing: Physicochemical, Nutritional and Microbiological Quality Characteristics as Affected by Drying Process. Food Rev. Int. 2019, 35, 246–298. [Google Scholar] [CrossRef]
  42. Jayaraman, K.S.; Gupta, D.D. Handbook of Industrial Drying; Mujumdar, A.S., Ed.; CRC Press: Boca Raton, FL, USA, 2020; ISBN 9780429289774. [Google Scholar]
  43. Abbaspour-Gilandeh, Y.; Kaveh, M.; Fatemi, H.; Aziz, M. Combined Hot Air, Microwave, and Infrared Drying of Hawthorn Fruit: Effects of Ultrasonic Pretreatment on Drying Time, Energy, Qualitative, and Bioactive Compounds’ Properties. Foods 2021, 10, 1006. [Google Scholar] [CrossRef] [PubMed]
  44. Titikshya, S.; Sahoo, M.; Kumar, V.; Naik, S.N. Microbial Inactivation with Heat Treatments. In Thermal Food Engineering Operations; Kumar, N., Anil Panghal, M.K.G., Eds.; Wiley: Hoboken, NJ, USA, 2022; pp. 45–74. ISBN 9781119776437. [Google Scholar]
  45. Wang, C.Y. Effect of Moist Hot Air Treatment on Some Postharvest Quality Attributes of Strawberries. J. Food Qual. 2000, 23, 51–59. [Google Scholar] [CrossRef] [Green Version]
  46. Suresh Kumar, P.; Sagar, V.R. Recent Advances in Drying and Dehydration of Fruits and Vegetables: A Review. J. Food Sci. Technol. 2010, 47, 15–26. [Google Scholar]
  47. Kong, C.H.Z.; Hamid, N.; Liu, T.; Sarojini, V. Effect of Antifreeze Peptide Pretreatment on Ice Crystal Size, Drip Loss, Texture, and Volatile Compounds of Frozen Carrots. J. Agric. Food Chem. 2016, 64, 4327–4335. [Google Scholar] [CrossRef]
  48. Xu, X.; Zhang, L.; Feng, Y.; ElGasim, A.; Yagoub, A.; Sun, Y.; Ma, H.; Zhou, C. Vacuum Pulsation Drying of Okra (Abelmoschus Esculentus L. Moench): Better Retention of the Quality Characteristics by Flat Sweep Frequency and Pulsed Ultrasound Pretreatment. Food Chem. 2020, 326, 127026. [Google Scholar] [CrossRef]
  49. Fernandes, F.; Rodrigues, S. Ultrasound Applications in Fruit Processing. In New Food Engineering Research Trends; Nova Science Publishers: New York, NY, USA, 2012; pp. 51–86. ISBN 6312317269. [Google Scholar]
  50. Mohammed, M.E.A.; Alhajhoj, M.R. Importance and Applications of Ultrasonic Technology to Improve Food Quality. In Food Processing; Marc, R.A., Díaz, A.V., Izquierdo, G.D.P., Eds.; IntechOpen: Rijeka, Croatia, 2020. [Google Scholar]
  51. Song, X.; Capanoglu, E.; Simal-Gandara, J.; Chen, F.; Xiao, J. Different Food Processing Technologies: A General Background. In Retention of Bioactives in Food Processing; Jafari, S.M., Capanoglu, E., Eds.; Springer International Publishing: Cham, Switzerland, 2022; pp. 37–89. ISBN 978-3-030-96885-4. [Google Scholar]
  52. Ramaswamy, S.; Lindsay, J.D.; Holmf, R.A.; Holm, R.A.; Ryan, M.; Zhang, J.J.; Ramaswamy, S.; Tiwari, G.; Wang, S.; Tang, J.; et al. Application of Ultrasound Technology in the Drying of Food Products. Ultrason. Sonochem. 2020, 25, 104950. [Google Scholar]
  53. Körzendörfer, A. Vibrations and Ultrasound in Food Processing—Sources of Vibrations, Adverse Effects, and Beneficial Applications—An Overview. J. Food Eng. 2022, 324, 110875. [Google Scholar] [CrossRef]
  54. Gong, Y.; Li, J.; Li, J.; Fan, L.; Wang, L. Effect of Ultrasound-Assisted Freeze-Dried on Microstructure, Bioactive Substances, and Antioxidant Activity of Flos Sophorae Immaturus. Food Biosci. 2022, 49, 101913. [Google Scholar] [CrossRef]
  55. Ren, Z.; Bai, Y. Ultrasound Pretreatment of Apple Slice Prior to Vacuum Freeze Drying. In Proceedings of the 2nd International Conference on Material Science, Energy and Environmental Engineering (MSEEE 2018), Xi’an, China, 16–17 August 2018; Atlantis Press: Paris, France, 2018; pp. 112–117. [Google Scholar]
  56. Fernandes, F.A.N.; Rodrigues, S. Dehydration of Sapota (Achras Sapota L.) Using Ultrasound as Pretreatment. Dry. Technol. 2008, 26, 1232–1237. [Google Scholar] [CrossRef]
  57. Xu, B.; Chen, J.; Sylvain Tiliwa, E.; Yan, W.; Roknul Azam, S.M.; Yuan, J.; Wei, B.; Zhou, C.; Ma, H. Effect of Multi-Mode Dual-Frequency Ultrasound Pretreatment on the Vacuum Freeze-Drying Process and Quality Attributes of the Strawberry Slices. Ultrason. Sonochem. 2021, 78, 105714. [Google Scholar] [CrossRef] [PubMed]
  58. Jahanbakhshi, A.; Yeganeh, R.; Momeny, M. Influence of Ultrasound Pre-Treatment and Temperature on the Quality and Thermodynamic Properties in the Drying Process of Nectarine Slices in a Hot Air Dryer. J. Food Process. Preserv. 2020, 44, e14818. [Google Scholar] [CrossRef]
  59. Taghinezhad, E.; Kaveh, M.; Khalife, E.; Chen, G. Drying of Organic Blackberry in Combined Hot Air-Infrared Dryer with Ultrasound Pretreatment. Dry. Technol. 2021, 39, 2075–2091. [Google Scholar] [CrossRef]
  60. Magalhães, M.L.; Cartaxo, S.J.M.; Gallão, M.I.; García-Pérez, J.V.; Cárcel, J.A.; Rodrigues, S.; Fernandes, F.A.N. Drying Intensification Combining Ultrasound Pre-Treatment and Ultrasound-Assisted Air Drying. J. Food Eng. 2017, 215, 72–77. [Google Scholar] [CrossRef]
  61. Nwakuba, N.R.; Asoegwu, S.N.; Nwaigwe, K.N. Energy Consumption of Agricultural Dryers: An Overview. Agric. Eng. Int. CIGR J. 2016, 18, 119–132. [Google Scholar]
  62. Kemp, I.C. Modern Drying Technology: Energy Savings. Energy Sav. 2012, 4, 1–45. [Google Scholar]
  63. Mohammed, M.; El-Shafie, H.; Alqahtani, N. Design and Validation of Computerized Flight-Testing Systems with Controlled Atmosphere for Studying Flight Behavior of Red Palm Weevil, Rhynchophorus Ferrugineus (Olivier). Sensors 2021, 21, 2112. [Google Scholar] [CrossRef]
  64. Mohammed, M.; Alqahtani, N.; El-Shafie, H. Development and Evaluation of an Ultrasonic Humidifier to Control Humidity in a Cold Storage Room for Postharvest Quality Management of Dates. Foods 2021, 10, 949. [Google Scholar] [CrossRef]
  65. Chemat, F.; Zill-E-Huma; Khan, M.K. Applications of Ultrasound in Food Technology: Processing, Preservation and Extraction. Ultrason. Sonochem. 2011, 18, 813–835. [Google Scholar] [CrossRef] [PubMed]
  66. Mohammed, M.; Riad, K.; Alqahtani, N. Design of a Smart IoT-Based Control System for Remotely Managing Cold Storage Facilities. Sensors 2022, 22, 4680. [Google Scholar] [CrossRef] [PubMed]
  67. Mohammed, M.; Riad, K.; Alqahtani, N. Efficient Iot-Based Control for a Smart Subsurface Irrigation System to Enhance Irrigation Management of Date Palm. Sensors 2021, 21, 3942. [Google Scholar] [CrossRef] [PubMed]
  68. Mohammed, M.; Munir, M.; Aljabr, A. Prediction of Date Fruit Quality Attributes during Cold Storage Based on Their Electrical Properties Using Artificial Neural Networks Models. Foods 2022, 11, 1666. [Google Scholar] [CrossRef]
  69. Fernandes, F.A.N.; Rodrigues, S. Application of Ultrasound and Ultrasound-Assisted Osmotic Dehydration in Drying of Fruits. Dry. Technol. 2008, 26, 1509–1516. [Google Scholar] [CrossRef]
  70. Fernandes, F.A.N.; Gallão, M.I.; Rodrigues, S. Effect of Osmotic Dehydration and Ultrasound Pre-Treatment on Cell Structure: Melon Dehydration. Lwt 2008, 41, 604–610. [Google Scholar] [CrossRef]
  71. Concha-Meyer, A.; Eifert, J.; Wang, H.; Sanglay, G. Volume Estimation of Strawberries, Mushrooms, and Tomatoes with a Machine Vision System. Int. J. Food Prop. 2018, 21, 1867–1874. [Google Scholar] [CrossRef]
  72. Lee, H.S. Principles and Experimental Techniques of Plant Physiology and Biochemistry; Higher Education Press: Beijing, China, 2000; ISBN 10: 7040080761. [Google Scholar]
  73. Cárcel, J.A.; García-Pérez, J.V.; Benedito, J.; Mulet, A. Food Process Innovation through New Technologies: Use of Ultrasound. J. Food Eng. 2012, 110, 200–207. [Google Scholar] [CrossRef]
  74. Bal, E. Effects of Exogenous Polyamine and Ultrasound Treatment to Improve Peach Storability. Chil. J. Agric. Res. 2013, 73, 435–440. [Google Scholar] [CrossRef] [Green Version]
  75. Dore, A.; Molinu, M.G.; Pani, G.; Ladu, G.; Venditti, T.; D’Hallewin, G. Ultrasound Application for the Control of Decay on Apple at Different Stage of Ripening. Commun. Agric. Appl. Biol. Sci. 2012, 77, 503–507. [Google Scholar]
  76. de São José, J.F.B.; de Andrade, N.J.; Ramos, A.M.; Vanetti, M.C.D.; Stringheta, P.C.; Chaves, J.B.P. Decontamination by Ultrasound Application in Fresh Fruits and Vegetables. Food Control 2014, 45, 36–50. [Google Scholar] [CrossRef]
  77. Gallo, M.; Ferrara, L.; Naviglio, D. Application of Ultrasound in Food Science and Technology: A Perspective. Foods 2018, 7, 164. [Google Scholar] [CrossRef] [PubMed] [Green Version]
  78. Maryam, A.; Anwar, R.; Malik, A.U.; Raheem, M.I.U.; Khan, A.S.; Hasan, M.U.; Hussain, Z.; Siddique, Z. Combined Aqueous Ozone and Ultrasound Application Inhibits Microbial Spoilage, Reduces Pesticide Residues and Maintains Storage Quality of Strawberry Fruits. J. Food Meas. Charact. 2021, 15, 1437–1451. [Google Scholar] [CrossRef]
  79. Moreira Azoubel, P.; do Amparo Melo Baima, M.; da Rocha Amorim, R.; Belém Oliveira, S.S. Effect of Ultrasound on Banana Cv Pacovan Drying Kinetics. J. Food Eng. 2010, 97, 194–198. [Google Scholar] [CrossRef]
  80. Chen, Q.; Bi, J.; Wu, X.; Yi, J.; Zhou, L.; Zhou, Y. Drying Kinetics and Quality Attributes of Jujube (Zizyphus Jujuba Miller) Slices Dried by Hot-Air and Short- and Medium-Wave Infrared Radiation. LWT Food Sci. Technol. 2015, 64, 759–766. [Google Scholar] [CrossRef]
  81. Feng, Y.; Xu, B.; ElGasim, A.; Yagoub, A.; Ma, H.; Sun, Y.; Xu, X.; Yu, X.; Zhou, C. Role of Drying Techniques on Physical, Rehydration, Flavor, Bioactive Compounds and Antioxidant Characteristics of Garlic. Food Chem. 2021, 343, 128404. [Google Scholar] [CrossRef]
  82. Xu, Y.; Xiao, Y.; Lagnika, C.; Song, J.; Li, D.; Liu, C.; Jiang, N.; Zhang, M.; Duan, X. A Comparative Study of Drying Methods on Physical Characteristics, Nutritional Properties and Antioxidant Capacity of Broccoli. Dry. Technol. 2020, 38, 1378–1388. [Google Scholar] [CrossRef]
  83. Nowak, K.W.; Zielinska, M.; Waszkielis, K.M. The Effect of Ultrasound and Freezing/Thawing Treatment on the Physical Properties of Blueberries. Food Sci. Biotechnol. 2019, 28, 741–749. [Google Scholar] [CrossRef] [Green Version]
  84. Sakurai, N. Physical Properties of Fruit Firmness and Chemical Structure of Cell Walls during Fruit Softening. In Physical Methods in Agriculture; Springer: Boston, MA, USA, 2002; pp. 311–341. [Google Scholar]
  85. Fuchigami, M. Relationship Between Pectic Compositions and the Softening of the Texture of Japanese Radish Roots During Cooking. J. Food Sci. 1987, 52, 1317–1320. [Google Scholar] [CrossRef]
  86. Li, L.; Zhao, W.; Feng, X.; Chen, L.; Zhang, L.; Zhao, L. Changes in Fruit Firmness, Cell Wall Composition, and Transcriptional Profile in the Yellow Fruit Tomato 1 (Yft1) Mutant. J. Agric. Food Chem. 2019, 67, 463–472. [Google Scholar] [CrossRef]
  87. Waldron, K.W.; Parker, M.L.; Smith, A.C. Plant Cell Walls and Food Quality. Compr. Rev. Food Sci. Food Saf. 2003, 2, 128–146. [Google Scholar] [CrossRef] [PubMed]
  88. Terefe, N.S.; Sikes, A.L.; Juliano, P. Ultrasound for Structural Modification of Food Products. In Innovative Food Processing Technologies; Woodhead Publishing: Sawston, UK, 2016; pp. 209–230. ISBN 9780081002988. [Google Scholar]
  89. Terefe, N.S.; Gamage, M.; Vilkhu, K.; Simons, L.; Mawson, R.; Versteeg, C. The Kinetics of Inactivation of Pectin Methylesterase and Polygalacturonase in Tomato Juice by Thermosonication. Food Chem. 2009, 117, 20–27. [Google Scholar] [CrossRef]
  90. Terefe, N.S.; Buckow, R.; Versteeg, C. Quality-Related Enzymes in Fruit and Vegetable Products: Effects of Novel Food Processing Technologies, Part 1: High-Pressure Processing. Crit. Rev. Food Sci. Nutr. 2014, 54, 24–63. [Google Scholar] [CrossRef] [PubMed]
  91. Shiferaw Terefe, N.; Buckow, R.; Versteeg, C. Quality-Related Enzymes in Plant-Based Products: Effects of Novel Food-Processing Technologies Part 3: Ultrasonic Processing. Crit. Rev. Food Sci. Nutr. 2015, 55, 147–158. [Google Scholar] [CrossRef] [PubMed]
  92. Fong-in, S.; Nimitkeatkai, H.; Prommajak, T.; Nowacka, M. Ultrasound-Assisted Osmotic Dehydration of Litchi: Effect of Pretreatment on Mass Transfer and Quality Attributes during Frozen Storage. J. Food Meas. Charact. 2021, 15, 3590–3597. [Google Scholar] [CrossRef]
  93. Roueita, G.; Hojjati, M.; Noshad, M. Study of Physicochemical Properties of Dried Kiwifruits Using the Natural Hypertonic Solution in Ultrasound-Assisted Osmotic Dehydration as Pretreatment. Int. J. Fruit Sci. 2020, 20, S491–S507. [Google Scholar] [CrossRef]
  94. Noshad, M.; Mohebbi, M.; Shahidi, F.; Mortazavi, S.A. Effect of Osmosis and Ultrasound Pretreatment on the Moisture Adsorption Isotherms of Quince. Food Bioprod. Process. 2012, 90, 266–274. [Google Scholar] [CrossRef]
  95. Garcia-Noguera, J.; Oliveira, F.I.P.; Gallão, M.I.; Weller, C.L.; Rodrigues, S.; Fernandes, F.A.N. Ultrasound-Assisted Osmotic Dehydration of Strawberries: Effect of Pretreatment Time and Ultrasonic Frequency. Dry. Technol. 2010, 28, 294–303. [Google Scholar] [CrossRef]
  96. Fernandes, F.A.N.; Linhares, F.E.; Rodrigues, S. Ultrasound as Pre-Treatment for Drying of Pineapple. Ultrason. Sonochem. 2008, 15, 1049–1054. [Google Scholar] [CrossRef]
  97. Phisut, N. Factors Affecting Mass Transfer during Osmotic Dehydration of Fruits. Int. Food Res. J. 2012, 19, 7–18. [Google Scholar]
  98. Dias da Silva, G.; Barros, Z.M.P.; de Medeiros, R.A.B.; de Carvalho, C.B.O.; Rupert Brandão, S.C.; Azoubel, P.M. Pretreatments for Melon Drying Implementing Ultrasound and Vacuum. LWT 2016, 74, 114–119. [Google Scholar] [CrossRef]
  99. Cárcel, J.A.; Benedito, J.; Rosselló, C.; Mulet, A. Influence of Ultrasound Intensity on Mass Transfer in Apple Immersed in a Sucrose Solution. J. Food Eng. 2007, 78, 472–479. [Google Scholar] [CrossRef]
  100. Fernandes, F.A.N.; Rodrigues, S. Ultrasound Application as Pre-Treatment for Drying of Fruits. J. Food Eng. 2007, 82, 261–267. [Google Scholar] [CrossRef]
  101. Mothibe, K.J.; Zhang, M.; Nsor-Atindana, J.; Wang, Y.C. Use of Ultrasound Pretreatment in Drying of Fruits: Drying Rates, Quality Attributes, and Shelf Life Extension. Dry. Technol. 2011, 29, 1611–1621. [Google Scholar] [CrossRef]
  102. Mierzwa, D.; Szadzińska, J.; Pawłowski, A.; Pashminehazar, R.; Kharaghani, A. Nonstationary Convective Drying of Raspberries, Assisted by Microwaves and Ultrasound. Dry. Technol. 2019, 37, 988–1001. [Google Scholar] [CrossRef]
  103. Abbaspour-Gilandeh, Y.; Kaveh, M.; Aziz, M. Ultrasonic-Microwave and Infrared Assisted Convective Drying of Carrot: Drying Kinetic, Quality and Energy Consumption. Appl. Sci. 2020, 10, 6309. [Google Scholar] [CrossRef]
  104. Nowacka, M.; Wiktor, A.; Anuszewska, A.; Dadan, M.; Rybak, K.; Witrowa-Rajchert, D. The Application of Unconventional Technologies as Pulsed Electric Field, Ultrasound and Microwave-Vacuum Drying in the Production of Dried Cranberry Snacks. Ultrason. Sonochem. 2019, 56, 1–13. [Google Scholar] [CrossRef]
  105. Wen, A.; Xie, C.; Mazhar, M.; Zhu, Y.; Zeng, H.; Qin, L.; Zhu, Y. Comparative Evaluation of Drying Methods on Kinetics, Biocompounds and Antioxidant Activity of Bacillus Subtilis -Fermented Dehulled Adlay. Dry. Technol. 2020, 38, 1505–1515. [Google Scholar] [CrossRef]
  106. Singh, R.P.; Heldman, D.R. Introduction to Food Engineering: Fifth Edition. In Introduction to Food Engineering, 5th ed.; Gulf Professional Publishing: Houston, TX, USA, 2014; pp. 1–861. ISBN 9780123985309. [Google Scholar]
Figure 1. The elevation and side view of the sensor-based artificial ripening system’s main components, all dimensions in centimeters.
Agronomy 12 02805 g001
Figure 2. An overview of the real-time data acquisition method of temperature and RH inside the treatment chambers of the developed systems and weight loss during treatment using the sensors (DHT22 and Load Cell with amplifier HX711), Arduino Uno (ATmega328P), and Excel (PLX-DAQ Excel Macro).
Agronomy 12 02805 g002
Figure 3. The schematic Proteus circuit diagram shows the major components of the sensor-based S-BARS control and monitoring. RL1, RL2, and RL3 are the relays for controlling the operation of the heating unit, the ultrasonic humidifier, and main power, U1, U2, and U3 are the optocouplers, R1, R2, R3, R4, R5, and R6 are the resistors, GEN1 is the Arduino Mega microcontroller with GENUINO MEGA 2560 Microchip, LC1 is the Load Cell sensor, U5 is the HX711 signal amplifier, LCD1 is the liquid crystal display, U6 is the PCF8574 8-bit input/output (I/O) expander, ACS is the 220 VAC power source, and DCS is the DC power source.
Agronomy 12 02805 g003
Figure 4. The control flowchart of the designed S-BARS. The Avg Temp (T) is the average temperature, the Avg RH is the average relative humidity, and the Avg Weight is the average weight of the fruit.
Agronomy 12 02805 g004
Figure 5. Screenshot of the program code used to acquire the temperature and RH measured data in real-time using six DHT22 sensors and send the measurements to a PLX-DAQ Spreadsheet.
Agronomy 12 02805 g005
Figure 6. Scatter plots of the predicted values versus the actual values of the artificial ripening time (A), percentage of ripe fruits (B), percentage of damaged fruits (C), and electrical energy consumption (D).
Agronomy 12 02805 g006
Figure 7. The perturbation plot displays the effect of ultrasound pretreatment time ((A): USP-Temp), ultrasound pretreatment temperature ((B): USP-Time), ripening treatment temperature ((C): ART-Temp), and ripening treatment RH ((D): ART-RH) factors on the required time for fruit ripening (RT) (RT) (Graph (A)), percentage of ripe fruit (PODF) (Graph (B)), percentage of damaged fruit (PODF) (Graph (C)), and electrical energy consumption (EEC) (Graph (D)).
Agronomy 12 02805 g007
Figure 8. 3D response surface plots representing the effect of A: USP-Temp (ultrasound pretreatment time) and B: USP-Time (ultrasound pretreatment temperature) (A), A: USP-Temp and C: ART-Temp (ripening treatment temperature) (B), A: USP-Temp and D: ART-RH (ripening treatment RH) (C), B: USP-Time and C: ART-Temp (D), B: USP-Temp and D: ART-RH (E), C: ART-Temp and D: ART-RH (F) on the required time for fruit ripening (RT).
Agronomy 12 02805 g008
Figure 9. 3D response surface plots representing the effect of A: USP-Temp (ultrasound pretreatment time) and B: USP-Time (ultrasound pretreatment temperature) (A), A: USP-Temp and C: ART-Temp (ripening treatment temperature) (B), A: USP-Temp and D: ART-RH (ripening treatment RH) (C), B: USP-Time and C: ART-Temp (D), B: USP-Temp and D: ART-RH (E), C: ART-Temp and D: ART-RH (F) on the percentage of ripe fruits (PORF).
Agronomy 12 02805 g009
Figure 10. 3D response surface plots representing the effect of A: USP-Temp (ultrasound pretreatment time) and B: USP-Time (ultrasound pretreatment temperature) (A), A: USP-Temp and C: ART-Temp (ripening treatment temperature) (B), A: USP-Temp and D: ART-RH (ripening treatment RH) (C), B: USP-Time and C: ART-Temp (D), B: USP-Temp and D: ART-RH (E), C: ART-Temp and D: ART-RH (F) on the percentage of ripe fruits (PORF).
Agronomy 12 02805 g010
Figure 11. 3D response surface plots representing the effect of A: USP-Temp (ultrasound pretreatment time) and B: USP-Time (ultrasound pretreatment temperature) (A), A: USP-Temp and C: ART-Temp (ripening treatment temperature) (B), A: USP-Temp and D: ART-RH (ripening treatment RH) (C), B: USP-Time and C: ART-Temp (D), B: USP-Temp and D: ART-RH (E), C: ART-Temp and D: ART-RH (F) on the electrical energy consumption (EEC).
Agronomy 12 02805 g011
Table 1. The levels and values of the independent variables applied in the response surface design for the experiments.
Independent VariablesLevels
−101
A: USP-Temp (°C)253545
B: USP-Time (min)203040
C: ART-Temp (°C)405060
D: ART-RH (%)304560
Table 2. Box–Behnken design (B-BD) matrix and experimental responses. Factors A, B, C, and D in the table represent ultrasound pretreatment time (min), ultrasound pretreatment temperature (°C), ripening treatment temperature (°C), and ripening treatment RH (%), respectively, and the responses R1, R2, R3, and R4 represents the required time for fruit ripening, percentage of ripened fruit, percentage of damaged fruit, and electrical energy consumption, respectively.
RunABCDR1R2R3R4
13520506073.788.92.645.217
23520503069.785.42.764.937
33530504566.892.64.24.769
44530506066.794.96.054.779
54530503062.791.35.384.499
63530606031.593.64.22.611
725304045108.690.33.36.586
82540504566.394.37.64.737
92530506070.792.43.65.017
104530404597.892.85.545.98
114530604527.392.55.712.299
123530504566.692.74.284.795
1335304060111.893.74.086.799
1435204045111.686.93.126.757
1535304030101.890.74.26.199
163520604534.386.52.522.807
174520504568.887.74.034.893
182520504572.385.22.45.11
193530603025.590.24.562.131
2035404045105.6968.166.457
212530503066.788.83.24.737
223540604528.395.79.482.388
232530604531.390.53.42.577
244540504562.896.812.774.548
253540503063.794.394.578
263540506067.798.29.244.858
Table 3. The evaluation criteria, i.e., standard deviation (STDEV), Mean, coefficient of variation percentage (C.V. %), coefficient of determination (R2), adjusted R2, predicted R2, and Adeq Precision criteria for the selected quadratic models for the required time for fruit ripening (RT), the percentage of ripened fruit (PORF), the percentage of damaged fruits (PODF), and the electrical energy consumption (EEC) responses displays.
CriteriaResponses
RTPORFPODFEEC
STDEV1.680.150.4140.105
Mean67.6991.695.174.66
C.V. %2.480.1638.012.26
R20.9980.9990.9880.997
Adjusted R20.9960.9980.9750.994
Predicted R20.9890.9950.9330.985
Adeq Precision66.51114.3131.256.3
Table 4. Constraints for optimizing ripening time (RT), percentage of ripe fruit (PODF), percentage of damaged fruit (PODF), and electrical energy consumption (EEC) under three criteria.
ConditionsCriterion: 1Criterion: 2Criterion: 3Lower LimitUpper LimitLower WeightUpper WeightImportance
A: USP-TempMinimizeIn rangeIn range2545113
B: USP-TimeMinimizeIn rangeIn range2040113
C: ART-TempMinimizeMinimizeIn range4060113
D: ART-RHMaximizeIn rangeIn range4050113
RTMinimizeMinimizeMinimize25.5111.8113
PORFMaximizeMaximizeMaximize85.298.2113
PODFMinimizeMinimizeMinimize2.412.8113
EECMinimizeMinimizeMinimize2.16.8113
Table 5. The best solutions for satisfying the optimization criteria for USP-Temp, USP-Time, ART-Temp, ART-RH, RT, PORF, PODF, and EEC.
CriteriaUSP-Temp
(°C)
USP-Time
(min)
ART-Temp
(°C)
ART-RH
(%)
RT
(h)
PORF
(%)
PODF
(%)
EEC
(kWh/kg)
Desirability
Criterion: 134.1129.0153.4355.0155.9893.113.794.200.71
Criterion: 235.3432.2153.0950.0355.2694.165.134.140.58
Criterion: 332.4932.0360.0059.9830.8794.384.662.580.82
Table 6. The results of the validation experiments compared with the predicted values under the optimization criteria. STDEV, n, RMSE, and MAPE represent the standard deviation, the number of measurements, root mean square error, and mean absolute percentage error, respectively.
ParameterCriteriaPredictedActual ± STDEVnRMSEMAPE (%)
RT (h)Criterion: 155.8955.01 ± 2.1531.962.58
Criterion: 255.2654.82 ± 1.0130.941.15
Criterion: 330.8731.29 ± 1.1831.152.95
PORF (%)Criterion: 193.1192.37 ± 0.9730.890.74
Criterion: 294.1693.08 ± 2.2532.132.18
Criterion: 394.3893.62 ± 2.3732.082.17
PODF (%)Criterion: 13.793.76 ± 0.4230.358.44
Criterion: 25.135.31 ± 0.1730.223.57
Criterion: 34.664.59 ± 0.5530.4569.59
EEC (kWh/kg)Criterion: 14.204.42 ± 0.6930.6110.61
Criterion: 24.144.99 ± 0.1230.8620.61
Criterion: 32.582.53 ± 0.1630.1434.39
Table 7. Physicochemical properties of artificially ripened date fruits under different trial conditions compared to naturally ripe dates (Control).
PropertiesControlTrial: 1Trial: 2Trial: 3Trial: 4Trial: 5Trial: 6
FL (mm)34.36 ± 0.6 A34.37 ± 2.0 A33.63 ± 1.4 A34.43 ± 2.4 A35.17 ± 0.9 A35.57 ± 0.6 A35.1 ± 4.4 A
FD (mm)21.03 ± 1.3 A21.1 ± 1.0 A21.7 ± 0.2 A21.93 ± 1.9 A21.43 ± 1.5 A21.93 ± 0.4 A20.83 ± 1.6 A
FW (g)8.75 ± 0.4 A7.8 ± 0.4 AB7.2 ± 0.9 B7.43 ± 0.3 B7.6 ± 0.3 B7.27 ± 1.1 B7.33 ± 0.3 B
De (g/cm3)0.93 ± 0.1 A0.81 ± 0.1 AB0.77 ± 0.1 B0.7 ± 0.1 B0.82 ± 0.1 AB0.78 ± 0.1 AB0.8 ± 0.1 AB
FF (N)11.21 ± 0.8 BC11.45 ± 0.5 BC12.75 ± 0.9 AB13.7 ± 0.9 A9.62 ± 1.2 C11.46 ± 1.1 BC12.6 ± 1.4 AB
L31.14 ± 1.2 AB34.7 ± 3.9 AB34.47 ± 6.1 AB27.53 ± 6.7 B39.7 ± 3.9 A39.47 ± 6.1 A32.53 ± 6.7 AB
a15.65 ± 4.5 A15.73 ± 4.9 A15.83 ± 2.7 A15.2 ± 4.4 A16.73 ± 4.9 A16.83 ± 2.7 A16.2 ± 4.4 A
b25.97 ± 1.5 BC31.17 ± 2.6 AB28.57 ± 2.5 AC25 ± 4.3 C33.17 ± 2.6 A30.57 ± 2.5 AC27 ± 4.3 BC
pH5.48 ± 0.1 A5.4 ± 0.1 A5.47 ± 0.1 A5.4 ± 0.1 A5.52 ± 0.1 A5.39 ± 0.2 A5.48 ± 0.1 A
MC (%)17.7 ± 1 AB18.6 ± 1.3 AB19.3 ± 0.6 A17.76 ± 1.2 AB18.36 ± 1.1 AB19.13 ± 0.6 AB17.267 ± 1.1 B
FC (%)26.3 ± 0.1 C27.53 ± 0.6 A27.5 ± 0.4 A27.97 ± 0.9 A24.93 ± 0.6 B26.17 ± 0.8 B26.1 ± 0.7 B
GC (%)27.67 ± 0.2 B–D29.07 ± 0.9 AB28.43 ± 0.2 A–C29.47 ± 0.3 A26.27 ± 0.8 D27.7 ± 1.5 B–D27.05 ± 0.8 CD
TSC (%)53.97 ± 0.1 DE56.47 ± 0.8 AB55.93 ± 0.5 BC57.43 ± 0.7 A54.97 ± 0.1 D55.47 ± 0.8 BC54.93 ± 0.5 CD
TSS (%)70.67 ± 5.8 A68.71 ± 1.4 A68.37 ± 0.8 A71.5 ± 0.7 A69.67 ± 5.8 A66.74 ± 0.5 A66.49 ± 0.2 A
The ART-Temp was 53.43, 53.09, and 60 °C and ART-RH was 55.01, 50.03, and 59.98% in Trials 1, 2, and 3, respectively, using untreated date fruits, and in Trials 4, 5, and 6, respectively, using pretreated date fruits via ultrasound. The means within each row with the same letter(s) are not significantly different (p ≤ 0.05).
Publisher’s Note: MDPI stays neutral with regard to jurisdictional claims in published maps and institutional affiliations.

